Embed Size (px)
Citation preview
1
India
FY2016 Ex-Post Evaluation of Japanese ODA Loan Project
“Maharashtra Transmission System Project”
External Evaluators: Akane Totani and Ryujiro Sasao, IC Net Limited
0. Summary
The project aims to ensure a stable power supply and meet the fast growing load demand by
augmenting facilities at 110 substations and replacing old and deteriorated equipment at 95
substations in the State of Maharashtra.
Since the augmentation of transmission and transformation facilities corresponding to the rapid
increase of power demand has been regarded as a priority at the time of both the project
appraisal and the ex-post evaluation, this project has been highly relevant to the development
plan and development needs of India. Also, Japan’s Country Assistance Program for India at the
time of the project appraisal mentions clearly that Japan would assist the development of power
grid in order to create stable and efficient power supply. Thus, it can be said that this project is
relevant to the Japan’s ODA policy. As for the efficiency of the project, outputs of the project
including the additional scope (replacement of equipment), which were approved during the
project implementation period taking the necessity, urgency and the status of budget
implementation into consideration, were achieved as planned. Although the project cost was
within the budget, the project period exceeded the plan because of the delay in selecting
consultants and suppliers (contractors) and the addition of the scope. Therefore, the efficiency of
the project is fair. As for the effectiveness of the project, it was confirmed that the target
operation and effect indicators such as availability factor of the transformers and transformer
capacity, which were set at the time of the project appraisal, were met in 2014, which is two
years after the project completion. As for the impacts of the project, although the contributions
made by the project are still limited, it has been found that economic development has been
enhanced, business activities of Japanese companies have expanded, and the living conditions in
the State of Maharashtra have improved. Therefore, the effectiveness and impact of the project are
high. No major problems have been observed in the institutional, technical, financial aspects and
the status of the operation and maintenance system. Therefore, the sustainability of the project
effects is high.
In light of the above, this project is evaluated to be highly satisfactory.

2
1. Project Description
Project Location Substation Equipment Augmented by the Project (Shirwal Substation, Karad Zone)
1.1 Background
Since the late 1990s, India has been suffering from a serious shortage of electric power supply,
caused by the rapid economic growth. In spite of the government’s intensive promotion of new
power development, it witnessed a shortage of about 8% in the total requirement and 12% in the
peak demand in 2005. Regional disparities in electric power supply and demand have also been
exacerbated and the shortage was the most serious in the western and northern areas of India.
Especially in the State of Maharashtra (whose capital is Mumbai), which is located in the
western part of India and has the country’s largest economy, electric power demand has
increased remarkably and the annual average rate of increase of about 7% for 2001–2005 is
expected to continue. To meet the current demand, as well as the future growth in demand,
Maharashtra State Electricity Transmission Company Limited (MSETCL) prepared and
implemented its investment plan to augment its transmission capacity; however, in many
substations in the state, the power load had almost approached their maximum capacity.
1.2 Project Outline
The objective of this project is to ensure a stable power supply and to meet the fast-growing
demand load by strengthening intra-state transmission systems in the State of Maharashtra
which is a western state in India, thereby contributing to local economic development and
improvement in the standard of living of the state’s citizens.
3
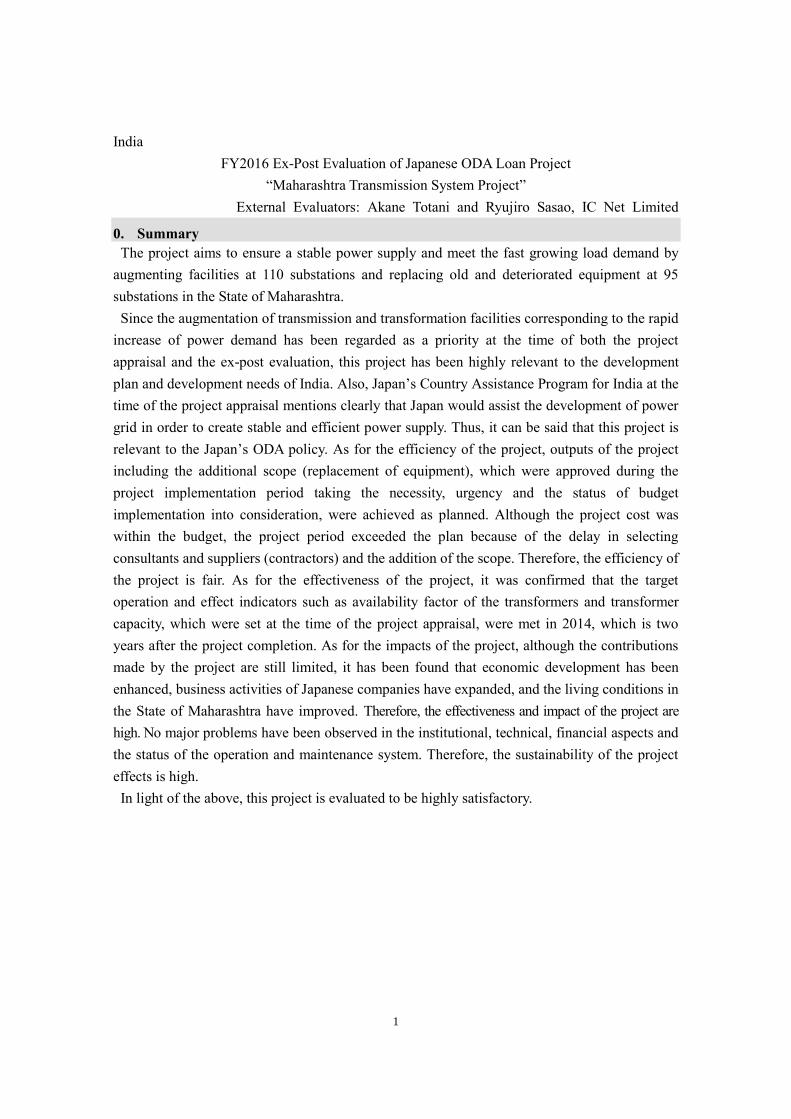
Loan Approved Amount/
Disbursed Amount 16,749 million yen / 12,070 million yen
Exchange of Notes Date/
Loan Agreement Signing Date August 2007 / September 2007
Terms and Conditions
Interest Rate 0.75% (Main portion)
0.01% (Consulting portion)
Repayment Period
(Grace Period
15 years
5 years)
Conditions for Procurement General untied
Borrower/
Executing Agency
The President of India /
Maharashtra State Electricity Transmission Company Limited
Project Completion March 2015
Main Contractors
(Over 1 billion yen)
Vijay Electricals Limited (India), Bharat Bijlee Limited (India),
Voltamp Transformers Limited (India), Transformer and
Rectifiers Limited (India)
Main Consultants
(Over 100 million yen)
Nippon Koei Co., Ltd. (Japan)/ Tokyo Electric Power Company
Holdings (Japan), Incorporated (Japan)/ Japan and Insight
Development Consulting Group (IDCG) (India) (JV)
Feasibility Studies, etc. Feasibility study conducted by the Executing Agency
(March 2007)
Related Projects 【Technical Cooperation】Master plan study on pumped storage
hydroelectric power development in Maharashtra State (1994–
1998)
【Japanese ODA Loan】Rural Electrification Project (March
2006), Power System Improvement and Small Hydro Project
(January 1991), Ghatgar Pumped Storage Project (December
1988), Ujjani Hydroelectric Project (November 1985), Paithan
Hydroelectric Project (August 1978)
【Other Organizations】
Asia Development Bank (ADB): Maharashtra Solar Park
and Green Grid Development Investment Program (2012),
Power Grid Transmission III (2004), Power Finance
Corporation (1999)
World Bank: Organizational Transformation and Public
Private Partnership: Maharashtra State Electricity
Transmission Company Limited (2006–2010), Maharashtra
Power Project 2 (1992–1998), Maharashtra Power Project
(1989–1998)
KfW1: Shivajinagar Sakri Solar Power (2001)
1 Kreditanstalt für Wiederaufbau (a German government-owned development bank)

4
2. Outline of the Evaluation Study
2.1 External Evaluators
Akane Totani, IC Net Limited
Ryujiro Sasao, IC Net Limited
2.2 Duration of Evaluation Study
This ex-post evaluation study was conducted with the following schedule.
Duration of the Study: September 2016–October 2017
Duration of the Field Study: January 30–February 14, 2017, April 4–11, 2017
3. Results of the Evaluation (Overall Rating: A2)
3.1 Relevance (Rating: ③3)
3.1.1 Consistency with the Development Plan of India
At the time of the project appraisal, the Government of India, in the 10th Five-Year Plan (2002–
2007), aimed to complete new power development of about 41,110 MW, as well as the
augmentation of the nationwide high-voltage transmission networks. This would ensure efficient
power transmission across the country from the northern, north-eastern and eastern parts of the
country, where many sources of electric power are concentrated to the metropolitan areas in the
west, north, and south of the country, and increase intra-state transmission by 30,000 MW by
2012. In the next plan, the 11th Five-Year Plan (2007–2012), further augmentation of inter-state
and intra-state transmission system for more stable electric power supply, as well as new power
development of 78,577 MW, was planned.
The importance of stable electric power supply in the country has not changed at the time of
the ex-post evaluation of the project. In the 12th Five-Year Plan (2012–2017), new power
generation for meeting the future electric power demand and augmentation of the existing
transmission and distribution facilities have been given priority. The Draft National Electricity
Plan, released in 2016, plans to invest for the new power generation and transmission projects
such as expanding power generation capacity including re-examination of the composition of
power sources, and strengthening inter-regional transmission links in response to the
continuously increasing power demand. Considering that the project aims to realize stable
electric power supply corresponding to the demand growth, it is fair to say that from the time of
the project appraisal to its ex-post evaluation, the project has been consistent with the
development plan of the Indian government.
2 A: Highly satisfactory, B: Satisfactory, C: Partially satisfactory, D: Unsatisfactory 3 ③: High, ②: Fair, ①: Low

5
3.1.2 Consistency with the Development Needs of India
The State of Maharashtra is located in the western part of India. It has the country’s largest
economy and a high growth rate. According to the documents provided by the Japan
International Cooperation Agency (JICA), the peak power demand increased from 12,535 MW
in 2001 to 16,069 MW in 2005 and the annual average growth rate of about 7% is expected to
continue. Although the length of the intra-state transmission grid was 35,626 km overall and the
number of substations was 473 as of March 2007, according to the same document as above) it
was found that in many substations and transmission lines in the transmission system, the power
load had almost approached their maximum capacity. In Maharashtra, electric power is mainly
consumed in the western coastal areas such as Mumbai which is the state capital, while the main
supply sources are located in the eastern areas with some of the shortfall being met by import of
electricity from other states. Therefore, augmentation of the transmission and distribution
system in the western part of the state is an urgent requirement.
According to the Load Generation Balance Report for the years 2008 and 2016, prepared by
the Central Electricity Authority (CEA), it was found that a peak demand of electric power in
the State of Maharashtra has continuously increased from 18,441 MW in 2007 to 20,973 MW in
2015. It is worth noting that the increase happened even after the implementation of the project.
On the other hand, power shortage was severe at the time of the project appraisal and the state
had an electricity deficit of 18.3% in 2007. However, because of the increase in power supply
brought about by the entry of new private companies into the power generation business
beginning around 2010, and the progress in the augmentation of the transmission and
distribution system, power shortage in the state has been alleviated. Maharashtra enjoyed an
electricity surplus of 7.4% at the time of the ex-post evaluation of the project.
Thus, it is clear that electric power demand in the state has increased continuously, from the
time of the project appraisal to the time of the ex-post evaluation of the project. Especially at the
time of project appraisal, when the deficit was very large, it can be said that the priority for
expansion of a transmission and distribution system such as this project was high. It was also
found, in the ex-post evaluation, that the needs have been met to some degree owing to
MSETCL’s continuous efforts including their self-investment to augment electric substation
equipment; however, the project is still important for stable power supply. Hence, it can be said
that the project is consistent with the developmental needs of India.
3.1.3 Consistency with Japan’s ODA Policy
In Japan’s Country Assistance Program for India at the time of project appraisal (May 2006),
assistance for the electric power sector was categorized as a priority area for promotion of
economic growth. It was also clearly mentioned that Japan would assist in the development of
the power grid in order to create a stable and efficient power supply, as well as development of
power sources and human resource development. In Medium-Term Strategy for Overseas
Economic Cooperation Operations (2005), assistance for poverty reduction and infrastructure
development for sustainable growth were set as overall priority areas, and development of

6
economic infrastructure was prioritized, especially in the assistance earmarked for India. In
Country Assistance Strategy for India (2006), electric power sector was regarded as a priority
sector for providing Japanese ODA loan, and it was decided to provide necessary support for
strengthening the transmission grid as stable power supply and distribution grid was important
for economic revitalization and poverty reduction. Thus, it can be said that the project is
consistent with Japan’s ODA policy at the time of project appraisal.
This project has been highly relevant to the development plan and development needs of India,
as well as Japan’s ODA policy. Therefore, its relevance is high.
3.2. Efficiency (Rating: ②)
3.2.1 Project Outputs
(1) Augmentation of substation facilities (transformers and peripheral equipment)
Under the project, substation facilities such as transformers and peripheral equipment were
augmented at 110 substations in four zones (Vashi, Pune, Karad, and Nasik) in the western part
of Maharashtra state. The number of targeted substations were the same as at the time of project
appraisal. However, because MSETCL had already performed augmentation works to meet the
large and urgent needs at 12 substations4 prior to the project’s start, these were replaced by
other substations. The list of peripheral equipment provided during the project along with
transformers, shown in Table 2, has also not changed since the time of the project appraisal. The
images below show the transformer and the control panel (peripheral equipment) provided
through the project.
Table 1: Number of Targeted Substations and Transformers Provided by the Project
Zone No. of Substations No. of Transformers
Vashi 19 27
Pune 28 48
Karad 20 50
Nasik 43 55
Total 110 180
Source: Document provided by the executing agency
Table 2: Contents of Substation Facilities Augmented by the Project
Transformers 220/33kV 50MVA、220/22kV 50MVA、132/33kV 50MVA、
220/132kV 200MVA、220/132-110kV 200MVA、220/132-110kV 100MVA、220/132-100kV 200MVA、220/132-100kV 100MVA、220/132kV 100MVA、132-110/33kV 50MVA、132-110/22kV 50MVA
Peripheral
Equipment
Current Transformer, Lightning Arrester, Isolator, Circuit Breaker, Control Panel,
Power Control Cable, Fire-Fighting Equipment, etc. Source: Document provided by JICA
4 Three substations in Vashi, three in Pune, five in Karad, and one in Nasik

7
Transformer
(Lonawala Substation, Pune Zone) Control Panel
(Kalwa Substation, Vashi Zone)
(2) Replacement of related equipment (additional scope)
After the approval on adding the project scope in March 2011, equipment that had deteriorated
was replaced at the 95 substations in four zones (this includes 52 substations, which were also
targeted by the original project scope). Selection of targeted substations and equipment to be
replaced, as per the additional scope, was done according to the results of analysis in
MSETCL’s Life Extension Scheme.5 As the need to replace peripheral equipment is as urgent
as the need to augment substation facilities, it can be said that the judgment to include the
replacement of equipment as an additional project scope is appropriate in terms of improving
efficiency in not only target substations but also in the whole transmission system in the targeted
zones. The list of equipment to be replaced, as per the additional scope, includes station
transformer, circuit breaker, lighting arrestor, isolator, current transformer, potential transformer,
control & relay panel, power & control cable, battery set, battery charger, and alternating current
(AC) distribution box. The following images show a circuit breaker and isolator replaced by the
project.
Circuit Breaker
(Takali Substation, Nasik Zone)
Isolator
(Lonawala Substation, Pune Zone)
5 One of the schemes in MSETCL’s investment plan to replace deteriorated substation facilities and transmission
lines in order to avoid failure and electric outage

8
(3) Consulting services
In the project, compared to the 48 M/M (24 M/M for Japanese consultants and 24 M/M for
local consultants) planned in the project appraisal, 35 man-months (M/M) were actually
provided for consulting services. The breakdown of the M/M is as shown in Table 3. Because
time was required for procurement, the period for which the consulting service was actually
provided was March 2009 to March 2011, although the original plan had scheduled it from
August 2008 to September 2010.
Table 3: Consulting Services (Unit: Man-Month)
Items of Works Planned Actual
Introduction of Total Quality Management (TQM) 8.0 9.5
Plan and Coordination of Training Program in Japan6 4.0 1.5
Project Supervision 12.0 12.0
Project Supervision (Local Consultant) 17.0 6.0
Capacity Building Support (Local Consultant) 7.0 6.0
Source: Documents provided by the executing agency and JICA
Japanese consultants were assigned as nearly planned; however, it was found that M/M for the
local consultant on project supervision was far less than planned. It occurred because the
frequency of travels of the Japanese consultants from Japan had been less than planned, and this
led to the revision of the assigned M/M for the local consultants. In addition, it was already
agreed at the time of the project appraisal to exclude the review of detailed design and
assistance for tendering in the terms of reference (TOR) for consultant services, because it was
found that the executing agency was capable enough and had the relevant knowhow and
experience.
6 In the project, a two-week training course was conducted three times in Japan for MSETCL technicians of the head
office and the zone offices.

9
3.2.2 Project Inputs
3.2.2.1 Project Cost
Table 4 shows the comparison between the planned and actual project costs. It is found that the
total project cost, including additional scope, was 65% of the planned amount and that the
Japanese ODA loan component was 72% of the planned amount. It can be said that the project
cost was within the budget. As indicated in 3.2.1, the project outputs including additional scope
were appropriate, and it is fair to say that the project cost matches the project outputs. The main
reason for the imbalance between planned and actual project costs is the appreciation of the
Japanese yen. Compared with the exchange rate at the time of project appraisal and the average
IMF rate during the project period, it was found that the exchange rate of Japanese yen against
Indian rupee appreciated by 32%. The fact that the actual bid amount for procuring transformers
and peripheral equipment was lower than the planned amount estimated at the time of the
project appraisal was another reason for the actual project cost falling below the estimated
amount.
Table 4: Planned and Actual Project Cost
Planned Actual Planned/Actual
Total Project Cost 20,712 million yen 13,393 million yen 64.7%
Japanese ODA Loan 16,749 million yen 12,070 million yen 72.1% Source: Documents provided by the executing agency and JICA
3.2.2.2 Project Period
The project period exceeded the plan. While the planned period at the time of the project
appraisal was 3 years and a month (37 months), starting from September 2007 (signing of Loan
Agreement (L/A)) and ending in September 20107, the actual period including additional scope
approved in March 2011 was 6 years and a month (73 months), starting from September 2007
(signing of L/A) and ending in September 2013. For comparing the planned and actual project
periods, the planned period was revised taking into account necessary period for additional
scope. The actual project period, including the additional scope, was 91 months (September
2007–March 2015) and exceeds the planned period (73 months) by 125%. The main reasons for
the actual project period exceeding the planned period were as follows:
1) The executing agency did not have enough experience in procuring consultants, so it
required much time to prepare the documents for inviting proposals from consultants. In
addition, following the usual procurement process in India, it took a certain amount of time
to prepare the shortlist. As a result, 7 months of delay occurred at the “procuring consultants”
stage.
2) Because the bidding took longer owing to the large number of bid packages, 2 months of
delay8 occurred at the stage of preparation for bidding.
7 The project completion was defined as commissioning of all the substations, completion of all the activities for
human resource development are implemented, and completion of consulting services. 8 While the planed period was 15 months from October 2007 to December 2008, the actual one was 17 months from
February 2008 to June 2009.

10
3) Because the transformers and equipment were delivered and installed during the monsoon
period and the erection works were delayed owing to outage problems, installation works at
some substations could not be completed as per the original schedule.
4) In March 2011, consent to replace the related equipment as an additional scope of the
project was obtained from JICA. Although the planned period for the additional scope was
30 months, from April 2011 to September 2013, the actual period was 49 months because of
the delay in the preparation for bidding.
Table 5: Comparison of Original and Actual Schedule
Process Original Actual
Selection of Consultant Oct. 2007–Jul. 2008 Jan. 2008–Feb. 2009
Consulting Services Aug. 2008–Sep. 2010 Mar. 2009–Mar. 2011
Selection of Supplier (Contractor) Oct. 2007–Dec. 2008 Feb. 2008–Jun. 2009
(Additional Scope) Apr. 2011– Nov. 2011–Jun. 2012
Delivery of Equipment Jan. 2009–Mar. 2010 Apr. 2009–Jan. 2011
(Additional Scope) –Mar. 2013 Feb. 2012–Nov. 2013
Erection / Installation of Equipment Jan. 2009–Mar. 2010 Sep. 2009–Mar. 2011
(Additional Scope) –Mar. 2013 Mar. 2012–Mar. 2014
Commissioning Mar. 2010 Feb. 2012
(Additional Scope) Mar. 2013 Sep. 2014
Project Completion Sep. 2010 Mar. 2012
(Additional Scope) Sep. 2013 Mar. 2015 Source: Document provided by JICA
Note: In the document provided by JICA, it is assumed that all the construction works of the additional scope are
done by March 2013. However, similar to the original scope, project completion is regarded as September 2013
which is six months after the completion of the installation.
3.2.3 Results of Calculations for Internal Rates of Return (Reference only)
3.2.3.1 Financial Internal Rate of Return (FIRR)
It was concluded that, at the time of the project appraisal, a calculation for the FIRR was not
possible because no immediate benefit from the project can be expected in the transmission
sector.
3.2.3.2 Economic Internal Rate of Return (EIRR)
In the project appraisal, the EIRR was calculated based on economic costs which consist of the
project cost excluding cost escalation, taxes and duties, connection cost to the distribution
network, operation and maintenance (O&M) cost (which is equivalent to 3% of the initial
investment cost), cost of power purchase, and economic benefit is brought by the increased
power supply including consumer surplus. In the recalculation of the EIRR in the ex-post
evaluation of the project, the same figures are taken for the initial investment cost for
installation of distribution network, connection cost and power purchase cost. As the electric
outage rarely happens except during inspection and maintenance in the target zones, the
consumer surplus accrued by switching to electricity utilization from other energy sources
during the power outage is excluded from the economic benefit.

11
Table 6: EIRR (Project Appraisal/Ex-Post Evaluation)
Project Appraisal (2007) Ex-Post Evaluation (2017)
EIRR (%) 23.0 27.9
Project Life 30 years from the project completion
Cost Investment cost, connection cost, operation & maintenance (O&M)
cost, power purchase cost
Benefit Economic benefit brought by
increased power sales and savings
(including consumer surplus)
Economic benefit brought by
increased power sales (excluding
consumer surplus) Source: Documents provided by JICA for project appraisal; calculated by the external evaluators based on the information provided by the executing agency for the ex-post evaluation
Although the project cost was within the budget, the project period exceeded the plan.
Therefore, efficiency of the project is fair.
3.3. Effectiveness9 (Rating: ③)
3.3.1 Quantitative Effects (Operation and Effect Indicators)
In the evaluation of effectiveness, much emphasis is put on the operation and effect indicators
that were set at the time of the project appraisal such as the “availability factor of the
transformers” (in percentage) and “transformer capacity” (in MVA). For the comparison
between target and actual, the figures relating to 201410, that is, two years after project
completion, were treated as the actual effect.
The actual availability factor of the transformers almost coincides with the target value. It
shows that the substation facilities augmented by the project have been properly brought into
use. The actual figures on transformer capacity exceeded the target as a whole, although the
target capacities for 132 kV and 100 kV transformers were not met. This is because some target
substations were replaced, as mentioned in 3.2.1, and transformers with 132 kV and 100 kV
capacity were replaced by the transformers with the other kV classes.
Table 7: Operation and Effect Indicators
Baseline Target Actual 2006 2012 2012 2014
Baseline Year 2 Years after Completion
Completion Year
2 Years after Completion
Availability Factor of the Transformers (%) 81.9 62.0 56.8 61.0
Transformer Capacity (MVA)
220 kV 4,566 7,970 8,153 8,153 132 kV 2,279 4,700 4,502 4,502 110 kV 300 600 714 714 100 kV 400 950 908.5 908.5
Source: Documents provided by the executing agency and JICA Note: The availability factor of the transformers is calculated as “maximal load (MW) / (rating capacity (MVA)×power factor”. It shows whether the transformer is appropriately operated at around the target availability factor that is set leaving room for margin. The transformer capacity indicates the capacity according to the voltage class.
9 Sub-rating for Effectiveness is to be put with consideration of Impact. 10 The operation and effect indicators were not revised at the time of adding the scope. Since the additional scope
aims to exchange the old and deteriorated relevant equipment, it can be said that there are no effects on the indicators
which were originally set at first. Thus, comparison of target and actual figures of indicators is done regarding 2012,
when the augmentation of transformers in the original scope was completed, as completion year.

12
For reference, the availability rate of the transformers based on operating time was 98.82% in
2006 and 99.73% in 2014 (two years after project completion). It also shows that the substation
facilities augmented by the project are being operated to the fullest extent.
Table 8: Availability Rate of the Transformers
2006 2012 2014
Availability Rate
of the Transformers (%) 98.82 99.71 99.73
Source: Document provided by the executing agency
Note: The availability rate of the transformers indicates the proportion of actual operating hours of
transformers out of 24 hours and 365 days.
Thus, it can be judged that the target operation and effect indicators, which were set at the time
of the project appraisal, were achieved, and that the project could elicit the expected effects.
3.3.2 Qualitative Effects (Other Effects)
The stability of electric power supply, as a result of the augmentation of substation facilities
and capacity building of the relevant people in the executing agency and developed through the
consulting services in the project, were analyzed as the qualitative effects of the project.
Investment promotion and improvement of living conditions in the State of Maharashtra, which
were also seen as qualitative effects of the project at the time of the project appraisal, were
regarded as impacts of the project.
(1) Outline of the beneficiary survey
In the ex-post evaluation, manifestations of qualitative effects (situation of power supply) and
impact (improvement in living conditions) were examined through a beneficiary survey of
residents living in the vicinity of the target substations, private companies, and public
institutions, which received power supply directly from the target substations or even from any
distribution companies in the substation area, conducted at seven substations (two substations
each were selected from Nasik, Pune, and Karad; one from Vashi). At each substation area, three
surveyors were assigned to conduct a questionnaire survey in the different target areas, which
were already trisected, and 113 residents, 22 private companies, and 10 public institutions were
randomly selected according to the equidistant spacing method. Finally, valid responses could
be collected from 101 residents, 22 private companies, and 10 public institutions that have been
living, working, and/or running a business in the area before the project was implemented.11
11 The 101 residents include 74 men and 27 women. With regard to their age, 5 are in their 20s, 32 in 30s, 34 in 40s,
17 in 50s, and 12 in 60s or above, and 1 unknown. The breakdown by zone is as follows.
Residents Private Company Public Institution
Vashi Zone 16 7 0
Nasik Zone 25 7 0
Pune Zone 32 3 2
Karad Zone 28 5 8
Total 101 22 10
Note: 2 substations each from Nasik, Pune and Karad zones and 1 substations from Vashi zone

13
(2) Improvement in electric power supply
The beneficiary survey asked the respondents a question on the degree of satisfaction
regarding the electric power supply after project completion, with four scales: “very satisfied,”
“satisfied,” “somewhat satisfied,” and “not satisfied.” Among the respondents, 24% of the
residents and 16% of the private companies and public institutions chose the “very satisfied”
and 76% of the residents and 84% of private companies and public institutions chose “satisfied”
(none chose “somewhat satisfied” or “not satisfied”). Decreases in the frequency of outage and
voltage stability were given as reasons for their satisfaction.
Figure 1: Degree of Satisfaction on the Electric Power Supply (Beneficiary Survey)
Figure 2: Frequency of Outage (Beneficiary Survey)
0% 20% 40% 60% 80% 100%
Private Companies &Public Institutions
Residents
Very Satisfied Satisfied
0% 20% 40% 60% 80% 100%
Pvt. Companies &Pub. Institutions
(After the Project)
Pvt. Companies &Pub. Institutions
(Before the Project)
Residents(After the Project)
Residents(Before the Project)
Everyday A Few Days a Week Once a Week A Few Days a Month Rarely

14
The survey also asked a question on the frequency of outage before and after project
completion with five scales: “every day,” “a few days a week,” “once a week,” “a few days a
month,” and “rarely.” As shown in Figure 2, it was found that the frequency of outage was
drastically reduced after project completion, although the situation before the project for
residents and private companies as well as public institutions was quite different. The
augmentation of substation facilities by the project makes it possible to provide constant power
supply by operating other transformers at the time of regular inspection and maintenance, or
when the transformer malfunctions.
(3) Capacity building of the concerned personnel of the executing agency
In the project, based on the assessment of the operation and maintenance (O&M) system and
capacity of the executing agency, training plan and curriculum, according to the needs and
capacity-building plan, were prepared and implemented through the consulting services. Initially,
in-country training on the basic concepts of total quality management (TQM) and practical
introduction to the plan-do-check-act (PDCA) cycle was conducted for middle-level managers.
A two-week overseas training session was also held three times in Japan during the project
period and the trainees visited such facilities as a central load dispatching control center,
substations, and construction site of the distribution grid, learning about the practical aspects of
introducing TQM in Japan and the latest technology in transmission and distribution systems.
According to the personnel at the head and zonal offices who participated in the training in
Japan, the TQM concept itself was not introduced by the project because it was already used in
the work of the executing agency. However, in reality, the TQM concept was not being properly
practiced in the organization. Hence, through the workshops conducted by the project, the
trainees understood better the objectives and practice methods of TQM. It was also reportedly
meaningful to observe the TQM concept being intensively put into practice at the substations in
Japan. By contrast, it was found that, because most of the people who participated in the
workshops and training in Japan were transferred to other departments, the management
know-how obtained through the project was not actively used at the executing agency, at the
time of the ex-post evaluation.
3.4. Impacts
3.4.1 Intended Impacts
As intended impacts, the number of indirect beneficiaries in the four target zones, economic
situation of the State of Maharashtra, expansion of business activities of Japanese companies in
the target areas, and improvement in living conditions in the target area are examined.
3.4.1.1 Number of indirect beneficiaries
In the project appraisal, it was reported that, although it was difficult to confirm the exact

15
number of direct beneficiaries of the project,12 61.64 million people in the four target areas
could benefit from the indirect impacts of the project. In the ex-post evaluation, it was found
that the population of the four target areas (indirect beneficiaries) was estimated as 85.48
million, based on the results of the census in 2011. Thus, the number of indirect beneficiaries of
the project has increased by 39%, compared with the number finalized during the project
appraisal, which shows the magnitude of the indirect impacts of the project.
Table 9: Estimated Population in the Four Target Areas in 2014
Vashi Zone 32,018,607
Pune Zone 16,840,867
Karad Zone 13,863,755
Nasik Zone 22,760,586
Total 85,483,815
Source: Document provided by the executing agency
3.4.1.2 Economic situation of the State of Maharashtra
The table below shows the economic situation in the State of Maharashtra, the target area of
the project.
Table 10: Economic Situation of the State of Maharashtra
Source: Economic Survey of Maharashtra 2011–12, 2012–13, 2013–14, 2014–15, 2015–16
As shown in Table 10, it was found that the gross state domestic product (GSDP) and the
GSDP growth rates of the service sectors and industry, in addition to the state income per capita,
increased after the completion of the project in 2012, and that the economic development in the
State of Maharashtra was led by the service sectors and industry. In general, it is reasonable to
say that the increase of electric power supply and its use are the contributing factors for the
regional economic development. However, because the project scope focuses only on the
12 This is because the executing agency of the project simply supplies electric power to the distribution companies,
which directly distribute electric power to the customers (beneficiaries).
2010 2011 2012 2013 2014 2015
Population (in thousands) 111,645 113,179 114,697
Gross State Domestic Product (GSDP, million rupee)
(at Constant (2011-2012) Prices) - - - 14,418,430 15,248,460 16,470,450
(at Current Prices) 10,683,270 11,995,480 13,237,680 15,101,320 17,921,220 19,691,840
Annual Growth Rates of Real GSDP - - 6.6% 6.2% 5.8% 8.0%
Sectoral (Agriculture) - - -1.9% 12.6% -16.0% -2.7%
Sectoral (Industry) - - 5.4% 1.2% 6.8% 5.9%
Sectoral (Services) - - 8.2% 7.0% 10.0% 10.8%
Net State Domestic Product
(State Income, NSDP, million rupee)9,824,520 10,827,510 11,967,540 14,500,030 15,720,370
-
State Income per Capita (rupee) 87,686 95,339 103,991 125,146 134,081 -
No. of Companies in Industrial Sector 27,892 28,215 28,949 29,123 - -
(Percentage to Whole India) 13.2% 13.0% 13.0% 13.0% - -
Labor Force in Industrial Sector (in 100 thousands) 12.03 13.21 12.33 13.12 - -
(Percentage to Whole India) 12.2% 12.7% 12.3% 12.6% - -
Profit in Industrial Sector (million rupee) 918,680 784,880 1,016,400 1,195,370 - -
(Percentage to Whole India) 23.6% 17.4% 22.9% 26.3% - -

16
augmentation of substation facilities—a component of the entire electric system—and the direct
beneficiaries of the project are part of the indirect beneficiaries shown in 3.4.1.1, the impact of
the project on the economic development in the State of Maharashtra is limited. By contrast, as
the rapid economic development of the state continues, as described above, the significance of
the project—which contributed toward securing a stable electric power supply in the western
coastal areas of the state with their rapidly growing power demand—for the state’s development
is quite high.
3.4.1.3 Expansion of business activities of Japanese companies in the target area
At the time of the project appraisal, 67 Japanese companies already had business activities in
the State of Maharashtra (project target area) (as of June 2006). Thus, it was expected that they
would also benefit from the project’s objective of ensuring stable electric power supply.
According to the list of Japanese companies operating in India (2016), at the time of the ex-post
evaluation (as of 2016), the number of Japanese companies operating in Maharashtra was 205,
which is almost three times as many as the number at the time of project appraisal. Table 11
indicates that the number of hubs of Japanese companies in India increased fourfold in the eight
years since 2008. However, it was also found that both the number of hubs in 2016 and the
growth rate since 2008 in the western region, including the State of Maharashtra, was lower
than what it was in the northern, north-eastern, and southern regions. According to the interview
with the concerned people, this is because the high electricity tariff in the State of Maharashtra
is an obstacle for the promotion of investments in the state. On the other hand, it was confirmed
that the stability of electric power supply in the state, compared with that of other states, could
be a promoting factor for the Japanese companies to make investment decisions. According to
the list of Japanese companies operating in India (2017), as of October 2016, the number of
Japanese companies located in the target areas of the project is as follows: 5 companies, with 5
hubs in Vashi; 158 companies, with 192 hubs in Pune; 1 company, with 1 hub in Karad; and 14
companies, with 17 hubs in Nasik. It is fair to say that the stable power supply realized by the
project indirectly contributes to the business expansion of the Japanese companies.
Table 11: List of Hubs of Japanese Companies by Region in India13 (2008–2016) 2008 2009 2010 2011 2012 2013 2014 2015 2016
North/North-East 305 369 410 474 613 707 1,246 1,490 1,585
East 39 65 93 95 109 144 336 369 385
West 208 268 246 265 365 519 994 1,128 1,163
Maharashtra 174 219 198 218 277 395 625 712 709
South 286 347 487 588 717 1,133 1,305 1,430 1,457
Total (Hubs) 838 1,049 1,236 1,422 1,804 2,503 3,881 4,417 4,590
Source: Embassy of Japan in India and JETRO, The List of Japanese Companies Operating in India (2017)
13 The hubs were of the following types: 1) representative office and branch office of the Japanese company, which is
not locally incorporated; 2) locally incorporated head office, central branch, production plant, branch office, business
office, local office, etc., of the Japanese company (fully affiliated company or a joint venture) ; and 3) companies set
up by Japanese nationals in India.

17
3.4.1.4 Improvement of Living Conditions in the target area
In the ex-post evaluation, the beneficiary survey14 was conducted to compare the living
conditions in the target areas of the project before and after the project implementation. On a
whole, living conditions in the target areas were improved in several aspects after the project
implementation. However, it cannot be said that the changes indicated in Figure 3 have been
brought about only by the stable electric power supply resulting from this project. The changes
could also be influenced by the economic conditions of the respondents’ households or of the
target areas. According to Figure 3, most of the respondents chose “very improved” or
“improved” in availability of lighting, TV and radio, convenience with the use of home electric
appliances (because of fewer outages), and frequency of breakdown of home electric appliances
(because of stable electric voltage). As for the burden of housework and time management,
compared to the above-mentioned items, more respondents chose “very improved”, while a
certain number of the respondents chose “not changed”. Notably, more than half of the
respondents choose “very improved” in securing a block of time and fixing working time
(because reduction and/or change in working hours is resolved due to the stability of the power
supply).
Figure 3: Changes in the Living Conditions in the Target Areas (Beneficiary Survey)
14 Same as the survey described in 3.3.2
10
36
53
33
35
24
25
24
10
8
29
16
87
80
60
39
54
54
74
72
71
91
91
71
85
5
5
5
9
14
12
3
4
6
2
1
9
6
Health condition
A sense of safety/security
Income from business
Securing/Fixing working time
Time management
Time to read and study
Washing
Cleaning
Cooking
Burden of housework
Convenience with the use of home electric appliances
Breakdown of home electric appliances
TV & Radio reception
Household lighting
Very improved Improved Not changed No answer
(Number of Respondents)

18
3.4.2 Other Positive and Negative Impacts
3.4.2.1 Impacts on the Natural Environment
In the project appraisal, it was expected that there would be minimum negative impacts on the natural
environment. In the ex-post evaluation, according to the interviews with the concerned personnel of the
executing agency and technical officers at the target substations, as well as the beneficiary survey15, it was
confirmed that there were no impacts on the natural environment because of the projects’ augmentation of
substation facilities and replacement of related equipment.
3.4.2.2 Land Acquisition and Resettlement
In the ex-post evaluation, through the interviews on the occurrence of land acquisition and
resettlement t with the concerned personnel of the executing agency and residents living in the
areas surrounding the target substations, it was confirmed that no land expansion or
displacement of the existing sub-stations occurred. Thus, there was no land acquisition and
resettlement caused by the implementation of the project.
This project has largely achieved its objectives. Therefore, the effectiveness and impact of the project are
high.
3.5 Sustainability (Rating: ③)
3.5.1 Institutional Aspects of Operation and Maintenance
MSETCL consists of the head office in Mumbai and seven zone offices that are engaged in the
installation of transmission and substation facilities and their operation and maintenance (O&M).
In the ex-post evaluation, it was confirmed that the O&M of the substation equipment
augmented or replaced by the project has been done by EHV Construction with O&M Zone
Offices (O&M Zone Offices) in Vashi, Pune, Karad, and Nasik, as planned in the project
appraisal without any changes of posts in charge of O&M. Each O&M Zone office is
responsible for supervising the O&M activities at the substation level, while operators and
technicians are actually engaged in the regular O&M activities at the substation under the
supervision of the chief engineer. The O&M division in each zone, which is in charge of 20
substations, can provide technical support to the substations as needed.
Meanwhile, MSETCL faces a chronic shortage of technical human resources at all levels,
including the O&M division and substations. Because efficiency in staff assignment has been
improved by combining the separate duties of the operation of substation facilities and O&M
into one, the number of vacant technical positions was reduced from 5,880 out of 14,182
technical posts (as of December 2016) to 3,301 (as of April 2017) out of 12,286 technical posts.
Although staff shortages still exist, it was confirmed that the substation facilities have been
properly operated and maintained with the requisite minimum number of personnel at the
substation levels, so it is not currently such a serious problem.
15 Same as the survey described in 3.3.2

19
Thus, it was found that the O&M has been appropriately performed at the substations with
clear demarcation of responsibilities and roles among the concerned departments, as well as in
the system of command and communication. Therefore, it can be said that a proper O&M
system has been established. However, it is still necessary to take immediate and necessary
measures for filling the vacant technical posts.
3.5.2 Technical Aspects of Operation and Maintenance
As of December 2016, MSETCL had 10,143 employees, including 8,528 technical staff
members. The technical levels of the departments and staff in charge of O&M are kept at the
proper level: a bachelor’s degree or higher in electronic engineering is an eligibility requirement
for the technical staff, and necessary knowledge and techniques are updated through training for
newly appointed personnel and a series of regular technical training courses16 provided by the
head office and zone offices.
At each substation, a manual for the O&M of the substation equipment is prepared and regular
inspection and maintenance are properly conducted according to the common rules established
by the head office. The records are also appropriately kept at the substations. However, in the
ex-post evaluation, it was found that the contents and quality of the operation manuals are not
standardized but vary from one zone and substation to another. The substations that can get
more input from the O&M division possess and use a more practical and detailed manual, while
the manual that the other substations possess does not provide any concrete procedures.
However, interviews revealed that even the substations with a simple operations manual conduct
regular inspection and maintenance as well as the other substations do, and no failures of
transformers and related equipment or accidents happened.
Thus, it can be judged that the technical level of personnel at the zone and substation levels are
high enough to operate and maintain properly the substation facilities introduced by the project.
3.5.3 Financial Aspects of Operation and Maintenance
Table 12 shows the financial status of MSETCL in the last three years. Because MSETCL is a
public corporation for transmission, its source of revenue is not the fare collection from the
customers but the commission charges from the State Transmission Utility (STU). As shown in
the table below, in the last three years, the total income exceeded the total expenditure, and the
net profit was stable with around 17,000 million rupee before the fiscal year (FY) 2015 when
adjustment of depreciation was posted. It is fair to say that the sustainability of revenues and the
financial status of MSETCL are secured. The recording of depreciation in FY2015, which made
the net profit negative, was temporary and not expected to occur in the subsequent years.
16 According to an interview, technical training courses are held several times a year at the head office and the zone
offices of MSETCL in addition to on-the job training at the substation provided by the zone offices.

20
Table 12: Financing Status of MSETCL (FY2013–FY2015) (Unit: Million Rupee)
Item FY2013 FY2014 FY2015
Total Income 54,957 54,320 35,700
Total Expenditure 29,424 27,920 29,020
Profit before Tax 25,532 26,400 6,670
Depreciation due to FRP - - 46,540
Net Profit (after Tax) 17,031 17,640 -42,560 Source: Documents provided by the executing agency
Note: Depreciation due to Financial Restructuring Plan (FRP) in FY2015 is the difference in the depreciation
between FY2005 and FY2015, which was caused by the increased value of asset of MSETCL according to the FRP
scheme of the Maharashtra State Government in 2016.
Table 13: Balance Sheet of MSETCL (Unit: Million Rupee)
Item FY2014 FY2015
Asset 197,227 209,170
Current Asset 31,668 37,294
Non-Current Asset 165,559 171,876
Accounting Capital 67,228 84,866
Debt 129,999 124,304
Current Debt 25,329 23,415
Non-Current Debt 104,670 100,889 Source: Documents provided by the executing agency
Table 13 shows the balance sheet of MSETCL in the last two years. According to the figures in
FY2015, it was confirmed that MSETCL had current ratio of 159%17. The capital adequacy ratio
of 41%18 also meets the generally desirable level.
As for the budget for O&M, 2,922 million rupee in FY2016 and 3,128 million rupee in
FY2015 were secured in the four target zones. The O&M budget is allocated not to the
substation levels but the O&M division that supervises the substations based on the plan and
request submitted by each substation. Interviews with the concerned personnel confirmed that
the annual O&M budget per substation is around 2–3 million rupee and an emergency budget is
separately allocated to the O&M division in each zone. According to the personnel at the O&M
division and substations, a sufficient O&M budget is allocated for proper operation and
maintenance of substation facilities.
3.5.4 Current Status of Operation and Maintenance
The site survey of the ex-post evaluation has confirmed that the substation facilities introduced
by the project have been appropriately operated and maintained. Specifications of the equipment
are based on MSETCL’s standards, and the availability of spare parts is secured.
The frequency of regular maintenance at the substation is annual, semiannual, quarterly,
monthly, or daily, depending on the type of equipment. Especially for the transformers and the
peripheral equipment, the engineers of the inspection division perform a routine operation check
once a week; the schedule depends on the zone. So far, no serious failure has been reported. In
17 Current ratio is calculated by dividing current asset by current debt. 18 Capital adequacy ratio is calculated by dividing accounting capital by total asset.

21
case of trouble, the maintenance team of the O&M division in each zone is responsible for
addressing the issues and, if necessary, the neighboring substations can provide technical
support.
Thus, it has been confirmed that the equipment introduced by the project are properly operated
and maintained through regular inspection. By the time of the ex-post evaluation, no failure and
fixing of equipment have been reported. An emergency response procedure is also clearly set. It
is fair to say that a proper O&M system has been established.
No major problems have been observed in the institutional, technical, financial aspects and
status of the operation and maintenance system. Therefore, sustainability of the project effects is
high.
4. Conclusion, Lessons Learned and Recommendations
4.1 Conclusion
The project aims to ensure a stable power supply and meet the fast growing load demand by
augmenting facilities at 110 substations and replacing old and deteriorated equipment at 95
substations in the State of Maharashtra.
Since the augmentation of transmission and transformation facilities corresponding to the rapid
increase of power demand has been regarded as a priority at the time of both the project
appraisal and the ex-post evaluation, this project has been highly relevant to the development
plan and development needs of India. Also, Japan’s Country Assistance Program for India at the
time of the project appraisal mentions clearly that Japan would assist the development of power
grid in order to create stable and efficient power supply. Thus, it can be said that this project is
relevant to the Japan’s ODA policy. As for the efficiency of the project, outputs of the project
including the additional scope (replacement of equipment), which were approved during the
project implementation period taking the necessity, urgency and the status of budget
implementation into consideration, were achieved as planned. Although the project cost was
within the budget, the project period exceeded the plan because of the delay in selecting
consultants and suppliers (contractors) and the addition of the scope. Therefore, the efficiency of
the project is fair. As for the effectiveness of the project, it was confirmed that the target
operation and effect indicators such as availability factor of the transformers and transformer
capacity, which were set at the time of the project appraisal, were met in 2014, which is two
years after the project completion. As for the impacts of the project, although the contributions
made by the project are still limited, it has been found that economic development has been
enhanced, business activities of Japanese companies have expanded, and the living conditions in
the State of Maharashtra have improved. Therefore, the effectiveness and impact of the project are
high. No major problems have been observed in the institutional, technical, financial aspects and
the status of the operation and maintenance system. Therefore, the sustainability of the project
effects is high.
In light of the above, this project is evaluated to be highly satisfactory.

22
4.2 Recommendations
4.2.1 Recommendations to the Executing Agency
To actively use the management method such as TQM and PDCA cycle acquired through the
project, it is desirable to establish the information sharing and implementing mechanism for the
concerned departments to play central roles to share and instill the outputs of management
method within the organization, even in case that most of the personnel who participated in the
workshops under the consulting services of this project and training in Japan were transferred to
the other departments.
4.2.2 Recommendations to JICA
None
4.3 Lessons Learned
None
23
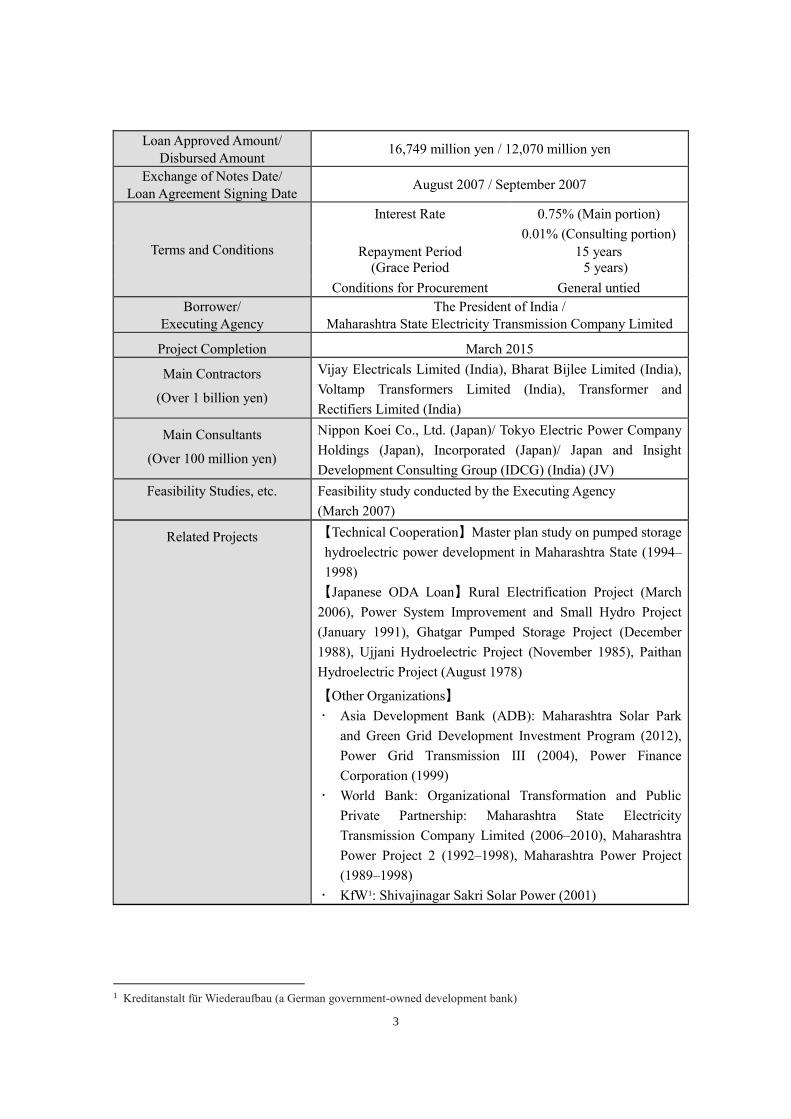
Comparison of the Original and Actual Scope of the Project
Item Plan Actual
1. Project Outputs Augmentation of substation
facilities (110 substations)
- 180 transformers
- Current Transformer, Lightning
Arrester, Isolator, Circuit
Breaker, Control Panel, Power
Control Cable, Fire-Fighting
Equipment (including erection
works)
Consulting services
As planned
As planned
(Additional scope)
Replacement of related equipment
(95 substations)
station transformer, circuit breaker,
lighting arrestor, isolator, current
transformer, potential transformer,
control & relay panel, power & control
cable, battery set, battery charger,
alternating current (AC) distribution
box (including erection works)
2. Project Period
Sep. 2007–Sep. 2010
(37 months)
Sep. 2007–Mar. 2015
(91 months)
3. Project Cost
Amount Paid
in Foreign Currency
Amount Paid
in Local Currency
Total
ODA Loan Portion
Exchange Rate
13,975 million yen
6,737 million yen
(2,504 million Rupee)
20,712 million yen
16,749 million yen
1 Rupee=2.69 yen
(As of May 2007)
12,070 million yen
1,323 million yen
(723 million Rupee)
13,393 million yen
12,070 million yen
1 Rupee=1.83 yen
(Average of IMF Rate
between 2008 and 2014)
4. Final
Disbursement November 2014