Embed Size (px)
Citation preview

Indiana’s Great Lakes Water Quality Agreement (GLWQA)
DOMESTIC ACTION PLAN (DAP)
for the
WESTERN LAKE ERIE BASIN (WLEB)
DRAFT FOR PUBLIC COMMENT
August 14, 2017

INDIANA’S GREAT LAKES WATER QUALITY AGREEMENT DOMESTIC ACTION PLAN for the WESTERN LAKE ERIE BASIN
Page 1 of 23
BACKGROUND Indiana has been an active member of the Nutrients Annex 4 Binational Subcommittee (Subcommittee) of the Great Lakes Water Quality Agreement (GLWQA) since its establishment in 2013. The Subcommittee is charged with coordinating binational actions to manage phosphorous loadings and concentrations in the Great Lakes. The GLWQA Lake Ecosystem Objectives include the following:
• Minimize the extent of hypoxic zones in the Great Lakes due to excessive phosphorous loading with emphasis on Lake Erie.
• Maintain levels of algal biomass below nuisance level conditions. • Maintain algal species consistent with healthy aquatic ecosystems in nearshore waters. • Maintain cyanobacteria biomass at levels that do not produce concentrations of toxins
that pose a threat to human or ecosystem health. • Maintain an oligotrophic state, relative algal bio-mass, and algal species consistent
with healthy aquatic ecosystems in the open waters of Lakes Superior, Michigan, Huron, and Ontario.
• Maintain mesotrophic conditions in the open waters of the western and central basins of Lake Erie, and oligotrophic conditions in the eastern basin of Lake Erie.
Commitments under the Nutrients Annex include the following:
• By February 2016, establish binational phosphorous objectives, loading targets, and allocations for the nearshore and offshore waters to achieve the Lake Ecosystem Objectives (LEOs) for each lake, starting with Lake Erie.
• Assess and where necessary, develop/implement regulatory and non-regulatory programs/measures to reduce phosphorous loadings from agricultural, rural non-farm, urban, and industrial point and nonpoint sources.
• By 2018, develop a binational phosphorous reduction strategy and Domestic Action Plans (DAPs) designed to meet nearshore and open water phosphorous objectives and loading targets for Lake Erie.1
On February 22, 2016, the United States and Canada adopted new phosphorus reduction targets for Lake Erie. They are noted in Table 1.
1 For more information, please see the June 2016 Progress Report of the Parties to the Great Lakes Commission.
INDIANA’S GREAT LAKES WATER QUALITY AGREEMENT DOMESTIC ACTION PLAN for the WESTERN LAKE ERIE BASIN
Page 2 of 23
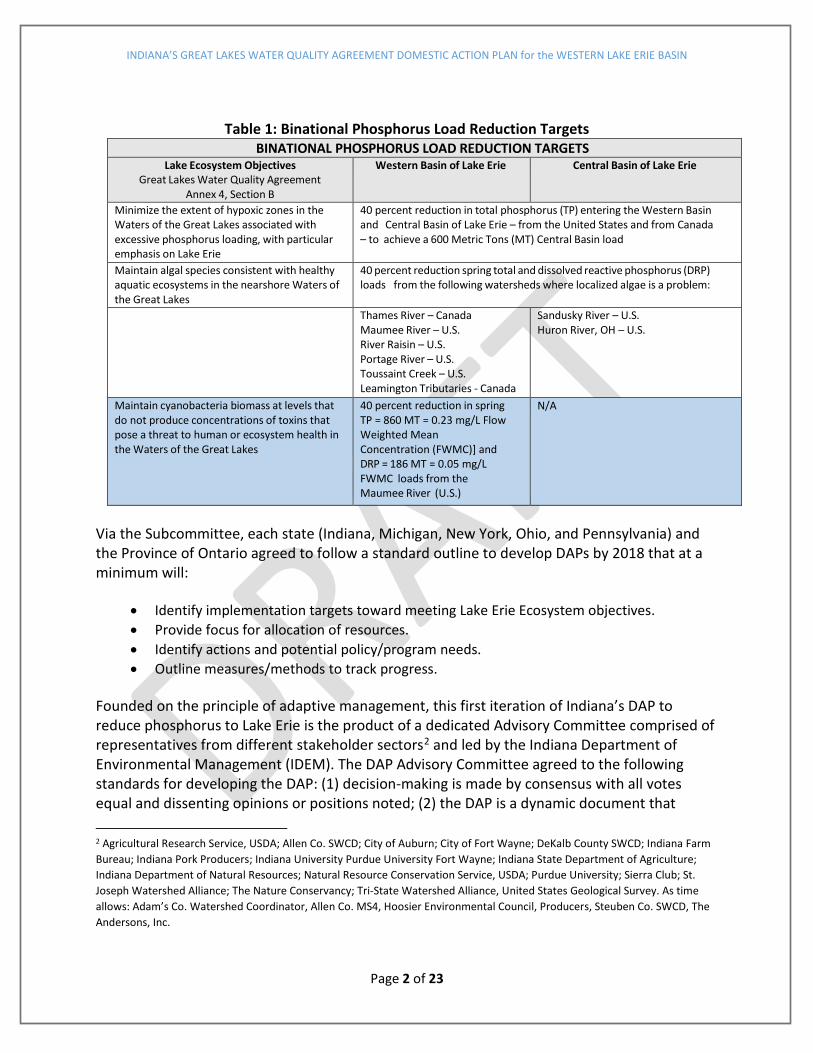
Table 1: Binational Phosphorus Load Reduction Targets BINATIONAL PHOSPHORUS LOAD REDUCTION TARGETS
Lake Ecosystem Objectives Great Lakes Water Quality Agreement
Annex 4, Section B
Western Basin of Lake Erie Central Basin of Lake Erie
Minimize the extent of hypoxic zones in the Waters of the Great Lakes associated with excessive phosphorus loading, with particular emphasis on Lake Erie
40 percent reduction in total phosphorus (TP) entering the Western Basin and Central Basin of Lake Erie – from the United States and from Canada – to achieve a 600 Metric Tons (MT) Central Basin load
Maintain algal species consistent with healthy aquatic ecosystems in the nearshore Waters of the Great Lakes
40 percent reduction spring total and dissolved reactive phosphorus (DRP) loads from the following watersheds where localized algae is a problem:
Thames River – Canada Maumee River – U.S. River Raisin – U.S. Portage River – U.S. Toussaint Creek – U.S. Leamington Tributaries - Canada
Sandusky River – U.S. Huron River, OH – U.S.
Maintain cyanobacteria biomass at levels that do not produce concentrations of toxins that pose a threat to human or ecosystem health in the Waters of the Great Lakes
40 percent reduction in spring TP = 860 MT = 0.23 mg/L Flow Weighted Mean Concentration (FWMC)] and DRP = 186 MT = 0.05 mg/L FWMC loads from the Maumee River (U.S.)
N/A
Via the Subcommittee, each state (Indiana, Michigan, New York, Ohio, and Pennsylvania) and the Province of Ontario agreed to follow a standard outline to develop DAPs by 2018 that at a minimum will:
• Identify implementation targets toward meeting Lake Erie Ecosystem objectives. • Provide focus for allocation of resources. • Identify actions and potential policy/program needs. • Outline measures/methods to track progress.
Founded on the principle of adaptive management, this first iteration of Indiana’s DAP to reduce phosphorus to Lake Erie is the product of a dedicated Advisory Committee comprised of representatives from different stakeholder sectors2 and led by the Indiana Department of Environmental Management (IDEM). The DAP Advisory Committee agreed to the following standards for developing the DAP: (1) decision-making is made by consensus with all votes equal and dissenting opinions or positions noted; (2) the DAP is a dynamic document that 2 Agricultural Research Service, USDA; Allen Co. SWCD; City of Auburn; City of Fort Wayne; DeKalb County SWCD; Indiana Farm Bureau; Indiana Pork Producers; Indiana University Purdue University Fort Wayne; Indiana State Department of Agriculture; Indiana Department of Natural Resources; Natural Resource Conservation Service, USDA; Purdue University; Sierra Club; St. Joseph Watershed Alliance; The Nature Conservancy; Tri-State Watershed Alliance, United States Geological Survey. As time allows: Adam’s Co. Watershed Coordinator, Allen Co. MS4, Hoosier Environmental Council, Producers, Steuben Co. SWCD, The Andersons, Inc.

INDIANA’S GREAT LAKES WATER QUALITY AGREEMENT DOMESTIC ACTION PLAN for the WESTERN LAKE ERIE BASIN
Page 3 of 23
recognizes nutrient problems are complex, multi-faceted, and caused by point and nonpoint sources across all sectors of Indiana with the solutions being likewise; and (3) the DAP is data driven but not deterred or deferred by the inconclusive or unknown. This document is informed by the intensive planning, research, and steadfast work that is already underway in the WLEB by individuals, non-governmental organizations, universities, professional associations, for-profit industries, and governmental entities at the town/municipal, county, state, and federal levels.3 It is in keeping with the principles and approaches in Indiana’s State Nutrient Reduction Strategy. This DAP acknowledges data, resource, and research needs and next steps and proposes a time-line for meeting/achieving them. The criteria by which priorities, next steps, and the allocation of resources are evaluated include the following:
• Use existing programs and optimize partnerships. • Effect the most change with the least cost. • Prioritize resources to areas with the most phosphorus export and/or reduction potential. • Seek to engage citizens who are unengaged or not participating in conservation efforts. • Make use of social indicators to guide outreach activities and best management practices
(BMPs). • Employ adaptive management.
GOAL The focus of Indiana’s DAP is the Western Lake Erie Basin (WLEB) as Indiana’s only tributary to Lake Erie is the Maumee River, which has its mouth in the WLEB. Thus, particularly pertinent to Indiana is the GLWQA Lake Ecosystem Objective to “maintain cyanobacteria biomass at levels that do not produce concentrations of toxins that pose a threat to human or ecosystem health” (Table 1 highlight). From applying, cross-referencing, and analyzing seven different models, the Subcommittee concludes that spring-time (March through July) loading of phosphorus from the Maumee River is the prevailing source of phosphorus causing cyanobacteria blooms in the WLEB (Annex 4 Targets and Objectives Task Team, May 11, 2015, p. 33). Using 2008 as the base year, the Subcommittee determined that a reduction of 40 percent in spring-time loads of both total and dissolved reactive phosphorus is required to limit the formation of nuisance/harmful algal blooms in nine out of ten years. Nine out of ten years acknowledges the probability of an extremely wet year in which the goal would not be attainable. The 40 percent reduction target load is equal to 860 metric tons (MT) of total phosphorus (TP) and 186 MT of dissolved reactive phosphorus (DRP), which translate to a flow weighted mean concentration (FWMC) of 0.23 mg/L TP and 0.05 mg/L DRP. This target load is expected to produce a bloom similar to
3 Nonpoint source pollution abatement plans and actions in progress are listed with hyperlinks under “Major Actions Since 2008.”

INDIANA’S GREAT LAKES WATER QUALITY AGREEMENT DOMESTIC ACTION PLAN for the WESTERN LAKE ERIE BASIN
Page 4 of 23
that which occurred in 2012, which marked the smallest bloom quantified by the cyanobacteria metric in the last decade.
Indiana’s goal is to meet the spring-time FWMC targets of 0.23 mg/L and 0.05 mg/L for TP and DRP respectively in the Maumee River as it flows across the border into Ohio. Indiana, in concert with the U.S. Environmental Protection Action (EPA), affirms the reduction planned for the Maumee River will address Indiana’s obligation for the 40% phosphorous load reductions entering the WLEB, which in turn, positively affects the Central Basin. While phosphorus is the nutrient of focus and primary driver of eutrophication in the WLEB, the addition of nitrogen significantly increases the production of algal blooms. The relationship of algal bloom size, timing and other factors, such as water temperature, to the production of algal toxins is not fully understood and the role that nitrogen plays in algal toxins is being examined. Therefore, nitrogen as well as other parameters listed in Table 3 (page 20) are being collected in Indiana’s current and proposed monitoring projects in the WLEB to provide data for this research and to achieve a better understanding. Timeframe to meet load reduction goals The lag time between the installation of conservation or BMPs on the landscape and positive, statistically significant changes in the water quality of a large river, such as the Maumee, can take decades.4 Reductions in phosphorus loads to smaller streams and tributaries may be manifest in improved water quality sooner, just as changes are realized sooner on the agricultural edge-of-field scale and at point source outfalls. Thus, Indiana will use various indicators including social indicators to track progress annually from different sectors and will use 2020 as a checkpoint to determine progress toward the target phosphorus loads on the Maumee to validate or re-evaluate the priority watersheds, programs, and practices put forth in this DAP. By that time, Indiana plans to have more baseline monitoring at the HUC-12 scale that will facilitate setting a timeframe for achieving the phosphorus target loads on the Maumee.
4 Donald W. Meals and Steven A. Dressing. 2008. Lag time in water quality response to land treatment. Tech Notes 4, September 2008. Developed for U.S. Environmental Protection Agency by Tetra Tech, Inc., Fairfax, VA, 16 p. Available online at https://www.epa.gov/sites/production/files/2016-05/documents/tech_notes_4_dec2013_lag.pdf

INDIANA’S GREAT LAKES WATER QUALITY AGREEMENT DOMESTIC ACTION PLAN for the WESTERN LAKE ERIE BASIN
Page 5 of 23
INDIANA’S PORTION OF THE WLEB Figure 1: Indiana’s Portion of the WLEB
Indiana drains roughly 12 percent of the WLEB and is comprised of the St. Joseph, Maumee, Auglaize, and St. Mary’s watersheds that encompass approximately 821,300 acres in the counties of Steuben, DeKalb, Allen, Noble, Adams, and Wells5. The St. Joseph River and the St. Mary’s River enter Indiana from Ohio and, at their confluence near Fort Wayne, form the Maumee River, which flows approximately 29 miles eastward into and through Ohio for another 108 miles to its mouth at Maumee Bay in Lake Erie near Toledo. This portion of the WLEB is home to nearly a half million people. The largest city is Fort Wayne with a population of approximately 260,000. LAND USE IN THE WLEB AND MAJOR SOURCES OF PHOSPHORUS More than 70 percent of the WLEB is agricultural, 15 percent is developed, and the remaining 15 percent is comprised of forests, wetlands, and open water. Row crop agricultural land with corn and soybean rotation predominating, is mostly drained by subsurface tiles which, during significant rainfall events, discharge to streams transporting phosphorus, nitrogen, and in some cases suspended sediment.
Table 2: Land Use in the Indiana WLEB (USDA-NASS, Washington, DC, 2012) Land Use Total in Acres Percentage of Total Agriculture 436,100.05 53.10 % Hay/Pasture 141,174.25 17.20% Developed 123,604.83 15.00% Forested 76,910.81 9.40% Wetland 22,168.99 2.70% Scrub/Shrub 11,743.78 1.40% Open Water 9,594.56 1.20% Total 821,297.26 100.00%
5 Approximate acres by county: Steuben ≈ 50,210, Noble ≈ 52,050, DeKalb ≈ 224,520, Allen≈ 315,400, Wells ≈ 17,600 and Adams ≈ 161,520

INDIANA’S GREAT LAKES WATER QUALITY AGREEMENT DOMESTIC ACTION PLAN for the WESTERN LAKE ERIE BASIN
Page 6 of 23
There are four major (one million gallons/day) National Pollutant Discharge Elimination System (NPDES)6 permitted municipal wastewater treatment plants (WWTPs), each with a TP effluent limit of 1 mg/L. These include Fort Wayne, Decatur, Auburn, and Butler. These WWTPs average a discharge concentration below the 1mg/L TP limit. There are three minor municipal WWTPs and an additional seven industrial/other minor dischargers. Within the developed areas, there are seven combined sewer overflow (CSO)7 communities including Auburn, Berne, Butler, Decatur, Fort Wayne, New Haven, and Waterloo, each with an approved long term control plan (LTCP) or consent decree with compliance schedules. There are 13 designated municipal separate storm sewer systems (MS4s)8 with approved storm water management plans (SWMPs) including one in Adams County, 11 in Allen County, and one in DeKalb County. Like nonpoint source (NPS) pollution associated with precipitation events, these regulatory point sources have their pollutant signatures during precipitation events. Confined feeding operations (CFOs) as defined by Indiana Code (IC 13-18-10) mean any confined feeding of at least three hundred (300) cattle; six hundred (600) swine or sheep; thirty thousand (30,000) fowl; or five hundred (500) horses.9 There are 78 active CFOs in the WLEB with 50 in Adams County, 12 in Allen County, 12 in DeKalb County, 1 in Steuben, and 3 in Wells County10. Approximately 36,000 acres within the WLEB are used for application of manure generated by CFOs. A map of the NPDES permitted facilities and CFOs is found in Figure 2.
6 NPDES permits are issued by IDEM to control direct discharges to waters of the State. These permits place limits on the amount of pollutants that may be discharged to waters of the State by each discharger. These limits are set at levels protective of both the aquatic life in the waters which receive the discharge and of human health. For more information see http://www.in.gov/legislative/iac/T03270/A00030.PDF 7 CSOs are wastewater collection systems that convey sanitary wastewaters (domestic, commercial, and industrial wastewaters) and storm water through a single-pipe system to a Publicly Owned Treatment Works (POTW). A CSO is the discharge from a combined sewer system at a point prior to the POTW. CSOs are point sources subject to NPDES permit requirements including both technology-based and water quality-based requirements of the CWA. 8 MS4s are defined as a conveyance or system of conveyances owned by a state, city, town, or other public entity that discharges to waters of the United States and is designed or used for collecting or conveying storm water. Regulated conveyance systems include roads with drains, municipal streets, catch basins, curbs, gutters, storm drains, piping, channels, ditches, tunnels, and conduits. It does not include CSOs and POTWs. 9 Additionally, a CFO is any animal feeding operation electing to be subject to IC 13-18-10; or any animal feeding operation that is causing a violation of water pollution control laws, any rules of the board; or of IC 13-18-10. 10 There are many livestock and poultry farms located in the WLEB that do not meet the definition of CFOs and are not specifically regulated under Indiana Code.

INDIANA’S GREAT LAKES WATER QUALITY AGREEMENT DOMESTIC ACTION PLAN for the WESTERN LAKE ERIE BASIN
Page 7 of 23
Figure 2: NPDES Facilities and CFOs

INDIANA’S GREAT LAKES WATER QUALITY AGREEMENT DOMESTIC ACTION PLAN for the WESTERN LAKE ERIE BASIN
Page 8 of 23
WATERSHED PRIORITIZATION At the 8-digit hydrologic unit code (HUC)11 scale, the watershed contributing the most TP to the Maumee River appears to be the St. Mary’s.12 This determination is based on an analysis of water quality monitoring data from IDEM’s 12 WLEB fixed station sites for the period 2008 through 2015. Various models show the highest TP concentrations and loads in the St. Mary’s watershed; DRP is not currently collected at the fixed station sites. Additionally, using the FWMC of 0.23 mg/L as a target, the load duration curves show the results from most of the sampling events exceed the target for TP across all flow conditions signifying both point sources and nonpoint sources of TP. Point sources such as WWTPs (or sources that behave as point sources, such as septic systems) discharge regularly, regardless of weather. Thus, during normal or low-flow conditions, nutrients and other pollutants associated with point sources are present in the stream. Whereas, in precipitation driven, high-flow conditions, including storms and snow-melt, nonpoint pollution sources predominate. (Appendix 2 includes a description of the analysis as well as station by station results). Figure 3 depicts the FWMC at each of IDEM’s fixed station sites.
11 Hydrologic unit codes are a way of identifying all of the drainage basins in the United States in a nested arrangement from largest (Regions) to smallest (Cataloging Units). The term watershed is often used in place of drainage basin. The smaller the HUC number, the larger the drainage area. For example, a HUC 8 watershed is larger than a HUC 12. 12 Albeit the St. Mary’s watershed is identified as the major exporter of TP requiring attention, many efforts are underway and are being planned for all of the 8-digit HUC watersheds within the WLEB.

INDIANA’S GREAT LAKES WATER QUALITY AGREEMENT DOMESTIC ACTION PLAN for the WESTERN LAKE ERIE BASIN
Page 9 of 23
Figure 3

INDIANA’S GREAT LAKES WATER QUALITY AGREEMENT DOMESTIC ACTION PLAN for the WESTERN LAKE ERIE BASIN
Page 10 of 23
Since an important aspect of analyzing the water quality data is ensuring consistency and quality assurance between the various entities in their collection and laboratory methods, as a first cut for this document, only ambient water quality data collected by IDEM was used to rank TP contributions at the larger HUC scale. Further analyses of water quality monitoring data from the Allen County Soil and Water Conservation District, City of Fort Wayne, St. Joseph Watershed Alliance, and USGS will be incorporated into the prioritization process for smaller watersheds and prior to the finalization of this document. Underway is the prioritization process referenced above to determine the 12-digit HUC
watersheds of focus for targeting the allocation of resources. Prioritizing at this scale is important because ambient water quality changes occur more quickly at a smaller watershed scale in response to targeted land-based BMPs. This process, which is anticipated to be completed by November of 2017, includes mapping critical areas from watershed management plans along with NRCS modeled areas of greatest phosphorus export potential and overlaying them with vetted water quality data to identify the intersections. The intersections will be ranked as top priorities and the hypotheses and actions proposed to address them will also facilitate the adaptive management aspect of this DAP. GUIDING PRINCIPLES FOR ACHIEVING WATER QUALITY IMPROVEMENTS Opportunities exist to reduce nutrient inputs from both urban and rural landscapes, including both point and non-point sources. Emphasis will be on using existing regulatory instruments and implementing voluntary best management practices. Point Sources
• WWTPs and publicly owned treatment works (POTWs) will employ optimization techniques by analyzing their current operation and maintenance processes to seek better nutrient removal.
• CSO communities will implement their LTCPs and associated compliance schedules and track progress.
• Stormwater management: o MS4 communities will implement their storm water management plans (SWMPs) and
track progress. o Construction site sediment runoff controls will be implemented according to the
Notice of Intent (NOI)13 and living stabilization covers will be used that minimize nutrient inputs.
o Industrial site runoff controls will be implemented according to the NOI. • Septic system installation, operation, maintenance, and repair will follow the site specific
design regulations.
13 The application for a Construction Site Run-off general permit is called a Notice of Intent, or NOI, because the "applicant" or "project site owner" is notifying IDEM of his or her intent to operate their proposed construction project in a manner consistent with the Rule. The applicant follows all guidelines and requirements for submittal of the general permit.

INDIANA’S GREAT LAKES WATER QUALITY AGREEMENT DOMESTIC ACTION PLAN for the WESTERN LAKE ERIE BASIN
Page 11 of 23
Non-Point Sources The overall goals will be to enhance nutrient management, promote soil health practices, and restore more natural hydrology and ecological functions by promoting drainage water management (rather than moving water off the landscape quickly) and emphasizing the importance of allowing water to infiltrate where it falls. Hydromodification is the alteration of the natural flow of water through a landscape that reduces precipitation infiltration and changes drainage patterns causing rainfall to discharge into streams more quickly with higher energy. Large flow events occur more frequently and local drought and flood cycles may be exacerbated. The United States Environmental Protection Agency (U.S. EPA) indicates that hydromodification is one of the leading sources of water quality degradation in our nation’s waters.14 Examples of hydromodification include channelization and dredging; streambank denuding; removal of riparian corridors, wetlands and floodplains; stream relocation; dams; streambank and shoreline hardscapes; subsurface drainage (agricultural and residential); and conversion of open landscape to roads, buildings, parking lots, and other impervious surfaces. These changes to flow result in higher sedimentation and nutrient loading to our waterways as well as higher water temperatures, lower dissolved oxygen, degradation of aquatic habitat structure and declines in biological communities. Opportunities for mitigation include but are not limited to the following approaches:
• Urban landscapes: create a green infrastructure (GI) paradigm by seeking incentives and opportunities for it.15
o Support practices that promote infiltration, bio-retention, and slow or more natural water release.
o Seek the installation of larger, regional or multipurpose GI practices that are often more cost-effective.
o Ensure that the maintenance of GI practices is included in cost estimates and budgets.
o Provide support to install rain gardens, green roofs, rain barrels, and porous pavement in industrial, commercial and residential settings.
• Rural landscapes: o Restore stream sinuosity and riparian buffers. o Restore and reconnect riparian wetlands and floodplains. o Install 2-stage ditches where feasible on both regulated and non-regulated drains. o Install drainage water management BMPs and saturated buffers on working lands.
14 National Management Measures to Control Nonpoint Source Pollution from Hydromodification, EPA 841-B-07-002, July 2007. 15 U.S. EPA’s website for Green Infrastructure is a great resource for design and implementation measures as well as funding sources, and Indiana’s manual entitled the Planning and Specification Guide for Effective Erosion and Sediment Control and Post-Construction Water Quality shows pollutant removal expectations for the various BMPs.

INDIANA’S GREAT LAKES WATER QUALITY AGREEMENT DOMESTIC ACTION PLAN for the WESTERN LAKE ERIE BASIN
Page 12 of 23
• Agricultural landscapes: o Emphasize soil health: Healthy soil with a higher organic content reduces erosion,
requires less nutrient inputs, ameliorates the effects of flood and drought, and reduces nutrient and sediment loading to streams and rivers. The four key principles to increasing organic matter and building healthy soils are: Minimize disturbance through no till or conservation tillage practices. Maximize soil cover. Keep living roots growing as long as possible. Grow a variety of plants.
o Promote nutrient management to optimize inputs and uptake by crops through employing the “4 Rs” namely, applying the right nutrient source at the right rate at the right time in the right place.
MAJOR ACTIONS SINCE 2008 Since 2008, the base year from which progress is being measured, policies, and many programs and practices have been implemented to reduce nutrients from entering Indiana’s waters. An excellent overview of many of the past and current activities is provided in the Western Lake Erie Basin Story Map. A listing of a few key major actions follow. Regulatory
• 2010 (readopted 2016) - 355 IAC Article 7: Certification for Distributors and Users of Fertilizer Material is a rule administered by the Indiana Office of the State Chemist to ensure fertilizer materials are applied, handled, and transported effectively and safely in a manner that protects water quality. It pertains to both commercial and private fertilizer applicators, requiring them to obtain training, certification, and/or licensure.
• 2012 - 355 IAC Article 8: Fertilizer Material Use, Distribution and Recordkeeping. • 2012 - Confined Feeding Operation Rule 327 IAC 19: The program has three main areas of
focus to protect ground and surface water: o Design, construction, and capacity requirements for confinement buildings, manure
storage structures, and other waste management structures. o Operation and maintenance requirements including self-inspections, record
keeping, and spill response. o Land application requirements including setbacks, application at agronomic rates,
and avoiding weather conditions that could lead to contaminated runoff, such as restrictions on application to frozen and snow-covered ground.
o Soil P is not to exceed 200 parts per million (PPM) by 2018. • 2012 - Concentrated Animal Feeding Operation Rule 327 IAC 15-16. • 2015 - Satellite Manure Storage Structures Rule 227 IAC 20. • 2015 - All CSO communities have an approved long-term control plan or other state or
federal enforceable mechanism in place.

INDIANA’S GREAT LAKES WATER QUALITY AGREEMENT DOMESTIC ACTION PLAN for the WESTERN LAKE ERIE BASIN
Page 13 of 23
Non-regulatory
• 2010 - Indiana Department of Natural Resources (IDNR) and IDEM become official members in the Indiana Conservation Partnership (ICP).16
• InField Advantage (formerly On Farm Network). • 2016 (version 4)- State Nutrient Reduction Strategy
Watershed Planning
• 2015/2016 - Indiana Western Lake Erie Action Plan. • March 2016 - Western Lake Erie Basin Partnership Strategic Plan and Western Lake Erie
Basin Initiative Strategy, Years 2016-2018.
Approved CWA §319 Watershed Management Plans17 • 2008 - St. Joseph River (Lower)-Bear Creek WMP. • 2009 - St. Marys River WMP. • 2010 - St. Joseph River (Middle) WMP. • 2015 - St. Joseph River (Upper) WMP. • 2016 - Upper Maumee Phosphorus-Risk Reduction Pilot Implementation Project.
PARTNERS AND AREAS OF AUTHORITY/RESPONSIBILITY AND PROGRAMS TO ADDRESS NUTRIENT REDUCTION The federal, state, county, and municipal regulatory authorities are outlined in this section along with funding mechanisms ranging from cost-share programs, grants, and loans to stormwater utility fees. Technical, financial, and managerial assistance is available for the implementation of programs and projects from all levels of government, academia, nongovernmental organizations (NGOs), businesses, and concerned citizens. Implementation occurs at the local community level on both public and private lands with subsequent watershed and regional water quality benefits for the WLEB.
Cities and Towns (taxation and utility fee authority)
• Comprehensive planning. • Zoning ordinances. • Building permits.
16 The ICP is comprised of eight Indiana agencies and organizations who share a common goal of promoting conservation. To that end, its mission is to provide technical, financial and educational assistance needed to implement economically and environmentally compatible land and water stewardship decisions, practices and technologies. The eight entities include: Indiana Association of Soil and Water Conservation Districts (IASWCD) and the 92 SWCDs, State Soil Conservation Board, Indiana State Department of Agriculture (ISDA) Division of Soil Conservation, IDNR, IDEM, Purdue University Extension Service, USDA Farm Services Agency (FSA) and USDA Natural Resources Conservation Service (NRCS). 17 WMPs for Cedar Creek, The Greater St. Joseph River (including Ohio and Michigan portions were approved prior to 2008 as was a TMDL for the St. Mary’s and Maumee rivers.

INDIANA’S GREAT LAKES WATER QUALITY AGREEMENT DOMESTIC ACTION PLAN for the WESTERN LAKE ERIE BASIN
Page 14 of 23
• Infrastructure. o Transportation. o Drinking water. o Wastewater. o Stormwater.
• Parks and Recreation. o Management of city owned public lands.
• Surface water quality monitoring (some). Counties (taxation and drainage assessment authority)
• Comprehensive planning. • Drainage board.
o Legal drains. o Some with MS4 oversight.
• Stormwater (some with MS4 oversight). o Public outreach and education program. o Illicit discharge detection and elimination program. o Construction and post construction stormwater run-off control program. o Pollution prevention and good housekeeping program. o Stormwater pollution prevention plans.
• Wellhead protection. • Source water protection. • Parks and Recreation.
o Management of county owned public lands. • Health Departments.
o Septic system permitting. o Some with surface water quality oversight. o Some with hazardous materials spill response.
• Soil and Water Conservation Districts. o Construction stormwater control plan review and inspection program
(327 IAC 15-5). o Education and outreach. o Technical assistance with conservation planning and practices. o Some provide surface water quality monitoring. o Funding sources include local, state, and federal grant opportunities as well as
partnering with non-governmental organizations for watershed planning and BMP installation.

INDIANA’S GREAT LAKES WATER QUALITY AGREEMENT DOMESTIC ACTION PLAN for the WESTERN LAKE ERIE BASIN
Page 15 of 23
Indiana Department of Environmental Management
• National Pollutant Discharge Elimination System (NPDES) permitting and compliance (327 IAC 5-2-2).
o Municipal, Semi-Public, State, or Federal (sanitary-type discharger). o Industrial. o Pre-treatment. o Constructed wetland (non-rule policy). o Stormwater.
Municipal. Industrial. Construction.
• Wetland CWA §401 water quality certifications and State isolated wetland permitting. • Confined feeding operations & Concentrated animal feeding operations.
o Land application permitting and compliance program. • Surface water and ground water quality monitoring. • Drinking water oversight, wellhead and source water protection plans. • Natural resource damage program. • Watershed programs.
o Total maximum daily load (TMDL): Section 303(d) of the Clean Water Act established authority for the TMDL program designed to determine the extent of impaired waters17F18 and develop reports that identify the causes of the impairment, the reductions of pollutants needed, and the actions needed to improve water quality. The 303(d) List of Impaired Waters is used by IDEM and other ICP cost-share programs to help prioritize watershed restoration activities.
o Nonpoint source program (§ 319(h) and 205(j) grant administration: Named for the portion of the Clean Water Act that authorizes each of these programs, they are federal pass-through grant programs aimed at improving water quality in the state. § 319(h): provides funding for various types of projects that work to reduce
nonpoint source water pollution. Funds may be used to conduct assessments, develop and implement TMDLs and watershed management plans, provide technical assistance, demonstrate new technology and provide education and outreach. Organizations eligible for funding include nonprofit organizations, universities, and local, State or Federal government agencies. A 40 percent (non-federal) in-kind or cash match of the total project cost must be provided.
18 Impaired waters do need meet designated water quality standards and do not support one or more designated uses, such as recreational, protection of aquatic life, drinking water, and fish consumption.

INDIANA’S GREAT LAKES WATER QUALITY AGREEMENT DOMESTIC ACTION PLAN for the WESTERN LAKE ERIE BASIN
Page 16 of 23
205(j): provides for projects that gather and map information on nonpoint and point source water pollution, develop recommendations for increasing the involvement of environmental and civic organizations in watershed planning and implementation activities, and to develop watershed management plans.
Indiana Department of Natural Resources
• Flood control and floodway management (312 IAC 10). o Dams, dikes and levees. o Logjam removal.
• Construction on a public freshwater public lake (IC 14-26-2, 312 IAC 11). • Construction in a navigable waterway (IC 14-29-4). • Mineral extraction from a navigable waterway (IC 14-29-3). • Well construction and withdrawal (IC 25-39, 312 IAC 13). • Invasive species control. • Lake and River Enhancement Grant program (IC 6-6-11-12.5): The goal of the Division of Fish
& Wildlife's Lake and River Enhancement (LARE) Program is to protect and enhance aquatic habitat for fish and wildlife, and to insure the continued viability of Indiana's publicly accessible lakes and streams for multiple uses, including recreational opportunities. This is accomplished through measures that reduce non-point sediment and nutrient pollution of surface waters to a level that meets or surpasses state water quality standards.
Indiana State Department of Agriculture
• InField Advantage (INFA) program: The INFA program is a collaborative opportunity for farmers to collect and understand personalized, on-farm data to optimize their management practices and to ultimately improve their bottom line while benefitting the environment. Participating farmers use precision agricultural tools and technologies such as aerial imagery and the corn stalk nitrate test, to conduct research on their own farms to determine nitrogen use efficiency in each field that they enroll.
• Clean Water Indiana (CWI) grant program: Administered by ISDA under the direction of the State Soil Conservation Board, the CWI is supported through the Indiana cigarette tax revenue on a biannual basis to provide financial assistance to landowners and conservation groups. The financial assistance supports the implementation of conservation practices that reduce NPS sources of water pollution through education, technical assistance, training, and cost-share programs. The program is responsible for providing local matching funds as well as competitive grants for sediment and nutrient reduction projects through Indiana’s SWCDs.

INDIANA’S GREAT LAKES WATER QUALITY AGREEMENT DOMESTIC ACTION PLAN for the WESTERN LAKE ERIE BASIN
Page 17 of 23
• Phosphorus soil sampling program through an U.S. Environmental Protection Agency grant. • Through ICP data sharing, tracking of sediment and nutrient load reductions on all assisted
(cost-share) conservation practices/BMPs using the U.S. EPA Region 5 model. • In cooperation with the Indiana Association of Soil and Water Conservation Districts, the
Conservation Cropping Systems Initiative (CCSI) that focuses on a management systems approach to crop production that results in improved soil and water quality as well as profitability on Indiana cropland.
Natural Resource Conservation Service (the Agricultural Act of 2014 - financial and technical assistance for conservation planning and practice implementation)
• Environmental Quality Incentives Program (EQIP): The EQIP is a voluntary conservation program that helps agricultural producers in a manner that promotes agricultural production and environmental quality as compatible goals. Through EQIP, farmers and ranchers receive financial and technical assistance to implement structural and management conservation practices that optimize environmental benefits on working agricultural land. EQIP is open to all eligible agricultural producers without discrimination or bias.
• Conservation Stewardship Program (CSP): CSP helps farmers build on their existing conservation efforts while strengthening their operations. NRCS can custom design a CSP plan to help farmers looking to improve grazing conditions, increases crop yields, or develop wildlife habitat. NRCS helps farmers schedule timely planting of cover crops, develop a grazing plan that will improve their forage base, implement no-till to reduce erosion or manage forested areas in a way that benefits wildlife habitat.
• Great Lakes Restoration Initiative (GLRI): GLRI helps NRCS accelerate conservation efforts on private lands located in the WLEB. Through GLRI, NRCS works with farmers and landowners to combat invasive species, protect watersheds and shorelines from non-point source pollution and restore wetlands and other habitat areas.
• Wetland Reserve Easements (WRE): The Agricultural Conservation Easement Program (ACEP) provides financial and technical assistance to help conserve agricultural lands and wetlands and their related benefits. Under the Wetlands Reserve Easements component, NRCS helps to restore, protect and enhance enrolled wetlands.
• Western Lake Erie Basin Initiative (WLEB): The WLEB was made a priority area by USDA as agricultural land was determined to be one of the sources of increased phosphorus in surface water due to water and wind erosion.

INDIANA’S GREAT LAKES WATER QUALITY AGREEMENT DOMESTIC ACTION PLAN for the WESTERN LAKE ERIE BASIN
Page 18 of 23
• Regional Conservation Partnership Program (RCCP): The RCPP promotes coordination between NRCS and its partners to deliver conservation assistance to producers and landowners. NRCS provides assistance to producers through partnership agreements and through program contracts or easement agreements. Indiana’s priorities are: water quality, soil quality, and at-risk species habitat.
• Conservation Technical Assistance (CTA): The CTA program provides voluntary conservation technical assistance to landowners, communities, tribes, units of state and local government, and other federal agencies in planning and implementing conservation systems. This assistance is for planning and implementing conservation practices that address natural resource issues. It helps people voluntarily conserve, improve and sustain natural resources.
ARS
• Research and edge-of-field monitoring. United States Geological Survey
• Stream flow gage operation and maintenance. • Stream monitoring. • Edge-of- field monitoring.
Indiana Conservation Partnership
• ICP Accomplishment Reporting: In 2013, members of the ICP adopted the U.S. EPA Region 5 Nutrient Load Reduction Model that determines the sediment, nitrogen, and phosphorus load reductions achieved through conservation practices funded through the afore-mentioned state programs (ISDA’s Clean Water Indiana Program and the IDNR Lake and River Enhancement Program), and the federally funded programs including the IDEM administered Section 319 Program and USDA’s Farm Bill Programs.
• Tillage and cover crop transects. • 4R Nutrient Stewardship and Certification Program.
The Nature Conservancy (funding activities through a combination of public and private grants and donations)
• TNC Western Lake Erie Basin Agriculture Project (tristate). o 4R Nutrient Stewardship Certification Program. o Education and outreach. o Implementation and monitoring work on three miles of two-stage ditch. o Support water quality sampling in the St. Joseph watershed. o Efforts on two-stage ditches led to first cost-share and NRCS practice.

INDIANA’S GREAT LAKES WATER QUALITY AGREEMENT DOMESTIC ACTION PLAN for the WESTERN LAKE ERIE BASIN
Page 19 of 23
WATER QUALITY MONITORING To track Indiana’s progress in meeting its P target loads on the Maumee River, the Advisory Committee has determined that the most representative site is at Antwerp, Ohio, which is 7.6 river miles downstream of the Indiana border. The USGS operates both a stream-flow gage and an auto-sampler there, and follows the recommended Annex 4 protocol with collection of the necessary parameters (See Figure 4). Originally, the Advisory Committee proposed using the IDEM and Allen County Soil and Water Conservation (SWCD) fixed station site on State Road 101, which is 5.6 river miles upstream of the border; however, this site misses some of Indiana’s pollution contribution as interceptor ditches on each side of the Maumee River discharge downstream of this location. Field reconnaissance revealed that there is no safe, accessible site directly on the Indiana border and that land use from the border to Antwerp is consistent with land use from State Road 101 to the border making it the best site. Results for TP at the Antwerp site calculated by the Ohio USGS show that the FWMC has been two to three times higher than the value calculated from the IDEM fixed station site at SR 101 over the Maumee.19 While a difference is not surprising given the greater frequency of collection at the Antwerp site which captures high-flow events, the magnitude is significant. This finding suggests that increased resolution of monitoring at the Ohio-Indiana border on both the St. Joseph and St. Mary’s rivers via auto-samplers will reveal similar increases, and/or there is significant phosphorus loading downstream of SR 101 prior to the Antwerp site. These hypotheses will be tested by establishing a network of auto-samplers. To optimize resources and establish a regional network, IDEM, Indiana USGS, Ohio Environmental Protection Agency (OEPA), Ohio Department of Natural Resources (ODNR), Ohio USGS, and U.S. EPA Region 5 are collaborating on monitoring activities. Ohio will continue to support the USGS monitoring activities at Antwerp and is supporting the addition of a USGS continuous monitoring multi-parameter sensor there that will provide real-time data via the USGS website. To characterize their respective contributions of phosphorus loads across their borders, Indiana and Ohio establish as priorities the following new monitoring sites:
• The St. Mary’s River at Wilshire, OH. Ohio will fund USGS auto-sampler monitoring through a U.S. EPA Great Lakes Restoration Initiative (GLRI) grant for a minimum of three years.
• On the St. Joseph River at Newville, OH. Ohio will fund USGS auto-sampler monitoring through a U.S. EPA GLRI grant for a minimum of three years.
• The St. Mary’s prior to its confluence with the St. Joseph to form the Maumee. Indiana will fund USGS auto-sampler monitoring through a U.S. EPA GLRI grant for a minimum of three years. The purpose of this sampling is better characterize nutrient loading on the St. Mary’s within Indiana’s borders. The autosampler will be located at the current IDEM sampling location at Ferguson Road. This site has a drainage area less than 1 percent different than
19 http://lakeerie.ohio.gov/

INDIANA’S GREAT LAKES WATER QUALITY AGREEMENT DOMESTIC ACTION PLAN for the WESTERN LAKE ERIE BASIN
Page 20 of 23
the USGS streamgage and can be considered co-located. Water-quality samples will be collected at low-, moderate-, and high-flow conditions during routine monthly and event trips.
Table 3. Water Quality Monitoring Parameters that are/will be Collected and Frequency
Parameters
Number of samples per visit
Approximate number of samples per year at each site
Notes
Total Kjehldahl Nitrogen (mg/L-N) [TKN] Total nitrogen (mg/L-N) [TN] Dissolved ammonia (mg/L-N) [NH4] Dissolved nitrate + nitrite (mg/L-N) [NO3+NO2] Orthophosphate (mg/L-P) [PO4] Total phosphorus (mg/L-P) [TP] Suspended sediment (mg/L-P) [SS]
Equal-width
increment sample
Autosampler
Sample Type
Monthly samples 1 sample 1 sample About 24 May coincide with even samples. Drought, ice, or other unfavorable conditions may impede the collection of monthly samples.
Event samples
(5–8 events)
1 sample 4 – 6 samples 20 – 48 May coincide with monthly samples.
Selected baseline samples
- 1 sample 2 – 8 Autosampler triggered before an event.
Selected smaller events
- 1 – 4 samples 2 – 8 Autosampler samples picked up after a smaller event.
MEASURING AND REPORTING PROGRESS Indiana is participating in the Great Lakes Commission (GLC) pilot project for the WLEB to develop a consistent reporting framework, entitled Erie Stats, for the states and Ontario to report their progress in meeting the Great Lakes Water Quality Agreement (GLWQA) lake ecosystem objectives. The first product of that pilot will be available in December of 2017. Toward that end, Indiana has provided the GLC with its current and proposed tracking tools for consideration in developing ErieStats.

INDIANA’S GREAT LAKES WATER QUALITY AGREEMENT DOMESTIC ACTION PLAN for the WESTERN LAKE ERIE BASIN
Page 21 of 23
Indiana plans to continue using the following methods for tracking and annually reporting its progress:
• Ambient water quality monitoring data for the fixed station grab sample sites operated at the state, local, and municipal levels. The reporting frequency for the USGS auto-sampler sites will be at least annually.
• Edge-of-field monitoring data. • Tillage and cover crop transect data. • The nutrient load reductions calculated using the Region 5 BMP load reduction model
for all ICP assisted conservation practices. • POTW discharge monitoring reports are submitted monthly and will graphed annually. • Pertinent information from MS4 annual reports will be compiled and reported annually. • LTCP pertinent progress will be reported annually. • Cost-share program project milestones and updates.
In addition to the monitoring and reporting noted above, the DAP Action/Milestone Table (Appendix 1) includes the various project implementation schedules and where feasible, the nutrient load reductions associated with those activities. The year 2020 will serve as a checkpoint for cross-referencing the expected rates for BMP implementation and their modeled load reductions with edge-of-field and ambient water quality data to see how effective the programs and BMPS are. This will serve as an opportunity for adaptive management and any necessary shifting of priorities or approaches. Adaptive Management20 Vital to Indiana’s success in implementing this DAP is an adaptive management strategy that tests the hypotheses put forth in the DAP and applies the lessons learned therefrom to future management decisions.
20 An adaptive management plan will be included as an appendix to this DAP after the 12-digit HUC watershed prioritization process is complete and prior to its finalization by February 2018.

INDIANA’S GREAT LAKES WATER QUALITY AGREEMENT DOMESTIC ACTION PLAN for the WESTERN LAKE ERIE BASIN
Page 22 of 23
Figure 5: Adaptive Management
Indiana will continue to participate on the Annex 4 overarching binational subcommittee and with its related task teams and work groups to stay abreast of the evolving science, to provide input, and to seek further direction for continued efforts in addressing nutrient related problems in Lake Erie. If new data and information evaluated within the context of the current assumptions and management strategies for Lake Erie (and the WLEB in particular) determine that phosphorus or other targets need to be adjusted, Indiana will take that into account for modifying its DAP. Outcomes will be appraised as they manifest and will be reported at least annually with Indiana assessing its progress in meeting the goals of this DAP in the last quarter of 2020. Based on that evaluation, the priorities, next steps, and necessary adjustments will be included in a revised DAP within the first quarter of 2021, with a revision cycle of every five years.21
21 The DAP and the Action/Milestone Table will be web-based. Defined as “dynamic documents,” they will updated as new information/data, research findings, and activities evolve. A pdf of the final DAP of February 2018 will be stored on the website to allow for comparisons.

INDIANA’S GREAT LAKES WATER QUALITY AGREEMENT DOMESTIC ACTION PLAN for the WESTERN LAKE ERIE BASIN
Page 23 of 23
Future Endeavors and Resource/Research Gaps Listed in the DAP Action/Milestone Table (Appendix 1) are specific projects or actions to be carried forth or initiated in the next few years. Listed here are concerns as well as information gaps for which data or research is needed or for which possible actions should be taken:
• Use Erie Stats upon its development and assess its utility for guiding Indiana’s actions to reduce phosphorus to Lake Erie via the Maumee.
• Participate in the Erie P Trading pilot project for WLEB. o Seek compliance at incremental level for an industrial discharger, meaning that an
industrial discharger that is very close to achieving the 1 mg/L TP effluent limit may trade to achieve full compliance.
o Stewardship- “adopt an acre” campaign. • Examine reports of manure mishandling and runoff from unregulated livestock operations
and develop a response process. • Support rigorous enforcement of environmental regulations. • Compile drain maintenance schedules and plans. • Map wetland and floodplain restoration opportunities. • Convene a WLEB multi-county septic system workgroup. • Seek establishment of a federal/binational funding source for a long-term Lake Erie
monitoring network. • Install more auto-samplers at the 12-digit HUC level. • Implement additional edge-of-field monitoring projects. • Support/conduct social indicators research on the adoption of BMPs, particularly water
drainage management. • Support/conduct research on water drainage management. • Continue to support research on nitrogen’s role in hazardous algal blooms.
Success in the WLEB Watershed nutrient pollution in the WLEB is a complex, multi-faceted problem caused by point and nonpoint sources across all sectors of our community. It affects not only those who live, work or recreate in the watershed, but also the ecosystem and economics of the region. To successfully address this problem, a multi-faceted approach is required that includes using existent regulatory instruments and implementing a strong system of voluntary best management practices. Hoosiers are making a positive difference by managing nutrients on their lawns and farms; building healthy soils; and restoring wetlands, floodplains and streams. Will you be part of the solution?

APPENDIX 1
ACTION/MILESTONE TABLE

1
Indiana’s Domestic Action Plan (DAP) - Milestone and Action Table August 13, 2017
Objectives/Goals Action/Activity Tools/Resources Responsible Parties
Target Date
Target Load Reduction
Status & Results, as applicable
Draft DAP ready for public notice 1. Develop draft DAP, as well as Milestone and Action Table
2. Develop PN with questions for comment period (60 days)
3. Post draft DAP and Milestone and Action Table for PN and comment period.
1. Advisory Committee
2. IDEM 3. IDEM, ISDA,
and Advisory Committee
8/14/2017 In progress
Determine priority areas Use monitoring data Map, WMP critical areas, NRCS P export spreadsheet, and all ambient WQM data
Water quality data, GIS, and NRCS spreadsheet
Agencies completing monitoring and Advisory Committee subcommittee
11/2017
Programs/Projects
Restore Natural Hydrology and Ecological Functions Rethinking Drainage for the 21st Century workshop
1. Workshop with county surveyors and drainage professionals to learn about activities and barriers
2. The goal is to establish an innovative drainage pilot project
Staff time, travel, and meeting and implementation expenses
The Nature Conservancy and Purdue Extension
6/22/2017 New initiative

2
Point Source, Urban LTCP (outlined at https://www.cityoffortwayne.org/utilities/162-clean-river-team/3208-long-term-control-plan.html)
Reduce CSOs Staff time and implementation expenses
City of Fort Wayne
In progress
Stormwater NPDES MS4 Permit (refer to IDEM website)
Manage stormwater discharges Staff time and implementation expenses
City of Fort Wayne and co-permittees
In progress
Municipal NPDES permit Provide guidelines and standards for water quantity and quality management (refer to City of Fort Wayne website for more information)
Staff time and implementation City of Fort Wayne Utilities expenses
City of Fort Wayne Utilities
In progress
Nonpoint Source, Urban Local ordinances and technical design standards
Provide guidelines and standards for water quantity and quality management (refer to City of Fort Wayne website for more information)
Staff time and implementation expenses
City of Fort Wayne Utilities
In progress
Revegetate urban stream banks with native plants in the Upper Maumee River
Work with local non-profits to organize native planting opportunities for the community
Two to three community events per year
Save Maumee In progress
Install 2,800 linear feet of riparian buffers with woody vegetation in three Upper Maumee critical subwatersheds; Trier ditch (04100005010010), Bullerman (04100005010040), and Six-mile Creek (04100005010060)
Organize three native tree planting opportunities for the community
Work with local non-profits
Save Maumee One GLRI grant completed, second has been implemented
Nitrogen 426.66 lb/yr, phosphorus 253.32 lb/yr, and sediment 253.34 tons/yr

3
Nonpoint Source, Rural St. Marys River Watershed Initiative implementing a paired watershed monitoring project, including the Weber Ditch (041000040502) and the Nickelsen Creek (041000040503) sub-watersheds
1. Develop and implement a watershed-wide coordination program
2. Develop and implement a targeted education and outreach program
3. Develop and implement targeted social indicator surveyors
4. Perform and complete paired watershed monitoring and modeling
5. Perform and complete soil health monitoring
1. Three project databases including a water quality sample and conservation practice location database, a watershed conditions database, and a water quality database
2. Project website and social media interfaces, e-newsletter, press releases, conservation practice demonstration workshops, field days, and tours
3. Targeted social indicator surveys
4. QAPP, monitoring program including equipment and protocols, and targeted watershed (L-THIA-LID) model
1. Project Coordinator, project partners, and Technical Committee
2. Project coordinator and Education and Outreach Committee.
3. Project coordinator
4. Project coordinator and Technical Committee
5. Project coordinator and Technical Committee
5/2021 In progress
Support InField Advantage program by working with participants on data collection and nutrient stewardship (http://www.infieldadvantage.org/)
Help landowners/producers participating in the program to understand their nitrogen management plan Groups participating include: 1. INWL – WLEB group 2. INWA – Adams/Wells group 3. INST – Steuben/LaGrange
group
Group leaders time, ISDA staff time, and farmer/producer participation
ISDA and Group Leaders
In progress

4
Reduce phosphorus loss risk from 10,000+ acres cropland
Upper Maumee Phosphorus-Risk Pilot project
Section 319(h) grant Allen County SWCD
12/31/2018 4,800 tons sediment, 8,300 lbs phosphorus, and 16,300 lbs nitrogen
Taking 1st round of applications (25% complete)
Reduce streambank erosion, repair streambank damage, and improve wildlife habitat through the City of Auburn
Complete feasibility study on Cedar Creek from Morning Star Road to Eckhart Park
IDNR LARE grant DeKalb County Government
7/31/2017 Grant applied for
Reduce nutrient loading from failed septic systems
Lead septic issues, as well as update of ordinance as Steering Committee working with the Health Department and Commissioners
Updated Onsite Sewage System and Installation Ordinance
DeKalb County Health Department, Septic Issues Steering Committee, and DeKalb County Commissioners
Summer of 2017
Has been in process for nearly three years and public information sessions held 5/25/17
Reduce nutrient loading from failed septic systems
Provide cost-share funds for assisting with repair/ replacement of septic systems
DeKalb SWCD cost-share program
DeKalb SWCD Supervisors and DeKalb County Health Department
Program started 15 years ago, two applications approved, and one payment made since 1/1/2017
Reduce sediment and nutrient runoff through adoption and installation of conservation practices
Cover crops, gypsum application, blind inlets, and streambank stabilization
2017 CWI grant DeKalb and Steuben County SWCDs
12/31/2019 Grant started 1/1/2017
Reduce sediment and nutrient loading through installation and adoption of watershed land treatment practices
Administer grant and allocate funds for producers
2015 LARE grant DeKalb SWCD In progress ($20,000 streambank project with County Surveyor)
Establish woody plants for long-term erosion control and improvement of water quality, enhancing aesthetics, and wildlife habitat
Fourteen acres of trees planted within the West Branch, Fish Creek subwatershed
District cost-share funding
Steuben County SWCD and landowners
Completed 2016 and 2017

5
4R Nutrient Stewardship Certification program
Reach out to WLEB retailers and CCAs to enroll in program, as well as encourage statewide adoption of program in Indiana
Staff time and travel The Nature Conservancy, Ohio Agribusiness Association, and Nutrient Stewardship Council
80% of farmed acres under certified management by 2020
Research in progress TBD, and goal is 40% reduction of TP and DRP by 2025
Indiana has one certified facility and is in dialogue to start a 4R program
Demonstration BMPs and field research sites
Identify willing landowners, apply for grants, install BMPs, and engage universities in on-farm research
Staff time, travel, design and installation of practice, water quality, and ecological sampling
The Nature Conservancy, landowners, and researchers
2008-2013 installation, on-going monitoring
1. 4,800lb/yr N, 2,400lb/yr TP, and 2,400 tons/yr Sediment
2. Goal is 40% reduction of TP and DRP by 2025
1. Efforts resulted in two-stage ditch becoming EQIP-approved practice in 2011 and Ohio in 2012
2. Three miles of two-stage ditch
Soil Health Partnership Identify willing landowners, attend field days, and share results
Staff time and travel The Nature Conservancy, landowners, Soil Health Partnership, and local SWCDs
2015, on-going
1. Research in progress
2. Goal is better yields with less inputs
In progress (five to ten years of research collected on tillage, nutrient management, and cover crops)
InField Advantage program Adams County SWCD
2015, 2016, and 2017
Five producers in 2015, 2016, and 2017
Seeing Green: Fields and Profits conservation day
Adams County SWCD
2017
Monitoring Secure GLRI grant for auto-sampler on the St. Marys River
Submit application IDEM with specifications and budget from USGS
11/18/2016 Completed

6
Add capacity to sample for dissolved reactive phosphorus (DRP) laboratory analysis
Secure laboratory equipment for the Indiana State Department of Health (ISDA)
MOU between IDEM and ISDH, as well as IDEM lab account funding
IDEM and ISDH 3/31/2017
100% Funds secured and 50%-MOU TBD
Collect DRP at IDEM fixed stations in the WLEB
Investigate necessary resources for collecting and analyzing for DRP
Time and travel study IDEM 2/28/2017 Complete
Collect total phosphorus, DRP, and nitrate-nitrite samples at 27 sites during recreational season
Tri-State Watershed Weekly Water Quality Monitoring program
TSWA, SJRWI, City of Fort Wayne, USDA ARS, and Allen SWCD support
TSWA and Allen SWCD
4/1/2017 thru 10/31/2017
Weekly monitoring currently underway
In-stream water quality Monthly and storm grab samples at locations within Fish Creek watershed
Staff time, travel, lab work (St. Joe’s Watershed Initiative, Steuben County SWCD, and Joyce Foundation
Steuben County SWCD and the Nature Conservancy
2014, 2015, 2016, and 2017
Data collection in process
In progress, final report 11/2017
Ecology of two-stage ditches Macroinvertebrate sampling at constructed two-stage ditch sites in St. Joe’s watershed
Staff time, travel, and lab work (IPFW and Joyce Foundation)
IPFW and the Nature Conservancy
2015, 2016, and 2017
In progress, final report 11/2017
In-stream water quality Weekly sampling during recreation season and monthly sampling during non-recreation season at ten locations
Staff time, travel, and lab work
City of Fort Wayne Utilities
Annually In progress
Education and Outreach Use the WLEB GIS Story Map to showcase the conservation and monitoring activities going on in the Indiana WLEB watershed (WLEB Story Map is located at http://isda.maps.arcgis.com/apps/MapSeries/index.html?appid=75881b3341714bc28b5d820405accacb)
Update Story Map annually, as necessary
ISDA staff
ISDA In progress
Promote 4R Nutrient Stewardship certification program in the WLEB working with Indiana Ag retailers and CCAs
Certify more Indiana Agriculture Retailers and CCAs within the Indiana WLEB watershed; ISDA and ICP to support Indiana Agribusiness Council (ACI) and Ag retailers in promotion of 4Rs
1. 4R promotional materials
2. Utilize field days to promote program
ICP staff, WLEB Partnership, ISDA, IN ACI, TNC, and Purdue Extension
7% complete, in progress

7
Continue to conduct the spring cover crop and tillage transect survey in the counties in the WLEB
Partnership staff in Adams, Allen, DeKalb, Noble, Steuben, and Wells counties will conduct this transect in the spring following planting on an annual or bi-annual basis
ICP staff and time ICP April through June, every two years
http://www.in.gov/isda/2383.htm
Continue to conduct the fall cover crop and tillage transect survey in the counties in the WLEB
Partnership staff in Adams, Allen, DeKalb, Noble, Steuben, and Wells counties will conduct this transect annually in the fall following harvest
ICP staff and time ICP October through December, annually
http://www.in.gov/isda/2383.htm
Report the nutrient load reductions for all ICP assisted conservation practices within the WLEB on an annual basis
ISDA staff will use the Region 5 Model to analyze practices and show sediment and nutrient load reductions
Region 5 Model and ISDA staff time
ISDA and ICP March, annually
Annual reduction goals are sediment 34,000 tons/yr, Nitrogen 86,000 lbs/yr, and phosphorus 42,000 lbs/yr
http://www.in.gov/isda/3261.htm
Provide soil health education to 100+ farmers, retailers, and CCAs
Seeing Green: Fields and Profits conservation day
NRCS GLRI grant, Soil Health Partnership (SHP), and Upper 319 grant
NRCS NE Area, SHP, and Allen SWCD
8/10/2017
Educate producers on production practices related to water quality issues in the WLEB
Annual agronomy field day, held in conjunction with The Andersons, Purdue Extension, and surrounding SWCDs
Partial funding provided through 2015 and 2017 CWI grants
DeKalb and Steuben Counties
7/19/2017
Educate the public on the WLEB issues
Planned and implemented the Watershed-n-Spread event; food tasting provided by local vendors. Dr. Chad Penn presented “WLEB: the perfect storm”
Completed as part of the programing efforts of the SJRWI
SJRWI, Purdue Extension, City of Auburn, and DeKalb SWCD
3/2/2017 20 people in attendance
Educate producers/landowners on production/urban practices related to water quality issues in the WLEB
Annual meeting, presentations, various district workshops, and educational materials
Funding provided through District Base of Operations
Steuben County SWCD
2015, 2016, and 2017
Hundreds impacted
Public education on best management practices, soil health, watersheds, water quality, and pollinators
Booth at Steuben County 4H Fair Staff time, travel, and exhibitor fees
Steuben County SWCD
2015, 2016, and 2017
Hundreds impacted

8
Youth education Educational materials provided on pollinators, soil health, trees, water quality, and summer conservation camps
Staff time, travel, and educational material fees
Steuben County SWCD and NE Indiana Conservation Districts
2015, 2016, and 2017
Average of 1,450 students, annually
Youth education for 32 years, hands-on educational event for 4th grade students of the Metropolitan School District of Steuben County to teach soil health water quality, and other conservation-related subjects
4th grade youth conservation field day
Staff and volunteer time, travel, and educational material fees
Steuben County SWCD
2015, 2016, and 2017
Average of 300 students, annually
Educate homeowners/landowners urban practices related to water quality issues in the Maumee WLEB
Promote urban BMPs for storm water management from streets, parking lots, and other impervious pavement surfaces to community members and homeowners in the city
Funding through grants and in-kind donations
Save Maumee, City Utilities of Fort Wayne, ACPWQ
In progress
Partner with local non-profits to harvest and collect native seeds
Seed harvest event in wetland, preserve, or natural habitat
Public and private land owners, as well as one to two local groups
Little River wetlands project, ACRES Land Trust, Save Maumee
2017, annually
In progress
Work with local non-profits to organize community urban stream bank restoration projects within the upper Maumee watershed
Collect/purchase 100 lbs native seeds to be planted on the stream and riverbanks
One to two active local community non-profit groups
Save Maumee 2 seed harvest projects, annually
In progress
Work with local non-profits to organize community urban streambank restoration projects within the upper Maumee watershed
Collect/ purchase 1,100 native trees to be planted on severely eroded riverbanks and streams; secure GLRI funding
One to two active local community non-profit
Save Maumee Two projects in April and October, annually
Nitrogen 426.66 lb/yr, phosphorus 253.32 lb/yr, and sediment 253.34 tons/yr
Sponsor and present at soil health, 4R, and farmer working group field days and events in IN
Two to three events/year, serve on Tri-State Watershed Alliance Board, and sponsor and help host annual expo
Staff time, travel, and sponsorship/exhibitor fees
The Nature Conservancy and event partners
2012 In progress (direct contact with 1,000 WLEB stakeholders)

9
Youth education River Camp Hoosier Riverwatch, GoFishIN, and Project WET (education ages 8-12)
FWP&R, Environmental Resources Center, and ACPWQ
July 5-8, 2016 and August 7-11, 2017
Youth and adult education Johnny Appleseed Festival Project WET, Project Wild, and HWHP (child and adult)
ACPWQ and Central Lions
September 19-20, 2015, September 17-18, 2016, and September 16-17, 2017
Youth education Izaak Walton League Conservation Camp
Project WET and Hoosier Riverwatch (ages 6-16)
IWL and ACPWQ 6/25/2015 and 6/23/2016
Youth education Envirothon/aquatics Hoosier Riverwatch (G10-12)
NE IN Schools, SWCDs, NRCS, IDNR, and ACPWQ
3/19/2015 and 3/17/2016
Youth education Canterbury Day of Service Project WET and Hoosier Riverwatch (G5-8)
Canterbury MS, TSWA, and ACPWQ
5/20/2015, 5/26/2016, and 6/7/2017
Provide education on cover crops, wetlands, filter strips, and wildlife habitat and water quality issues
Land management field day CREP and Region 5 Model
Adams County SWCD, DNR, Little Turtle Wetland, NRCS, Davey Resources, National Turkey Federation Foundation, and ISDA
2015 37 participants
Education on water quality and how everyone is effected by our actions, overall pasture health, and identification of grasses and legumes
Pasture walk at Amish farm, Amzie Schwartz
Cooperative Amish Outreach grant
Adams County SWCD and NRCS
7/20/2015 50 participants

10
Public education on BMPs, soil health, watersheds, water quality, and pollinators
Booth at Adams County 4H Fair Adams County SWCD
2015, 2016, and 2017
Thousands impacted
Hands-on education including the following topics grasses and legumes, what are water quality issues and how can we fix them, and temporary type seeding
Pasture walk on Amish Farm at Merlin Schwartz
Cooperative Amish Outreach grant
Adams County SWCD, NRCS, and ISDA
10/21/2015 15 participants
Youth education Earthworms, investigating soil health, frogs, owls, butterflies, and trees
Adams County SWCD
2015, 2016, and 2017
2015 (397 students), 2016 (902), and 2017 (1062 students)
For 22 years, all 6th graders from public, parochial, and homeschool attend to learn lessons in conservation
Splash event: watershed, common water, trees, pollinators, earthworms, nematodes, and soil health
Adams County SWCD
2015 through 2017, annually
1220 6th graders
Education on drainage water management, soil health, soil pit, cover crops, cover crop panel composed of SWCD board, livestock management, economics of manure, NRCS and ISDA opportunities and funding, 4Rs, and water quality
Getting Back to Your Roots field day at Mike Werling’s Farm
Mike Werling’s hub farm, 4Rs, CCSI Pork Producers, and 1st Bank of Berne
Adams & Allen County SWCDs, CCSI, ISDA, NRCS, and Purdue Extension
8/24/2016 117 participants
1. Education on Amish farm on cover crops, soil health, water quality, investigated five cover crop plots previously planted by SWCD
2. Discussed manure value and management and IN Chemist guidelines
3. NRCS promoted technical support opportunities
4. Demonstration of horse-drawn hi-boy seeder and Esch no-till drill
Cover Crop field day at Menno MN Schwartz & Ruben MN Schwartz
Amish Outreach grant Adams County SWCD, Cisco Seeds, IN Pork Producers, CCSI, Farm Bureau, NRCS, ISDA, and Purdue Extension
9/28/2017 57 participants

11
Pasture grasses ID and management, education on phosphorous levels, supplemental pasture, cover crops, grazing aspects, no-till vs. conventional seeding, and paddock design and fencing materials
Pasture Walk at Nick Schwartz Amish Outreach grant Adams County SWCD
7/5/2016 20 participants
Promotion of planting of cover crops to help with phosphorous levels in WLEB among the Amish community
Purchase of Betterway hi-boy seed spreader
Demo Farm grant Adams County SWCD and NRCS
6/2016
Provide education material on an 8th grade level to explain the WLEB and our actions affect others (promotes BMPs)
Adams County Watershed booklet
Amish Outreach grant Adams County SWCD, NRCS, and ISDA
2016 200 have been dispersed.
Provide education on how the watersheds are connected and effected one another
Adams County Watershed Maps booklet
Amish Outreach grant Adams County SWCD, NRCS, and ISDA
2016
Education on cover crops and how it helps phosphorous levels on farms
Cover Crop PARP meeting Center Seeds Center Seeds, Purdue Extension, and Adams County SWCD
2016 125
Public promotion of soil health and water quality (combined annual meeting of SWCD, Farm Bureau, and Pork Producers)
Ag extravaganza Adams County SWCD, Pork Producers, and Farm Bureau
2007 through 2017
Average 160 to 200/yr
Education of proper management of manure and reducing our phosphorous and education on value of manure and the IN State Chemist standards
Winter ag meeting Amish Outreach grant Adams County SWCD, NRCS, and ISDA
3/1/2017 33 participants
Positives of soil health, rotational grazing, identification of soil types, hay and pasture seeding, cover crops
Pasture walk at Amish farm, Mervin I. Schwartz
Amish Outreach grant Adams County SWCD, NRCS, and ISDA
4/26/2017 20 participants

12
Designed and provided written educational material to encourage proper management of manure and how it affects phosphorous in the soil
Manure Management Practices booklet
Amish Outreach grant Adams County SWCD, NRCS, and ISDA
2017 100s dispersed
Educational opportunity to local producers on importance of cover crops and soil health
Cover crop meeting Center Seeds Center Sees, Purdue Extension, and Adams County SWCD
2017 120 participants
Designed and disbursed nutrient management packets to encourage manure management and to ease record keeping for our producers
Nutrient management packets Amish Outreach grant Adams County SWCD, NRCS, and ISDA
2017
Provide assistance to local small farmers for cover crops and education on benefits of cover crops
Cover crop discount program Demo Farm grant Adams County SWCD, NRCS, and ISDA
2017
Education on importance of soil testing and the levels of phosphorous, soil health and best management practices are encouraged, as well as follow-up meeting to interpret test and provide aerial map of farm
Soil testing Amish Outreach grant Adams County SWCD, NRCS, and ISDA
6/2015 through 6/2017
110 tests
Education on the importance of manure and its value and a follow-up farm visit
Manure tests Amish Outreach grant Adams County SWCD, NRCS, and ISDA
6/2015 through 6/2017
16 tests
Hands on education including supplement or emergency pasture seeding, hay and pasture fertilization, and horse-drawn rental equipment demonstration
Pasture walk at Amish farm, Nicodemus D. L. Schwartz
Amish Outreach grant Adams County SWCD, NRCS, and ISDA
6/14/2017 15 participants
Provide education on WLEB, phosphorous levels in our area, and water and marine life testing
OSU Stone Lab tour on Lake Erie Demo Farm grant Adams County SWCD, NRCS, and ISDA
6/2017 27 participants (21 Amish)

13
Two meetings (am and pm) regarding education on WLEB, effects on phosphorous, water quality, and benefits and use of gypsum
Connect the Dots water quality meeting
Amish Outreach grant, Dr. Chris Winslow
Adams County SWCD, NRCS, and ISDA
3/14/2016
Promote use and benefits of cover crops and no-till practices, specifically drill being modified to be pulled by horses or tractor
Purchase of new Land Pride 7’ no-till drill
Demo Farm grant Adams County SWCD and NRCS
6/2017
Hands-on education including fall seeding hay and pasture crops, selecting seed mixes, how/when to seed, and demo of new no-till drill
Pasture walk at Pasture Delights farm
Demo Farm grant Adams County SWCD and NRCS
8/23/2017 TBA
Hands-on education, including getting pasture ready for next year, soil testing and fertilization, ensure healthy plants for winter, fall cover crop seeding – select seed, when to seed, plans for winter frost seeding, and rental equipment demonstration
Pasture walk at Amish farm, Lucas J. Schwartz
Demo Farm grant Adams County SWCD and NRCS
9/30/2017 TBA
Provide education on WLEB, phosphorous levels in our area, as well as water and marine life testing
OSU Stone Lab tour on Lake Erie Demo Farm grant Adams County SWCD and NRCS
9/15/2017 TBA
City of Fort Wayne Utilities Speakers Bureau, provide speakers on a variety of stormwater and water quality related topics to neighborhood groups and other organizations
Speakers available to discuss stormwater and water quality related topics
Staff time, as well as meeting and material expenses
City of Fort Wayne Utilities
In progress
Hands-on rain garden workshops and incentives for City of Fort Wayne residents to install a rain garden
Hands-on rain garden workshop held locally in Fort Wayne to provide rain garden and stormwater education
Staff time, meeting and material expenses, travel expenses, and incentives to Fort Wayne residents
City of Fort Wayne Utilities
Annual meetings typically held in spring
In progress

APPENDIX 2
IDEM FIXED STATION
WATER QUALITY DATA ANALYSIS

Analysis of Total Phosphorus at Fixed Station Sites in the Lake
Erie Basin (2008-2015)
1

Information• There are Fixed Station data from the St. Joseph River (4), the Maumee River (3), Saint Mary's
River (5), Cedar Creek (1), and Fish Creek (2). • Currently only 12 of these sites are actively being monitored• Three sites were moved due to safety hazards
– LES060-0004 moved to LES-06-0003 (~0.5 miles apart)• These sites were considered comparable in this analysis due to the close proximity and BPJ of fixed station field staff.
– LEJ100-0002 moved to LEJ-08-0005 (~4 miles apart)• These sites were NOT considered comparable in this analysis.
– LES060-0005 moved to LES-06-0009 (~1.5 miles apart)• These sites were considered comparable in this analysis due to the close proximity and BPJ of fixed station field staff.
2

Analysis• The USGS Load Estimator (LOADEST) model (both the Purdue Interface and USGS Desktop
Application) were used to estimate annual loads and load reductions needed based on a 0.23 mg/L Total Phosphorus concentration.
– Given a time series of streamflow, fixed station data and the target concentration (0.23 mg/L) LOADEST develops a regression model for the estimation of loads (calibration). The formulated regression model then is used to estimate loads over a user specified time interval (estimation). Mean load estimates, standard errors, and 95% confidence intervals are developed on a monthly and seasonal basis.
– The Adjusted Maximum Likelihood Estimation (AMLE) method was used for these graphs.
– The Purdue Web-based Load Calculation using LOADEST interface (https://engineering.purdue.edu/~ldc/LOADEST/)and the USGS LOADEST model were used in this analysis. The Purdue interface is easier to use but we calculated loads using both models to ensure the results were accurate.
• Fixed Station data were queried from the IDEM AIMS II database.• Information from the most representative USGS stream gage was used in the LOADEST
model.• Mean annual loads were estimated using data from 2008 to present.• Precipitation data found on the Indiana State Climate Office webpage
(https://climate.agry.purdue.edu/climate/index.asp) from Station Decatur 1 N (IN) along the Saint Mary's River.
3

4

Cedar Creek at Hursh Road BridgeLEJ090-0026 (CC-4)
• Flows into the St. Joseph River downstream of site LEJ060-0006 and upstream of site LEJ100-0002
• USGS stream gage on Cedar Creek near Cedarville, IN (04180000) used in the analysis of this site. Drainage Area ratio is 1.002 (100%).
LOADEST Results
Beginning Date Ending Date FlowData 1946 - 10 - 30 2016 - 6 - 26
Water Quality Data 2008 - 01 - 22 2016 - 04 - 05
Total (lb/yr) Per Acre (lb/ac/yr)Estimated Annual Load 170,597 0.99
Maximum Annual Load to Meet Target 124,209 0.72Load Reduction Needed to Meet Target 46,387 (27%) 0.27
Average Annual Seasonal Load 112,149
5

6

7

Cedar Creek (LEJ090-0026) Results• The load duration curve shows most sampling events that exceeded the
water quality target of 0.23 mg/L occur during very high flow events. This is often an indicator of precipitation driven, non-point source pollution.
• Total phosphorus concentrations have remained constant from 2005-2014.• An annual load reduction of 27% (46,387 lbs./ year) is needed to meet
target (0.23 mg/L) annual loads. • Though precipitation increased (increasing trend) from 2013 to 2015, total
phosphorus loads have remained relatively low and constant (between 60-80 tons).
• During the 8-year study focus (2008-2015), the average annual load exceeded the target load 6 years (75%).
8
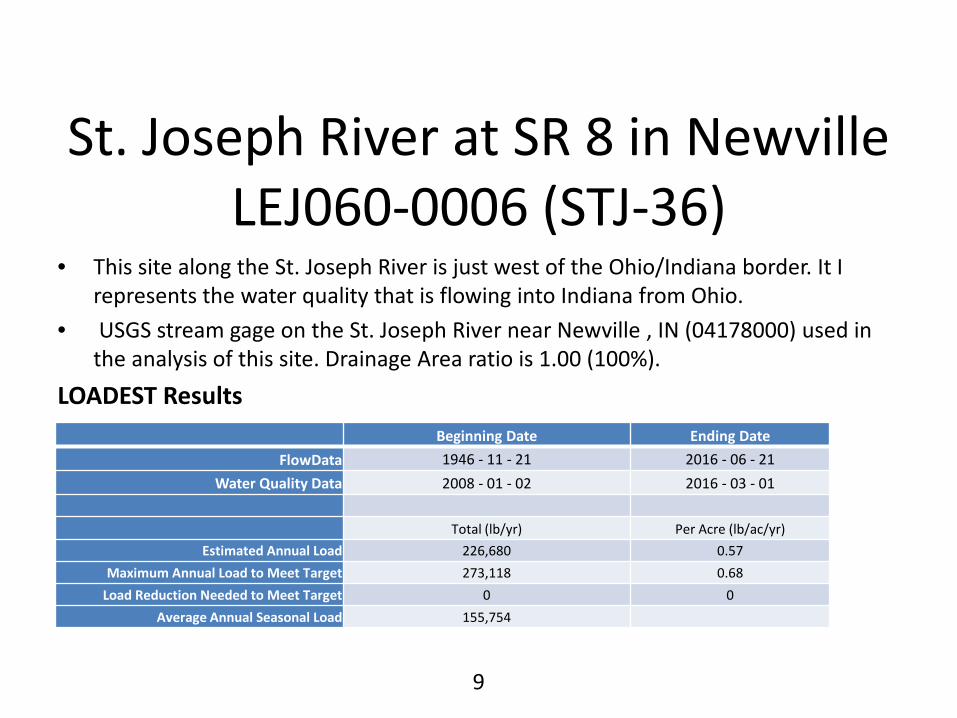
St. Joseph River at SR 8 in NewvilleLEJ060-0006 (STJ-36)
• This site along the St. Joseph River is just west of the Ohio/Indiana border. It I represents the water quality that is flowing into Indiana from Ohio.
• USGS stream gage on the St. Joseph River near Newville , IN (04178000) used in the analysis of this site. Drainage Area ratio is 1.00 (100%).
LOADEST ResultsBeginning Date Ending Date
FlowData 1946 - 11 - 21 2016 - 06 - 21 Water Quality Data 2008 - 01 - 02 2016 - 03 - 01
Total (lb/yr) Per Acre (lb/ac/yr)Estimated Annual Load 226,680 0.57
Maximum Annual Load to Meet Target 273,118 0.68Load Reduction Needed to Meet Target 0 0
Average Annual Seasonal Load 155,754
9

10

11

St. Joseph River (LEJ060-0006) Results• The load duration curve shows most sampling events that
exceed the water quality target of 0.23 mg/L occur during moderate to very high flow events. This is often an indicator of precipitation driven, non-point source pollution.
• Total phosphorus concentrations have a slight upward trend from 2008-2016.
• During the 8-year study focus (2008-2016), the average annual load exceeded the target load only 1 year (12.5%) in 2011. Rainfall in 2011 was ~50 inches. However, in 2015 rainfall was ~55 inches and the annual load did not exceed the target load.
12

St. Joseph River at Mayhew Road Northeast of Fort Wayne - LEJ100-0002 (STJ-8)
• This site along the St. Joseph River is located downstream of the confluence with Cedar Creek.
• The site is no longer active due to safety concerns. • USGS stream gage on the St. Joseph River near Fort Wayne, IN (04180500) used in
the analysis of this site. Drainage Area ratio is 1.00 (100%).LOADEST Results
Beginning Date Ending Date FlowData 1983 - 10 - 01 2015 - 10 - 23
Water Quality Data 2008 - 02 - 19 2011 - 03 - 09
Total (lb/yr) Per Acre (lb/ac/yr)Estimated Annual Load 427,294 0.63
Maximum Annual Load to Meet Target 490,401 0.72Load Reduction Needed to Meet Target 0 0
Average Annual Seasonal Load 330,174
13

14

15

St. Joseph River (LEJ100-0002) Results
• The load duration curve shows most sampling events that exceed the water quality target of 0.23 mg/L occur during moderate to very high flow events. This is often a indicator of precipitation driven non-point source pollution.
• Total phosphorus concentrations have a slight upward trend from 2008-2016.
• This site has exceeded the annual target load (slightly) 33% (1/3 years) of the time. The annual target load is exceeded when more than ~40 inches of rainfall occur in a year.
16

St. Joseph River at Shoaff Park Northeast of Fort Wayne – LEJ-08-0005 (STJ-4)
• This site along the St. Joseph River is located downstream of the confluence with Cedar Creek.
• The site only has data from 2011 to present.• USGS stream gage on the St. Joseph River near Fort Wayne, IN (04180500) used in
the analysis of this site. Drainage Area ratio is 1.018 (98%).LOADEST Results
Beginning Date Ending Date FlowData 1983 - 10 - 01 2015 - 10 - 23
Water Quality Data 2011 - 04 - 13 2016 - 04 - 05
Total (lb/yr) Per Acre (lb/ac/yr)Estimated Annual Load 359,890 0.52
Maximum Annual Load to Meet Target 438,000 0.63Load Reduction Needed to Meet Target 0 0
Average Annual Seasonal Load 236,842
17

18

19

St. Joseph River (LEJ-08-0005) Results
• The load duration curve shows most sampling events that exceed the water quality target of 0.23 mg/L occur during moderate to very high flow events. This is often an indicator of precipitation driven, non-point source pollution.
• Total phosphorus concentrations have a slight downward trend from 2011-2015.
• This site has exceeded the annual target load only one time (in 2011) between 2011-2015.
20

St. Joseph River at Tennessee Street in Fort Wayne – LEJ100-0003 (STJ-.5)
• This site along the St. Joseph River is located in Fort Wayne just before it joins the St. Mary’s to form the Maumee River. This site represents the pour point of the St. Joseph River watershed.
• USGS stream gage on the St. Joseph River near Fort Wayne, IN (04180500) used in the analysis of this site. Drainage Area ratio is 1.029 (97%).
• This USGS stream gage changed locations and USGS in the process of determining if a new rating curve will be needed. This may impact the 2015 discharge data used in analysis.
LOADEST ResultsBeginning Date Ending Date
FlowData 1983 - 10 - 01 2015 - 10 - 23 Water Quality Data 2008- 02 - 19 2016 - 04 - 05
Total (lb/yr) Per Acre (lb/ac/yr)Estimated Annual Load 415,457 0.60
Maximum Annual Load to Meet Target 471,100 0.67Load Reduction Needed to Meet Target 0 0
Average Annual Seasonal Load 289,170
21

22

23

St. Joseph River (LEJ100-0003) Results
• The load duration curve shows most sampling events that exceed the water quality target of 0.23 mg/L occur during high to very high flow conditions. This is often an indicator of precipitation driven, non-point source pollution.
• Total phosphorus concentrations have a slight downward trend from 2008-2016.
• Over the 8-year study period (2008-2015), this site exceeded the target load 2 times (25%: years- 2009 & 2011).
24

St. Marys River at SR 1, North of Pleasant Mills – LES040-0007 (STM-37)
• This site along the St. Marys River is located in near Pleasant Mills just west of the Ohio/Indiana state line. This site represents what is entering Indiana from Ohio.
• USGS stream gage on the St. Marys River near Decatur, IN (04181500) used in the analysis of this site. Drainage Area ratio is 0.89 (89%).
• There was a gap in flow data in 2013 which explains why the annual and target loads are very low. This 2013 data is not representative of this site.
LOADEST ResultsBeginning Date Ending Date
FlowData 1947 - 04 - 01 2016 - 06 - 26 Water Quality Data 2008 - 01 - 02 2016 - 03 – 01
Total (lb/yr) Per Acre (lb/ac/yr)Estimated Annual Load 538,969.74 1.5229
Maximum Annual Load to Meet Target 296,933.62 0.7627
Load Reduction Needed to Meet Target 269,036.12 (50%) 0.7602
Average Annual Seasonal Load 349,146.00
25

26

27

St. Marys River (LES040-0007) Results• The load duration curve shows most of the
sampling events exceed the water quality target of 0.23 mg/L. Exceedances occur across all flow conditions. This is often an indicator of both point and nonpoint sources.
• Total phosphorus concentrations have a slight decreasing trend from 2008-2016.
• This site has exceeded the annual target load 85% of the time between 2008-2015 (excluding 2013).
• This site is representative of the contributing loads entering IN from OH.
28

St. Mary's River at Ferguson Road in Fort Wayne– LES060-0005 and LES060-0009 (STM-
11 and STM-12)• This site along the St. Marys River is located in Fort Wayne. • USGS stream gage on the St. Marys River near Fort Wayne, IN (04182000) used in
the analysis of this site. Drainage Area ratio is 0.99 (100%).
LOADEST ResultsBeginning Date Ending Date
FlowData 1930 – 11 – 07 2016 – 06 – 26
Water Quality Data 2008 – 01 – 22 2016 – 04 – 04
Total (lb/yr) Per Acre (lb/ac/yr)Estimated Annual Load 800,945.05 1.64
Maximum Annual Load to Meet Target 401,991.95 0.82Load Reduction Needed to Meet Target 398,953.10 (50%) 0.81
Average Annual Seasonal Load 492,048
29

30

31

St. Marys River (LES060-0005) Results• The load duration curve shows most of the sampling
events exceed the water quality target of 0.23 mg/L. Exceedances occur across all flow conditions. This is often an indicator of both point and nonpoint sources.
• Total phosphorus concentrations have remained relatively constant from 2008-2016.
• This site has exceeded the annual target load 87% of the years between 2008-2015.
• The upstream site had high loads coming in from OH and they appear to be maintained or increased as the St. Mary’s flows through Indiana.
32

St. Marys River in Fort Wayne– LES060-0004 (STM-.2) and LES-06-0003 (STM-.8)
• These sites along the St. Marys River are located in Fort Wayne just upstream of the confluence with the St. Joseph River. These sites represent the pour point of the St. Marys River watershed.
• Site LES060-0004 is no longer active.• The data for these two sites were combined in the model and all the graphs because of their
proximity (DA is 823 vs 840 sq. mi.) to each other and based on BPJ from the fixed station field staff they have comparable characteristics.
• USGS stream gage on the St. Marys River near Fort Wayne, IN (04182000) used in the analysis of this site. Drainage Area ratio is 1.08 (93%).
LOADEST ResultsBeginning Date Ending Date
FlowData 1930 – 11 – 07 2016 – 06 – 26
Water Quality Data 2008 – 02 – 19 2016 – 04 – 05
Total (lb/yr) Per Acre (lb/ac/yr)Estimated Annual Load 846,234 1.58
Maximum Annual Load to Meet Target 418,453 0.78Load Reduction Needed to Meet Target 427,781 (50%) 0.80
Average Annual Seasonal Load 548,046
33

34

35

St. Marys River (LES060-0004 and LES-06-0003) Results
• The load duration curve shows most of the sampling events exceed the water quality target of 0.23 mg/L. Exceedances occur across all flow conditions. Nearly all samples taken during high to very high flow condition were in exceedance of the target. These signatures are often an indicator of both point and nonpoint sources.
• Total phosphorus concentrations are relatively consistent across all years from 2008-2016.
• This site has exceeded the annual target load 87% of the time between 2008-2015.
36

Maumee River at Anthony Blvd. in Fort Wayne–LEM010-0012 (M-132)
• This site along the Maumee River is located in Fort Wayne. This site is immediately downstream of the confluence of the St. Marys River and the St. Joseph River.
• USGS stream gage on the Maumee River near New Haven, IN (04183000) used in the analysis of this site. Drainage Area ratio is 0.98 (98%).
• Flow data were only available through 2012 so annual loads could not be calculated for 2013 and 2014.
LOADEST ResultsBeginning Date Ending Date
FlowData 1956 – 10 – 01 2016 – 06 – 26 Water Quality Data 2008 – 01 – 22 2016 – 04 – 04
Total (lb/yr) Per Acre (lb/ac/yr)Estimated Annual Load 1,419,364 1.15
Maximum Annual Load to Meet Target 1,760,693 1.42Load Reduction Needed to Meet Target 0 0
Average Annual Seasonal Load 963,900,
37

38

39

Maumee River LEM010-0012 (M-132) Results
• The load duration curve shows most of the sampling events exceed the water quality target of 0.23 mg/L. Exceedances occur across all flow conditions. Nearly all samples taken during high to very high flow condition were in exceedance of the target. These signatures are often an indicator of both point and nonpoint sources.
• Total phosphorus concentrations show an increasing trend from 2008-2016.
• This site has exceeded the annual target load 25% of the years (2011 and 2015) between 2008-2015.
40

Maumee River at Landin Road in New Haven–LEM010-0014 (M-129)
• This site along the Maumee River is located in east of Fort Wayne. • USGS stream gage on the Maumee River near New Haven, IN (04183000) used in
the analysis of this site. Drainage Area ratio is 1.003 (99%).
LOADEST ResultsBeginning Date Ending Date
FlowData 1956 – 10 – 01 2016 – 10 – 26Water Quality Data 2008 – 01 – 22 2016 – 04 – 04
Total (lb/yr) Per Acre (lb/ac/yr)Estimated Annual Load 1,374,185 1.09
Maximum Annual Load to Meet Target 962,166 0.76Load Reduction Needed to Meet Target 412,019 0.33
Average Annual Seasonal Load 897,345
41
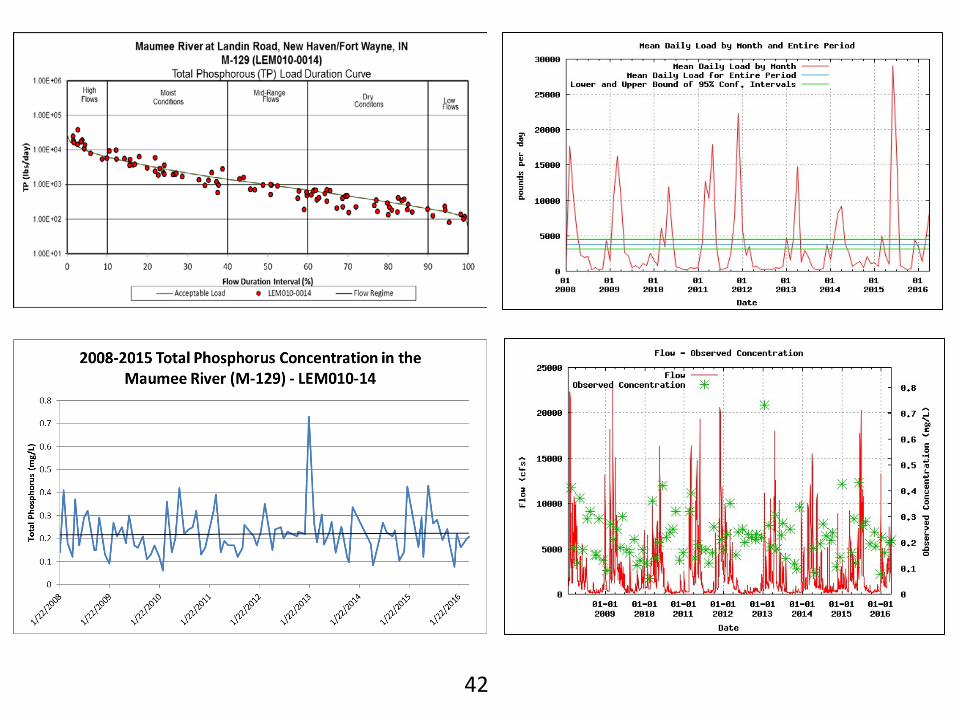
42

43

Maumee River LEM010-0014 (M-129) Results
• The load duration curve shows the sampling events that exceed the water quality target of 0.23 mg/L occur across all flow conditions. These signatures are often an indicator of point and nonpoint sources.
• Total phosphorus concentrations show a decreasing trend from 2005-2014.
• This site has exceeded the annual target load 87% of the years (2012 was a draught year) between 2008-2015.
44

Maumee River at SR 101 North of in Woodburn– LEM010-0013 (M-114)
• This site along the Maumee River is located in North of Woodburn, IN and the site represents the Maumee River as it leaves Indiana and enters Ohio.
• USGS stream gage on the Maumee River near New Haven, IN (04183000) used in the analysis of this site. Drainage Area ratio is 1.006 (94%).
LOADEST ResultsBeginning Date Ending Date
FlowData 1956 – 10 – 01 2016 – 06 – 26Water Quality Data 2008 – 01 – 22 2016 – 04 – 04
Total (lb/yr) Per Acre (lb/ac/yr)Estimated Annual Load 1,462,930 1.10
Maximum Annual Load to Meet Target 1,020,345 0.76Load Reduction Needed to Meet Target 442,585 0.33
Average Annual Seasonal Load 937,125
45

46

47

Maumee River LEM010-0013 (M-114) Results
• The load duration curve shows the sampling events that exceed the water quality target of 0.23 mg/L occur across all flow conditions. These signatures are often an indicator of point and nonpoint sources.
• Total phosphorus concentrations show a slightly increasing trend from 2008-2016.
• This site has exceeded the annual target load 75% of the years (2008, 2009, 2011, 2013, 2014 and 2015) between 2008-2015.
48

Fish Creek at SR 427LEJ050-0006 (FSH-18)
• This site is along Fish Creek upstream of the Fish Creek Gage (04177720) and eventually flows into Cedar Creek
• USGS stream gage on Fish Creek near Hamilton, IN (04177720) used in the analysis of this site. Drainage Area ratio is 1.11.
LOADEST ResultsBeginning Date Ending Date
FlowData 1969 – 10 – 01 2016 – 06 – 26
Water Quality Data 2008- 01 – 02 2016 – 03 – 01
Total (lb/yr) Per Acre (lb/ac/yr)Estimated Annual Load 22,002 0.83
Maximum Annual Load to Meet Target 17,906 0.68Load Reduction Needed to Meet Target 4,095 0.15
Average Annual Seasonal Load 15,240
49

50

51

Fish Creek LEJ050-0006 (FSH-18) Results
• The load duration curve shows the sampling events that exceed the water quality target of 0.23 mg/L occur at very high flows. These signatures are often an indicator of nonpoint sources.
• Total phosphorus concentrations show relatively constant trend from 2008-2016.
• This site has exceeded the annual target load 62.5% of the years (2008, 2009, 2010, 2011, 2015) between 2008-2015.
52

Fish Creek at CR 79LEJ050-0007 (FSH-5)
• Flows into the Cedar Creek downstream of site LEJ050-0007 the site is located near the town of Hamilton, IN.
• USGS stream gage on Fish Creek near Hamilton, IN (04177720) used in the analysis of this site. Drainage Area ratio is 1 (100%).
LOADEST ResultsBeginning Date Ending Date
FlowData 1969 – 10 – 01 2016 – 06 – 26
Water Quality Data
Total (lb/yr) Per Acre (lb/ac/yr)Estimated Annual Load 29,561 0.47
Maximum Annual Load to Meet Target 36,667 0.58Load Reduction Needed to Meet Target 0 0
Average Annual Seasonal Load 20,662
53

54

55

Fish Creek LEJ050-0007 (FSH-5) Results
• The load duration curve shows the sampling events that exceed the water quality target of 0.23 mg/L occur at very high flows. These signatures are often an indicator of nonpoint sources.
• Total phosphorus concentrations show a slightly increasing trend from 2008-2016.
• This site has exceeded the annual target load once (2011) during the 8 year study period from 2008-2015.
56