Embed Size (px)
Citation preview

India’s proposed Modified
Submission on Forest Reference Levels for REDD+
Result based Payments under UNFCCC

1
Content
1 Introduction 3 2 National Circumstances 4 2.1 Forest Resources and Pressure on forest
2.2 Existing Legal and Policy Framework in India 2.3 Forest Management
4 5
11 3 Information on Forest Reference Level 12 3.1 Scope: Activity, Pool and Gases
3.2 Definition of Forest 3.3 Data Used 3.4 Scale 3.5 Methodology of construction of FRL
13 13 14 14 14
3.5.1 Activity data 3.5.2 Improvement in Classification of previous cycles 3.5.3 Forest Type Mapping (FTM) 3.5.4 Stratification of Activity Data 3.5.5 Methodology for Estimating Emission Factors 3.5.6 Above Ground Biomass (AGB) of trees having dbh ≥ 10 cm and bamboo 3.5.7 Above Ground Biomass of branches, foliage of trees having dbh ≥ 10 cm 3.5.8 Above ground biomass of trees having dbh < 10 cm 3.5.9 Above Ground Biomass of Shrubs, Herbs, Climbers, and Biomass of Dead Organic Matter (DOM: Dead Wood and Litter) 3.5.10 Organic matter in soil and forest floor 3.5.11 Below Ground Biomass 3.5.12 Synthesizing Data for National Carbon Estimation
15 18 20 21 22 22
24
26 27
28 28 28
4 Proposed Reference Levels 29 5 Transparent, Complete, Consistent and Accurate 30 5.1 Transparent
5.2 Complete 5.3 Consistent 5.4 Comparable 5.5 Accurate
30 31 31 31 31
Annexures Annexure-1 Timber production from Recorded Forest Area in India during 2005-10 32 Annexure-2 State/UT wise Potential Production of Timber from TOF 33 Annexure-3 Recorded Forest Area of India 34 Annexure-4 Annual Fuel Wood Consumption 35 Annexure-5 Adult Cattle Unit dependent on forests 36 Annexure-6 Change Matrix 2000-2004 and 2004-2008 37 Annexure-7 Depiction of FCC and classified sample map of Telangana State 38 Annexure-8 Bibliography 39

2
Acronyms and Abbreviations
AFOLU Agriculture, Forestry and Other Land Use
AGB Above Ground Biomass
BGB Below-ground Biomass
COP Conference of the Parties
DOM Dead Organic Matter
FREL Forest Reference Emission Level
FRL Forest Reference Level
FSI Forest Survey of India
FTM Forest Type Mapping
GIM Green India Mission
GIS Geographic Information System
GPG Global Greenhouse Gas
GPG Good Practices Guidance
GPS Global Positioning System
IPCC Intergovernmental Panel on Climate Change
IRS Indian Remote Sensing (Satellite)
ISFR India State of Forest Report
JFM Joint Forest Management
LISS Linear Imaging and Self-scanning Sensor
LULUCF Land Use, Land-use change and Forestry
MDF Moderately Dense Forest
MoEF&CC Ministry of Environment, Forest & Climate Change
MRV Monitoring Reporting and Verification
NAPCC National Action Plan on Climate Change
NDVI Normalised Difference Vegetation Index
NFI National Forest Inventory
NFMS National Forest Monitoring Systems
NFP National Forest Policy
NTFP Non Timber Forest Products
NWPC National Working Plan Code
OF Open Forest
PAs Protected Areas
PESA Panchayat (Extension to Scheduled Areas)
REDD+ Reducing Emissions from Deforestation and Forest Degradation
SFR State of Forest Report
SMF Sustainable Management of Forest
SOC Soil organic Carbon
SOI Survey of India
TOF Trees Outside Forest
UNFCCC United Nations Framework Convention on Climate Change
VDF Very Dense Forest
WII Wildlife Institute of India

3
Figures
Figure 1– Schematic diagram of the methodology followed in Forest Cover
Mapping
18
Figure 2 – Physiographic Zone 23
Figure 3 – Selected districts of a cycle 23
Figure 4 – Layout of the sample plot in plain 24
Tables
Table 1 – History of Forest Cover Mapping in India 16
Table 2 – Error Matrix 18
Table 3 – Forest Cover with Improved area 21
Table 4 – Forest type and forest density wise area for the year 2008 22
Table 5 – Activity data and pool wise carbon stock used for FRL 30
Table 6 – Annual carbon stock between 2000-08 31
Table 7 – Annual CO2 equivalent between 2000-08 31

4
Forest Reference Level for REDD+ in India
Summary: India has used the historic period of 2000-2008 for the construction of Forest Reference
Level (FRL). The activity chosen for the FRL is Sustainable Management of Forest. All the five pools
have been considered and only CO2 gas has been taken into account for the construction of FRL. FSI
has used IPCC; GPG 2003 guidelines for construction of FRL. As per the suggestions of Assessment
Team (AT), following changes have been made in the Initial submission:
1. All the editorial changes suggested by AT has been incorporated at the relevant places.
2. All new additions have been highlighted with red colour and word/sentences to be deleted are strike off.
3. List of acronyms has been added in the beginning.
4. Content table has been revised.
5. At section 2.2, Existing Legal and Policy Framework in India has been added by replacing the old section 2.2 Governance.
6. Additional clarifications have been added wherever required based on AT questions
7. Change matrix for 2000-2004 has been added in annexure 6. Depiction of satellite image (FCC) and corresponding classified image has been added at annexure-7
1. Introduction
REDD+ as it is reflected in paragraph 70 of Decision 16/CP.1,referred to Reducing
emissions from deforestation; (b) Reducing emissions from forest degradation; (c)
Conservation of forest carbon stocks; (d) Sustainable management of forests; and
(e) Enhancement of forest carbon stocks (as suggested by AT). Abatement of forest-
based CO2 emission is critical to limiting global warming. As per the latest
Assessment Report 5 (AR 5) of IPCC, the AFOLU sector contributes about 20-24 %
of total emission. These emissions are mainly taking place in tropical developing
countries.
The Conference of the Parties (COP) to the United Nations Framework Convention
on Climate Change (UNFCCC) adopted at its sixteenth session (COP-16) a
milestone decision on Reducing Emissions from Deforestation and Forest
Degradation (REDD+). This decision encourages developing countries to develop a
“National Forest Reference Emission Level (FREL) and/or National Forest Reference
Level (FRL) or, if appropriate, as an interim measure, sub-national FREL and/or
FRL, in accordance with the national circumstances”. FREL and FRL serve as
benchmark for assessing performance of implementation of REDD+ in a country. A
country that undertakes the activities reducing emissions from deforestation and/or
reducing emissions from forest degradation will use the FREL as the benchmark to
assess progress of its performance (as suggested by AT). On the other hand, FRL is
relevant benchmark when a country undertakes to implement the activities for

5
enhancement of forest carbon stocks; conservation of forest carbon stocks; and
sustainable management of forests (as suggested by AT).
This decision necessitates the development of a National Forest Reference Emission
Level (FREL)/ Forest Reference Level (FRL), adjusting for national circumstances, if
required. The Ministry of Environment, Forest and Climate Change has given a
project to Forest Survey of India, entitled Development of Forest Reference Level for
REDD+ in India in January 2015.
2. National Circumstances
2.1 Forest Resources and Pressure on forest
India is a vast country with a rich biological diversity. It is one of the 12 mega
diversity countries having a vast variety of flora and fauna, commanding 7% of
world's biodiversity and supporting a variety of forest types, varying from the alpine
forests in the Himalayas thorn forests in the hot deserts, from dry deciduous forests
to wet evergreen forests and mangroves. There are 16 forest type groups and 221
forest types in India. With about 2.5% of the world's geographic area and about 2%
of forest area, India at present is supporting 16% of the world population and 18% of
the cattle population. The total forest area of the country is 7,67,419 sq km. Forest
is the second-largest land use in India after agriculture. Roughly, 275 million rural
people in India depend on forests for at least part of their subsistence and livelihood
(World Bank, 2006). As per the India State of Forest Report (FSI, 2017), the forest
cover of the country stood at 708,273 km2, while it was 701,495km2 in 2015 updated
assessment (FSI, 2017), recording an increase of 6778 km2 within two years. The
National Forest Policy of India envisages 33% of its geographical area under forest
and tree cover. The total forest and tree cover of the country is 24.4% of its
geographical area. The country has very low per capita forest cover of 0.06 ha. The
forest cover in the country is not uniform and varies in different States and regions.
Mainly it is concentrated in Himalayas, north eastern states, central India and
Western Ghats.
The energy from wood resources is an important parameter to define the social
functions performed by the forests. This social function of the forests has been given
due consideration, while judging the sustainability of forest resources and preparing
management plans. The human population using the fuelwood as main source of
cooking is 854 million (Annexure-4). Similarly, grazing and collection of fodder for
livestock in forest not only help them to feed but provide a ground for breeding as well.
Certain tribal communities keep herds of cattle & sheep. The number of such cattle & sheep
are considered as status symbol in their communities. Such communities though do not
have their own grazing ground for the cattle, they depend largely on forest. Hence, the
dependence of human & cattle population on forests speaks about the social function of
forests. As per ISFR 2011, the dependence of biomass consuming livestock on forest is
about 37 percent (Annexure-5).
6
2.2 Existing Legal and Policy Framework in India
The policy and legal framework that has evolved in tune with the Constitutional
provisions are effectively attuned to safeguarding the natural resources of the
country including forests, wildlife and biodiversity in general. This framework guides
and directs the sustainable management of forests ensuring the conservation of
biodiversity and also respecting and upholding the rights of the local communities on
lands and forest products.
Various acts and legislations in India are a strong testimony of country's commitment to the philosophy of forest conservation. Provisions of the Policies and Acts described hereafter are in tune with the constituents of REDD+. Further, the people centric approach adopted in the management of forests for almost over three decades supports the important precept of REDD+ that natural resources are to be conserved and protected for enhancement of ecosystem services for the benefit of local community dependent thereon. The other safeguards inherent in the concept of REDD+, i.e., conservation and preservation of biodiversity, enhancement of ecosystem services, respect for knowledge, traditions and rights of local communities, and open and transparent forest governance, etc. are fully covered under various legislations mentioned below. A brief mention of the relevant legislations in the following paragraphs brings out clearly the synergy and support of the legislations for implementation of REDD+ in India. 2.2.1 Indian Forest Act, 1927: This is the country-wide Act to consolidate the law
relating to forests, the transit of forest-produce and the duty leviable on timber and
other forest-produce. Proper implementation of the provisions of this Act is capable
of ensuring conservation of biodiversity of the natural forests as also enhancing the
quality and extent of the forest and tree cover in the country, which, in turn,
contribute to enhance REDD+ performance.
2.2.2 Wild Life (Protection) Act, 1972: As this Act provides for the protection of wild
animals, birds and plants and for matters connected therewith or ancillary or
incidental thereto, it perfectly synergises with the adherence to safeguards of
REDD+ relating to conservation of biodiversity and non-conversion of natural forests
into plantations.
2.2.3 Water (Prevention and Control of Pollution) Act, 1974: This is the Act to
provide for the prevention and control of water pollution and maintaining or restoring
wholesomeness of water. REDD+ implementation will need to ensure soil and water
conservation, and to avoid activities that would adversely impact the quality of
natural or stored water.
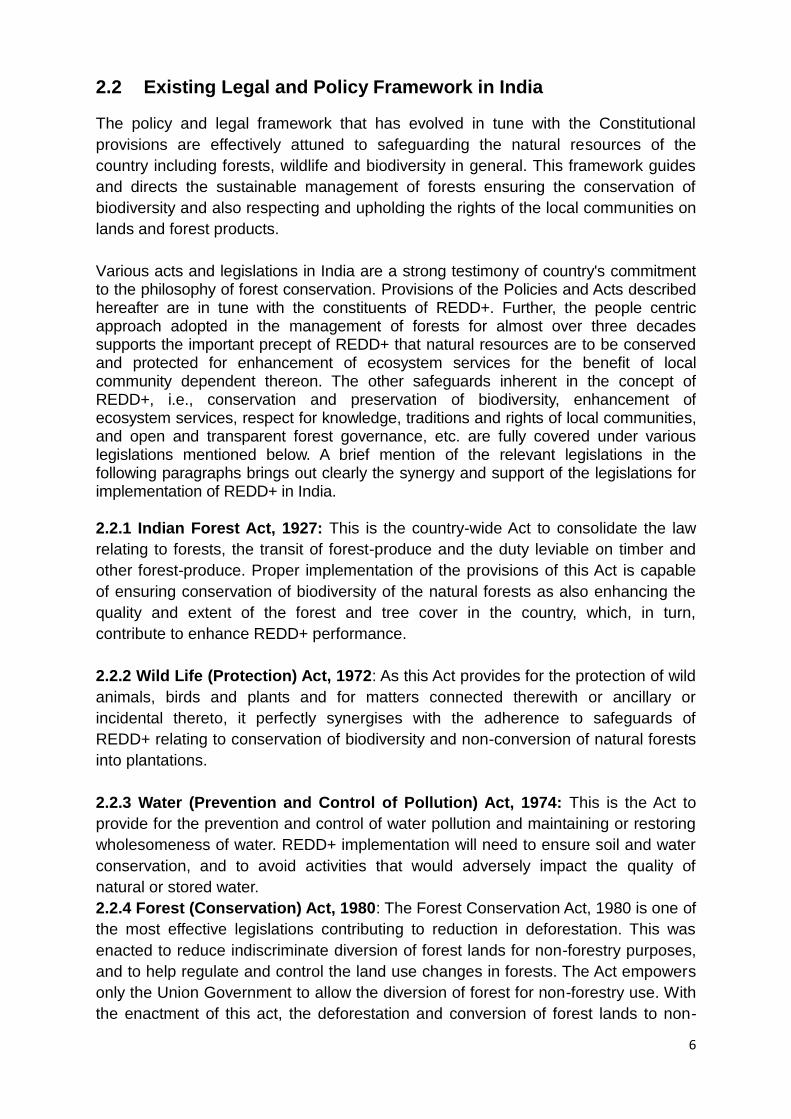
2.2.4 Forest (Conservation) Act, 1980: The Forest Conservation Act, 1980 is one of
the most effective legislations contributing to reduction in deforestation. This was
enacted to reduce indiscriminate diversion of forest lands for non-forestry purposes,
and to help regulate and control the land use changes in forests. The Act empowers
only the Union Government to allow the diversion of forest for non-forestry use. With
the enactment of this act, the deforestation and conversion of forest lands to non-

7
forest use has been drastically reduced. The pace of diversion of forest land for non-
forest purposes was around 1,60,000 hectares per annum from 1951 to 1976. It
come down drastically to 32,000 ha annually (MoEFCC, 2016) during 1980-2011
after the implementation this Act (Figure 2.1). Being an Act for regulating diversion of
forest land for non-forestry purposes, and to strike a balance between conservation
and development, it helps to enhance performance of REDD+ implementation in the
country by supporting conservation and improvement of natural forests.
(Source: MoEFCC, 2016)
Figure 2.1: Impact of Forest (Conservation) Act, 1980 on pace of forest diversion
for non forest purpose
2.2.5 Air (Prevention and Control of Pollution) Act, 1981: This Act provides for the
prevention, control and abetment of air pollution making it obligatory on REDD+
activities not to give rise to or abet air pollution.
2.2.6 Environment (Protection) Act, 1986: An act to provide for protection and
improvement of environment and for matters connected therewith, it empowers the
Central Government to establish authorities to prevent pollution in all its form and to
tackle specific environmental problems that are peculiar to different parts of the
country. REDD+ activities need to ensure that their implementation does not result in
any abetment of pollution of air, water, land or any other natural resource.
2.2.7 National Forest Policy, 1988: The principal aim of National Forest Policy
(NFP), 1988 is to ensure environmental stability and maintenance of ecological
balance. The policy aims for maintaining one-third of the country’s geographical area
under forest and tree cover and calls for massive afforestation and social forestry
programmes with people’s participation for increasing the forest and tree cover in the
country. The core aim of NFP perfectly synergises with REDD+ objective of climate
change mitigation in forestry sector. More the area under forest, more the mitigation
service it will provide.
The National Forest Policy (1988) is presently under revision. The overall objective
and goal of the draft National Forest Policy (2018) is to safeguard the ecological and

8
livelihood security of people, of the present and future generations, based on
sustainable management of the forests for the flow of ecosystem services. In order to
achieve the national goal for eco-security, the country should have a minimum of
one-third of the total land area under forest and tree cover.
The draft National Forest Policy (2018) also lays emphasis on Integrating climate
change mitigation and adaptation measures in forest management through the
mechanism of REDD+ so that the impacts of the climate change are minimised.
Under the draft policy strategic actions especially sustainable forest management will
be taken to strengthen forest-based climate change mitigation and adaptation.
2.2.8 Panchayat (Extension to Scheduled Areas) Act, 1996: The Panchayat
(Extension to Scheduled Areas), 1996 also known as PESA, was enacted to enable
Tribal Self Rule in these areas. The Act extended the provisions of Panchayats to the
tribal areas of nine states that have Fifth Schedule Areas. Most of the North eastern
states under Sixth Schedule Areas (Assam, Meghalaya, Tripura and Mizoram where
autonomous councils exist) are not covered by PESA, as these states have their
own Autonomous Councils for governance. PESA gives special powers to the Gram
Sabhas in scheduled areas especially for the management of natural resources.
2.2.9 Biological Diversity Act, 2002: The Act provides for conservation of biological
diversity, sustainable use of its components and fair and equitable sharing of the
benefits arising out of the use of biological resources knowledge and for matters
connected therewith or incidental thereto. Essence of this Act is manifest in the core
concept of REDD+ implementation, which provides for uncompromising safeguards
for conservation of biological diversity of natural forests, and also for upholding the
rights of the local communities who are privy to the knowledge about different uses
of forest biodiversity.
2.2.10 National Environment Policy, 2006: This policy which builds on the existing
policies related to preservation of natural resources is intended to guide action in
developing regulatory reforms, and programmes and projects for environmental
conservation by the Central and State Governments. The dominant theme of the
policy is that the people dependent on natural resources for their livelihood obtain
better livelihood from conservation than from degradation of resource. The policy
emphasises partnership of different stakeholders. If local communities are motivated
to enhance and conserve the forest and wooded areas, they get the benefit of
enhanced goods and services generated from the forest ecosystems. Mitigation is
one of the services provided by a forest ecosystem, and thus add quantum to
REDD+ performance.
2.2.11 The Scheduled Tribes and Other Traditional Forest Dwellers
(Recognition of Forest Rights) Act, 2006: This is the important Act to recognise
and vest the forest rights and occupations in forest land in forest dwelling scheduled
tribes and other traditional forest dwellers who have been residing in such forests for

9
generations but whose rights could not be recorded; and to provide for a framework
for recording the forest rights so vested and the nature of evidence required for such
recognition and vesting in respect of forest land. Implementation of this Act
contributes towards adherence to the safeguards related to rights of the local
communities with respect to their proprietorship of land and non-timber forest
products.
2.2.12 The National Green Tribunal Act, 2010: This Act enables creation of a
special tribunal to handle the expeditious disposal of the cases pertaining to
environmental issues. The stated objective is to provide a specialized forum for
effective and speedy disposal of cases pertaining to environment protection,
conservation of forests and for seeking compensation for damages caused to people
or property due to violation of environmental laws or conditions specified while
granting permissions.
2.2.13 National Water Policy, 2012: The objective of the National Water Policy is to
take cognizance of the existing situation, to propose a framework for creation of a
system of laws and institutions and for a plan of action with a unified national
perspective. The policy also stated that conservation of rivers, river corridors, water
bodies and infrastructure should be undertaken in a scientifically planned manner
through community participation.
2.2.14 National Agroforestry Policy, 2014: The policy underlines the environmental
contribution of agroforestry by preventing deforestation, and promoting carbon
storage, biodiversity conservation, and soil and water conservation. Agroforestry
provides employment to rural as well as urban people through production, industrial
processing and value addition of the tree products. The policy perfectly synergises
with objectives of REDD+ implementation in the country by explicitly supporting the
coverage of trees outside forest (TOF), and by preventing decimation of natural
forests.
2.2.15 National Working Plan Code-2014: According to National Working Plan
Code-2014 (for Sustainable Management of Forests and Biodiversity in India) the
forest management planning must provide for sustainable management of forests
and its biodiversity as enshrined in the National Forest Policy, encompassing the
ecological (environmental), economic (production) and social (including cultural)
dimensions. The objectives for attaining this goal include conservation of forests and
reducing forest degradation, maintenance and enhancement of ecosystem services
including ecotourism, enhancement of forest productivity together with establishment
of regeneration to improve forest health and vitality as per ecological and silvicultural
requirements of the species, progressively increasing the growing stock and carbon
sequestration potential, maintenance of biological diversity, sustainable yield of
forest produce, prevention of soil erosion and stabilization of the terrain;
improvement and regulation of hydrological regime; people’s involvement in planning
10
and management of forests fulfilling socio-economic and livelihood needs of the
people.
Chapter 2 of the National Working Plan Code-2014, refers to REDD+ at paragraph
17 of National Working Plan Objectives and other Management Planning. Paragraph
17 states, “…..Implementation of REDD+, therefore requires efforts/mechanisms to
measure forest carbon, interventions and payments to local people in addition to
alternative activities such as fodder development to avoid lopping of tree branches,
and efficient cooking energy devices, etc.” The linkage of REDD+ with forest
measurements in the Code is mentioned at para 26, which, inter alia, reads, “……A
robust and dynamic national carbon MRV based on forest resource assessment of
working plan can also be
realized for REDD+ provided
sufficient resources are made
available to the Stares for
estimating carbon from
different pools of forest
carbon”.
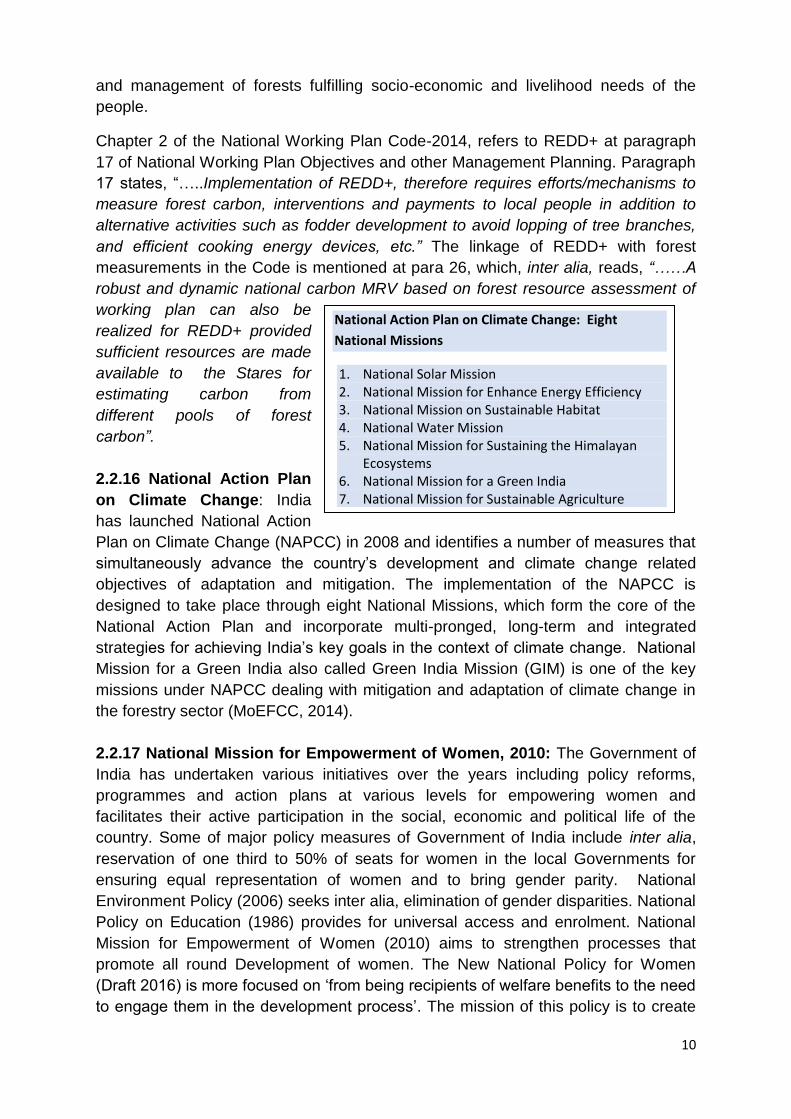
2.2.16 National Action Plan
on Climate Change: India
has launched National Action
Plan on Climate Change (NAPCC) in 2008 and identifies a number of measures that
simultaneously advance the country’s development and climate change related
objectives of adaptation and mitigation. The implementation of the NAPCC is
designed to take place through eight National Missions, which form the core of the
National Action Plan and incorporate multi-pronged, long-term and integrated
strategies for achieving India’s key goals in the context of climate change. National
Mission for a Green India also called Green India Mission (GIM) is one of the key
missions under NAPCC dealing with mitigation and adaptation of climate change in
the forestry sector (MoEFCC, 2014).
2.2.17 National Mission for Empowerment of Women, 2010: The Government of
India has undertaken various initiatives over the years including policy reforms,
programmes and action plans at various levels for empowering women and
facilitates their active participation in the social, economic and political life of the
country. Some of major policy measures of Government of India include inter alia,
reservation of one third to 50% of seats for women in the local Governments for
ensuring equal representation of women and to bring gender parity. National
Environment Policy (2006) seeks inter alia, elimination of gender disparities. National
Policy on Education (1986) provides for universal access and enrolment. National
Mission for Empowerment of Women (2010) aims to strengthen processes that
promote all round Development of women. The New National Policy for Women
(Draft 2016) is more focused on ‘from being recipients of welfare benefits to the need
to engage them in the development process’. The mission of this policy is to create
National Action Plan on Climate Change: Eight
National Missions
1. National Solar Mission 2. National Mission for Enhance Energy Efficiency 3. National Mission on Sustainable Habitat 4. National Water Mission 5. National Mission for Sustaining the Himalayan
Ecosystems 6. National Mission for a Green India 7. National Mission for Sustainable Agriculture 8. National Mission for Strategic Knowledge for
Climate Change

11
an effective framework to enable the process of developing policies, programmes
and practices, which will ensure equal rights and opportunity for women in the family,
community, workplace and in governance. From aforesaid, it can be concluded that
the present legal and policy framework is quite consistent and supportive of women’s
participation in the REDD+.
Thus, the entire policy and legal framework as detailed heretofore, supports the
conceptualization and implementation of REDD+ in India. However, constant review
and monitoring of REDD+ implementation as also amendments in present legislative
framework in future will be required to ensure continuation of synergy between the
general legal framework and the REDD+ execution.
2.3 Forest Management
The scientific forest management in India dates back to mid 19th century. The first
planned working of forest in the country started way back in 1837 in Travancore.
Uniform countrywide approach towards the preparation of Working Plans for scientific
management of forests was started in 1884. After independence in 1947, a huge thrust
on scientific management was given for conservation and development of forests.
Basically, Indian forests are managed on the principle of sustainability and
conservation. Therefore, the production from recorded forest area is very meagre
around 2.0 to 3.0 million tonnes per year (Annexure-2). All management activities are
carried as prescribed in concerned working plans. The working plans are written for
Recorded Forest Area which has legal connotation of forest (Annexure-3).
Since late seventies, after realizing the importance of conservation of natural forest,
India has started tree plantation outside the forest to meet the fuel, fodder and timber
demands of people. Community participation was encouraged and many village level
committees came into being. Private sector also started tree plantation to produce
raw material for wood based industries. Individuals started growing trees in their
agricultural field or homesteads. Governmental initiative led to tree plantations along
roads, railways, canals and on governmental lands. In urban areas, trees came up
in parks, gardens, institutional areas etc. for providing aesthetic and environmental
services. Recently India has come out with National Agroforestry Policy 2014 to
provide impetus for planting trees. As a result of all above efforts the country is
producing 42.8 million m3 per year industrial wood (Annxeure-2) meeting more than
eighty percent of demand from industries. Recognizing its importance, National
Working Plan Code 2014 (NWPC 2014) recommends conducting of Trees Outside
Inventory (TOF) in each forest division so that policy intervention for the same can
also be prepared.
The working plans are being prepared as per the new NWPC 2014 administered by
the Ministry of Environment, Forests and Climate Change (MoEF&CC), Government of
India, and are usually valid for a 10 year period. The Working Plan Officer prepares
the draft working plan which after approval of the State Government is sent to the
Regional Office of the MoEF&CC for obtaining approval of the Central Government.

12
The day to day management of forests is the responsibility of the State Forest
Departments of respective State/UT Governments, who are also responsible for the
protection, conservation, administration and development of forests.
India has developed a strong network of Protected Areas (PAs) covering 16.12 m ha
(as on September, 2011; Forest Sector Report India 2010) of the country’s geographical
area including National Parks (102), Wildlife Sanctuaries (515), Conservation
Reserves (47) and Community Reserves (4), these are the repository of rich flora and
fauna of the country. The Wildlife Institute of India (WII) imparts training to the forest
officers and scientists in protected area management. Each National Park and Wildlife
Sanctuary is managed as per approved management plan.
There are more than 300 million forest dependent people including around 87 million
tribals, deriving their livelihood and substantial part of their income from forests. India
started Joint Forest Management (JFM), a partnership between local communities and
the Forest Department in the nineteen eighties following the “Care and Share”
principle. More than 100 thousand JFM Committees involving around 20 million people
are managing approximately 22 mha of forest area. JFM has contributed significantly
in stabilizing forest and tree cover of the country. There is a great scope for
improvement of forest cover by addressing drivers of forest degradation with people’s
participation and cross-sectoral support.
3 Information on Forest Reference Level
The process of developing FRL draws strength from data and information from Forest
Survey of India (FSI) National Forest Monitoring Systems (NFMS) which provide
information for Monitoring Reporting and Verification (MRV). The NFMS provides
forest-related emissions reduction estimates by sources and removals by sinks. At the
same time it will provide results from implemented REDD+ activities and their
emissions/removals in national Green House Gas (GHG) inventories. As pointed out
above, FRL(s) are benchmarks used to assess the performance of REDD+
implementation. The comparison of MRV emission estimates resulting from REDD+
implementation with the FRL(s) will indicate the performance of REDD+ activity.
Therefore, the definitions, methodologies, scope etc followed in MRV and FRL are
kept same for consistency and comparability (Decision 14/CP.19). The available data
and information about forest area, change in area and GHG inventories was analysed
and necessary calculations and changes were carried out in order to construct
relevant FRL.
3.1 Scope: Activity, Pool and Gases
Annex (c) to Decision 12/CP.17 (Guidance on systems for providing information on
how safeguards are addressed and respected and modalities relating to forest
reference emission levels and forest reference levels as referred to in decision
1/CP.16) which says “Pools and gases, and activities listed in decision 1/CP.16,
paragraph 70, which have been included in forest reference emission levels and/or
forest reference levels and the reasons for omitting a pool and/or activity from the
construction of forest reference emission levels and/or forest reference levels, noting
that significant pools and/or activities should not be excluded;”

13
For construction of FRL, the activity taken by India is “Sustainable Management of
Forest (SMF). By analysing the forest cover assessment between 2000 to 2004 and
2004 to 2008, it has been observed that, activities such as deforestation, forest
degradation, enhancement of canopy densities and afforestration (leading to
enhancement of carbon stocks) have been observed in significant forest area
(change matrix for 2000-2004 and 2004-2008 has been given in Annexure-6 to
illustrate the change in area under different category). The new area, which is
annually brought under forest as per definition, is slightly more than the area which is
harvested (shifted from forest to non-forest) and as per definition goes out of forest
activity. Similarly, the extent of forest which is experiencing enhancement in canopy
densities is slightly more than the extent of forest which is experiencing degradation.
It is primarily, output of practicing of sustainable management of forests which is
followed all over the country. Moreover in India “All forests are to be managed under
the prescriptions of a working plan/scheme which are prepared on the basis of
principles of sustainable management of forests; conservation and development of
biodiversity; maintenance and enhancement of ecosystem services including carbon
sequestration; and the participation of local people in planning and management of
forest resources” (National Working Plan Code, 2014). Due to this reason, the
activity Sustainable Management of Forest has been taken as activity for
construction of FRL.
Regarding pools to be selected, all the five pools namely Above Ground Biomass,
Below Ground Biomass, Dead Wood, Litter and Soil Organic Carbon have been
selected for construction of FRL because, India has a time series good quality data
through regular National Forest Inventory programme for all the pools. Only CO2 gas
has been taken into account for construction of FRL.
3.2 Definition of forest
As per 13/CP.19, Annex, paragraph 2 (g), the forest definition used for the
construction of the FRL should be consistent with definition used for GHG inventory
India has used the same definition as was used for GHG inventory, which is given as
follows:
“All lands, more than one hectare in area, with a tree canopy density of more than 10
percent irrespective of ownership and legal status. Such lands may not necessarily be
a recorded forest area. It also includes orchards, bamboo and palm.”
(The definition of forest has been taken exactly as was used for GHG inventory and
FRA 2015. The only difference in above definition is that it has been explained further.
The separate area under orchards, bamboo and palm are not available as it is not
possible to delineate these areas from satellite. However, the area under
TOF/plantation given under forest types includes these areas partly based on the
ancillary information from State Forest Departments, toposheet etc. Scrubs and shrubs
are not the part of the forest cover.)

14
3.3 Data Used
The activity data and emission factors have been derived from National Forest
Monitoring System (NFMS). India is assessing its forest cover since 1987 using
remote sensing satellite data. Over the years, many technological advancement have
been taken place in the field of remote sensing and mapping. FSI kept pace with
rapidly changing technology and improved its assessment over the years. The results
are published in successive India State of Forest Report, a biennial publication of FSI,
MoEF & CC. The activity data taken for construction of FRL is forest cover
assessment for the years 2000, 2004 and 2008. In addition, inventory of forest
resources of the country on a regular basis under its National Inventory Programme
(NFI) is another important activity of FSI. It collected data on different parameters from
about 17000 sample plots in both forest and TOF every cycle. For estimating the
emission factors, the inventory data of three cycle i.e. 2002 to 2008 was combined.
3.4 Scale
The FRL has been constructed at the National Level as the activity data used for
construction of FRL is based on wall-to-wall mapping using satellite data and emission
factors derived from national forest inventory spread over entire country.
3.5 Methodology of construction of FRL
Country has to submit information and rationale on the development of their FRL
(Decision 12/CP. 17, II, paragraph 9; Decision 13/CP.19, Annex, paragraph 2 (c)).
The historical method to calculate FRL has been considered. FSI has been
monitoring and reporting forest area and has also estimated forest carbon stocks.
FSI has adopted the stock difference method for calculating forest carbon stocks,
which is appropriate keeping in view the expertise, availability of historical data and
regularity of assessments. Details of methodology has been is narrated in following
paragraphs.
The calculation of GHG inventories require information on extent of an
emission/removal category termed as ‘Activity data’ and emission or removal of GHG
per unit of area (emission/removal of CO2 per ha of forest area) termed as ‘Emission
factors’ as per the ‘Good Practices Guidance’ (GPG), 2003 developed by
Intergovernmental Panel on Climate Change (IPCC). The methodology used by FSI
for activity data and emission factors has been described in the following
paragraphs.
3.5.1 Activity data
Forest Survey of India (FSI) has a long experience of forest cover mapping using
wall to wall satellite data. This activity was started by FSI in 1987 using Landsat
(MSS) imagery with 80 m resolution. The technique of interpretation was visual and
scale of mapping was 1:1 million. The on screen interpretation was followed by
extensive ground truthing. The forests were classified into two canopy classes

15
namely dense forest (crown cover of more than 40%) and open forests (crown cover
between 10-40%). Mangroves were delineated as a separate class considering its
importance. Though mangroves are presented separately, it is a part of overall forest
cover. Degraded forests having crown cover of less than 10% were classified as
scrub (a non-forest category). During the successive assessment, many
improvements took place because of availability of better satellite data and higher
mapping scale. However, there was a major methodological improvement since
2001. FSI switched over to digital interpretation of the satellite data with spatial
resolution of 23.5 meters and scale of mapping at 1:50,000. As a result, the
minimum mappable unit has been reduced from 25 ha to 1.0 ha and it was possible
to report forest cover figures in three density classes namely Very Dense Forest
(with canopy density of more than 70 %), Moderately Dense Forest (with canopy
density between 40 % and 70 %) and Open Forest (with canopy density between 10
% and 40 %). Thus the data after the year 2000 is comparable. Table 1 shows the
technological advancement in forest cover assessment taken over the years.
Table -1: History of Forest Cover Mapping in India
Data Period (publication)
Sensor Resolution Scale MMU (ha)
Mode of interpretation
1981-83 (SFR’87) LANDSAT-MSS
80 m 1:1
million 400 ha
Visual
1985-87 (SFR’89) LANDSAT-TM
30 m
1:250,000 25 ha
1987-89 (SFR’91) LANDSAT-TM
1989-91 (SFR’93) LANDSAT-TM
1991-93 (SFR’95)
IRS-1B LISS II
36.25 m
Visual/ Digital 1993-95 (SFR’97)
IRS-1B LISS II
1996-98 (SFR’99) IRS-1C,1D LISS III
23.5 m
2000-01 (SFR’01) IRS-1C,1D LISS III
1:50,000 1 ha Digital
2002-03 (SFR’03) IRS-1D LISS III
2004-05 (SFR’05) IRS-1D LISS III
2006-07 (ISFR’09) IRS-P6-LISS III
2008-09(ISFR’11) IRS-P6-LISS III

16
2010-12 (ISFR’13)
IRS-P6 & Resourcesat2
LISS III
The methodology being followed now uses Digital Image Processing software and
involves the number of steps (Rawat et al. 2003): Acquisition of satellite data;
Geometric Rectification of raw data; Mosaicing of rectified scenes; Classification of
forest cover using Normalised Difference Vegetation Index (NDVI); Interactive
method of display is used for assigning threshold values for each class (very dense,
moderately dense, open and scrub); Density class of forest cover and colour is
accordingly allocated.
Flow chart of methodology of dynamic forest cover mapping using remote sensing is
shown in the Fig.1.
Figure 1: Schematic Diagram of the methodology followed in Forest Cover Mapping
The output includes forest cover maps on 1:50,000 scale. These maps show forest
cover in four classes- (i) Very Dense forest, having canopy density of more than
70%; (ii) Moderately dense Forests with canopy density 40%-70%; (iii) Open Forests
with canopy density between 10 %-40% and (iv) Scrub which are forest areas having
less than 10% canopy density. The information of forest cover is published in India
State of Forest Report (ISFR) for the entire country, state and districts. Change
matrix is also given at the country and state level.

17
A classification is not complete unless its accuracy is assessed. FSI carry out
accuracy assessment of classification in the form of error matrix. Classified and
ground truth data is compared on about 4000 sample plots to prepare the error
matrix. For ground truth, the information of forest inventory and high resolutions
satellite data is used. The classification accuracy for various report is above 90 %,
which is well within the acceptable limit. For illustration, the error matrix prepared for
ISFR 2013 is shown in table 2.
Table 2: Error matrix
Classification Classes
Ground truth (based on field inventory data) User's Accuracy (Per cent) VDF MDF OF Scrub NF Total
VDF 210 22 3 1 1 237 88.81
MDF 17 1,221 60 4 8 1,310 93.21
OF 7 80 1,137 9 16 1,249 91.03
Scrub 1 9 12 192 7 221 86.88
NF 3 37 39 17 1,019 1,115 91.39
Total 238 1,369 1,251 223 1,051 4,132
Producer's Accuracy (%)
88.24 89.19 90.89 86.10 96.96
Overall Accuracy 91.46
Overall Kappa Statistics
0.88
Source: ISFR 2013
3.5.2 Improvement in Classification of previous cycles
As pointed out earlier, FSI switched over to digital interpretation of the satellite data
(LISS III, multispectral, 23.5m spatial resolution) commencing from the year 2001. It
used digital interpretation of satellite data on 1:50,000 scale for mapping and
monitoring of forest cove of the country. This has resulted in providing more realistic
information on forest cover as areas having forest cover down to 1 ha could be
delineated while in earlier assessments, forest cover down to 25 ha could only be
delineated. Similarly blanks down to 1 ha within forested areas can be separated.
The entire exercise has resulted in new base-line information on forest cover. As
perennial woody vegetation (including bamboos, palms, coconut, apple, mango etc.)
has been treated as tree and thus all lands with tree crops, such as agro-forestry
plantations, fruit orchards, tea and coffee estates with trees etc., have been
considered in forest cover provided such patches of trees/forests qualifies the
definition of forest.

18
This has been viewed as great advantage over earlier methodology but threw a
number of challenges for interpretation of satellite data as canvas suddenly opened
up for number of potential small patches between 1.0 ha to 25 ha.
It is pertinent to mention here that while carrying out digital classification at 1:50,000
scale in 2001, FSI decided to adopt conservative approach and included those areas
in forest cover which satisfied the definition of forest cover and there were,
seemingly, very less or no possibility of misclassification.
Remote sensing data has certain inherent limitations that affect the accuracy of the Forest Cover Mapping, some of which are mentioned below:
• Since the resolution of the LISS-III sensor data is 23.5 m, land cover having a
geometric dimension on the ground less than 23.5 m is not discernible.
• Considerable ground details may sometimes be obscured due to clouds and
shadows. Such areas can be classified to a certain extent with the help of
collateral data.
• Non-availability of appropriate season data sometimes leads to misinterpretation
of the features owing to poor reflectance of data.
• Occurrence of weeds like lantana in forest areas and agricultural crops like
sugarcane, cotton, etc. adjacent to forest area causes mixing of the spectral
signatures and often make precise forest cover delineation difficult.
• Young plantations and tree species with less chlorophyll or poor foliage are many
times not discernable on satellite images due to low leaf area index and
transmittance.
• Where heterogeneity in tree species composition is high, generalized
classification may affect the accuracy level.
Due to above limitations, there are certain interpretational changes in the forest
cover assessment of a particular year. Thus the change in the forest cover between
two consecutive cycle may contains the actual changes happened during the two
years and also contains interpretational changes which pertain to other previous
period as well. The historic data taken for construction of FRL is 2000-2008.
The forest cover assessment based on interpretation of 2000, 2004 and 2008
satellite data (sensor LISS III, resolution: 23.5m) had already been carried out as
part of FSI’s mandated activity and has appeared in the various ‘State of Forest
reports’ (SFRs). In each SFR, the figures of that year is given with a change with
respect to previous cycle. As mentioned above, the change comprises of both actual
and interpretational changes. For the purpose of constructing FRL, FCMs
corresponding to year 2000 (SFR 2001), 2004 (SFR 2005) and 2008 (ISFR 2011)
got revised by incorporating the interpretational changes observed in the subsequent
assessments to the year they belong. In this process, the maps and figures of forest
cover were revised for the year 2000, 2004 and 2008. The details of FCM for
different cycles along with improved forest cover for the year 2000, 2004 and 2008 is
given in table 3.

19
Table 3: Forest Cover with Improved area
3.5.3 Forest Type Mapping (FTM)
Forest type wise extent of forest cover is useful information which provides a basis
for characterizing forests in terms of floristic composition and ecological value. In the
year 2011, FSI has published “Atlas of forest types of India” mapping forest types as
per revised classification of Champion & Seth (1968) on 1:50,000 scale down up to
200 types described in the classification. In the first ever such attempt at the national
level, extensive study in GIS framework using the relevant layers like, soil, rainfall,
temperature along with the remote sensing data, details from the working plans,
thematic maps of FSI, inventory information etc was carried out. The exercise
involved extensive and widespread ground truthing covering every part of the
country.
The FTM was one time exercise using the satellite data of the 2004 year. This
information was not available for data of other years. The methodology for assigning
Cycle of Assessment
Publication Data Period
Forest Cover (km2)
Improved Forest Cover
(km2)
I SFR 1987 1981-83 640819 -
II SFR 1989 1985-87 612717 -
III SFR 1991 1987-89 639323 -
IV SFR 1993 1989-91 638857 -
V SFR 1995 1991-93 638675 -
VI SFR 1997 1993-95 633307 -
VII SFR 1999 1996-98 637288 -
VIII SFR 2001 2000 653898 675906
IX SFR 2003 2002 677816 -
X SFR 2005 2004 690171 690827
XI ISFR 2009 2006 692394 -
XII ISFR 2011 2008-09 692027 692693
XIII ISFR 2013 2010-12 697898 -

20
forest types groups to other years’ data was developed. As per the methodology, the
forest area of 2004, which remained forest area in 2000 and 2008, were assumed
same forest types. The additional forest area in 2000 and 2008, if not plantation
(based on ancillary information), was assigned the forest type based on the
nearness to available forest type confirming to soil and rainfall. The forest type group
has been assigned to the data corresponding to the forest cover of the year 2000,
2004 (interpretational changed area) and 2008.
3.5.4 Stratification of Activity Data
Stratification is required for any heterogeneous population to gain precision of
estimates by dividing it into relatively homogeneous sub-population based on some
stratification variable. Since, in this case, carbon stored in the vegetation is principal
variable which definitely depends upon canopy density and forest type; these two
has been considered as stratification variables. Canopy density wise spatial
information is available from the ‘forest cover mapping’. This was supplemented with
the forest type wise information generated under the national forest type mapping
project carried out by FSI. This gave three canopy density classes and fifteen type
group classes – thus resulting forty-five classes in all.
Using this type/density classification, the area statistics (Activity data) were
generated by a series of steps of intersection and differencing of maps using GIS
techniques.
Table 4: Forest type and Forest density wise area (sq km) for the year 2008
Forest Type Class VDF MDF OF Total
Tropical Wet Evergreen-North East 997 2815 1132 4944
Tropical Wet Evergreen-Western Ghats 4884 8566 2943 16393
Tropical Semi Evergreen-North East 16090 34072 30960 81122
Tropical Semi Evergreen-Eastern Deccan 36 122 201 359
Tropical Semi Evergreen-Western Ghats 1983 10808 5949 18740
Tropical Moist Deciduous Forests 20459 77033 49056 146548
Littoral & Swamp Forests 1703 2533 2223 6459
Tropical Dry Deciduous Forests 18846 126920 130859 276625
Tropical Thorn Forest 150 2901 8529 11580
Tropical & Subtropical Dry Evergreen Forests 151 582 561 1294
Subtropical Pine/Broadleaved Hill Forests 4098 18942 15905 38945
Montane & Moist Temperate Forest 10237 15828 8977 35042
Sub Alpine & Dry Temperate Forest 3937 8130 6027 18094
Alpine Scrub 426 1024 1280 2730
Plantation/TOF 258 11191 22369 33818
Total 84255 321467 286971 692693
Regarding the plantation/TOF category, it is mentioned that it is not possible to
delineate the area under plantations and orchards by the satellite data used for the
forest cover mapping. The information of this category as given under forest types is
21
Selected
District
derived on the basis of ancillary information such as records of State Forest
Departments, toposheets etc. Thus, the area under this category is not complete.
3.5.5 Methodology for Estimating Emission Factors
FSI has been conducting the National Forest Inventory since 2002, following a
robust sampling design. Under NFI, data is being collected regularly from sample
plots in forest lands distributed across the country in different physiographic and
climatic zones. As per the design, the cycle of the NFI is 2 years. Thus, the first NFI
pertains to the period 2002-2004, second NFI to 2004-2006 and third NFI to 2006-
2008. For the purpose of construction of FRL, the data of three cycle was combined
to generate the emission factors. The reason of combining the three cycles data is to
get the more stable estimates of emission factors. During 2002-2008, out of total
21000 sample plots, the data was collected from about 17000 sample plots.
To measure exchange of GHGs between forest eco-system and the atmosphere
which is eventually the change in carbon stocks over time, FSI has used Stock-
Difference method (inventory based approach or periodic accounting) for estimating
various emissions factors as suggested by GPG. Under NFI, data is being collected
regularly from sample plots in forest lands distributed across the country in different
physiographic and climatic zones. The emission factors have been estimated partly
by using the NFI data collected during 2002-2008 and partly by conducting a special
study during 2008-10. The methodology used has been described as follows:
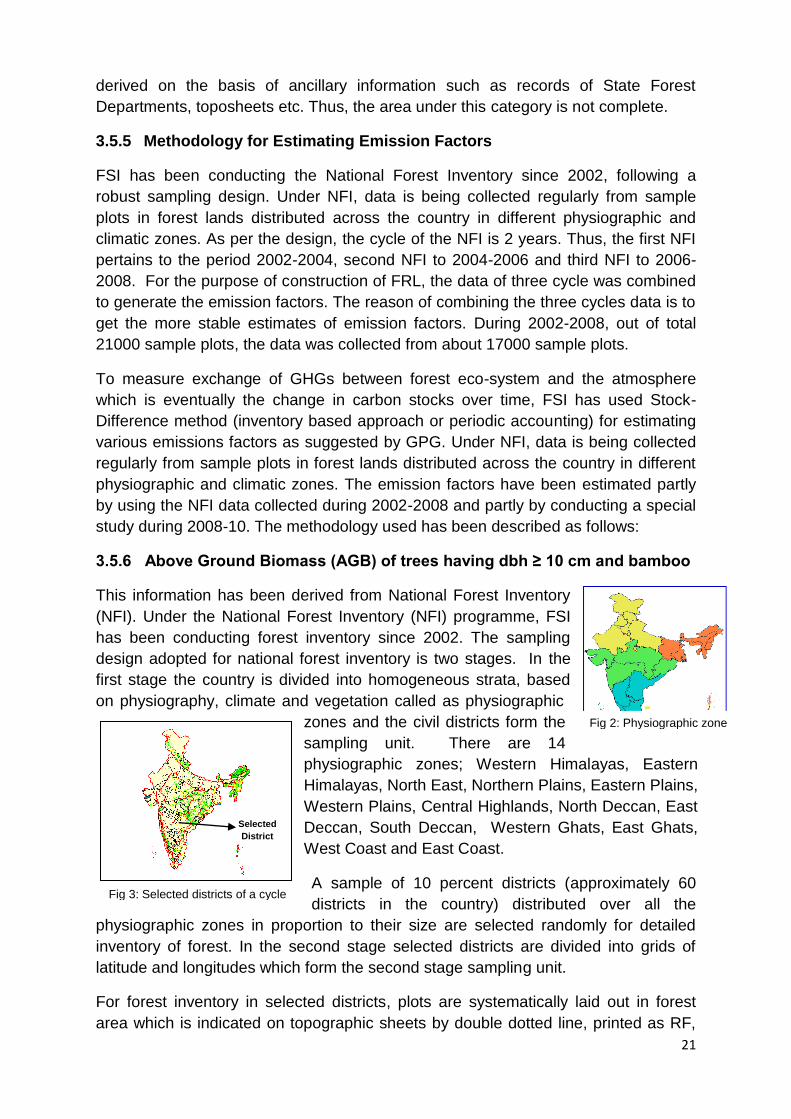
3.5.6 Above Ground Biomass (AGB) of trees having dbh ≥ 10 cm and bamboo
This information has been derived from National Forest Inventory
(NFI). Under the National Forest Inventory (NFI) programme, FSI
has been conducting forest inventory since 2002. The sampling
design adopted for national forest inventory is two stages. In the
first stage the country is divided into homogeneous strata, based
on physiography, climate and vegetation called as physiographic
zones and the civil districts form the
sampling unit. There are 14
physiographic zones; Western Himalayas, Eastern
Himalayas, North East, Northern Plains, Eastern Plains,
Western Plains, Central Highlands, North Deccan, East
Deccan, South Deccan, Western Ghats, East Ghats,
West Coast and East Coast.
A sample of 10 percent districts (approximately 60
districts in the country) distributed over all the
physiographic zones in proportion to their size are selected randomly for detailed
inventory of forest. In the second stage selected districts are divided into grids of
latitude and longitudes which form the second stage sampling unit.
For forest inventory in selected districts, plots are systematically laid out in forest
area which is indicated on topographic sheets by double dotted line, printed as RF,
Fig 3: Selected districts of a cycle
Fig 2: Physiographic zone

22
PF, thick jungle, thick forest etc, shown in green wash and any other area reported
as forest area (generally un-classed forest) by the local Divisional Forest Officer.
For each selected district, Survey of India (SOI) toposheets of 1:50,000 scale (size
15×15 i.e 15 minutes latitudes and 15 minutes longitudes) is divided into 36 grids
of 2½×2½ which is further divided into sub-grids of 1¼×1¼ forming the basic
sampling frame. Two of these sub-grids are then randomly selected to lay out the
sample plots. Other forested sub-grids in the districts are selected systematically
taking first two sub-grids as random start. The intersection of diagonals of such sub-
grids are marked as the centre of the plot at which a square sample plot of 0.1 ha
area is laid out to record the measurements. Within sample plot, sub plots of 1m x
1m are laid out at NE and SW corner for collecting data on soil and forest humus.
The data on herbs and shrubs including regeneration are collected from four square
plots of 1m x 1m and 3m x 3m respectively. These plots are laid out at a distance of
30 meters from the centre of 0.1 ha sample plot in all four directions along diagonals
in non-hilly area and along trails in hilly areas. In case of hilly areas the plot are
taken randomly 3-10 meters away either side of the trail.
At each sample plot all trees of diameter 10 cm and above were measured. The
woody volume of trees for each sample plot was calculated using volume equations
developed by FSI for various species. The volume equation provides above ground
woody volume i.e. above ground volume, which includes volume of main stem
measured upto 10 cm diameter and volume of all branches having diameter 5 cm or
more. As per the design, data from about 21,000 sample plots (size 0.1 ha) had been
collected between years 2002-2008. Data of specific gravity and percentage carbon
content of most of the tree species have been obtained from different published
0.1 ha
Plot for shrubs
31.62 mPlot for herbs
80 m
Soil sample
3m
3m
1m
1m
Fig 4: Layout of the sample plot in plain
areas

23
literature. For few species, percentage carbon content was ascertained by
experimentation and for remaining an average of all other species was used.
Standard formulae were used to calculate biomass and carbon content of each tree.
The estimates of bamboo biomass and carbon stocked in this resource are also
calculated from NFI data. For estimating volume of the bark, the double bark
thickness of trees measured during forest inventory and volume equation of trees
have been used. Using species-wise, dbh and bark thickness, bark volume
equations were developed and were adjusted for ‘bark void factor’ which were
utilized to estimate bark volume. With the help of the specific gravity of bark, the
volume was converted into biomass. Using carbon content percent of wood, carbon
stored in bark was estimated and included in the above ground biomass.
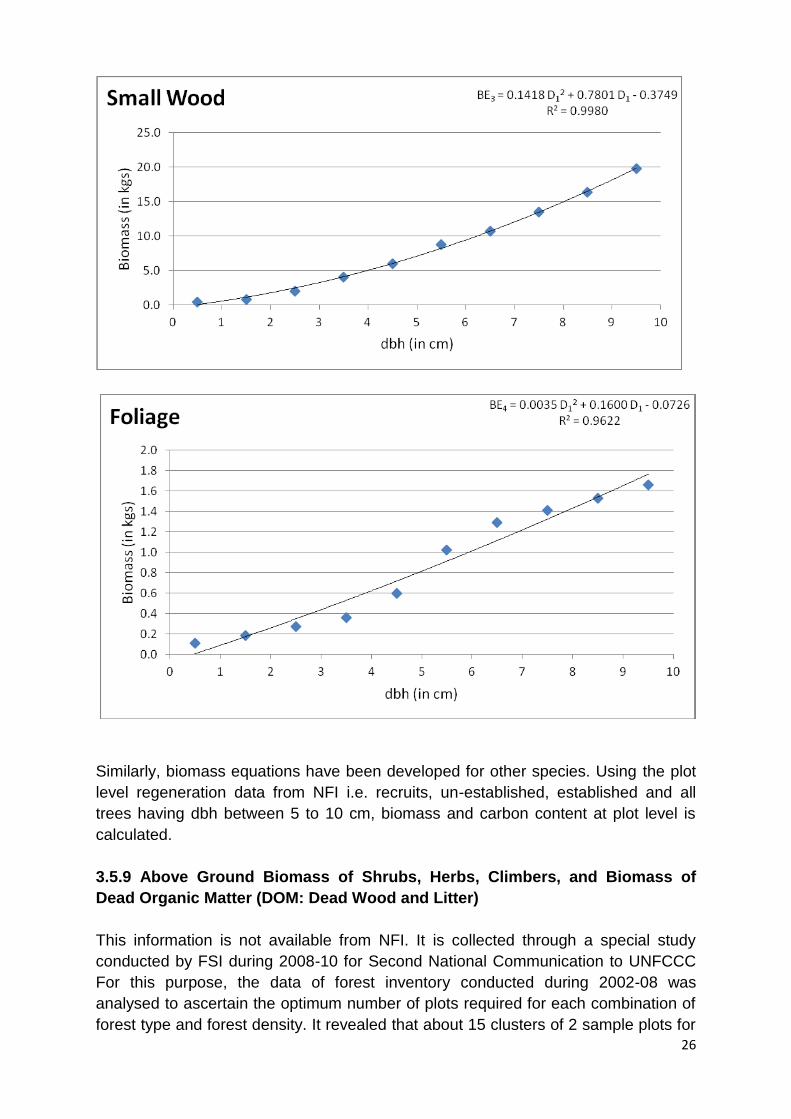
3.5.7 Above Ground Biomass of branches, foliage of trees having dbh ≥ 10 cm
This information is not available from NFI. It is collected through a special study
conducted by FSI during 2008-10 for Second National Communication to UNFCCC.
The trees measured under national forest inventory (NFI) give the volume of main
stem measured upto 10 cm diameter and volume of all branches having diameter 5
cm or more. It does not give the volume of main stem less than 10 cm in diameter,
small branches, foliage, fruits and twigs. Since these components also stock carbon
in them, their contribution in carbon stock should be accounted. This can be done by
developing biomass equations taking dbh as independent variable and biomass of
these components as dependent variable. Once these equations are developed,
biomass of each enumerated tree can be estimated for small wood and foliage.
To develop biomass equations of small wood and foliage for each such species
other than palm like trees, FSI undertook a special study during 2008-10. The
classical approach of developing biomass equation demands for destructive
sampling involving felling of trees. In addition, the process is very tedious and
therefore a new method, which required lopping off, at the most few branches of few
trees, was developed. With the analysis of NFI data collected during 2002-08, 20
important species were identified in each physiographic zone and thereafter dbh
range was ascertained for each of the species. Dbh of most of the species were
ranging from 10 cm to 90 cm. Therefore, it was decided to make dbh classes of 10
cm interval starting from 10-20, 20-30,……,80-90 and 90+.
To collect data for this purpose separate format were devised. In each of the
diameter class, three normal trees were selected. The normality was defined with
respect to that forest. The tree chosen for data collection represent the general
condition of that species in that forest. Its dbh, height, crown length, crown width in
two direction and shape of the crown was recorded. In addition, canopy blank in that
tree was also recorded.
For the purpose of biomass calculation, one normal tree of each diameter class of
each species was selected. In the selected tree one square meter window in all the
four directions was opened in the crown until woody branches of 5 cm. dia is

24
reached. All such material from window was felled i.e. woody branches up to 5 cm
dia, twigs, leaves, fruits and flowers. Biomass of all these parameters was separately
recorded in the prescribed formats. For palm like species two leaves were felled from
each tree in each diameter class and their weight and total number of leaves in those
trees was counted and recorded for biomass calculation.
Taking the dry biomass of small wood/foliage as dependent variable and dbh as
independent variable biomass equations were developed for each species. For
example equations developed for Dalbergia sissoo giving weight in kilograms and
dbh in meters is given as follows:
5 cm

25
Similarly biomass equations for other species were developed. Using the plot level
data of NFI, species wise carbon content, the total biomass and carbon content at
plot level was calculated.
3.5.8 Above ground biomass of trees having dbh < 10 cm
This information is also not available from NFI. It is collected through a special study
conducted by FSI during 2008-10 for Second National Communication to UNFCCC
During the NFI, all trees having diameter 10 cm and above are taken into account.
The trees less than 10 cm in dia are not measured. Since from carbon accounting
view, these trees are to be measured, a special study was conducted by FSI to
develop biomass equations for such trees. For this purpose, as described above, 20
important tree species were identified for each of 14 strata on the basis of NFI data
collected between 2002-08. For each of such species, 3 trees of diameters 1- 9 cm
(at 1.37 m. height) were felled. From the felled trees, separate biomass was
calculated and recorded for wood, twigs and leaves in the prescribed format. Taking
the dry biomass of wood/foliage as dependent variable and dbh as independent
variable biomass equations were developed for each species. For example
equations developed for Dalbergia sissoo giving weight in kilograms and dbh in cms
is given as follows:
26
Similarly, biomass equations have been developed for other species. Using the plot
level regeneration data from NFI i.e. recruits, un-established, established and all
trees having dbh between 5 to 10 cm, biomass and carbon content at plot level is
calculated.
3.5.9 Above Ground Biomass of Shrubs, Herbs, Climbers, and Biomass of
Dead Organic Matter (DOM: Dead Wood and Litter)
This information is not available from NFI. It is collected through a special study
conducted by FSI during 2008-10 for Second National Communication to UNFCCC
For this purpose, the data of forest inventory conducted during 2002-08 was
analysed to ascertain the optimum number of plots required for each combination of
forest type and forest density. It revealed that about 15 clusters of 2 sample plots for

27
each combination, would suffice for estimating the biomass/carbon factors for these
components if 30% permissible error is considered. This survey was conducted in
the districts on randomly selected points which were already inventoried during
2002-2008 and for which forest type and density were known.
For the desired combinations of forest type and forest density, the exact
geographical locations (latitude and longitude) of the optimum number of randomly
selected sample plots were visited. Using this information, centre of sample point,
three concentric plots of size 5mx5m, 3mx3m and 1mx1m were laid out at a distance
of 30m away from the centre of sample point in North and South direction. In 5mx5m
plot, all dead wood above 5 cm diameter were collected, weighed and recorded. In
3mx3m plot, all woody litter i.e. all branches below 5 cm diameter were collected,
weighed and recorded. All shrubs & climbers in 3mx3m plots were uprooted,
weighed and recorded in the prescribed format. In 1m x 1m plot, all herbs were
uprooted, weighed and recorded. Dry biomass was converted to carbon stock. Thus
on the basis of data collected carbon factors were developed for each forest type
and density.
3.5.10 Organic matter in soil and forest floor
During forest inventory, the data on forest floor (non-woody litter and humus) and soil
carbon was also collected from each sample plot. For collecting data on humus and
soil carbon, two sub-plots of size 1mx1m are laid out within the main plot. The forest
floor from both the plots was first swept and material so collected was weighed and a
portion of same was kept for carbon analysis. Further, at the center of these two sub-
plots, a pit of 30cmx30cmx30cm was dug and a composite sample of soil of 200gm
was kept for organic carbon analysis. Samples of soil and humus were got analysed
from the standard soil labs using Walkley-Black method and were used for the
calculation (A detailed notes on estimation of carbon stock has already shared with
AT).
3.5.11 Below Ground Biomass
This is the most difficult pool to measure and generally not measured in forest
inventory. It is being included using a relationship (usually a root-to-shoot ratio) to
aboveground biomass which have been established by various researchers. IPCC,
GPG, 2003 also provide default ratios for six major global forest types. FSI has
selectively used these defaults to arrive at the carbon number.
3.5.12 Synthesizing Data for National Carbon Estimation
GIS techniques were used to intersect forest type map and forest cover map with
three density classes which has resulted in creation of 45 strata (forest type and
canopy density intersections) one corresponding to each year. Further the
geographical location of each sample plot of NFI was duly recorded with GPS during
field inventory. These locations helped in creating a GIS compatible point layer of the
forest inventory plots. This NFI point layer map was overlaid on the above map

28
having 45 forest type - canopy density strata. The NFI points falling in each stratum
were identified. For each stratum, the plot wise information on all the parameters of
each carbon pool, were aggregated to have generalized factor for that stratum.
Biomass and carbon factors were specifically developed for each stratum like,
shrubs, herbs, climbers, dead wood and woody litter. Multiplying activity data with
these factors, different parameter wise total carbon for all the 45 strata were arrived
at. This information was arranged into five carbon pools. Adding pool wise carbon
contents, national carbon estimates were arrived at two point of time. The difference
between pool wise carbon estimates gave the net removal of carbon.
4. Proposed Reference Level
Historical emission estimates are developed based on method narrated above using
the modified time series activity data of the year 1994, 2000, 2004 and 2008. Since
the classification based on digital satellite data of 1994 was reconstructed without
ground truthing the accuracy of classification could not be assessed. Moreover, the
NFI in India started from 2002 and the field data for emission factors pertains to
2002-08 which may be considered unrealistic for 1994.
Further, during late 1990’s and early 2000’s number of new Acts and policies were
introduce to safeguard ecological security and interest of common man viz Biological
Biodiversity Act, 2002, Scheduled Tribes and Other Traditional Forest Dwellers
(Recognition of Forest Rights) Act, 2006, National Environment Policy, 2006, Agro-
forestry policy etc. Many of these have significant bearing on the management of
forest. Considering all above facts it was decided that the historic period of 2000 to
2008 should be considered for construction of forest reference level. The
methodology of activity data and emission factors have already been described
above. For the activity data forest cover of 2000, 2004 and 2008 as published in
ISFRs were improved and forest cover maps were revised accordingly. Emission
factors were derived using NFI data of 2002 to 2008. The activity data and carbon
stock in different pools used for construction of FRL has been given in table 5.
Table: 5: Activity data and pool wise carbon stock used for FRL
Data Year
Forest Cover Area
(sq.km)
AGB (m.tonnes)
BGB (m.tonnes)
DOM (wood) (m. tonnes)
DOM(Litter) (m.tonnes)
SOC (m.
tonnes)
Total Carbon
(m. tonnes)
2000 675906 2168.2 670.0 26.1 124.7 3847.5 6836.4
2004 690827 2309.7 760.3 25.2 119.0 3706.0 6920.3
2008 692693 2216.2 687.5 28.5 128.4 3884.3 6944.9
From table 5, the annual carbon stock has been worked out for the year 2000, 2004
and 2008. Based on annual carbon stock, historical average of annual carbon stock
has been calculated. The same has been given in table 6.

29
Table: 6 Annual Increment Carbon Stock between 2000-08
Year Annual
Increment in Carbon stock
Hist-Av (2000-2008)
2000 19.8 13.6
2004 21.0 13.6
2008 6.2 13.6
From table, annual CO2 equivalent has been worked out for the year 2000, 2004 and
2008. The historical CO2 equivalent for the period 2000 to 2008 has been calculated
and given in table 7.
Table: 7 Annual CO2 equivalent between 2000-08
Year Annual CO2 equivalent
Hist-Av (2000-2008)
2000 72.7 49.7
2004 76.8 49.7
2008 22.6 49.7
Based upon above data, India’s proposed Forest Reference Level
-49.70 million tonnes CO2 Equivalent/ year OR -49700000 t CO2 Equivalent/ year
5. Transparent, Complete, Consistent and Accurate Information
As per the good practice guidance for LULUCF sector 2003 for carbon accounting,
the data used for constructing of FRL should be transparent, complete, consistent
and accurate. India has followed these principles while constructing the FRL which
are described as follows:
5.1 Transparent
This requires sufficient and clear documentation of the accounting process to be
available so that credibility and reliability of estimates can be assessed. For activity
data, FSI has used the satellite based remote sensing data. FSI has been carrying
out forest cover mapping since 1987 using the satellite data. The data used for the
purpose of FRL is LISS-III data of Resourcesat-I. All the classified maps of forest
cover for different period are available with FSI. For emission factors, NFI data was
used. The data of National Forest Inventory is available in the database. The
methodology and results are published in the ‘State of Forest Report (SFR)’
biennially. All these report are available on FSI’s website (www.fsi.nic.in).
30
5.2 Complete
By complete information, means the provision of information that allows for the
reconstruction of the FRL. The information used by India for activity data and
emission factors are readily available. The methodology, data sets etc are available
in published document of FSI. All the relevant documents/data used for construction
of FRL is available and can be made available to anyone.
5.3 Consistent
Accounting estimates for different years, gases and categories should reflect real
differences in carbon rather than differences in methods. Since the technology,
methodology and data is changing over the period, for the consistency purposes the
old information is revised and brought out upto the level of latest level. The data
used by India for construction of FRL is consistent. This fact has been already
mentioned in subsequent SFRs based on which revised activity data has been
constructed. For FRL construction, the same methodologies and data sets have
been used as was used for reporting the GHG inventory under the National
communications. Moreover, the same experts and same institutions are enrusted the
task of construction of FRL who were involved in reporting GHG for National
Communication. Thus, there is a consistency between the FRL and GHG inventory.
5.4 Comparable
FSI has been following the same satellite data and same methodology since 2000 for assessment of forest cover. Similarly, the NFI data used for construction of FRL is same for the entire historic period. As such, the results given for different year during 2000 to 2008 are comparable.
5.5 Accurate
Accuracy is how close estimates are to the true value; accurate measurements lack
bias and systematic error. Precision is the level of agreement between repeated
measurements; precise measurements have lower random error. To give confidence
in the estimate, both accuracy and precision are desirable. For activity data FSI
assesses accuracy of forest cover classification is each SFR. Similarly, the standard
error percent is estimated for growing stock estimates and given in the report. The
accuracy of forest cover classification in different SFRs is abobe 90% and standard
error percent for growing stock is less than 3 % at national level. For this purpose
FSI has Quality control and quality assurance schemes at different levels. For
estimating the carbon stock, FSI has used most of the data/ estimates and
information generated by FSI itself, which have high and known reliability level.
Similarly, litter and soil organic carbon have estimated with high precision. For
missing components of biomass, a separate study was undertaken and results of the
study are highly precise.
************************************

31
Annexure – 1
Table 1: Timber Production from Recorded Forest Area in India during 2005-10
(000’ m3)
States/UTs 2005-06 2006-07 2007-08 2008-09 2009-10 Total Average Andhra Pradesh 111.38 293.11 191.85 88.64 116.05 801.03 160.21 Arunachal Pradesh
40.66 40.50 30.78 35.05 31.37 178.35 35.67
Assam 11.97 27.49 13.63 13.93 7.33 74.35 14.87 Bihar 15.62 7.23 7.23 6.87 5.99 42.94 8.59 Chhattisgarh 113.61 176.45 209.32 173.49 199.32 872.20 174.44 Gujarat 25.05 29.10 48.81 42.51 32.44 177.90 35.58 Goa 0.45 0.42 0.51 0.17 0.18 1.73 0.35 Haryana 151.16 165.73 140.76 166.66 164.12 788.42 157.68 Himachal Pradesh
356.91 220.82 246.97 227.98 272.00 1324.68 264.94
Jammu & Kashmir
86.40 80.85 68.49 71.55 61.32 368.61 73.72
Jharkhand 3.38 0.56 10.76 11.62 4.67 30.99 6.20 Karnataka 77.53 65.69 44.84 44.91 45.28 278.24 55.65 Kerala 43.41 26.79 48.65 50.60 50.60 220.05 44.01 Madhya Pradesh
345.45 313.42 372.06 336.95 143.74 1511.62 302.32
Maharashtra 88.05 119.12 132.61 141.00 125.47 606.26 121.25 Manipur 9.07 9.11 8.58 2.67 6.41 35.85 7.17 Meghalaya 0.08 0.98 1.02 0.88 0.52 3.49 0.70 Mizoram 2.32 4.41 11.62 11.71 3.13 33.19 6.64 Nagaland 25.00 25.00 25.00 25.00 25.00 125.00 25.00 Odisha 19.03 22.61 21.84 27.80 20.79 112.07 22.41 Punjab 134.63 129.06 72.33 69.76 79.58 485.36 97.07 Rajasthan 37.90 35.40 38.50 36.30 36.30 184.40 36.88 Sikkim 0.09 0.05 0.03 0.07 0.05 0.30 0.06 Tamil Nadu 4.90 5.50 4.78 4.01 4.12 23.31 4.66 Tripura 2.10 2.10 2.10 2.10 2.10 10.50 2.10 Uttar Pradesh 218.73 200.58 310.67 300.08 313.13 1343.20 268.64 Uttarakhand 331.32 283.08 310.58 271.62 242.62 1439.22 287.84 West Bengal 85.99 114.59 231.58 151.12 183.40 766.68 153.34
Union Territories A & N Islands 6.91 5.29 9.28 8.97 8.06 38.50 7.70 Total 2349.10 2405.04 2615.18 2324.02 2185.09 11878.44 2375.69
Source: Forest Sector Report India 2010, ICFRE, MoEF&CC, Government of India.

32
Annexure – 2
Table 2: State/UT wise Potential Production of timber from TOF (Million m3)
S.No. States Growing Stock
of tree spps. used as timber
Annual potential production of
timber
1 Andhra Pradesh 115.683 1.939
2 Arunachal Pradesh 74.516 0.762
3 Assam 41.336 1.355
4 Bihar 47.195 1.209
5 Chhattisgarh 70.069 1.826
6 Delhi 1.040 Negligible*
7 Goa 3.895 0.019
8 Gujarat 117.993 3.099
9 Haryana 15.268 1.975
10 Himachal Pradesh 21.146 0.939
11 Jammu & Kashmir 147.745 0.830
12 Jharkhand 51.308 1.327
13 Karnataka 101.773 2.023
14 Kerala 49.059 1.628
15 Madhya Pradesh 85.106 3.168
16 Maharashtra 147.029 3.519
17 Manipur 10.691 0.220
18 Nagaland 9.392 0.289
19 Meghalaya 20.964 0.421
20 Mizoram 12.681 0.342
21 Orissa 73.624 1.418
22 Punjab 19.305 2.650
23 Rajasthan 81.560 3.463
24 Sikkim 2.017 0.025
25 Tamil Nadu 70.328 0.834
26 Tripura 7.391 0.256
27 Uttar Pradesh 81.683 5.082
28 Uttarakhand 20.917 0.697
29 West Bengal 45.693 1.436
30 Andaman & Nicobar 0.666 0.007
31 Chandigarh 0.084 Negligible
32 Dadar Nagar Haveli 0.833 0.014
33 Daman & Diu 0.108 Negligible
34 Lakshadweep 0.049 Negligible
35 Pondicherry 0.320 0.010
Total 1548.427 42.774
*- Less than 0.005 million cum has been considered as ‘negligible’. Source: ISFR 2011, FSI Dehradun
33
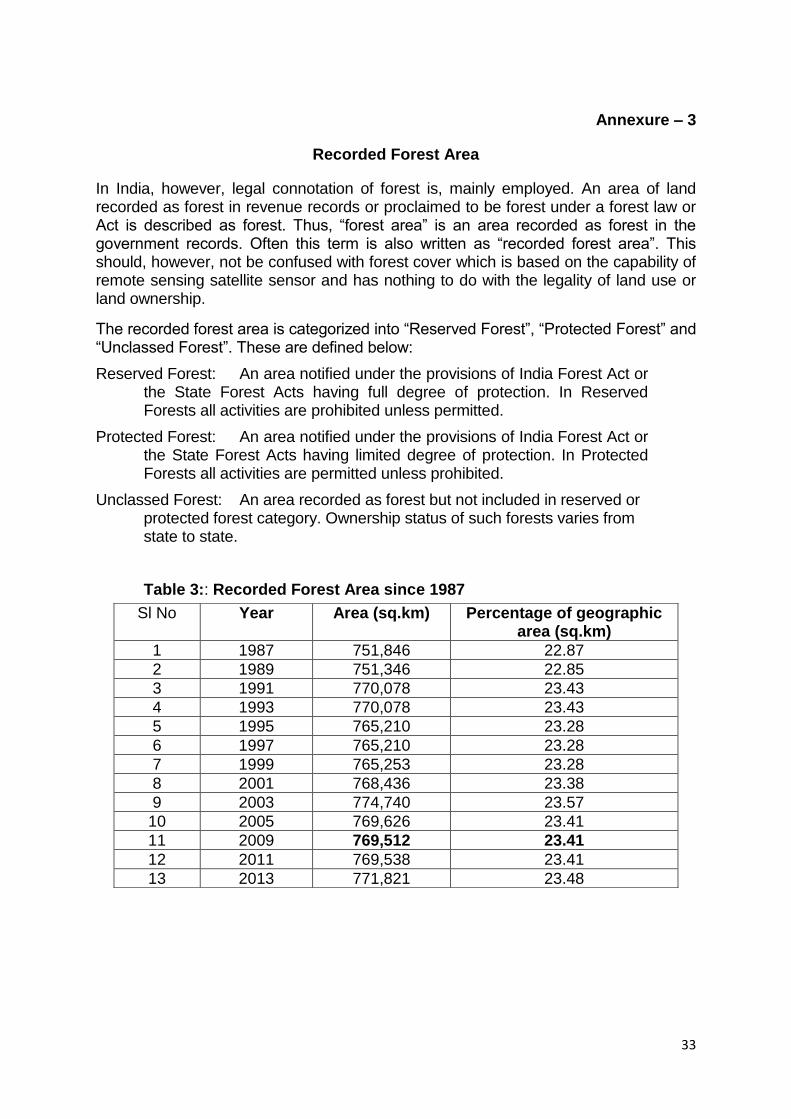
Annexure – 3
Recorded Forest Area
In India, however, legal connotation of forest is, mainly employed. An area of land recorded as forest in revenue records or proclaimed to be forest under a forest law or Act is described as forest. Thus, “forest area” is an area recorded as forest in the government records. Often this term is also written as “recorded forest area”. This should, however, not be confused with forest cover which is based on the capability of remote sensing satellite sensor and has nothing to do with the legality of land use or land ownership.
The recorded forest area is categorized into “Reserved Forest”, “Protected Forest” and “Unclassed Forest”. These are defined below:
Reserved Forest: An area notified under the provisions of India Forest Act or the State Forest Acts having full degree of protection. In Reserved Forests all activities are prohibited unless permitted.
Protected Forest: An area notified under the provisions of India Forest Act or the State Forest Acts having limited degree of protection. In Protected Forests all activities are permitted unless prohibited.
Unclassed Forest: An area recorded as forest but not included in reserved or protected forest category. Ownership status of such forests varies from state to state.
Table 3:: Recorded Forest Area since 1987
Sl No Year Area (sq.km) Percentage of geographic area (sq.km)
1 1987 751,846 22.87
2 1989 751,346 22.85
3 1991 770,078 23.43
4 1993 770,078 23.43
5 1995 765,210 23.28
6 1997 765,210 23.28
7 1999 765,253 23.28
8 2001 768,436 23.38
9 2003 774,740 23.57
10 2005 769,626 23.41
11 2009 769,512 23.41
12 2011 769,538 23.41
13 2013 771,821 23.48

34
Annexure – 4
Table 4: Annual Fuelwood Consumption
Sl.No.
State
No of Persons
using Fuel
Wood (millions)
No of Persons
using Fuel
Wood from
Forest (million)
Quantity of Fuel Wood used
(million tonnes)
Quantity of Fuel Wood
used from Forest (million tonnes)
Percentage of column
(6) to column (5)
(1) (2) (3) (4) (5) (6) (7)
1 Andhra Pradesh 64.992 7.573 24.293 2.966 12.21
2 Arunachal Pradesh 0.882 0.698 0.402 0.325 80.93
3 Assam 23.373 5.812 11.421 2.494 21.83
4 Bihar 65.816 3.115 11.475 0.465 4.05
5 Chhattisgarh 20.078 7.818 4.366 1.378 31.56
6 Gujarat 40.092 7.497 9.731 2.225 22.87
7 Haryana 8.092 0.012 1.494 0.003 0.17
8 Himachal Pradesh 5.912 5.646 1.214 1.163 95.80
9 J & K 8.375 4.540 1.394 1.015 72.80
10 Jharkhand 21.733 9.984 4.844 2.849 58.81
11 Karnataka 44.681 9.584 20.967 5.776 27.55
12 Kerala 29.504 4.429 14.543 2.183 15.01
13 Madhya Pradesh 51.007 24.839 13.665 7.191 52.63
14 Maharashtra 68.904 31.845 9.508 4.527 47.61
15 Orissa 33.029 11.110 8.894 2.971 33.40
16 Punjab 13.628 0.136 3.348 0.029 0.87
17 Rajasthan 57.992 11.414 18.782 3.698 19.69
18 Tamil Nadu 42.405 7.429 12.387 2.601 21.00
19 Uttar Pradesh 175.096 10.495 19.063 1.294 6.79
20 Uttarakhand 7.289 6.060 2.566 2.139 83.38
21 West Bengal 51.202 18.574 14.158 6.361 44.92
22 North Eastern States 9.383 6.588 5.274 3.822 72.48
23 UTs 10.412 4.432 2.633 1.272 48.32
Grand Total 853.879 199.631 216.421 58.747 27.14
Source: ISFR 2011

35
Annexure – 5
Table 5: Adult Cattle Unit Dependent on Forests
S.No States Total Adult Cattle Unit
Total Adult Cattle Unit
dependent on forests
Total Adult Cattle Unit completely
dependent on forests
% of column (5) to column
(3)
(1) (2) (3) (4) (5) (6)
1 Andhra Pradesh 34.84 14.58 7.57 21.73
2 Arunachal Pradesh 0.89 0.85 0.73 82.57
3 Assam 11.96 4.89 3.56 29.81
4 Bihar 23.57 0.90 0.66 2.78
5 Chhattisgarh 12.60 9.24 5.98 47.48
6 Gujarat 21.02 4.17 3.28 15.60
7 Haryana 9.58 0.0005 0.002 0.02
8 Himachal Pradesh 3.79 3.73 2.73 72.18
9 J & K 6.10 1.25 0.60 9.90
10 Jharkhand 12.50 2.13 1.17 8.85
11 Karnataka 18.97 8.63 2.99 15.77
12 Kerala 2.08 0.74 0.15 7.01
13 Madhya Pradesh 36.94 18.79 13.18 35.68
14 Maharashtra 27.53 23.95 16.56 60.15
15 Orissa 15.96 6.40 5.60 35.09
16 Punjab 8.61 0 0 NA
17 Rajasthan 32.32 12.23 7.19 22.24
18 Tamil Nadu 16.48 2.94 2.07 12.55
19 Uttar Pradesh 54.20 9.73 3.02 5.58
20 Uttarakhand 4.28 4.17 2.66 62.16
21 West Bengal 23.30 8.35 5.12 21.96
22 Other NE States 3.36 2.07 1.26 37.42
23 UTs 0.90 0.75 0.37 40.47
Total 381.78 140.48 86.39 22.63
Source: ISFR 2011

36
Anexure-6
Change Matrix
The change matrix is generally prepared to analyse the dynamics of changes from
one land class to other classes observed across the country between two epoch of
time. The change matrixes indicating the change in the extent of forest cover classes
between 2000 and 2004 and 2004-2008 is given below in Table 6 and 7
Table 6: Forest cover change matrix between 2000 and 2004.
INDIA
CLASS 2004 Land Cover
in 2000(km2) VDF MDF OF Scrub Non Forest
VDF 48244 32 9 2 60 48347
MDF 31151 314638 16773 55 17506 380123
OF 3633 3008 240299 89 406 247435
Scrub 79 1358 5155 40845 55 47492
Non Forest 681 945 24822 232 2537186 2563866
Land Cover 2004(km2) 83788 319981 287058 41223 2555213 3287263
Net change 35441 -60142 39623 -6269 -8653
Degradation Deforestation Enhancement Afforestation
Table 7: Forest cover change matrix between 2004 and 2008.
INDIA
CLASS
Forest cover in 2008 (km2) Land Cover
in 2004(km2) VDF MDF OF Scrub
Non Forest
VDF 78211 4077 694 9 797 83788
MDF 4219 289397 16965 352 9048 319981
OF 616 19615 244826 1721 20280 287058
Scrub 3 741 2270 33205 5004 41223
Non Forest 690 8509 21859 6971 2517184 2555213
Land Cover in 2008 (km2) 83739 322339 286614 42258 2552313 3287263
Net change -49 2358 -444 1035 -2900
Degradation Deforestation Enhancement Afforestation
The above matrices gives the extant (activity data) of deforestation, forest
degradation, enhancement in canopy density and new area under forest land cover.
At the same time, diagonal elements of forest category relates to particular activity of
‘conservation of forest carbon stock’ of REDD+. It also provides the annual changes
in area of these categories which relates to three activities of REDD+ as given in the
following Table 5.

37
Annexure-7
Depiction of FCC and classified sample map of part of Telangana State

38
Annexure-8
Bibliography
FSI, (2015). India State of Forest Report 2017, Forest Survey of India, Dehradun,
India
FSI, (2012). India State of Forest Report 2011, Forest Survey of India, Dehradun,
India
FSI, (2007). State of Forest Report 2005, Forest Survey of India, Dehradun, India
FSI, (2003). India State of Forest Report 2001, Forest Survey of India, Dehradun,
India
FSI, (2013). carbon stock in India’s Forests, Forest Survey of India, Dehradun, India
MoEF & CC, (2015): Reference Document for REDD+ in India, Ministry of
Environment, Forests & Climate Change
MoEF & CC, (2018): National REDD+ Strategy-India, Ministry of Environment,
Forests & Climate Change
ICFRE, (2013), Forest Sector Report India, 2010, Indian Council of Forestry
Research and Education, Dehradun
India forest Policy, 1988
MoEF & CC, (2014), National Working Plan Code 2014, Ministry of Environment,
Forests & Climate Change
GOFC-GOLD, 2010: Global Observation of Forest and Land Cover Dynamics. A
Sourcebook of Methods and Procedures for Monitoring and Reporting
Anthropogenic GHG as Emissions and Removals Caused by Deforestation,
gains and Losses of Carbon Stocks in Forests, Remaining Forests, and
Forestation. Report Version COP15-1. Alberta: GOFC-GOLD Project Office,
2009. Web. 14 Aug. 2010.
2003 IPCC Guidelines for National Green house Gas Inventories for LULUCF sector
FSI, (2011). Project Report for Second National Communication on forests for
LULUCF Forest Survey of India, Dehradun, India