Embed Size (px)
Citation preview
Strictly private and confidential
Nexense Technologies USA Inc.
Indicative Valuation Study September 2015
Nexense Technologies USA Inc. | Indicative Valuation Study September 2015
2
BDO Ziv Haft Amot Bituach House Building B, 48
Menachem Begin Road, Tel Aviv 66180 Israel www.bdo.co.il
To whom it may concern,
Per your request, BDO Ziv Haft Consulting & Management Ltd. (Hereinafter:
"BDO") performed a valuation analysis of Nexense Technologies USA Inc.
(hereinafter: "the Company" or "Nexense") as of 30 September 2015
(Hereinafter: the "Valuation Date").
This report, the analysis and conclusions herein are based on information
that has been generated by the company and therefore, has not been
subject to our independent verification.
Following are the information sources upon which our study was based:
The Company's business plan and other data provided by the Company's
management.
The Company's website.
Bloomberg.
Publicly available information.
The analysis and conclusions contained herein are based on various
assumptions which may not remain valid for the whole of the relevant
period. Moreover, the assumptions are based upon factors and events
subject to uncertainty. Future results or values could be materially different
from the forecasts and analysis contained herein.
BDO makes no representations or warranty, express or implied, as to the
accuracy or completeness of the underlying assumptions, estimates analyses
or other information contained in this report, and nothing contained herein
is or shall be relied upon as a promise or a representation, whether as to the
past, the present or the future.
Please note that some of the financial data received, was in electronic-
spreadsheet format and did not include any audited, reviewed or otherwise
formulated financial statements, as should be the case in a standard
valuation study.
Nexense Technologies USA Inc. | Indicative Valuation Study September 2015
3
This report is not intended to, and may not, be relied upon by any other
party and, therefore, any other person or entity who received this report or
the information contained herein, with BDO permission or otherwise, is
hereby put on notice that (1) they are responsible for their own analysis and
may not rely on any information contained herein, and (2) BDO makes no
representations or warranties, including as to the accuracy or completeness
of the information contained herein or any other written or oral
communication transmitted or made available to (the third party) and
expressly disclaims any and all liabilities based on such information or on
omissions there from.
As visible in this indicative value analysis, we believe the Company's fair
value should be approximately USD 58 million.
Should you have any questions concerning our analysis or report, please
contact us at +972-3-6374391.
Respectfully submitted,
BDO Ziv Haft
Consulting & Management Ltd.
Nexense Technologies USA Inc. | Indicative Valuation Study September 2015
4
Table of Contents
Company Overview 5
Industry Analysis 14
Valuation Methodology 20
Indicative Valuation Analysis 22
Nexense Technologies USA Inc. | Indicative Valuation Study September 2015
5
Section 1
Company Overview
Nexense Technologies USA Inc. | Indicative Valuation Study September 2015
6
Company Overview
General Description Products
Nexense Technologies USA Inc is a subsidiary of Nexense Ltd, is an Israel-
based company which developed several sensor solutions for the
measurement of various physical parameters, offering extreme accuracy and
resistance in an affordable cost. The Company was established in 2001 by
Arik Eliav, an expert in the field of sensors, and is partly held by GE
Healthcare Ltd. Some of its major clients include Boeing, Johnson & Johnson
and Samsung.
The Company's sensors offer direct measurement of the inspected element
without conversion, as they measure the parameter itself in Direct
Measuring Method without converting it in order to secure maximum Signal
to Noise ratio and to conduct measurements in harsh conditions.
Its state-of-the-art sensor technology has a signal-to-noise ratio (SNR) of up
to 190 dB, 22-bit resolution, digital output without an ADC, and the ability
to make measurements without the need for any direct contact, in a non-
intrusive and non-emissive manner.
Furthermore, the technology and its applications are protected by multiple
patents and pending applications, in order to ensure exclusivity and long
term advantage.
The Company focuses on implementing its sensors in solutions for two
medical conditions:
1. Sleep Apena.
2. Snoring.
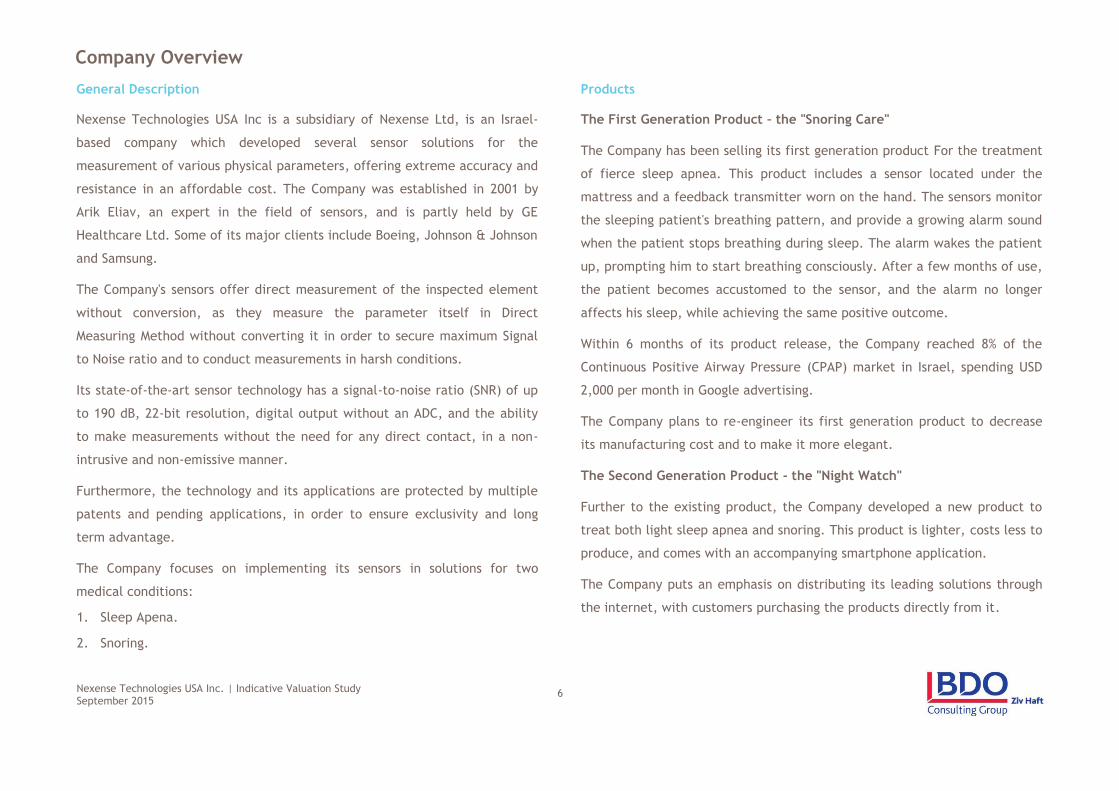
The First Generation Product – the "Snoring Care"
The Company has been selling its first generation product For the treatment
of fierce sleep apnea. This product includes a sensor located under the
mattress and a feedback transmitter worn on the hand. The sensors monitor
the sleeping patient's breathing pattern, and provide a growing alarm sound
when the patient stops breathing during sleep. The alarm wakes the patient
up, prompting him to start breathing consciously. After a few months of use,
the patient becomes accustomed to the sensor, and the alarm no longer
affects his sleep, while achieving the same positive outcome.
Within 6 months of its product release, the Company reached 8% of the
Continuous Positive Airway Pressure (CPAP) market in Israel, spending USD
2,000 per month in Google advertising.
The Company plans to re-engineer its first generation product to decrease
its manufacturing cost and to make it more elegant.
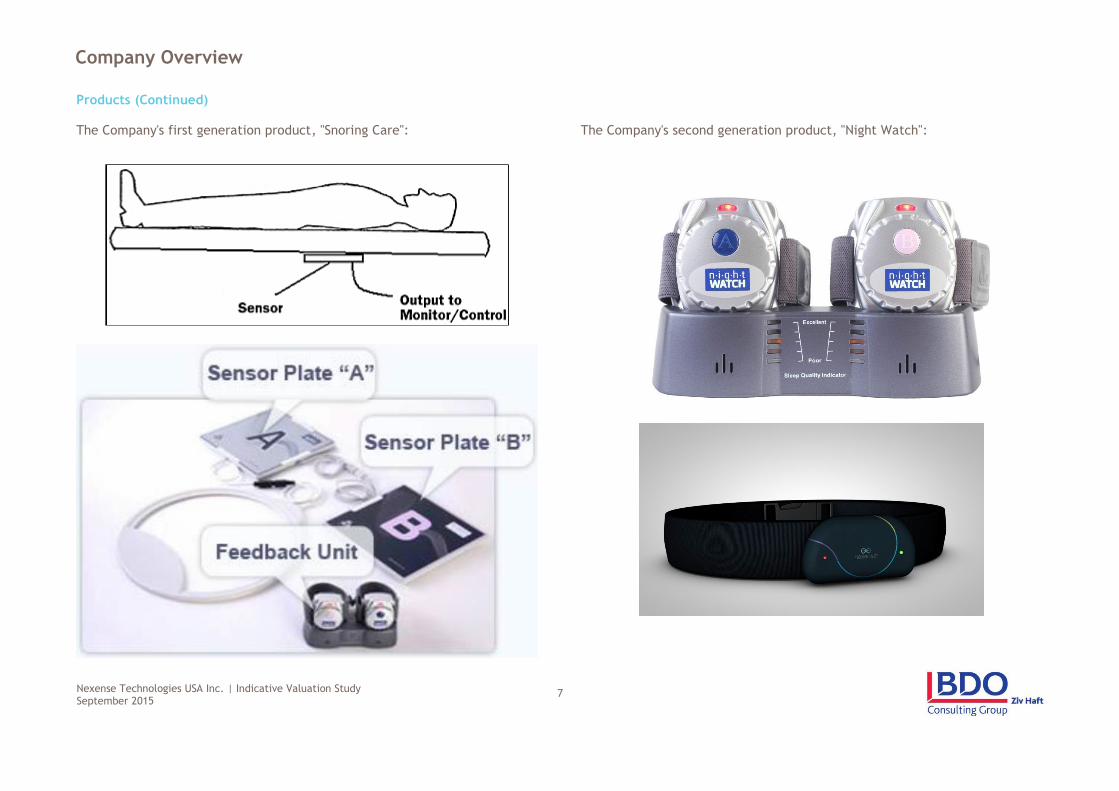
The Second Generation Product - the "Night Watch"
Further to the existing product, the Company developed a new product to
treat both light sleep apnea and snoring. This product is lighter, costs less to
produce, and comes with an accompanying smartphone application.
The Company puts an emphasis on distributing its leading solutions through
the internet, with customers purchasing the products directly from it.
Nexense Technologies USA Inc. | Indicative Valuation Study September 2015
7
Company Overview
Products (Continued)
The Company's first generation product, "Snoring Care":
The Company's second generation product, "Night Watch":
Nexense Technologies USA Inc. | Indicative Valuation Study September 2015
8
Company Overview
Nexense's Sensor Technology
The Company's measurement technology utilizes a technique that measures
a range of physical parameters as a function of time. Using specially
developed sensors and equipment, its devices measure the time it takes an
energy wave to propagate through a specific medium.
When viewed as a function of time, all physical parameters can be measured
to a level of accuracy previously unattainable other than by using extremely
complicated and costly equipment. An energy wave is repeatedly
transmitted from one point in the object to a receiver at another location in
the object.
A predetermined reference point is detected in the cyclically repeating
energy wave at the second location. The frequency of transmission of the
energy wave is continuously and automatically altered in a closed loop
controlled by the specific characteristic of the measured component. This
change in frequency is used to produce a measurement of the physical
parameter.
This measurement is accomplished in two stages. In the first stage, the
measured parameter acts upon the transit time of the wave. In the second
stage, the transit time is converted to a frequency.
In a typical application, a transmitter and a receiver are placed on or within
a specific medium. The transmitter can emit any type of cyclically repeating
energy wave.
Depending on the application, this wave could be acoustic, radio, light, or
magnetic and can be transmitted through any medium, including air,
silicone, metals, liquids, or gases. The parameter acting on the medium
(force, pressure, temperature, etc.) causes a minute displacement of the
medium or a change in its natural velocity coefficient (the speed at which
the energy wave travels through the medium) and thus causes an actual or
virtual displacement of the transmitter and receiver.
Virtual displacements can result from a temperature change. For example,
an acoustic wave at 5,000 m/s through metal will experience a change in its
velocity as the temperature changes. During the process, the transit time of
the frequency changes.
Generally speaking, the transit time gives complete information regarding
displacement and temperature. However, measuring transit time directly
presents some challenges. First, to directly measure the transit time of a
single pulse, a resolution of a few picoseconds is required. Second, when
sending the pulse signal, the received signal needs to be strongly amplified
in order to obtain a rectangular shape.
To obtain the time-stabilized signal, the Company uses a specially designed
time-to-frequency converter. In effect, this is an electrical oscillator with a
delay line, i.e., the transmitter and receiver are connected to the electrical
feedback loop.
Nexense Technologies USA Inc. | Indicative Valuation Study September 2015
9
Company Overview
Nexense's Sensor Technology (Continued)
The receiver’s signal is amplified and then passed to a high-speed
comparator that produces a square signal. The comparator’s output is
connected to the transmitter. Immediately after receiving the signal, the
transmitter sends it back through the medium (or channel), completing the
feedback loop.
Any electrical circuit has noise. If the hysteresis of the comparator is
sufficiently low, the noise signal will pass through the feedback loop.
However, the resonant transmitter and receiver loop will only select
frequencies within their bandwidth.
There are two ways to initiate the oscillations in the loop: an artificial pulse
or a pulse that appears when power is switched on. Because of the resonant
features of the transducers, a group of several pulses will be obtained on
the receiver output and then sent to the channel via the transmitter
synchronizing the phase. On each following pass, the pulses will have
greater duration until finally the continuous frequency (a standing wave) is
established in the loop, providing the sensing function.
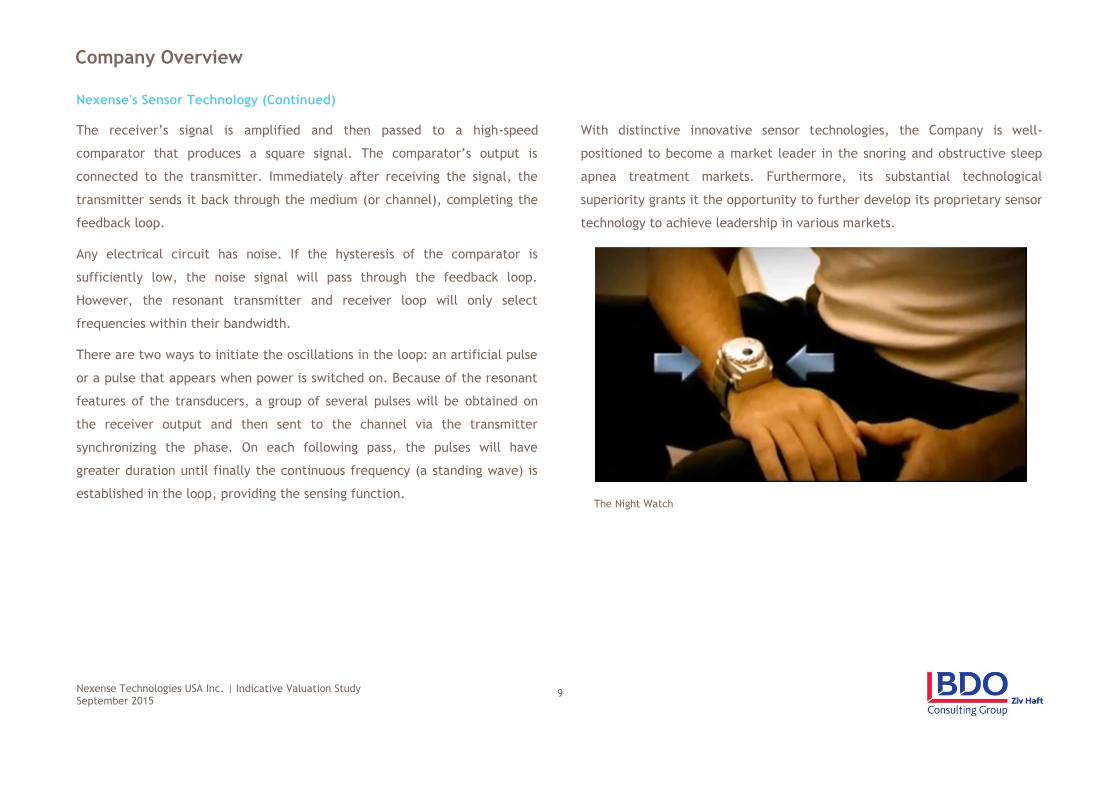
With distinctive innovative sensor technologies, the Company is well-
positioned to become a market leader in the snoring and obstructive sleep
apnea treatment markets. Furthermore, its substantial technological
superiority grants it the opportunity to further develop its proprietary sensor
technology to achieve leadership in various markets.
The Night Watch
Nexense Technologies USA Inc. | Indicative Valuation Study September 2015
10
Company Overview
Intellectual Property
The company’s intellectual property is protected by multiple patents In
order to provide its clients a strong IP protection.
Intellectual property rights are one of the Company's most important assets.
Its technology, applications and products, both in the medical and non-
medical fields, are protected by the laws of the United States and other
jurisdictions worldwide.
In most cases, International Patent Applications were filed under the Patent
Cooperation Treaty (PCT Applications) to preserve the right to obtain patent
protection in many countries throughout the world. At present, several of
these are still within the permitted period for foreign filings.
Patent Applications have also been filed in a many countries, including
Europe, Japan, S. Korea, China, and Canada.
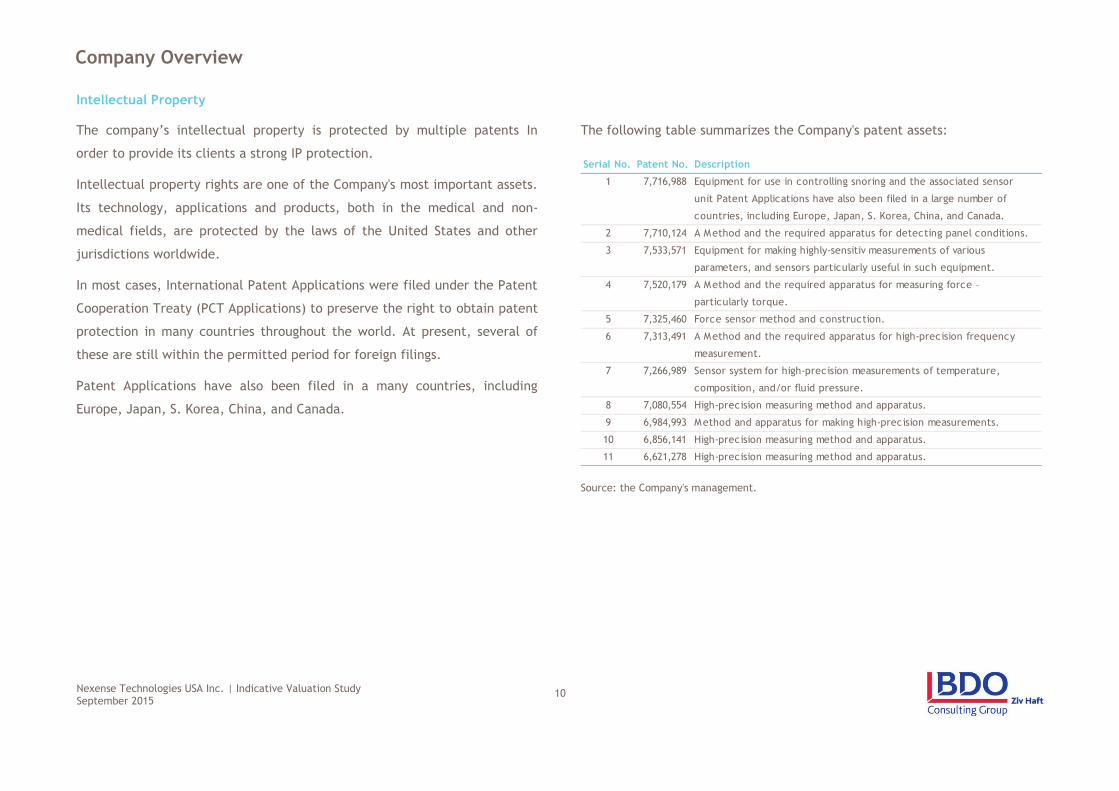
The following table summarizes the Company's patent assets:
Source: the Company's management.
Serial No. Patent No. Description
1 7,716,988 Equipment for use in controlling snoring and the associated sensor
unit Patent Applications have also been filed in a large number of
countries, including Europe, Japan, S. Korea, China, and Canada.
2 7,710,124 A Method and the required apparatus for detecting panel conditions.
3 7,533,571 Equipment for making highly-sensitiv measurements of various
parameters, and sensors particularly useful in such equipment.
4 7,520,179 A Method and the required apparatus for measuring force –
particularly torque.
5 7,325,460 Force sensor method and construction.
6 7,313,491 A Method and the required apparatus for high-precision frequency
measurement.
7 7,266,989 Sensor system for high-precision measurements of temperature,
composition, and/or fluid pressure.
8 7,080,554 High-precision measuring method and apparatus.
9 6,984,993 Method and apparatus for making high-precision measurements.
10 6,856,141 High-precision measuring method and apparatus.
11 6,621,278 High-precision measuring method and apparatus.
Nexense Technologies USA Inc. | Indicative Valuation Study September 2015
11
Company Overview
The Management Team
Aric Ariav – Founder
Aric has 35 years of experience in research and
development, with a focus the brain. He studies the
way in which people have an effect on the
development of diseases, obesity and other
abnormalities in their daily lives through unexplained
brain processes. Aric is currently working directly with
people, seeking these hidden processes that change the brain in order to
cure diseases. Aric takes the approach of addressing the source of the
problem rather than the symptoms.
Aric's previous study investigated sleep problems in humans and developed a
dedicated system for solving the problem of sleep apnea by encouraging the
mind to overcome it in a natural way, without the need for masks,
medicines or surgery.
This device is currently at Nexense's treatment center. The Company intends
to continue the production of the device on a global scale. Before this
project, Aric's research focused on developing accurate sensors for support
and wellness systems such as safety systems for vehicles, a mechanism for
reducing air pollution, etc.
Aric's previous research focused on three dimensional mapping of open space
with sound waves.
He also founded and managed an energy and structure control company,
which still exists and an industry leader in Israel. (Hotelo).
Aric served in the prestigious 8200 unit in the IDF and worked as a technician
at Tadiran which sent him to study engineering.
Bary Molchadsky – CEO
Bary has 15 years of experience in the capital markets
through leading investment firms. In the past Bary
worked at Mizrahi Bank in the risk management
department for the capital market. He was one of the
founders of the Top Alfa Investment House and also
initiated and founded IBI Trade as part of the IBI Investment House. In
addition, Bary consults for private companies, which are raising capital, and
provides investment banking services through his company GPIS
Nexense Technologies USA Inc. | Indicative Valuation Study September 2015
12
Company Overview
The Management Team
Professor Oleg Figobski – Director
Prof. Oleg Figovsky is the founder and R&D the
Polymate Ltd. - International Nanotechnology
Research Centre where he is working on research in
nanostructured corrosion-resistant composite
materials and protective coatings based on a
polymer and silicate matrix. Novel
nanotechnologies invented by Prof. O. Figovsky were the basis for
establishing industrial production in the US, Canada, China, Mexico, Russia
and Israel.
He is a member of the European Academy of Sciences and Head of the
UNESCO Chair "Green Chemistry". For his inventions in nanotechnologies he
was awarded gold and silver medals at IENA-98 and Gold Angel Prize at the
Genius 2006 exhibition.
Prof. Oleg Figovsky has authored of a few books, more than 300 scientific
articles and 500 patents.
Dobroslav Melamed
Dr. Dobroslav Melamed, 37, is a biotech entrepreneur
with over 10 years of experience in the life science
industry. He has demonstrated success in taking drugs
from the lab to the shelf by identifying target markets,
planning regulatory strategy, raising capital, executing
successful clinical trials and scaling up to commercial production. He is
currently establishing two companies involved in the development of a
treatment for Ebola and novel drug delivery. Until September 2014, he was
the President of SciVac (formerly SciGen IL), a high growth
biopharmaceutical company that develops, manufactures and markets
recombinant human health care biotechnology derived products, including
vaccines. Dr. Melamed was responsible for SciVac's operations, clinical trials
and new business.
Dr. Melamed is the co-founder of Periness LTD, a developer of new drugs for
male infertility and Oshadi LTD, a developer of oral carriers for proteins like
insulin. He has also been a researcher at Bar-Ilan University's Male Fertility
clinic, where he assisted in the development of new drugs for male
infertility; and QBI, where he worked in the Pre-clinical and Research
Pharmacology Department establishing In Vivo models for drug discovery and
delivery. Melamed earned a PhD in Biotechnology and a Bachelor of Arts
degree in Biotechnology from the Bar-Ilan University, Israel.
Nexense Technologies USA Inc. | Indicative Valuation Study September 2015
13
Company Overview
The Management Team
Dr. Alexandr Tsimerman
Dr. Alexandr Tsimerman has significant
experience in sales and marketing, business
development, and international marketing
strategy in the hospital and healthcare industry.
He has a proven track record of multi-million
projects sales, building companies and
representative offices from zero in several countries simultaneously. He has
worked as a Business Development Director and Advisor in several
international companies worldwide in the hospital and healthcare industry.
He has developed and managed new business opportunities within the
healthcare industry in Eastern Europe and FSU, strategic alliances and
partnerships
Nexense Technologies USA Inc. | Indicative Valuation Study September 2015
14
Section 2
Industry Analysis
Nexense Technologies USA Inc. | Indicative Valuation Study September 2015
15
Industry Analysis
The Snoring Treatment Market1
The Company, through Night Watch, is positioned to benefit from the
growing snoring treatment market. This market includes all persons suffering
from snoring on a regular basis, of whom only a fraction turns to medical
assistance.
This market consists of various manufacturers of devices and medication, as
well as surgical solutions. Snoring treatment devices include chin straps,
mouthpieces, nasal strips, nasal cones, anti-snoring pillows, therapeutic
rings, Tongue Retaining Devices (TRD), Tongue Stabilizing Devices (TSD),
Mandibular Advancement Devices (MAD) as well as Continuous Positive
Airway Pressure Devices (CPAP)2.
Snoring is one of the most common sleep conditions that involve noisy
breathing caused by vibration of relaxed soft tissues of the nose, soft palate
or pharynx while sleeping, and is generally regarded as a first sign of
Obstructive Sleep Apnea. It is believed to be common among adults, with as
much as 30% of adults aged 30 and above suffer from the phenomena3. It is
considered a health risk in the long run, as it leads to deprived oxygenation
state during sleep and found to be the main factor in increased cardiac
atherosclerosis, stoke and even death.
Snoring can be the result of many factors, such as obesity, alcohol or other
sedative abuse, muscular degeneration as a result of old age or muscular
dystrophy, obstruction of nasal cavity by the tongue/tonsil/oral plate and
more. It is found to increase with age and to be more common among men.
The type of snoring treatment depends upon the condition persisting and the
cause of the snoring pattern. For example, snoring as a result of the tonsils
and adenoid regions is often solved by mandibular splints, while those
caused by nasal cavity collapse are often treated by the application of nasal
strips or dilators.
It is believed that 90 million AmArican adults snore with some frequency,
while 37 million do it on a regular basis, or 12% of the AmArican population4.
Based upon the aforementioned data, we estimate the global snoring
treatment market to be about USD 5.1 billion in 2015, gradually growing
towards USD 9 billion in 2023.
1 Persistence Research. 2 Markets and Markets. 3 Sleep Disorders Guide. 4 The AmArican National Sleep Foundation.
Nexense Technologies USA Inc. | Indicative Valuation Study September 2015
16
Industry Analysis
The Obstructive Sleep Apnea Treatment Market
Obstructive Sleep Apnea (hereinafter: "OSA") is a sleep-related breathing
disorder defined as an absence of breathing for at least 10 seconds, despite
an effort to breathe. It is regarded as a major threat to the overall health of
a person, as it results in various other conditions like insomnia, lethargy,
daytime sleepiness, weakened immunity, blood pressure hypertension,
anxiety, depression, gastrointestinal reflux disease, hypoxia, nerve damage,
decreased motor and memory function and more.
OSA has both anatomic and physiological factors: Anatomic factors- nose,
tongue, lateral pharyngeal walls, soft palate, tonsils and parapharyngeal fat
pads; Physiological factors- reduced reflex responses of the tongue and soft
palate muscles to negative airway pressure.
It is estimated that about half of people who snore loudly have OSA, and 20%
of adults have at least mild OSA. 24% of the population over the age of 60 is
afflicted, together with an estimated 7% of women and 23% of men aged 30-
60, totaling about 38M patients in the US. Furthermore, 80% of patients with
OSA are believed to be undiagnosed, few symptomatic patients are
diagnosed and even fewer are treated5.
Available treatments for OSA include pillows and recliners, which are shown
to decrease overall snoring among adults, and are often used with other
snoring aids. Furthermore, automatic PAP machines are used in chronic
patients who reject surgery as an option and are highly effective in soothing
muscles near the oral and nasal cavity. Many of these devices employ steam
or positive air pressure via a nasal tube that allow for greater air flow
through the nasal cavity.
As technology advances become attainable and affordable, home care
treatment is projected to account for the major share of the OSA treatment
market6.
The majority of sales for OSA and snoring devices is found in developed
nations in regions such as North AmArica, Europe, Australia and New
Zealand.
The overall snoring cessation market by both volume and revenue lies
majorly in North AmArica and Europe, while the Asia Pacific region is
projected to grow in the near future with increased awareness and rising
standards of living.
5 Strategic Intelligence. 6 Markets and Markets>
Nexense Technologies USA Inc. | Indicative Valuation Study September 2015
17
Industry Analysis
The Obstructive Sleep Apnea Treatment Market (Continued) Competition
The rest of the world region is projected to maintain its growth as public
awareness of snoring and its negative side effects are currently limited, and
are often not regarded as life-threatening.
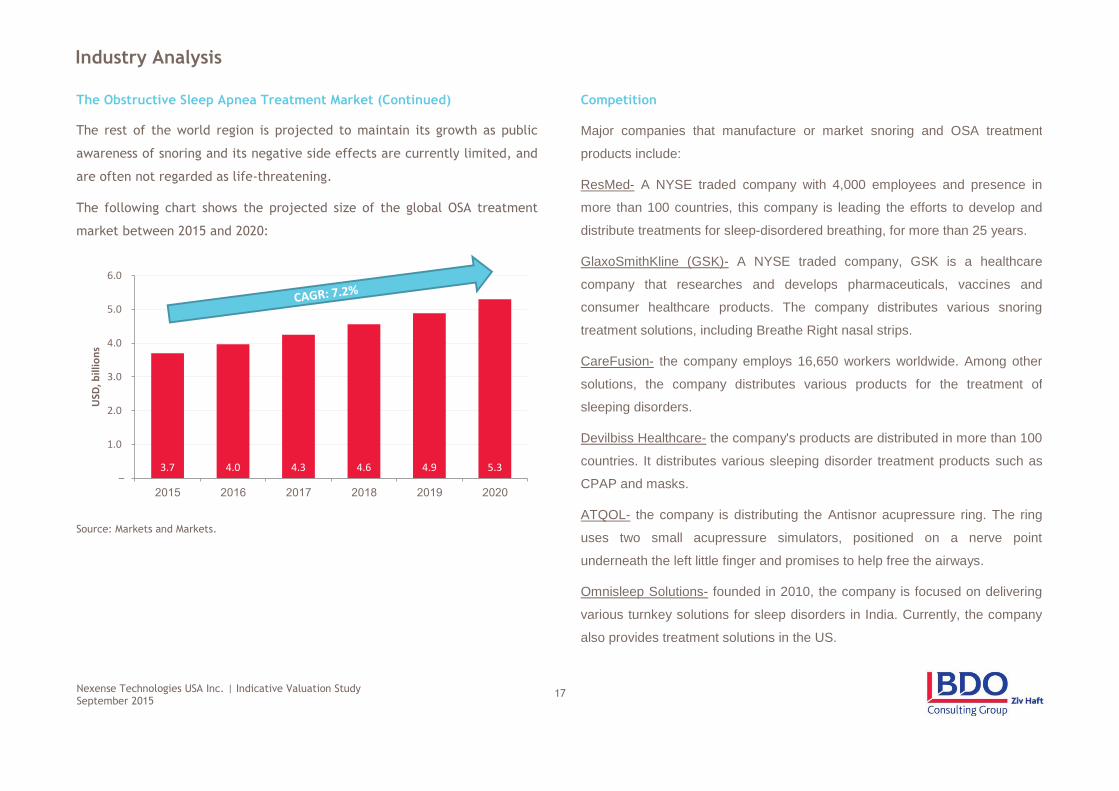
The following chart shows the projected size of the global OSA treatment
market between 2015 and 2020:
Source: Markets and Markets.
Major companies that manufacture or market snoring and OSA treatment
products include:
ResMed- A NYSE traded company with 4,000 employees and presence in
more than 100 countries, this company is leading the efforts to develop and
distribute treatments for sleep-disordered breathing, for more than 25 years.
GlaxoSmithKline (GSK)- A NYSE traded company, GSK is a healthcare
company that researches and develops pharmaceuticals, vaccines and
consumer healthcare products. The company distributes various snoring
treatment solutions, including Breathe Right nasal strips.
CareFusion- the company employs 16,650 workers worldwide. Among other
solutions, the company distributes various products for the treatment of
sleeping disorders.
Devilbiss Healthcare- the company's products are distributed in more than 100
countries. It distributes various sleeping disorder treatment products such as
CPAP and masks.
ATQOL- the company is distributing the Antisnor acupressure ring. The ring
uses two small acupressure simulators, positioned on a nerve point
underneath the left little finger and promises to help free the airways.
Omnisleep Solutions- founded in 2010, the company is focused on delivering
various turnkey solutions for sleep disorders in India. Currently, the company
also provides treatment solutions in the US.
3.7 4.0 4.3 4.6 4.9 5.3 –
1.0
2.0
3.0
4.0
5.0
6.0
USD
, bill
ion
s
Nexense Technologies USA Inc. | Indicative Valuation Study September 2015
18
Industry Analysis
Competition (Continued)
SnoreDoc- the company produces and distributes various products to treat
snoring, suc has SnoreStrap, a mouthpiece and the Snoring Nose Pin.
Glidewell Laboratories- the company is a leading provider of high-quality
dental laboratory products and services for dental professionals in the US.
The company distributes various products for the treatment of snoring and
OSA, such as aveoTSD, Silent Nite sl, Tap and EMA.
MPowRx Health and Wellness Products- the company distributes the
MPowRX tongue retention device for the treatment of sleep disordered
breathing conditions.
Omega Pharma- recently acquired by Perrigo Company plc, the company
markets various over the counter health and personal care products. The
company distributes "Silence", an anti-snoring throat spray.
PureSleep- the company distributes a snoring treatment product in the US.
Putnam Health Co.- a British company, Putnam have been manufacturing
comfort solutions for over 30 years. Some of the company's various comfort
products include specialized pillows to combat OSA.
Fisher & Paykel Healthcare- the company is a leading designer, manufacturer
and marketer of products and systems for use in respiratory care, acute care
and treatment of OSA.
Compumedics- established in 1987, the company manufactures medical
devices and is involved in the development, manufacture and
commercialization of diagnostics technology for sleep, brain and ultrasonic
blood-flow monitoring applications.
SomnoMed- the company is a global leader in COAT (Continuous Open Airway
Therapy). It provides clinically proved diagnostic and treatment options for
sleep-related breathing disorders such as OSA.
Whole You- this company is a healthcare business owned by Mitsui Chemicals
corporation of Japan. The company recently entered the OSA market by
acquiring Respire Medical, which distributes an OSA oral appliance in the US.
Nexense Technologies USA Inc. | Indicative Valuation Study September 2015
19
Industry Analysis
Competition (Continued)
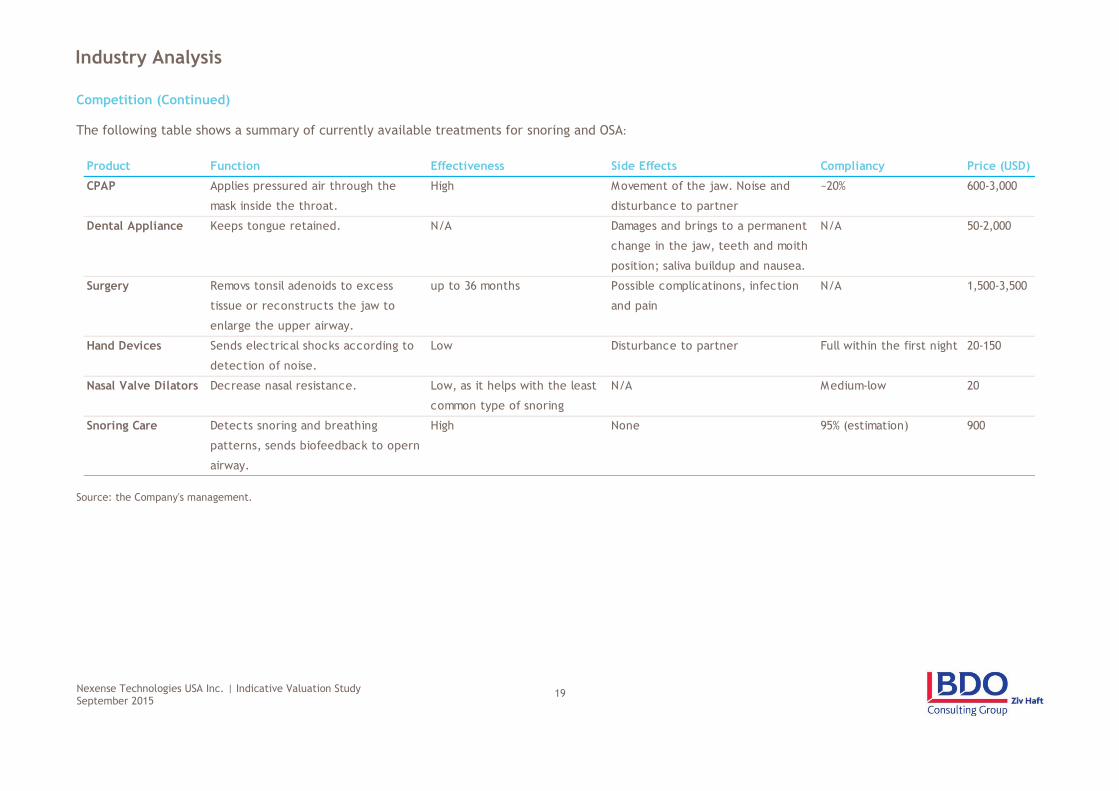
The following table shows a summary of currently available treatments for snoring and OSA:
Source: the Company's management.
Product Function Effectiveness Side Effects Compliancy Price (USD)
CPAP Applies pressured air through the
mask inside the throat.
High Movement of the jaw. Noise and
disturbance to partner
~20% 600-3,000
Dental Appliance Keeps tongue retained. N/A Damages and brings to a permanent
change in the jaw, teeth and moith
position; saliva buildup and nausea.
N/A 50-2,000
Surgery Removs tonsil adenoids to excess
tissue or reconstructs the jaw to
enlarge the upper airway.
up to 36 months Possible complicatinons, infection
and pain
N/A 1,500-3,500
Hand Devices Sends electrical shocks according to
detection of noise.
Low Disturbance to partner Full within the first night 20-150
Nasal Valve Dilators Decrease nasal resistance. Low, as it helps with the least
common type of snoring
N/A Medium-low 20
Snoring Care Detects snoring and breathing
patterns, sends biofeedback to opern
airway.
High None 95% (estimation) 900
Nexense Technologies USA Inc. | Indicative Valuation Study September 2015
20
Section 3
Valuation Methodology
Nexense Technologies USA Inc. | Indicative Valuation Study September 2015
21
Valuation Methodology
Background
The generally accepted approaches to valuation are commonly referred to as
the following:
Market approach;
Asset-based approach; and
Income approach.
Within each category, a variety of methodologies exist to assist in the
estimation of fair value. The following sections contain a brief overview of
the theoretical basis of each approach, as well as a discussion of the specific
methodologies relevant to the analyses performed.
Market Approach
The market approach references actual transactions in the equity of the
enterprise being valued or actual transactions in similar enterprises that are
traded in the public markets. Third-party transactions in the equity of an
enterprise generally represent the best estimate of fair market value if they
are done at arm’s length. There are two primary methods for using
transactions from similar enterprises: the "Guideline Transactions Method"
and the "Guideline Public Company Method", both involve deriving valuation
multiples from publicly traded entities as a starting point to valuing the
enterprise.
Asset-Based Approach
A second approach to the valuation, the discrete valuation of an asset using
an asset-based approach is based upon the concept of replacement as an
indicator of value. A prudent investor would be willing to pay for an asset no
more than the amount for which he or she could replace the asset new. This
approach establishes value based on the cost of reproducing or replacing the
property, less depreciation from physical deterioration and functional
obsolescence, if present and measurable.
Income Approach
The income approach is based on the premise that the value of a security or
asset is the present value of the future earning capacity that is available for
distribution to investors holding the security or asset. A commonly used
methodology under the income approach is a discounted cash flow analysis.
A discounted cash flow analysis involves forecasting the appropriate cash
flow stream over an appropriate period and then discounting it back to a
present value at an appropriate discount rate. This discount rate should
consider the time value of money, inflation, and the risk inherent in
ownership of the asset or security interest being valued.
Selected Valuation Approach
Given the nature of the Company's operations, we find that the value of its
stockholders' equity should be determined by the Income Approach.
Nexense Technologies USA Inc. | Indicative Valuation Study September 2015
22
Section 4
Indicative Valuation Analysis
Nexense Technologies USA Inc. | Indicative Valuation Study September 2015
23
Indicative Valuation Analysis
General Projected Revenue
In this section we present the valuation we performed according to the
income approach, using the Discounted Cash Flows (DCF) method. We built a
detailed cash flow projection based on the Company's forecasts for the
coming years, our independent market analysis and on other data provided
by the Company's management. The cash flows were then discounted using
the appropriate discount rate.
According to common practice, valuation using discounted cash flows should
be based on a 5-year cash flow forecast. Since the Company's snoring and
apnea treatments are young and projected to grow significantly in the
upcoming years, we decided to extend the Company's forecast we received
until 2023, for another 3 years, reaching an 8-year forecast (hereinafter:
"the Forecast Period"), setting terminal year to be 2023, discounting all
periods thereafter at a long-term growth rate of 2% (hereinafter: "Terminal
Year"). During the Forecast Period, the annual growth in revenue will
gradually decrease towards the customary long-term rate reached in the
terminal year.
In order to determine the present value of the projected cash flow, we used
industry-acceptable discount rates, based on quantitative research. A
summary of the methodology used to derive the appropriate discount factor
is presented hereunder.
As mentioned hereinabove, the Company will generate revenue by selling its
Snoring Care and Night Watch products all over the world. Products will be
shipped internationally from the Company's planned logistics centers in the
US and Israel.
The Company will manufacture its products in Israel, investing directly in
local assembly lines and contracting sub-contractors for turnkey assembly of
its products. The products will then be sold worldwide, mainly using on-line
advertising such as Google Adwords. Furthermore, the Company will offer
after-sale support for its sold products.
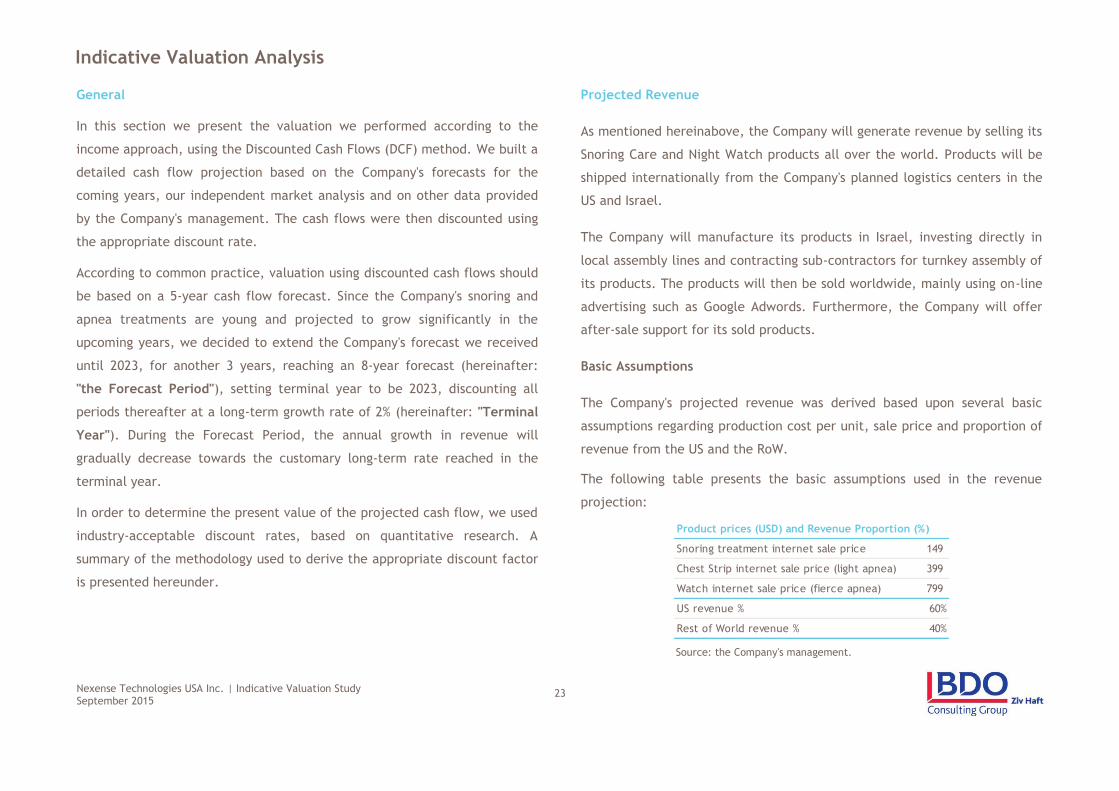
Basic Assumptions
The Company's projected revenue was derived based upon several basic
assumptions regarding production cost per unit, sale price and proportion of
revenue from the US and the RoW.
The following table presents the basic assumptions used in the revenue
projection:
Source: the Company's management.
Product prices (USD) and Revenue Proportion (%)
Snoring treatment internet sale price 149
Chest Strip internet sale price (light apnea) 399
Watch internet sale price (fierce apnea) 799
US revenue % 60%
Rest of World revenue % 40%
Nexense Technologies USA Inc. | Indicative Valuation Study September 2015
24
Indicative Valuation Analysis
Projected Revenue (Continued)
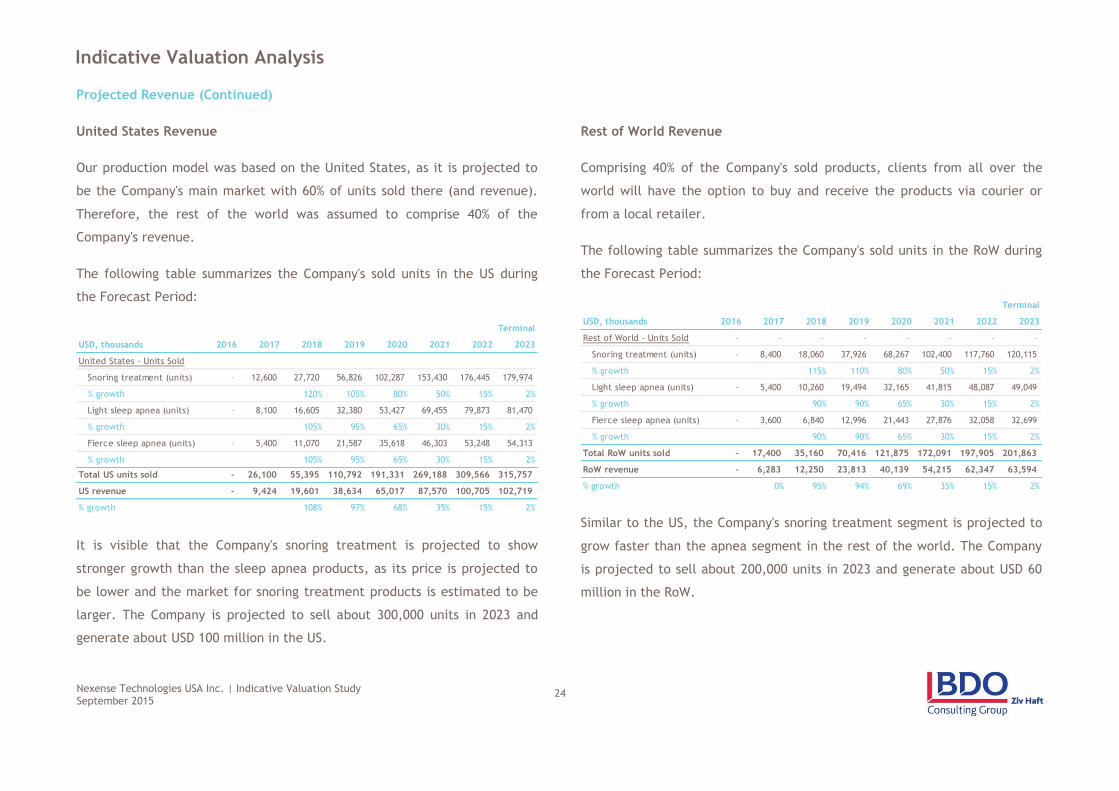
United States Revenue
Our production model was based on the United States, as it is projected to
be the Company's main market with 60% of units sold there (and revenue).
Therefore, the rest of the world was assumed to comprise 40% of the
Company's revenue.
The following table summarizes the Company's sold units in the US during
the Forecast Period:
It is visible that the Company's snoring treatment is projected to show
stronger growth than the sleep apnea products, as its price is projected to
be lower and the market for snoring treatment products is estimated to be
larger. The Company is projected to sell about 300,000 units in 2023 and
generate about USD 100 million in the US.
Rest of World Revenue
Comprising 40% of the Company's sold products, clients from all over the
world will have the option to buy and receive the products via courier or
from a local retailer.
The following table summarizes the Company's sold units in the RoW during
the Forecast Period:
Similar to the US, the Company's snoring treatment segment is projected to
grow faster than the apnea segment in the rest of the world. The Company
is projected to sell about 200,000 units in 2023 and generate about USD 60
million in the RoW.
Terminal
USD, thousands 2016 2017 2018 2019 2020 2021 2022 2023
United States - Units Sold
Snoring treatment (units) – 12,600 27,720 56,826 102,287 153,430 176,445 179,974
% growth 120% 105% 80% 50% 15% 2%
Light sleep apnea (units) – 8,100 16,605 32,380 53,427 69,455 79,873 81,470
% growth 105% 95% 65% 30% 15% 2%
Fierce sleep apnea (units) – 5,400 11,070 21,587 35,618 46,303 53,248 54,313
% growth 105% 95% 65% 30% 15% 2%
Total US units sold – 26,100 55,395 110,792 191,331 269,188 309,566 315,757
US revenue – 9,424 19,601 38,634 65,017 87,570 100,705 102,719
% growth 108% 97% 68% 35% 15% 2%
Terminal
USD, thousands 2016 2017 2018 2019 2020 2021 2022 2023
Rest of World - Units Sold – – – – – – – –
Snoring treatment (units) – 8,400 18,060 37,926 68,267 102,400 117,760 120,115
% growth 115% 110% 80% 50% 15% 2%
Light sleep apnea (units) – 5,400 10,260 19,494 32,165 41,815 48,087 49,049
% growth 90% 90% 65% 30% 15% 2%
Fierce sleep apnea (units) – 3,600 6,840 12,996 21,443 27,876 32,058 32,699
% growth 90% 90% 65% 30% 15% 2%
Total RoW units sold – 17,400 35,160 70,416 121,875 172,091 197,905 201,863
RoW revenue – 6,283 12,250 23,813 40,139 54,215 62,347 63,594
% growth 0% 95% 94% 69% 35% 15% 2%
Nexense Technologies USA Inc. | Indicative Valuation Study September 2015
25
Indicative Valuation Analysis
Projected Revenue (Continued) Cost of Goods Sold
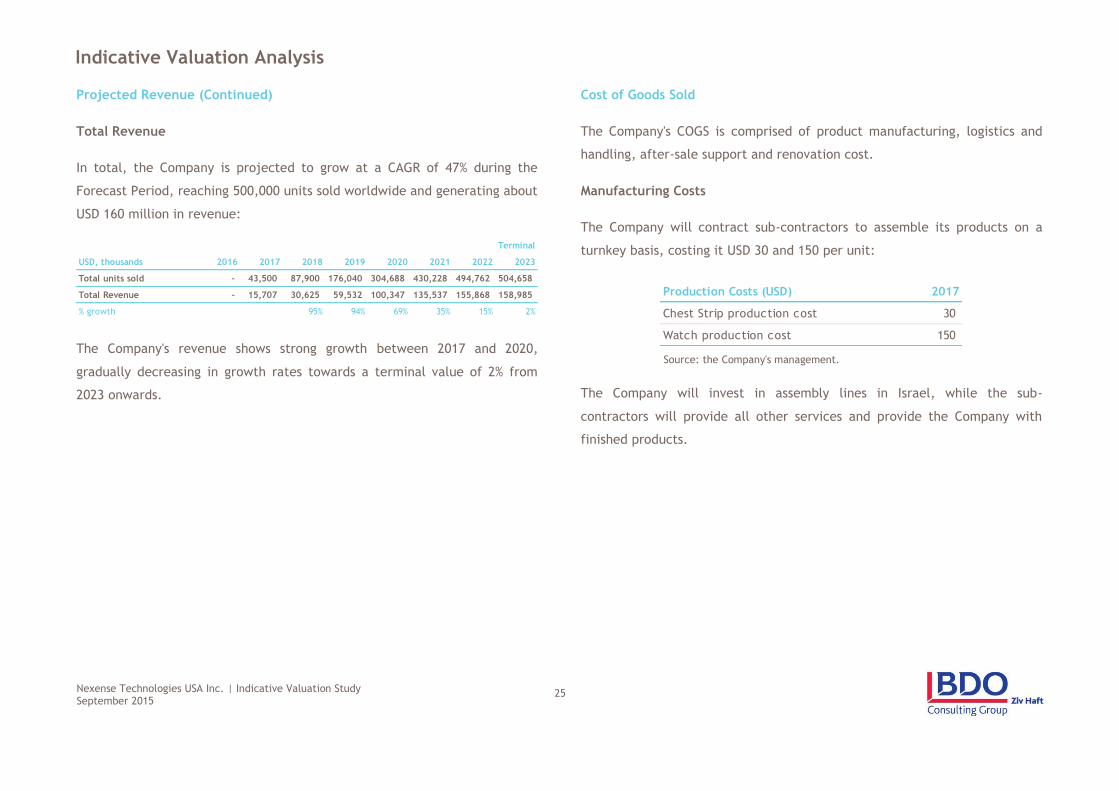
Total Revenue
In total, the Company is projected to grow at a CAGR of 47% during the
Forecast Period, reaching 500,000 units sold worldwide and generating about
USD 160 million in revenue:
The Company's revenue shows strong growth between 2017 and 2020,
gradually decreasing in growth rates towards a terminal value of 2% from
2023 onwards.
The Company's COGS is comprised of product manufacturing, logistics and
handling, after-sale support and renovation cost.
Manufacturing Costs
The Company will contract sub-contractors to assemble its products on a
turnkey basis, costing it USD 30 and 150 per unit:
Source: the Company's management.
The Company will invest in assembly lines in Israel, while the sub-
contractors will provide all other services and provide the Company with
finished products.
Terminal
USD, thousands 2016 2017 2018 2019 2020 2021 2022 2023
Total units sold – 43,500 87,900 176,040 304,688 430,228 494,762 504,658
Total Revenue – 15,707 30,625 59,532 100,347 135,537 155,868 158,985
% growth 95% 94% 69% 35% 15% 2%
Production Costs (USD) 2017
Chest Strip production cost 30
Watch production cost 150
Nexense Technologies USA Inc. | Indicative Valuation Study September 2015
26
Indicative Valuation Analysis
Cost of Goods Sold (Continued)
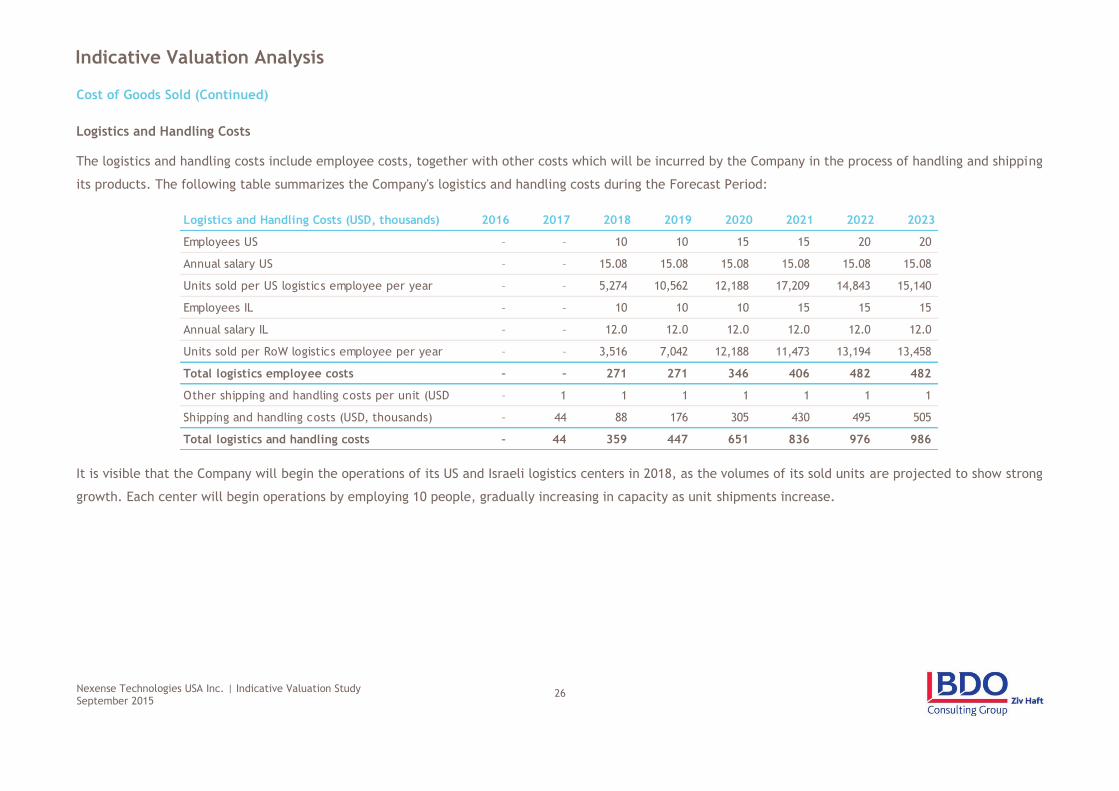
Logistics and Handling Costs
The logistics and handling costs include employee costs, together with other costs which will be incurred by the Company in the process of handling and shipping
its products. The following table summarizes the Company's logistics and handling costs during the Forecast Period:
It is visible that the Company will begin the operations of its US and Israeli logistics centers in 2018, as the volumes of its sold units are projected to show strong
growth. Each center will begin operations by employing 10 people, gradually increasing in capacity as unit shipments increase.
Logistics and Handling Costs (USD, thousands) 2016 2017 2018 2019 2020 2021 2022 2023
Employees US – – 10 10 15 15 20 20
Annual salary US – – 15.08 15.08 15.08 15.08 15.08 15.08
Units sold per US logistics employee per year – – 5,274 10,562 12,188 17,209 14,843 15,140
Employees IL – – 10 10 10 15 15 15
Annual salary IL – – 12.0 12.0 12.0 12.0 12.0 12.0
Units sold per RoW logistics employee per year – – 3,516 7,042 12,188 11,473 13,194 13,458
Total logistics employee costs – – 271 271 346 406 482 482
Other shipping and handling costs per unit (USD) – 1 1 1 1 1 1 1
Shipping and handling costs (USD, thousands) – 44 88 176 305 430 495 505
Total logistics and handling costs – 44 359 447 651 836 976 986
Nexense Technologies USA Inc. | Indicative Valuation Study September 2015
27
Indicative Valuation Analysis
Cost of Goods Sold (Continued)
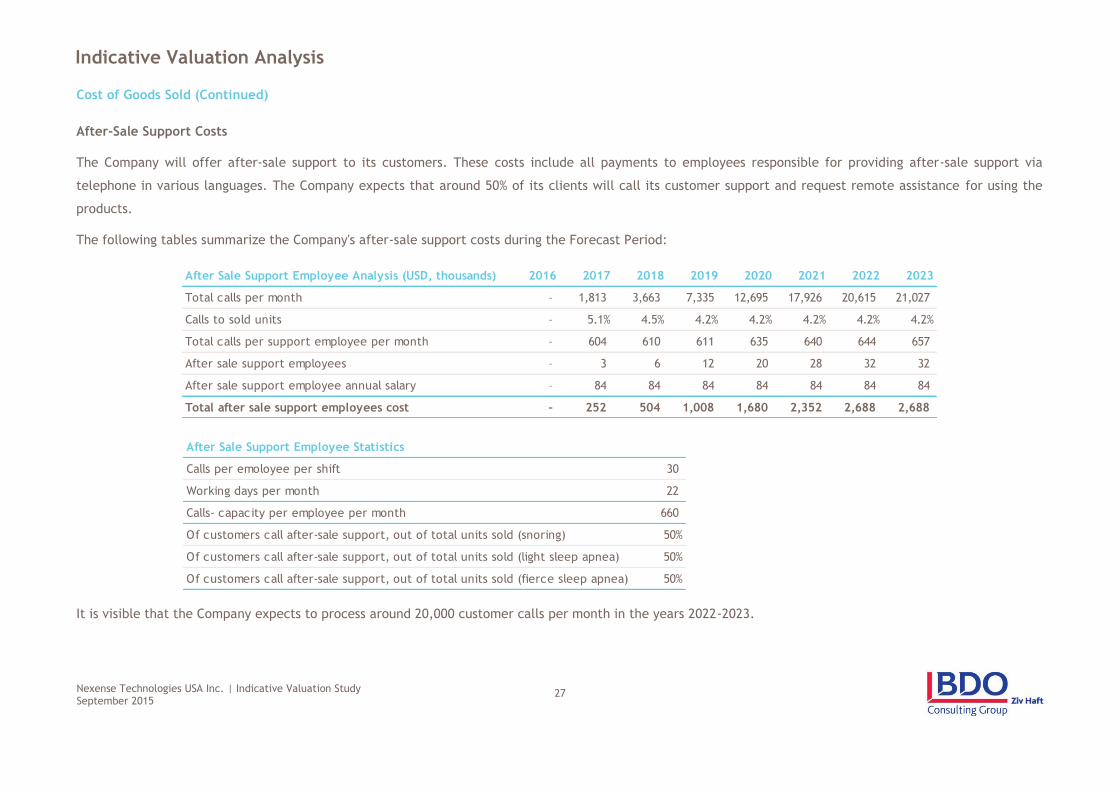
After-Sale Support Costs
The Company will offer after-sale support to its customers. These costs include all payments to employees responsible for providing after-sale support via
telephone in various languages. The Company expects that around 50% of its clients will call its customer support and request remote assistance for using the
products.
The following tables summarize the Company's after-sale support costs during the Forecast Period:
It is visible that the Company expects to process around 20,000 customer calls per month in the years 2022-2023.
After Sale Support Employee Analysis (USD, thousands) 2016 2017 2018 2019 2020 2021 2022 2023
Total calls per month – 1,813 3,663 7,335 12,695 17,926 20,615 21,027
Calls to sold units – 5.1% 4.5% 4.2% 4.2% 4.2% 4.2% 4.2%
Total calls per support employee per month – 604 610 611 635 640 644 657
After sale support employees – 3 6 12 20 28 32 32
After sale support employee annual salary – 84 84 84 84 84 84 84
Total after sale support employees cost – 252 504 1,008 1,680 2,352 2,688 2,688
After Sale Support Employee Statistics
Calls per emoloyee per shift 30
Working days per month 22
Calls- capacity per employee per month 660
Of customers call after-sale support, out of total units sold (snoring) 50%
Of customers call after-sale support, out of total units sold (light sleep apnea) 50%
Of customers call after-sale support, out of total units sold (fierce sleep apnea) 50%
Nexense Technologies USA Inc. | Indicative Valuation Study September 2015
28
Indicative Valuation Analysis
Cost of Goods Sold (Continued)
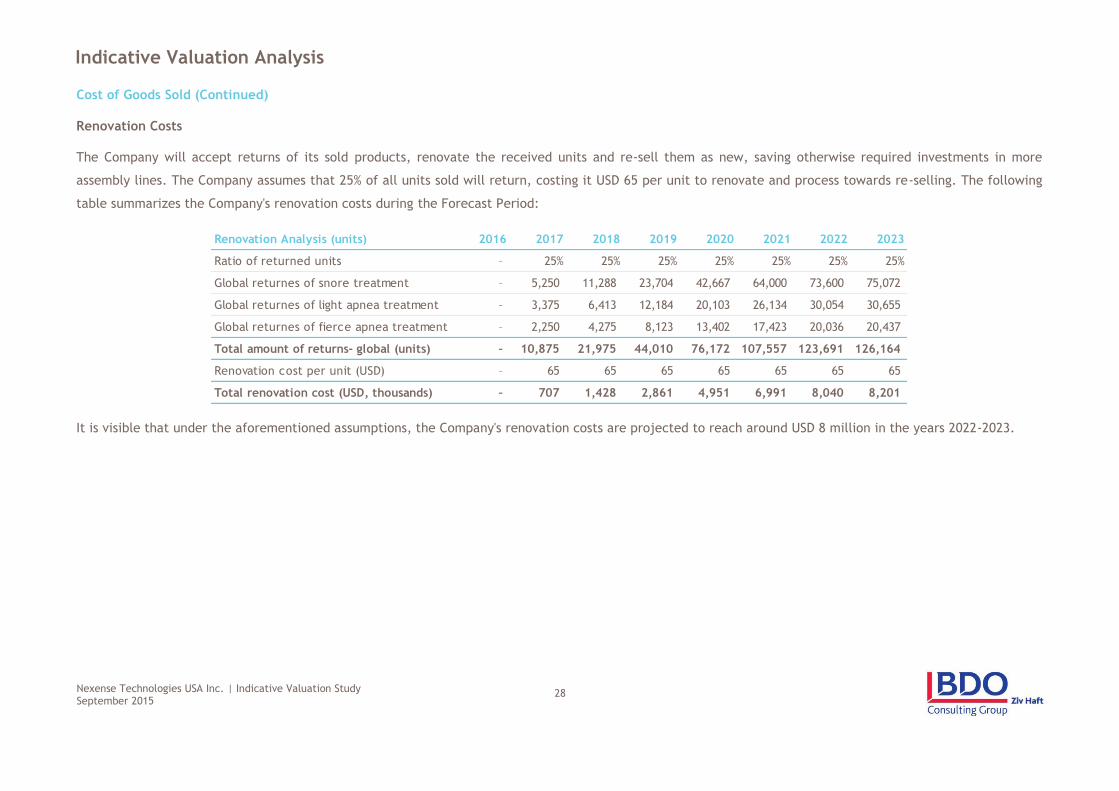
Renovation Costs
The Company will accept returns of its sold products, renovate the received units and re-sell them as new, saving otherwise required investments in more
assembly lines. The Company assumes that 25% of all units sold will return, costing it USD 65 per unit to renovate and process towards re-selling. The following
table summarizes the Company's renovation costs during the Forecast Period:
It is visible that under the aforementioned assumptions, the Company's renovation costs are projected to reach around USD 8 million in the years 2022-2023.
Renovation Analysis (units) 2016 2017 2018 2019 2020 2021 2022 2023
Ratio of returned units – 25% 25% 25% 25% 25% 25% 25%
Global returnes of snore treatment – 5,250 11,288 23,704 42,667 64,000 73,600 75,072
Global returnes of light apnea treatment – 3,375 6,413 12,184 20,103 26,134 30,054 30,655
Global returnes of fierce apnea treatment – 2,250 4,275 8,123 13,402 17,423 20,036 20,437
Total amount of returns- global (units) – 10,875 21,975 44,010 76,172 107,557 123,691 126,164
Renovation cost per unit (USD) – 65 65 65 65 65 65 65
Total renovation cost (USD, thousands) – 707 1,428 2,861 4,951 6,991 8,040 8,201
Nexense Technologies USA Inc. | Indicative Valuation Study September 2015
29
Indicative Valuation Analysis
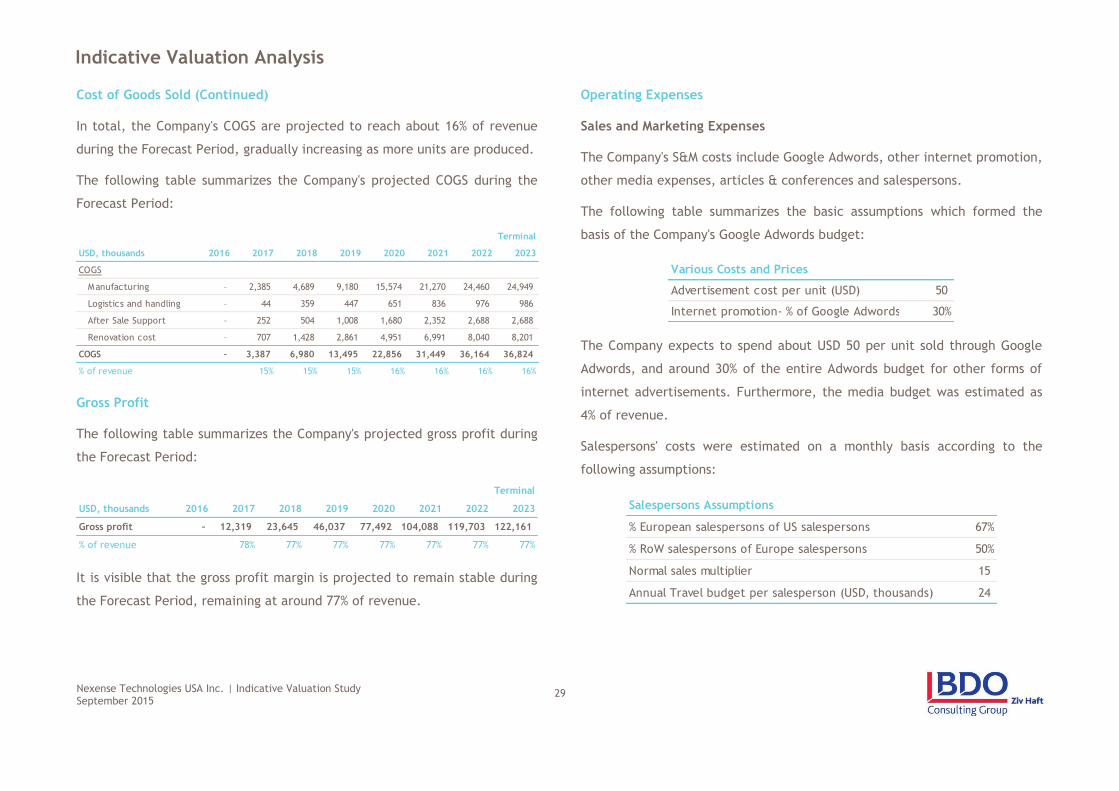
Cost of Goods Sold (Continued) Operating Expenses
In total, the Company's COGS are projected to reach about 16% of revenue
during the Forecast Period, gradually increasing as more units are produced.
The following table summarizes the Company's projected COGS during the
Forecast Period:
Gross Profit
The following table summarizes the Company's projected gross profit during
the Forecast Period:
It is visible that the gross profit margin is projected to remain stable during
the Forecast Period, remaining at around 77% of revenue.
Sales and Marketing Expenses
The Company's S&M costs include Google Adwords, other internet promotion,
other media expenses, articles & conferences and salespersons.
The following table summarizes the basic assumptions which formed the
basis of the Company's Google Adwords budget:
The Company expects to spend about USD 50 per unit sold through Google
Adwords, and around 30% of the entire Adwords budget for other forms of
internet advertisements. Furthermore, the media budget was estimated as
4% of revenue.
Salespersons' costs were estimated on a monthly basis according to the
following assumptions:
Terminal
USD, thousands 2016 2017 2018 2019 2020 2021 2022 2023
COGS
Manufacturing – 2,385 4,689 9,180 15,574 21,270 24,460 24,949
Logistics and handling – 44 359 447 651 836 976 986
After Sale Support – 252 504 1,008 1,680 2,352 2,688 2,688
Renovation cost – 707 1,428 2,861 4,951 6,991 8,040 8,201
COGS – 3,387 6,980 13,495 22,856 31,449 36,164 36,824
% of revenue 15% 15% 15% 16% 16% 16% 16%
Terminal
USD, thousands 2016 2017 2018 2019 2020 2021 2022 2023
Gross profit – 12,319 23,645 46,037 77,492 104,088 119,703 122,161
% of revenue 78% 77% 77% 77% 77% 77% 77%
Various Costs and Prices
Advertisement cost per unit (USD) 50
Internet promotion- % of Google Adwords 30%
Salespersons Assumptions
% European salespersons of US salespersons 67%
% RoW salespersons of Europe salespersons 50%
Normal sales multiplier 15
Annual Travel budget per salesperson (USD, thousands) 24
Nexense Technologies USA Inc. | Indicative Valuation Study September 2015
30
Indicative Valuation Analysis
Operating Expenses (Continued)
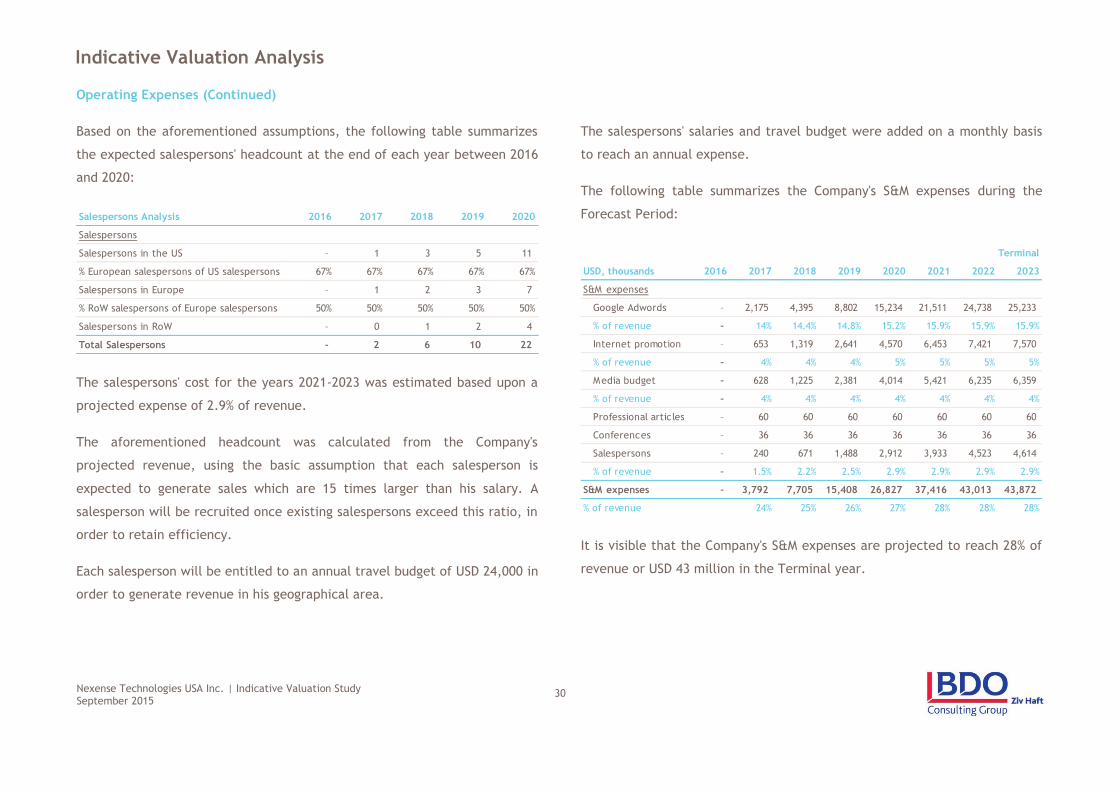
Based on the aforementioned assumptions, the following table summarizes
the expected salespersons' headcount at the end of each year between 2016
and 2020:
The salespersons' cost for the years 2021-2023 was estimated based upon a
projected expense of 2.9% of revenue.
The aforementioned headcount was calculated from the Company's
projected revenue, using the basic assumption that each salesperson is
expected to generate sales which are 15 times larger than his salary. A
salesperson will be recruited once existing salespersons exceed this ratio, in
order to retain efficiency.
Each salesperson will be entitled to an annual travel budget of USD 24,000 in
order to generate revenue in his geographical area.
The salespersons' salaries and travel budget were added on a monthly basis
to reach an annual expense.
The following table summarizes the Company's S&M expenses during the
Forecast Period:
It is visible that the Company's S&M expenses are projected to reach 28% of
revenue or USD 43 million in the Terminal year.
Salespersons Analysis 2016 2017 2018 2019 2020
Salespersons
Salespersons in the US – 1 3 5 11
% European salespersons of US salespersons 67% 67% 67% 67% 67%
Salespersons in Europe – 1 2 3 7
% RoW salespersons of Europe salespersons 50% 50% 50% 50% 50%
Salespersons in RoW – 0 1 2 4
Total Salespersons – 2 6 10 22
Terminal
USD, thousands 2016 2017 2018 2019 2020 2021 2022 2023
S&M expenses
Google Adwords – 2,175 4,395 8,802 15,234 21,511 24,738 25,233
% of revenue – 14% 14.4% 14.8% 15.2% 15.9% 15.9% 15.9%
Internet promotion – 653 1,319 2,641 4,570 6,453 7,421 7,570
% of revenue – 4% 4% 4% 5% 5% 5% 5%
Media budget – 628 1,225 2,381 4,014 5,421 6,235 6,359
% of revenue – 4% 4% 4% 4% 4% 4% 4%
Professional articles – 60 60 60 60 60 60 60
Conferences – 36 36 36 36 36 36 36
Salespersons – 240 671 1,488 2,912 3,933 4,523 4,614
% of revenue – 1.5% 2.2% 2.5% 2.9% 2.9% 2.9% 2.9%
S&M expenses – 3,792 7,705 15,408 26,827 37,416 43,013 43,872
% of revenue 24% 25% 26% 27% 28% 28% 28%
Nexense Technologies USA Inc. | Indicative Valuation Study September 2015
31
Indicative Valuation Analysis
Operating Expenses (Continued)
General and Administrative Expenses
The Company's G&A costs include executives' salaries, legal & accounting, office rent, municipal costs, HR and other expenses.
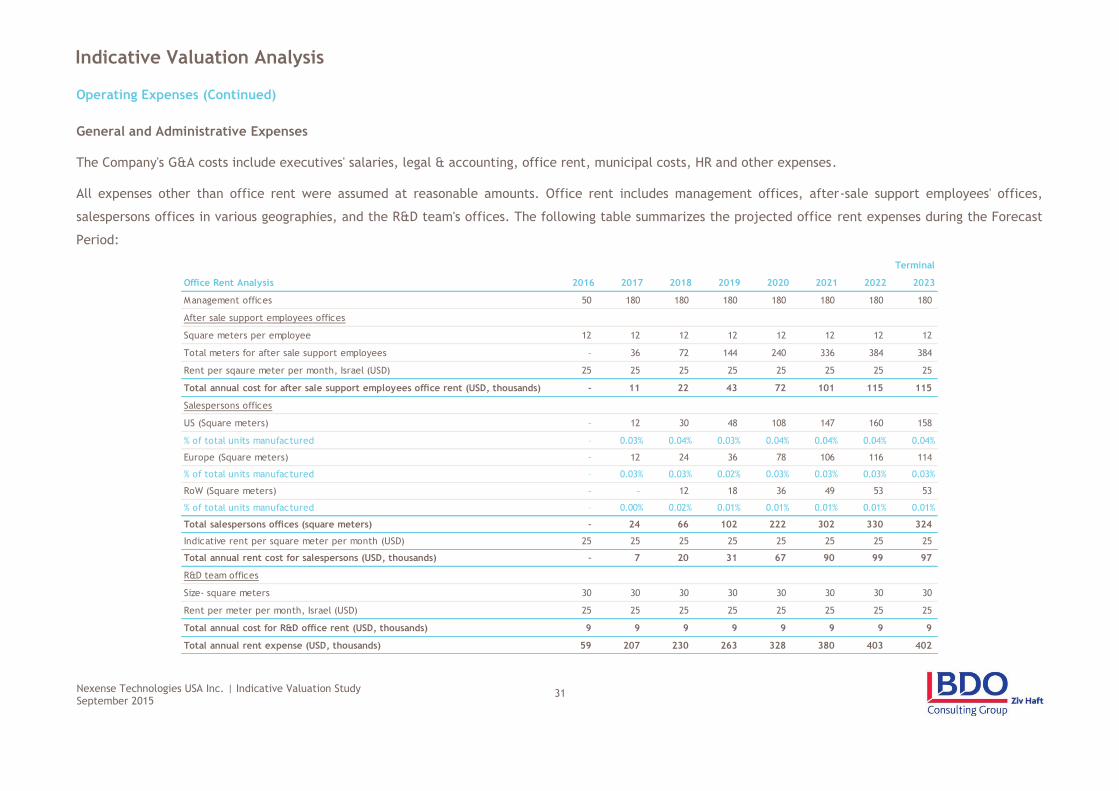
All expenses other than office rent were assumed at reasonable amounts. Office rent includes management offices, after-sale support employees' offices,
salespersons offices in various geographies, and the R&D team's offices. The following table summarizes the projected office rent expenses during the Forecast
Period:
Terminal
Office Rent Analysis 2016 2017 2018 2019 2020 2021 2022 2023
Management offices 50 180 180 180 180 180 180 180
After sale support employees offices
Square meters per employee 12 12 12 12 12 12 12 12
Total meters for after sale support employees – 36 72 144 240 336 384 384
Rent per sqaure meter per month, Israel (USD) 25 25 25 25 25 25 25 25
Total annual cost for after sale support employees office rent (USD, thousands) – 11 22 43 72 101 115 115
Salespersons offices
US (Square meters) – 12 30 48 108 147 160 158
% of total units manufactured – 0.03% 0.04% 0.03% 0.04% 0.04% 0.04% 0.04%
Europe (Square meters) – 12 24 36 78 106 116 114
% of total units manufactured – 0.03% 0.03% 0.02% 0.03% 0.03% 0.03% 0.03%
RoW (Square meters) – – 12 18 36 49 53 53
% of total units manufactured – 0.00% 0.02% 0.01% 0.01% 0.01% 0.01% 0.01%
Total salespersons offices (square meters) – 24 66 102 222 302 330 324
Indicative rent per square meter per month (USD) 25 25 25 25 25 25 25 25
Total annual rent cost for salespersons (USD, thousands) – 7 20 31 67 90 99 97
R&D team offices
Size- square meters 30 30 30 30 30 30 30 30
Rent per meter per month, Israel (USD) 25 25 25 25 25 25 25 25
Total annual cost for R&D office rent (USD, thousands) 9 9 9 9 9 9 9 9
Total annual rent expense (USD, thousands) 59 207 230 263 328 380 403 402
Nexense Technologies USA Inc. | Indicative Valuation Study September 2015
32
Indicative Valuation Analysis
Operating Expenses (Continued)
Management offices' costs were projected by the Company, while after-sale
support employees' office costs were calculated by multiplying the amount
of employees in every geography (the US, Europe and RoW which will be
located in Israel) at a reasonable 12 square meters per employee.
Monthly rent per square meter was assumed as USD 25 for all geographies.
The R&D team's offices were assumed as 30 square meters. The rents for
each group were summed and entered into the G&A expenses.
Nexense Technologies USA Inc. | Indicative Valuation Study September 2015
33
Indicative Valuation Analysis
Operating Expenses (Continued)
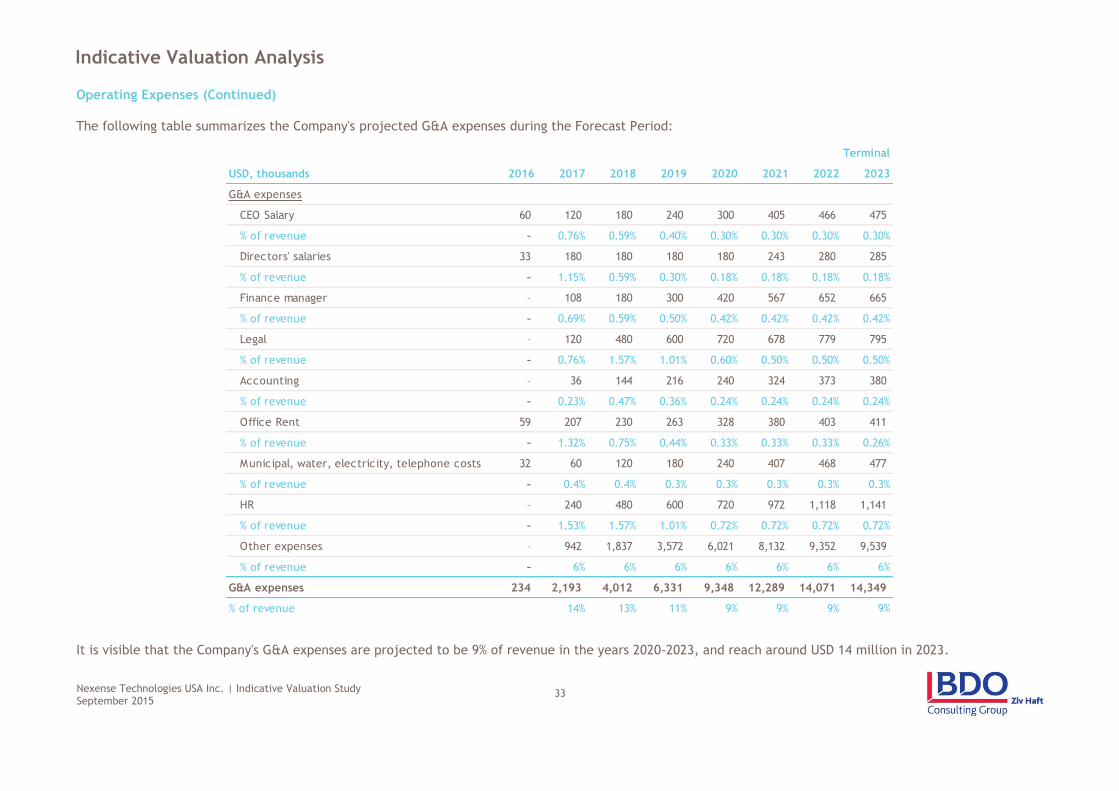
The following table summarizes the Company's projected G&A expenses during the Forecast Period:
It is visible that the Company's G&A expenses are projected to be 9% of revenue in the years 2020-2023, and reach around USD 14 million in 2023.
Terminal
USD, thousands 2016 2017 2018 2019 2020 2021 2022 2023
G&A expenses
CEO Salary 60 120 180 240 300 405 466 475
% of revenue – 0.76% 0.59% 0.40% 0.30% 0.30% 0.30% 0.30%
Directors' salaries 33 180 180 180 180 243 280 285
% of revenue – 1.15% 0.59% 0.30% 0.18% 0.18% 0.18% 0.18%
Finance manager – 108 180 300 420 567 652 665
% of revenue – 0.69% 0.59% 0.50% 0.42% 0.42% 0.42% 0.42%
Legal – 120 480 600 720 678 779 795
% of revenue – 0.76% 1.57% 1.01% 0.60% 0.50% 0.50% 0.50%
Accounting – 36 144 216 240 324 373 380
% of revenue – 0.23% 0.47% 0.36% 0.24% 0.24% 0.24% 0.24%
Office Rent 59 207 230 263 328 380 403 411
% of revenue – 1.32% 0.75% 0.44% 0.33% 0.33% 0.33% 0.26%
Municipal, water, electricity, telephone costs 32 60 120 180 240 407 468 477
% of revenue – 0.4% 0.4% 0.3% 0.3% 0.3% 0.3% 0.3%
HR – 240 480 600 720 972 1,118 1,141
% of revenue – 1.53% 1.57% 1.01% 0.72% 0.72% 0.72% 0.72%
Other expenses – 942 1,837 3,572 6,021 8,132 9,352 9,539
% of revenue – 6% 6% 6% 6% 6% 6% 6%
G&A expenses 234 2,193 4,012 6,331 9,348 12,289 14,071 14,349
% of revenue 14% 13% 11% 9% 9% 9% 9%
Nexense Technologies USA Inc. | Indicative Valuation Study September 2015
34
Indicative Valuation Analysis
Operating Expenses (Continued)
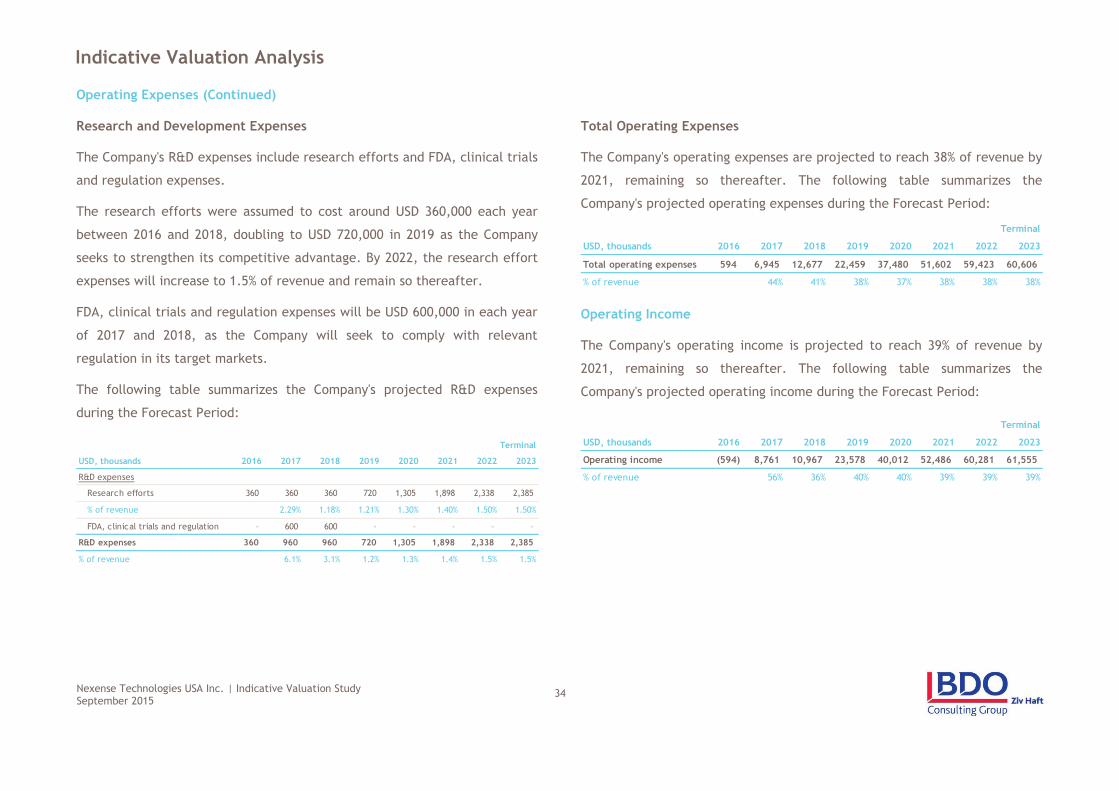
Research and Development Expenses
The Company's R&D expenses include research efforts and FDA, clinical trials
and regulation expenses.
The research efforts were assumed to cost around USD 360,000 each year
between 2016 and 2018, doubling to USD 720,000 in 2019 as the Company
seeks to strengthen its competitive advantage. By 2022, the research effort
expenses will increase to 1.5% of revenue and remain so thereafter.
FDA, clinical trials and regulation expenses will be USD 600,000 in each year
of 2017 and 2018, as the Company will seek to comply with relevant
regulation in its target markets.
The following table summarizes the Company's projected R&D expenses
during the Forecast Period:
Total Operating Expenses
The Company's operating expenses are projected to reach 38% of revenue by
2021, remaining so thereafter. The following table summarizes the
Company's projected operating expenses during the Forecast Period:
Operating Income
The Company's operating income is projected to reach 39% of revenue by
2021, remaining so thereafter. The following table summarizes the
Company's projected operating income during the Forecast Period:
Terminal
USD, thousands 2016 2017 2018 2019 2020 2021 2022 2023
R&D expenses
Research efforts 360 360 360 720 1,305 1,898 2,338 2,385
% of revenue 2.29% 1.18% 1.21% 1.30% 1.40% 1.50% 1.50%
FDA, clinical trials and regulation – 600 600 – – – – –
R&D expenses 360 960 960 720 1,305 1,898 2,338 2,385
% of revenue 6.1% 3.1% 1.2% 1.3% 1.4% 1.5% 1.5%
Terminal
USD, thousands 2016 2017 2018 2019 2020 2021 2022 2023
Total operating expenses 594 6,945 12,677 22,459 37,480 51,602 59,423 60,606
% of revenue 44% 41% 38% 37% 38% 38% 38%
Terminal
USD, thousands 2016 2017 2018 2019 2020 2021 2022 2023
Operating income (594) 8,761 10,967 23,578 40,012 52,486 60,281 61,555
% of revenue 56% 36% 40% 40% 39% 39% 39%
Nexense Technologies USA Inc. | Indicative Valuation Study September 2015
35
Indicative Valuation Analysis
Tax
Nexense Technologies USA Inc. | Indicative Valuation Study September 2015
36
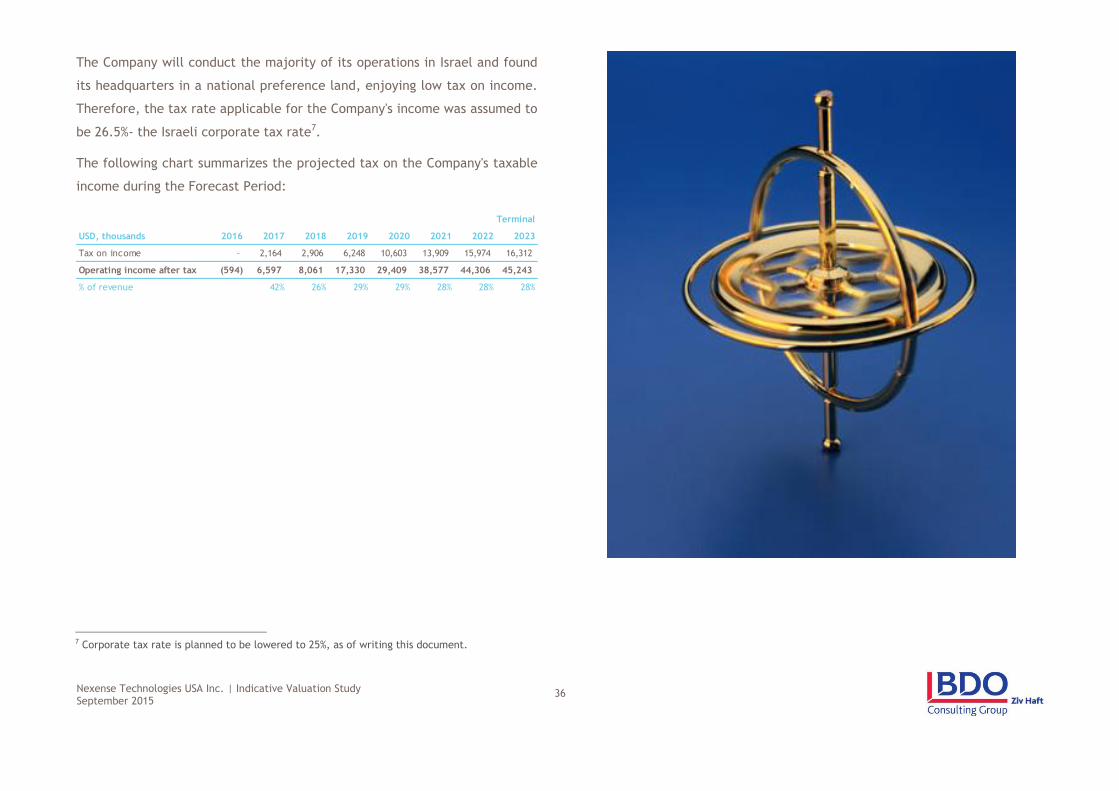
The Company will conduct the majority of its operations in Israel and found
its headquarters in a national preference land, enjoying low tax on income.
Therefore, the tax rate applicable for the Company's income was assumed to
be 26.5%- the Israeli corporate tax rate7.
The following chart summarizes the projected tax on the Company's taxable
income during the Forecast Period:
7 Corporate tax rate is planned to be lowered to 25%, as of writing this document.
Terminal
USD, thousands 2016 2017 2018 2019 2020 2021 2022 2023
Tax on income – 2,164 2,906 6,248 10,603 13,909 15,974 16,312
Operating income after tax (594) 6,597 8,061 17,330 29,409 38,577 44,306 45,243
% of revenue 42% 26% 29% 29% 28% 28% 28%
Nexense Technologies USA Inc. | Indicative Valuation Study September 2015
37
Indicative Valuation Analysis
Cash Flow Adjustments
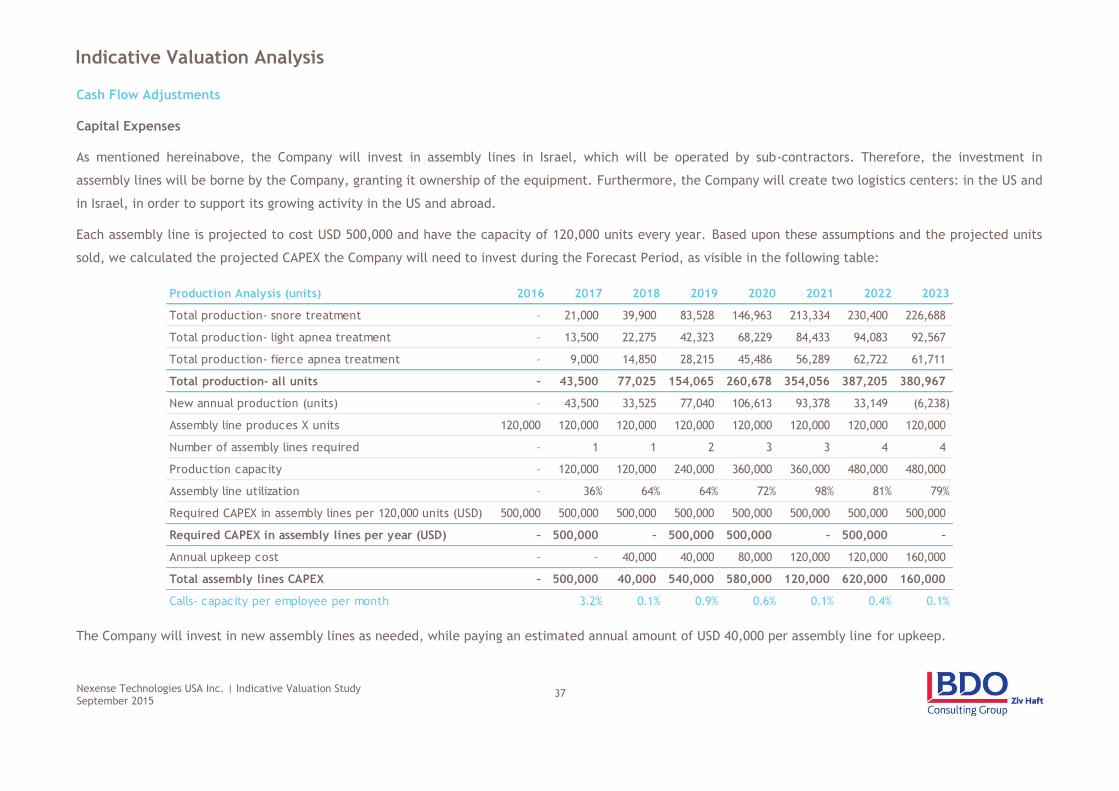
Capital Expenses
As mentioned hereinabove, the Company will invest in assembly lines in Israel, which will be operated by sub-contractors. Therefore, the investment in
assembly lines will be borne by the Company, granting it ownership of the equipment. Furthermore, the Company will create two logistics centers: in the US and
in Israel, in order to support its growing activity in the US and abroad.
Each assembly line is projected to cost USD 500,000 and have the capacity of 120,000 units every year. Based upon these assumptions and the projected units
sold, we calculated the projected CAPEX the Company will need to invest during the Forecast Period, as visible in the following table:
The Company will invest in new assembly lines as needed, while paying an estimated annual amount of USD 40,000 per assembly line for upkeep.
Production Analysis (units) 2016 2017 2018 2019 2020 2021 2022 2023
Total production- snore treatment – 21,000 39,900 83,528 146,963 213,334 230,400 226,688
Total production- light apnea treatment – 13,500 22,275 42,323 68,229 84,433 94,083 92,567
Total production- fierce apnea treatment – 9,000 14,850 28,215 45,486 56,289 62,722 61,711
Total production- all units – 43,500 77,025 154,065 260,678 354,056 387,205 380,967
New annual production (units) – 43,500 33,525 77,040 106,613 93,378 33,149 (6,238)
Assembly line produces X units 120,000 120,000 120,000 120,000 120,000 120,000 120,000 120,000
Number of assembly lines required – 1 1 2 3 3 4 4
Production capacity – 120,000 120,000 240,000 360,000 360,000 480,000 480,000
Assembly line utilization – 36% 64% 64% 72% 98% 81% 79%
Required CAPEX in assembly lines per 120,000 units (USD) 500,000 500,000 500,000 500,000 500,000 500,000 500,000 500,000
Required CAPEX in assembly lines per year (USD) – 500,000 – 500,000 500,000 – 500,000 –
Annual upkeep cost – – 40,000 40,000 80,000 120,000 120,000 160,000
Total assembly lines CAPEX – 500,000 40,000 540,000 580,000 120,000 620,000 160,000
Calls- capacity per employee per month 3.2% 0.1% 0.9% 0.6% 0.1% 0.4% 0.1%
Nexense Technologies USA Inc. | Indicative Valuation Study September 2015
38
Indicative Valuation Analysis
Cash Flow Adjustments (Continued)
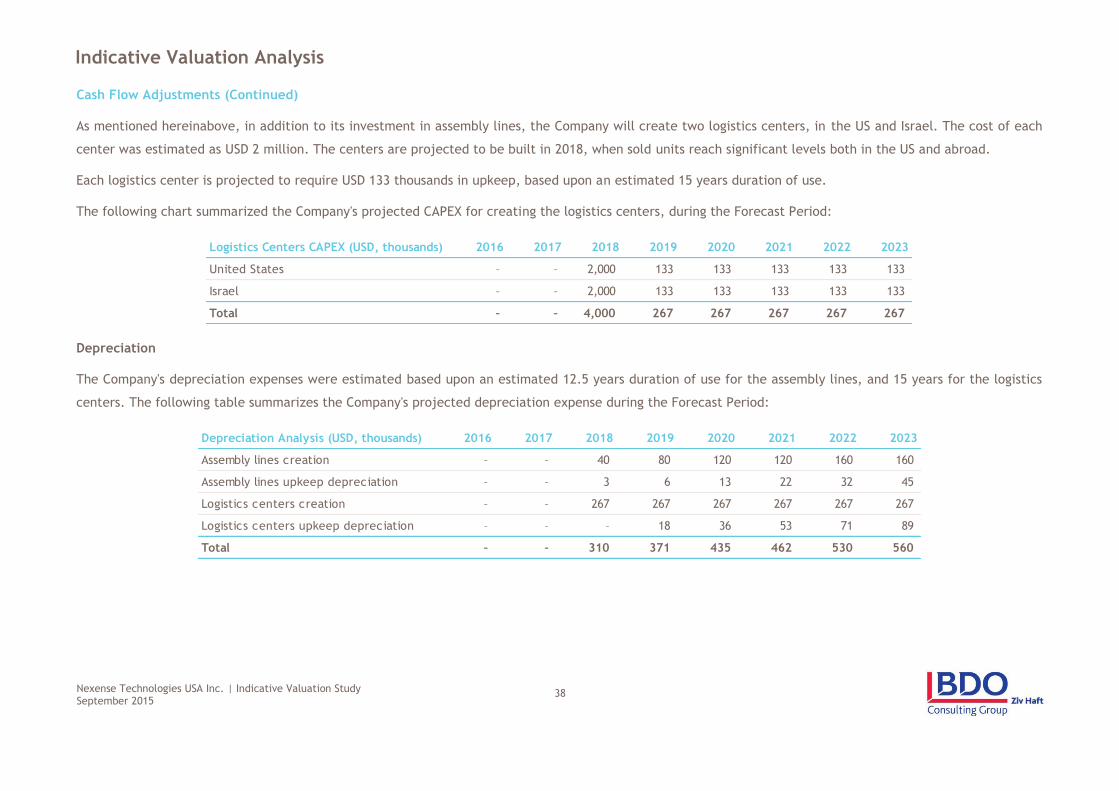
As mentioned hereinabove, in addition to its investment in assembly lines, the Company will create two logistics centers, in the US and Israel. The cost of each
center was estimated as USD 2 million. The centers are projected to be built in 2018, when sold units reach significant levels both in the US and abroad.
Each logistics center is projected to require USD 133 thousands in upkeep, based upon an estimated 15 years duration of use.
The following chart summarized the Company's projected CAPEX for creating the logistics centers, during the Forecast Period:
Depreciation
The Company's depreciation expenses were estimated based upon an estimated 12.5 years duration of use for the assembly lines, and 15 years for the logistics
centers. The following table summarizes the Company's projected depreciation expense during the Forecast Period:
Logistics Centers CAPEX (USD, thousands) 2016 2017 2018 2019 2020 2021 2022 2023
United States – – 2,000 133 133 133 133 133
Israel – – 2,000 133 133 133 133 133
Total – – 4,000 267 267 267 267 267
Depreciation Analysis (USD, thousands) 2016 2017 2018 2019 2020 2021 2022 2023
Assembly lines creation – – 40 80 120 120 160 160
Assembly lines upkeep depreciation – – 3 6 13 22 32 45
Logistics centers creation – – 267 267 267 267 267 267
Logistics centers upkeep depreciation – – – 18 36 53 71 89
Total – – 310 371 435 462 530 560
Nexense Technologies USA Inc. | Indicative Valuation Study September 2015
39
Indicative Valuation Analysis
Cash Flow Adjustments (Continued)
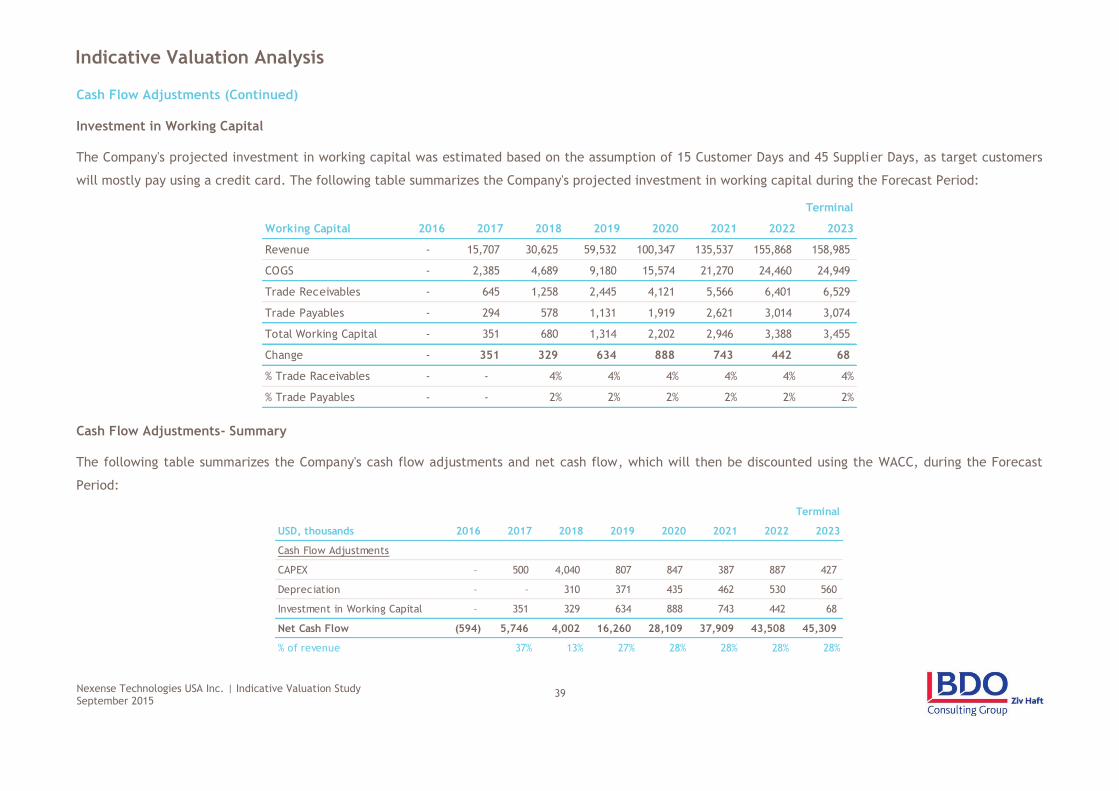
Investment in Working Capital
The Company's projected investment in working capital was estimated based on the assumption of 15 Customer Days and 45 Supplier Days, as target customers
will mostly pay using a credit card. The following table summarizes the Company's projected investment in working capital during the Forecast Period:
Cash Flow Adjustments- Summary
The following table summarizes the Company's cash flow adjustments and net cash flow, which will then be discounted using the WACC, during the Forecast
Period:
Terminal
Working Capital 2016 2017 2018 2019 2020 2021 2022 2023
Revenue - 15,707 30,625 59,532 100,347 135,537 155,868 158,985
COGS - 2,385 4,689 9,180 15,574 21,270 24,460 24,949
Trade Receivables - 645 1,258 2,445 4,121 5,566 6,401 6,529
Trade Payables - 294 578 1,131 1,919 2,621 3,014 3,074
Total Working Capital - 351 680 1,314 2,202 2,946 3,388 3,455
Change - 351 329 634 888 743 442 68
% Trade Raceivables - - 4% 4% 4% 4% 4% 4%
% Trade Payables - - 2% 2% 2% 2% 2% 2%
Terminal
USD, thousands 2016 2017 2018 2019 2020 2021 2022 2023
Cash Flow Adjustments
CAPEX – 500 4,040 807 847 387 887 427
Depreciation – – 310 371 435 462 530 560
Investment in Working Capital – 351 329 634 888 743 442 68
Net Cash Flow (594) 5,746 4,002 16,260 28,109 37,909 43,508 45,309
% of revenue 37% 13% 27% 28% 28% 28% 28%
Nexense Technologies USA Inc. | Indicative Valuation Study September 2015
40
Indicative Valuation Analysis
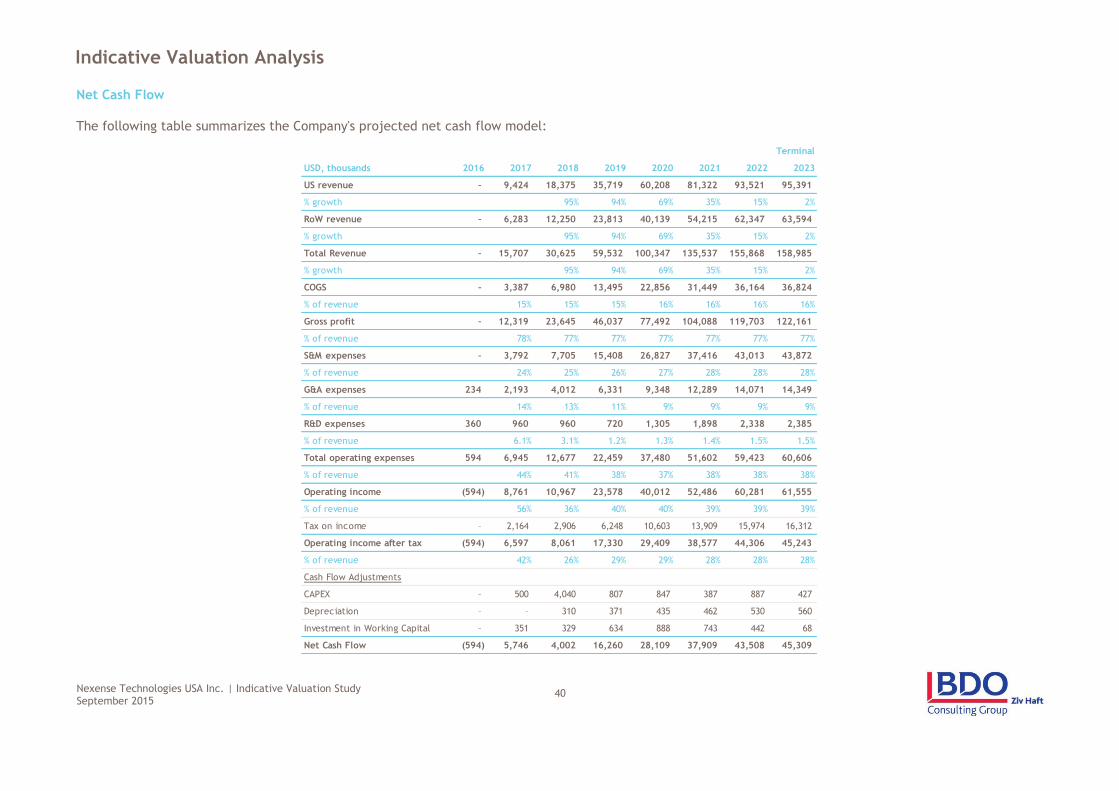
Net Cash Flow
The following table summarizes the Company's projected net cash flow model:
Terminal
USD, thousands 2016 2017 2018 2019 2020 2021 2022 2023
US revenue – 9,424 18,375 35,719 60,208 81,322 93,521 95,391
% growth 95% 94% 69% 35% 15% 2%
RoW revenue – 6,283 12,250 23,813 40,139 54,215 62,347 63,594
% growth 95% 94% 69% 35% 15% 2%
Total Revenue – 15,707 30,625 59,532 100,347 135,537 155,868 158,985
% growth 95% 94% 69% 35% 15% 2%
COGS – 3,387 6,980 13,495 22,856 31,449 36,164 36,824
% of revenue 15% 15% 15% 16% 16% 16% 16%
Gross profit – 12,319 23,645 46,037 77,492 104,088 119,703 122,161
% of revenue 78% 77% 77% 77% 77% 77% 77%
S&M expenses – 3,792 7,705 15,408 26,827 37,416 43,013 43,872
% of revenue 24% 25% 26% 27% 28% 28% 28%
G&A expenses 234 2,193 4,012 6,331 9,348 12,289 14,071 14,349
% of revenue 14% 13% 11% 9% 9% 9% 9%
R&D expenses 360 960 960 720 1,305 1,898 2,338 2,385
% of revenue 6.1% 3.1% 1.2% 1.3% 1.4% 1.5% 1.5%
Total operating expenses 594 6,945 12,677 22,459 37,480 51,602 59,423 60,606
% of revenue 44% 41% 38% 37% 38% 38% 38%
Operating income (594) 8,761 10,967 23,578 40,012 52,486 60,281 61,555
% of revenue 56% 36% 40% 40% 39% 39% 39%
Tax on income – 2,164 2,906 6,248 10,603 13,909 15,974 16,312
Operating income after tax (594) 6,597 8,061 17,330 29,409 38,577 44,306 45,243
% of revenue 42% 26% 29% 29% 28% 28% 28%
Cash Flow Adjustments
CAPEX – 500 4,040 807 847 387 887 427
Depreciation – – 310 371 435 462 530 560
Investment in Working Capital – 351 329 634 888 743 442 68
Net Cash Flow (594) 5,746 4,002 16,260 28,109 37,909 43,508 45,309
Nexense Technologies USA Inc. | Indicative Valuation Study September 2015
41
Indicative Valuation Analysis
WACC
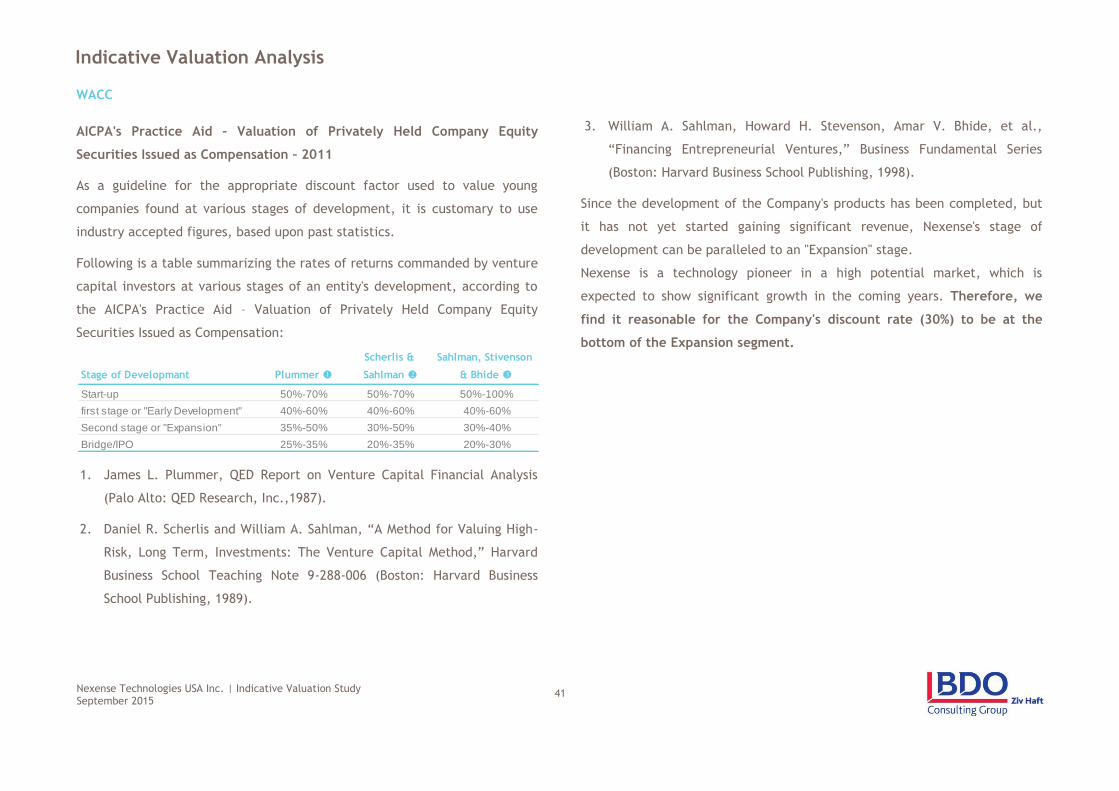
AICPA's Practice Aid – Valuation of Privately Held Company Equity
Securities Issued as Compensation – 2011
As a guideline for the appropriate discount factor used to value young
companies found at various stages of development, it is customary to use
industry accepted figures, based upon past statistics.
Following is a table summarizing the rates of returns commanded by venture
capital investors at various stages of an entity's development, according to
the AICPA's Practice Aid – Valuation of Privately Held Company Equity
Securities Issued as Compensation:
1. James L. Plummer, QED Report on Venture Capital Financial Analysis
(Palo Alto: QED Research, Inc.,1987).
2. Daniel R. Scherlis and William A. Sahlman, “A Method for Valuing High-
Risk, Long Term, Investments: The Venture Capital Method,” Harvard
Business School Teaching Note 9-288-006 (Boston: Harvard Business
School Publishing, 1989).
3. William A. Sahlman, Howard H. Stevenson, Amar V. Bhide, et al.,
“Financing Entrepreneurial Ventures,” Business Fundamental Series
(Boston: Harvard Business School Publishing, 1998).
Since the development of the Company's products has been completed, but
it has not yet started gaining significant revenue, Nexense's stage of
development can be paralleled to an "Expansion" stage.
Nexense is a technology pioneer in a high potential market, which is
expected to show significant growth in the coming years. Therefore, we
find it reasonable for the Company's discount rate (30%) to be at the
bottom of the Expansion segment.
Stage of Developmant Plummer u
Scherlis &
Sahlman v
Sahlman, Stivenson
& Bhide w
Start-up 50%-70% 50%-70% 50%-100%
first stage or "Early Development" 40%-60% 40%-60% 40%-60%
Second stage or "Expansion" 35%-50% 30%-50% 30%-40%
Bridge/IPO 25%-35% 20%-35% 20%-30%
Nexense Technologies USA Inc. | Indicative Valuation Study September 2015
42
Indicative Valuation Analysis
WACC
When applying the Income Approach, the cash flows expected to be
generated by a business are discounted to their present value equivalent
using a rate of return that reflects the relative risk of the investment, as
well as the time value of money
This return, known as the weighted average cost of capital (“WACC”) is
calculated by weighting the required returns on interest-bearing debt and
common equity capital in proportion to their estimated percentages in an
expected industry capital structure.
The general formula for calculating the WACC is:
WACC = Kd (D%) + Ke (E%) , where:
WACC= Weighted average rate of return on invested capital;
Kd= After-tax rate of return on debt capital;
D%= Debt capital as a percentage of the sum of the debt, preferred
and common equity capital (“Total Invested Capital”);
Ke= Rate of return on common equity capital; and
E%= Common equity capital as a percentage of the Total Invested
Capital.
CAPM has been empirically tested and is widely accepted for the purpose of
estimating a company’s required return on capital. In applying the CAPM,
the rate of return on capital is estimated as the current risk-free rate of
return on Israeli Governmental bonds, plus a market risk premium expected
over the risk-free rate of return, multiplied by the “beta” for the valued
company. Beta is defined as a risk measure that reflects the sensitivity of a
company’s stock (or capital) price to the movements of the stock market as
a whole.
The CAPM rate of return on capital is calculated using the following formula:
The CAPM rate of return on capital is calculated using the following formula:
Ke = Rf + β(Rm * Rf)+ SCP+ Sp Where;
Ke= Rate of return on capital (in this case, Total Invested Capital);
Rf= Risk free rate of return;
Β= Beta or systematic risk for this type of capital investment (in
this case, asset beta);
In order to calculate the beta we based on Damodaran's data
on companies, operating in the drug market.
Rm – Rf= Market risk premium; the expected return on a broad portfolio
of stocks in the market (Rm) less the risk free rate (Rf);
SRP Small cap premium - Ibbotson valuation edition 2013
yearbook;
SCP Specific Premium;
Since most innovative young companies are unlevered, the Company's
representative debt ratio was determined to be 0%.
Nexense Technologies USA Inc. | Indicative Valuation Study September 2015
43
Indicative Valuation Analysis
WACC
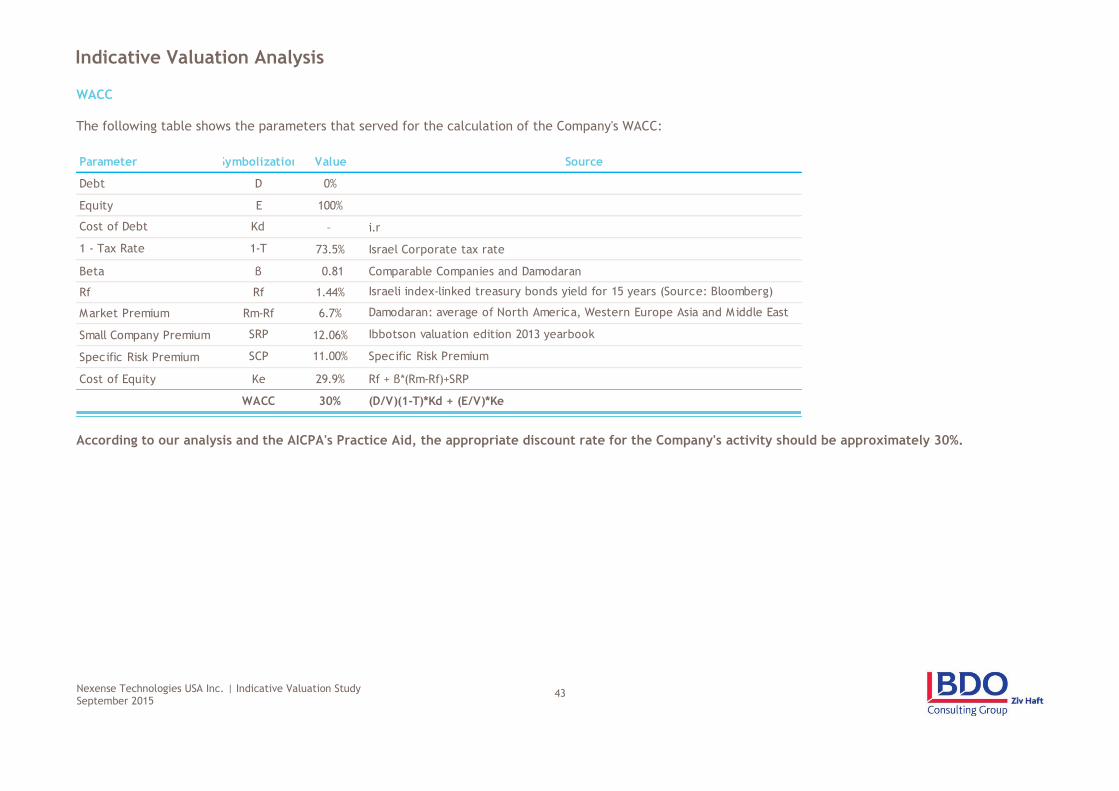
The following table shows the parameters that served for the calculation of the Company's WACC:
According to our analysis and the AICPA's Practice Aid, the appropriate discount rate for the Company's activity should be approximately 30%.
Parameter Symbolization Value Source
Debt D 0%
Equity E 100%
Cost of Debt Kd – i.r
1 - Tax Rate 1-T 73.5% Israel Corporate tax rate
Beta β 0.81 Comparable Companies and Damodaran
Rf Rf 1.44% Israeli index-linked treasury bonds yield for 15 years (Source: Bloomberg)
Market Premium Rm-Rf 6.7% Damodaran: average of North America, Western Europe Asia and Middle East
Small Company Premium SRP 12.06% Ibbotson valuation edition 2013 yearbook
Specific Risk Premium SCP 11.00% Specific Risk Premium
Cost of Equity Ke 29.9% Rf + β*(Rm-Rf)+SRP
WACC 30% (D/V)(1-T)*Kd + (E/V)*Ke
Nexense Technologies USA Inc. | Indicative Valuation Study September 2015
44
Indicative Valuation Analysis
Indicative Valuation Summary
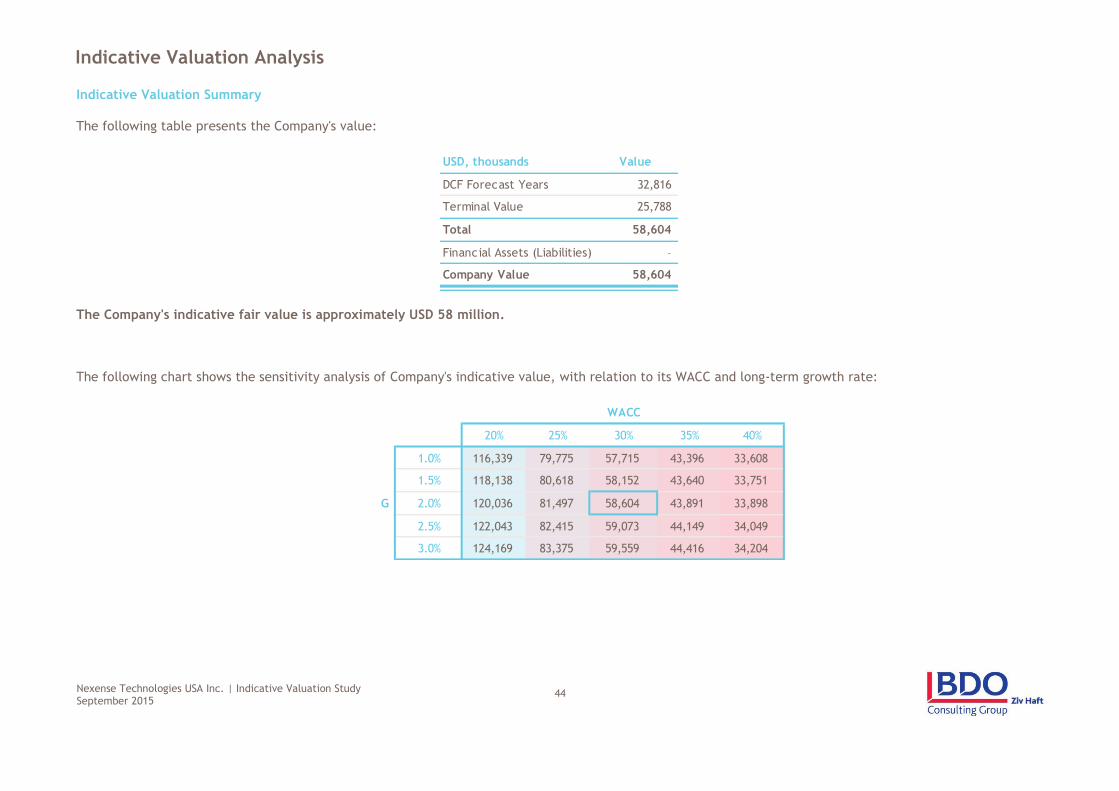
The following table presents the Company's value:
The Company's indicative fair value is approximately USD 58 million.
The following chart shows the sensitivity analysis of Company's indicative value, with relation to its WACC and long-term growth rate:
USD, thousands Value
DCF Forecast Years 32,816
Terminal Value 25,788
Total 58,604
Financial Assets (Liabilities) –
Company Value 58,604
WACC
58,604 20% 25% 30% 35% 40%
1.0% 116,339 79,775 57,715 43,396 33,608
1.5% 118,138 80,618 58,152 43,640 33,751
G 2.0% 120,036 81,497 58,604 43,891 33,898
2.5% 122,043 82,415 59,073 44,149 34,049
3.0% 124,169 83,375 59,559 44,416 34,204