Embed Size (px)
Citation preview
ORIGINAL RESEARCHpublished: 05 September 2017
doi: 10.3389/fnhum.2017.00433
Individual Differences in Frequencyand Topography of Slow and FastSleep SpindlesRoy Cox1,2*, Anna C. Schapiro1,2, Dara S. Manoach2,3,4 and Robert Stickgold1,2
1Department of Psychiatry, Beth Israel Deaconess Medical Center, Boston, MA, United States, 2Department of Psychiatry,Harvard Medical School, Boston, MA, United States, 3Department of Psychiatry, Massachusetts General Hospital,Charlestown, MA, United States, 4Athinoula A. Martinos Center for Biomedical Imaging, Charlestown, MA, United States
Edited by:Juliana Yordanova,
Institute of Neurobiology (BAS),Bulgaria
Reviewed by:Luigi De Gennaro,
Sapienza Università di Roma, ItalyChristian O’Reilly,
École Polytechnique Fédérale deLausanne, Switzerland
*Correspondence:Roy Cox
Received: 08 June 2017Accepted: 15 August 2017
Published: 05 September 2017
Citation:Cox R, Schapiro AC, Manoach DS
and Stickgold R (2017) IndividualDifferences in Frequency andTopography of Slow and Fast
Sleep Spindles.Front. Hum. Neurosci. 11:433.
doi: 10.3389/fnhum.2017.00433
Sleep spindles are transient oscillatory waveforms that occur during non-rapid eyemovement (NREM) sleep across widespread cortical areas. In humans, spindles canbe classified as either slow or fast, but large individual differences in spindle frequencyas well as methodological difficulties have hindered progress towards understandingtheir function. Using two nights of high-density electroencephalography recordings from28 healthy individuals, we first characterize the individual variability of NREM spectra anddemonstrate the difficulty of determining subject-specific spindle frequencies. We thenintroduce a novel spatial filtering approach that can reliably separate subject-specificspindle activity into slow and fast components that are stable across nights and acrossN2 and N3 sleep. We then proceed to provide detailed analyses of the topographicalexpression of individualized slow and fast spindle activity. Group-level analyses conformto known spatial properties of spindles, but also uncover novel differences betweensleep stages and spindle classes. Moreover, subject-specific examinations reveal thatindividual topographies show considerable variability that is stable across nights.Finally, we demonstrate that topographical maps depend nontrivially on the spindlemetric employed. In sum, our findings indicate that group-level approaches masksubstantial individual variability of spindle dynamics, in both the spectral and spatialdomains. We suggest that leveraging, rather than ignoring, such differences may proveuseful to further our understanding of the physiology and functional role of sleepspindles.
Keywords: sleep spindles, individual differences, spatial filter, generalized eigendecomposition, EEG
INTRODUCTION
Sleep spindles are prominent rhythmic waveforms expressed by the mammalian brain duringnon-rapid eye movement (NREM) sleep. In humans, spindles are readily visible in theelectroencephalogram (EEG) and are defined as short (∼0.5–2 s) bursts of activity in thesigma band (9–16 Hz; but see below). While they are initiated in the thalamus (Steriade et al.,1987), reciprocal interactions between cortex and thalamus shape their duration and amplitude(Contreras et al., 1997; Bonjean et al., 2011). Spindles are a defining feature of light N2 sleep, butalso occur during deep N3 sleep where their occurrence is often obscured by large-amplitude∼1 Hzslow oscillations. Moreover, spindles can be present globally or restricted to specific brain regions
Frontiers in Human Neuroscience | www.frontiersin.org 1 September 2017 | Volume 11 | Article 433

Cox et al. Individual Differences of Slow and Fast Spindles
(Nir et al., 2011; Frauscher et al., 2015; Piantoni et al., 2016),propagate across the cortex (O’Reilly and Nielsen, 2014; Souzaet al., 2016), and show complex patterns of interregionalsynchronization (Cox et al., 2014b; Muller et al., 2016).Functionally, sleep spindles are believed to be involved inprocesses of plasticity and offline memory consolidation (DeGennaro and Ferrara, 2003; Lüthi, 2013; Rasch and Born, 2013)as evidenced from relations between spindle activity andmemoryretention (Schabus et al., 2004; Cox et al., 2012; Mednick et al.,2013; Lustenberger et al., 2016).
Although the formal definition treats spindles as anundifferentiated category restricted to the 11–16 Hz range (mostcommonly 12–14 Hz; Iber et al., 2007), substantial evidencesuggests that spindles can be classified as either slow (∼10 Hz)or fast (∼13 Hz). While it is presently unclear whether slowand fast spindles serve distinct functional roles (Tamaki et al.,2008, 2009; Barakat et al., 2011; Cox et al., 2014a; Hoedlmoseret al., 2014; Rihm et al., 2014; Fang et al., 2017), they areassociated with different hemodynamic sources (Schabus etal., 2007), respond differently to pharmacological interventions(Ayoub et al., 2013), preferentially occur in distinct phasesof the slow oscillation (Mölle et al., 2011; Cox et al., 2014b;Staresina et al., 2015; Klinzing et al., 2016), and are dissociatedin terms of heritability (Purcell et al., 2017). Slow and fastspindles also have distinct EEG topographical distributions,with slow spindles having a more frontal expression andfast spindles occurring mostly centrally and parietally (Werthet al., 1997; Zeitlhofer et al., 1997). Importantly, while theslow spindle band roughly corresponds to the waking alpharange (8–12 Hz), individuals’ alpha activity is typically slower(Kokkinos and Kostopoulos, 2011) and is defined by a distinctposterior topographical distribution, suggesting these rhythmsreflect distinct phenomena. Although differential slow/fastspindle topographies are well known at the group-level, littleis known about the consistency of these topographical patternsacross individuals. However, assessing this variability is animportant step towards a full understanding of the dynamicsof slow and fast sleep spindle activity within and acrossindividuals.
Separating slow and fast spindles is nontrivial, in part becauseof the diversity of spectral definitions used by different groupsfor spindle detection. A non-exhaustive search of the literaturereveals demarcation frequencies between slow and fast spindlesplaced at 12, 13, 13.5 and 14 Hz (Schabus et al., 2007; Barakatet al., 2011; Mölle et al., 2011; Holz et al., 2012; Ayoub et al.,2013;Wamsley et al., 2013). Similarly, the lower boundary of slowspindles has been set anywhere from 8 Hz to 12 Hz (Barakat etal., 2011; Mölle et al., 2011; Holz et al., 2012; Ayoub et al., 2013;Wamsley et al., 2013), and the higher boundary of fast spindlesat 15 or 16 Hz (Tamaki et al., 2008; Ayoub et al., 2013). Similarvariability exists for studies not further differentiating betweenslow and fast spindles. Clearly, this situation hinders comparisonacross studies.
The issue is exacerbated further by considerable variabilityin spindle frequency across individuals (De Gennaro et al.,2005; Ujma et al., 2015). Subject-specific spindle frequenciesare typically determined from peaks in the power spectrum.
However, slow and fast sigma peak frequencies are not confinedto well-separated frequency ranges but form overlappingdistributions at the group level (Ujma et al., 2015). Thus, eventhe demarcation line best separating slow and fast sigma peaks atthe group-level likely results in incorrect classification of spindleactivity for some subjects and suboptimal separation for manyothers.
Together, individual differences in peak sigma frequenciesand variable spectral spindle criteria distort the correspondencebetween the oscillatory phenomena of interest and the measuredactivity used for subsequent analysis. This problem affectsapproaches investigating sigma power as a proxy for spindleactivity (Achermann and Borbély, 1998), as well as spindledetection algorithms based on band-pass filters and amplitudethresholds (e.g., Ferrarelli et al., 2007; Cox et al., 2014a).
To avoid these issues, approaches targeting subject-specificspindle frequencies have been developed (Gottselig et al., 2002;Bódizs et al., 2009; Mölle et al., 2011; Adamczyk et al., 2015;O’Reilly et al., 2015; Ujma et al., 2015). However, while fast sigmapeaks are typically prominent, slow sigma peaks are not alwaysdiscernible, even at frontal channels where slow spindle activityis generally most pronounced (Mölle et al., 2011). This mayreflect that slow and fast spindle topographies, while distinct,still show considerable overlap at both the level of sensors andunderlying generators (Klinzing et al., 2016). Moreover, as wewill demonstrate, individual differences in spindle topographylimit the effectiveness of selecting a single channel for slow sigmapeak detection. Finally, slow spindles have been observed toexpress marked shifts of ∼1 Hz between sleep stages, from fasterin N2 to slower in N3 (Mölle et al., 2011). In sum, availablemethods to separate spindle classes do not always succeed andcan lead to ambiguous results depending on what sleep stage isexamined.
To overcome these difficulties, we introduce a novelapproach to determine individualized slow and fast sigmafrequencies in a data-driven fashion. The current report isorganized into three main parts. In part one (Channel-BasedAnalyses), we describe individual differences in the NREMpower spectrum, focusing on the difficulties of detectingsubject-specific sigma peaks from both channel-averagedand single-channel spectra. In part two (Component-BasedAnalyses), we detail a spatial filtering approach to facilitateisolation of subject-specific slow and fast sigma frequencies.We show that spectra derived from spatially filtered dataallow for slow peak detection in more individuals and withless ambiguity than channel-based spectra. In part three(Topographical Analyses), we characterize topographicalaspects of slow and fast sleep spindle expression in N2 andN3, both to validate our sigma peak separation method,and to examine spatial aspects of spindles not yet described.In particular, we investigate the commonalities, individualdifferences, and cross-night stability of spatially organizedspindle activity, as well as topographical differences betweenseveral often-used metrics of spindle activity. Part three willbe particularly relevant to those interested in the implicationsof these methods for topographical spindle dynamics, and canbe read separately from the first two parts. Combined, our
Frontiers in Human Neuroscience | www.frontiersin.org 2 September 2017 | Volume 11 | Article 433

Cox et al. Individual Differences of Slow and Fast Spindles
results demonstrate the utility of our spindle separationapproach and yield important new insights regardingthe nature and variability of topographical sleep spindledynamics.
MATERIALS AND METHODS
Protocol and ParticipantsThe current study utilizes two consecutive nights of full-nightEEG data from 28 healthy individuals (age: 29.7 ± 6.0; 21 males,7 females). These data were acquired as part of a double-blind, placebo-controlled, cross-over study of eszopiclone inschizophrenia patients. Only the placebo nights of the controlgroup are considered in the present report.
The study protocol was approved by the Partners HumanResearch Committee. All subjects gave written informed consentin accordance with the Declaration of Helsinki and werecompensated monetarily for their participation. Participantshad no personal history of mental illness as confirmed byscreening with the SCID-Non-Patient Edition (First et al.,2002). Furthermore, they reported no diagnosed sleep disorders,treatment with sleep medications, history of significant headinjury or neurological illness, or history of substance abuse ordependence within the past 6 months. Upon completion of apre-treatment visit to complete informed consent and undergoclinical and cognitive assessments, subjects received an actiwatchto wear from study enrollment to completion.
Subjects were randomly assigned to one of two treatmentorders, placebo first or eszopiclone first, with a week in betweenthe two treatment visits. Each of the two treatment visitsconsisted of two consecutive nights of polysomnography (PSG)monitoring at the Clinical Research Center of MassachusettsGeneral Hospital. The first night of each visit served as a baselinenight, while on the second night participants were trained for12 min on a finger tapping Motor Sequence Task (Walker et al.,2002) 1 h prior to their usual bedtime. On both nights of theplacebo visit, participants received placebo at 10 PM. Lights wereturned off at 10.30 PM and participants were allowed to sleep forup to 9.5 h until they were woken up at 8 AM. As no statisticallysignificant differences in sleep architecture or spindle parameterswere found between the baseline and learning nights, we focusedour analyses on the first night and used the second night forvalidation and replication.
Data Acquisition and PreprocessingPSG was collected using 62-channel EEG caps (Easycap GmbH,Herrsching, Germany) with channel positions in accordancewith the 10-20 system. Additionally, two single cup electrodeswere placed on the mastoid processes, two around the eyesfor electrooculography, two on the chin for electromyography,and a reference electrode was placed on the forehead. AnAURA-LTM64 amplifier and TWin software were used fordata acquisition (Grass Technologies, Warwick, RI, USA).Impedances were kept below 25 k� and data were sampledat 400 Hz with hardware high-pass and low-pass filters at0.1 Hz and 133 Hz, respectively.
Sleep staging was performed in TWin using a limited numberof channels with a contralateral mastoid reference on 30 s epochsaccording to standard criteria (Iber et al., 2007). Initial processingof multi-channel EEG data was performed in BrainVisionAnalyzer 2.0 (BrainProducts, Germany). All EEG channels wereband-pass filtered between 0.3 Hz and 35 Hz and notch filteredat 60 Hz. Channels displaying significant artifacts for morethan 30 min of the recording were interpolated with sphericalsplines. EEG data were then re-referenced to the average ofall EEG channels. Upon visual inspection, epochs containingartifacts were removed. To remove artifacts we used independentcomponent analysis (ICA) with the Infomax algorithm (Makeiget al., 1997). For each night and individual, remaining epochswere concatenated separately for the two sleep stages, resultingin 176 ± 61 (mean ± SD) and 211 ± 49 min of available N2 forthe two nights, and 82± 44 and 85± 30 min of N3.
All subsequent processing steps were performed in Matlab(The Mathworks, Natick, MA, USA), using custom routines andseveral freely available toolboxes including EEGlab (Delormeand Makeig, 2004) and Fieldtrip (Oostenveld et al., 2011).After removal of non-EEG channels and the mastoids, leaving58 channels for analysis, we applied a surface Laplacian filter toeach record (Perrin et al., 1989), as implemented in the CSDtoolbox (Kayser and Tenke, 2006). This approach served twopurposes. First, the Laplacian renders data reference-free, therebyavoiding common interpretational issues related to the choice ofreference. Second, this approach decreases the effects of volumeconduction and accentuates local aspects of neural processing,thereby providing enhanced spatial precision for topographicalanalyses (Cohen, 2014; Tenke and Kayser, 2015). While theLaplacian is a spatial filter, we emphasize it is not the spatialfiltering approach that we employ to separate slow and fast sigmapeaks.
Power Spectra and Peak DetectionAfter the Laplacian transformation, we determined the powerspectrum for every epoch on every channel. In order to minimizethe typical 1/f scaling of the spectrum, we obtained powerestimates not from the Laplacian-transformed time series, butfrom its temporal derivative. This approach essentially multipliespower at every frequency bin by its frequency, thus counteractingthe 1/f trend and allowing for easier detection of spectralpeaks relative to surrounding frequencies (Sleigh et al., 2001).Using the Laplacian-derivatives, we estimated power spectraldensity for each epoch using Welch’s method with 5 s windowsand 50% overlap. We then normalized every electrode’s powerspectrum during both N2 and N3 by dividing the spectrum bythat electrode’s average power in the 0–4 Hz band across allN2 epochs. This normalization step, based on a common baselinefor N2 and N3, enables direct comparisons between sleep stages.
To determine global spectra, single-epoch spectra wereaveraged across all channels, before averaging across epochs,separately for N2 and N3. For visualization and peak detection,each individual’s 0–20 Hz spectra were rescaled between theminimum and maximum values in that range. Spectral peakswere detected using the Matlab findpeaks function with aminimum prominence setting of 0.01, where the prominence of a
Frontiers in Human Neuroscience | www.frontiersin.org 3 September 2017 | Volume 11 | Article 433

Cox et al. Individual Differences of Slow and Fast Spindles
peak indicates how much a peak stands out as a function of bothits intrinsic amplitude and its location relative to other peaks.For our data, this setting corresponded to a very liberal detectionthreshold.
In addition to channel-averaged spectra, we determinedspectra for two selected channels (frontal: Fz; parietal: Pz).We selected these channels based on evidence of the relativepredominance of slow and fast spindles (Tamaki et al., 2008;Ayoub et al., 2013). Single-channel spectra were averaged acrossepochs, again separately for N2 and N3 and both nights.Automated spectral peak detection was performed as before.
Slow and Fast Sigma Peak Separation viaSpatial FiltersIn order to isolate each individual’s slow and fast sigma activityin data-driven fashion, we created linear spatial filters maximallyenhancing slow vs. fast sigma activity and vice versa. Wethen applied these filters to the multi-channel EEG time seriesto obtain a set of component time series that we analyzedin the frequency domain. The spatial filters were definedby eigenvectors extracted from covariance matrices, similarto principal component analysis (PCA). In a spatial filteringcontext, the PCA procedure operates on a single channel-by-channel covariance matrix and produces eigenvectors pointingin orthogonal directions that explain decreasing amounts ofvariance. This approach, together with conceptually relatedICA techniques, can be conceptualized as a ‘‘blind’’ sourceseparation procedure, in that resulting components are notnecessarily physiologically meaningful. In contrast, generalizedeigendecomposition (GED) operates on two separate covariancematrices to find eigenvectors maximally differentiating the two.This may be viewed as a ‘‘guided’’ source separation procedurethat spatially separates signal elements according to user-definedcriteria. In our case, we constructed one covariance matrix fromslow sigma-filtered data and one from fast sigma-filtered data.The GED approach has been used in various electrophysiologicalcontexts, typically to maximize spectral power in one frequencyband relative to broadband activity (Nikulin et al., 2011; deCheveigné and Arzounian, 2015; Cohen and Gulbinaite, 2017;Cohen, 2017). We here extend this notion by directly contrastingactivity in two adjacent narrow-band ranges.
In detail, we first band-pass filtered the Laplacian-transformed EEG separately in the slow (9–12 Hz) and fast(12–16 Hz) sigma ranges. We used Hamming-windowed finiteimpulse response filters (EEGlab: pop_firrws) with a high filterorder (13,200) to create steep, narrow filters that have minimaloverlap between the two passband ranges. After subtracting eachfiltered channel’s mean amplitude, we determined the ‘‘slow’’covariance matrix S and the ‘‘fast’’ covariance matrix F, both ofsize 58 × 58 electrodes. If we designate S as the matrix whosesignal we wish to accentuate and F as the matrix with the ‘‘noise’’we wish to suppress, the eigendecomposition problem can bewritten as SW = WFΛ, where W is a matrix of eigenvectorsand Λ is a diagonal matrix of eigenvalues. In Matlab, W andΛ can be found via [W,L] = eig(S,F). The column in W withthe highest corresponding eigenvalue then corresponds to theeigenvector that maximally enhances slow relative to fast sigma
activity. Conversely, the eigenvector with the lowest eigenvaluehas the opposite effect, maximizing fast relative to slow sigmapower. Detailed treatments of the derivation of these equationscan be found elsewhere (Nikulin et al., 2011; de Cheveigné andArzounian, 2015; Cohen, 2017; Cohen and Gulbinaite, 2017).
Although the most useful eigenvectors generally haverelatively high and low eigenvalues, it is not known a prioriwhicheigenvectors will yield the best results. We therefore multipliedthe multi-channel, raw, broadband, Laplacian-transformed,EEG with the full matrix W, resulting in a time series of58 components (where each component reflects a uniquespatial weighting across all channels). These component timeseries, in turn, were transformed to the frequency domain.Similar to channel-based power spectra, we first took thetemporal derivative of the multi-component time series, andthen estimated power spectral density using Welch’s methodwith 5 s windows and 50% overlap. We again took thetemporal derivative approach to reduce 1/f noise, and makechannel- and component-based peak detection as similar aspossible. However, we note that component peak location wasnot noticeably influenced by the temporal derivative approach.Resulting component spectra were visualized and the firstslow and the first fast component with peaks of sufficientquality were selected based on visual inspection. Typically,clear spectral sigma peaks were visible within the first 10(for slow sigma) or last 10 (for fast sigma) components, withseveral components peaking at exactly the same frequency.Although manual component selection is time-consuming andultimately subjective, we note this process is akin to routinemanual selection of ICA components for removal or analysis.Importantly, an individual’s components were selected withoutcross-referencing them against that individual’s channel-basedspectra, guarding against experimenter bias. Moreover, as wewill demonstrate, components independently selected for N2 andN3 and for the two nights showed a close correspondence in peakfrequency for each subject; frequencies of these manually selectedcomponents were determined with an automated peak detectionalgorithm as before. Supplementary Matlab code demonstrateshow to implement the GED analysis for several example sleeprecordings (see ‘‘Data and Software Sharing’’ Section).
We note that the spectral bands we used here for temporalfiltering (9–12 and 12–16 Hz) are slightly different from theones we later adopt as approximate slow (9–12.5 Hz) and fast(12.5–16 Hz) spindle ranges based on the distribution of sigmapeak locations across individuals. However, we determined inseveral subjects that shifting initial filter ranges does not affectfrequencies of subsequently identified component peaks by morethan 0.2 Hz (Supplementary Discussion).
We defined an individual’s slow or fast sigma range as a 1.3 Hzwindow centered on his or her average sigma peak frequencyacross nights and sleep stages. This width was a compromisebetween a sufficiently broad range to capture small within-subject differences in peak frequency across sleep stages andnights, and sufficiently narrow to have non-overlapping slow andfast windows for as many individuals as possible. An additionalconsideration here was that for subsequent spindle detection (see‘‘Spindle Detection’’ Section), data needs to be filtered in each
Frontiers in Human Neuroscience | www.frontiersin.org 4 September 2017 | Volume 11 | Article 433
Cox et al. Individual Differences of Slow and Fast Spindles
individual’s slow or fast sigma range. Thus, we also inspectedeach individual’s slow and fast sigma filters’ frequency responseused for spindle detection. These inspections assisted both inarriving at the 1.3Hz sigma ranges and in deciding which subjectsto remove due to insufficient separation of the slow and fastranges. Based on these considerations, we opted to exclude threesubjects from topographical analyses involving slow spindles,because their N2 and N3 slow sigma peaks differed by more than0.7 Hz. Additionally, we excluded two subjects whose slow andfast sigma filters still overlapped from all topographical analyses(including one who had already been excluded for slow spindleanalysis). Of note, channel and component spectra for one ofthese to-be-removed subjects (S4) are shown in Figures 2C,G.Thus, these additional exclusions were not due to an inability toresolve closely spaced peaks with the GED component approach,but stemmed from an inability to adequately separate them withfilter widths of 1.3 Hz.
Topographical Cluster AnalysesFor topographical analyses of sigma power, we averaged, perepoch and electrode, power across the 1.3 Hz frequency rangecorresponding to each subject’s individualized sigma peaks,before averaging across epochs. This was done separately forN2 and N3, and for each night. Permutation-based statisticalanalyses on topographical data (sigma power, as well asspindle density and spindle amplitude derived from automatedspindle detection) were performed with Fieldtrip using clustercorrection (Maris and Oostenveld, 2007). In several sets ofanalyses, we compared N2 and N3, and slow and fast spindletopographies for different spindle metrics. Using 1000 iterations,the paired samples t statistic, a clusteralpha value of 0.1, and asignificance threshold of 0.05, clusters were deemed significantat P < 0.025 for two-sided testing.
Spectral and Topographical SimilarityWe determined the within-subject similarity of each individual’spower spectra (e.g., between N2 and N3, between nights), andthe topographical correspondence of each individual’s spindleexpression (e.g., between slow and fast spindles, between N2 andN3) in conceptually and analytically similar ways. First, wecalculated the Pearson correlation coefficient between a subject’stwo relevant spectra, or two relevant topographies. For spectra,values were normalized power estimates at every frequencybin from 0 Hz to 20 Hz (103 bins). For topographies, valueswere spindle activity estimates (e.g., sigma power) at each ofthe 58 electrodes. This yielded, across subjects and for eachcomparison, a set of N correlation coefficients and associatedP values (where N is the number of individuals included in theparticular analysis). To assess these results at the group-level, weperformed a one-sample t test comparing the set ofN correlationcoefficients to zero. In addition, we adjusted the set of N Pvalues for multiple comparisons using the False Discovery Rate(Benjamini and Hochberg, 1995) and report the percentage ofsubjects showing above-chance similarity of spectral or spatialprofiles.
Importantly, while within-subject correlation coefficientsprovide a useful index of ‘‘absolute’’ spectral or
topographical similarity, they ignore how similar spectralor topographical profiles are across individuals. For example,average within-subject, cross-night correlation values of 0.8 donot indicate meaningful individual stability if average between-subject correlations are also 0.8. Conversely, within-subjectcorrelations of only 0.4 signal substantial individual stabilityof spectra or topographies if between-subject correlationsare only 0.2.
Second, therefore, we asked how well an individual’s spectralor topographical pattern would allow us to differentiate thatsubject from other subjects. To this end, we trained, for eachcomparison of interest, a k-nearest neighbor classifier (Coverand Hart, 1967) on all subjects’ spectral/topographical patternsin one condition (e.g., night 1), and tested it on unseen datafrom the other condition (e.g., night 2). This is implementedin Matlab as fitcknn. We set k = 1, and used the correlationdistance (1 − Pearson correlation) as the distance metric. Inessence, this means each unseen test record is labeled as the oneit is most highly correlated with from the training set. Classifierperformance was calculated as the proportion of test casesthat were assigned the correct label, and classifier significancewas assessed using binomial tests. Thus, classifier performanceprovides an index of whether—and how much—spectral ortopographical patterns are more stable within than acrosssubjects, thereby complementing the within-subject similarityestimates afforded by Pearson correlation.
Spindle DetectionIndividual sleep spindles were detected with an automatedalgorithm adapted from one we (RC) employed earlier (Cox et al.,2012, 2014a). For each subject and each channel, and separatelyfor the slow and fast sigma ranges, the Laplacian-transformedsignal was zero-phase band-pass filtered in that subject’sfrequency range of interest. Specifically, we used Matlab’s firlsfunction to design steep filters of order 3000 with a 1.3 Hzpassband and 0.5 Hz transition zones around the individualizedcenter frequency. The sigma envelope was calculated as themagnitude of the Hilbert-transformed filtered signal, and wassmoothed with a 200 ms moving average window. Wheneverthe envelope exceeded an upper threshold a potential spindlewas detected. Crossings of a lower threshold before and afterthis point marked the beginning and end, respectively, of thespindle. Start and end points were required to be at least 400 msand no more than 3000 ms apart, similar to other automateddetectors (Ramanathan et al., 2015). Per channel, thresholds wereset at the average N2 smoothed sigma amplitude envelope +3 SDs (upper), and + 1 SD (lower). Spindle events were discardedwhenever power in any 20–80 Hz frequency bin exceeded thatof any frequency bin in that individual’s sigma range (suggestinga broadband power increase rather than band-specific spindle),or when the spindle’s average amplitude envelope was >4 SDabove the mean (indicative of an outlier). We calculated separatethreshold settings for slow and fast spindles to optimally adaptto differences in slow and fast sigma amplitude. For both slowand fast spindles, the same N2-based thresholds were used acrossN2 and N3 to prevent confounding by different levels of sigmapower across these sleep stages. We then determined spindle
Frontiers in Human Neuroscience | www.frontiersin.org 5 September 2017 | Volume 11 | Article 433

Cox et al. Individual Differences of Slow and Fast Spindles
density (spindles per minute) and the mean peak amplitude ofspindle events for each combination of channel, sleep stage andspindle class.
Data and Software SharingOpen source Matlab code (available at https://doi.org/10.6084/m9.figshare.4905677) demonstrates how to implement the GEDanalysis for several example sleep recordings. Sharing ofde-identified data was exempted from ethical approval and wascovered by the informed consent procedure.
RESULTS
Channel-Based AnalysesWe first describe in some detail individual differences of NREMspectra in general, and of sigma activity in particular. Whileprevious reports have already described several aspects of thisvariability (De Gennaro et al., 2005, 2008; Lewandowski et al.,2013; Ujma et al., 2015), we here revisit this issue qualitativelyand quantitatively in order to make the motivation for a novelslow/fast spindle separation approach explicit. We examinespectral properties from both channel-averaged and single-channel (frontal and parietal) perspectives and demonstrate thedifficulties of both employing fixed slow/fast spindle rangesand of utilizing channel-based data to define subject-specificfrequency ranges. Readers already familiar with these issues mayskip ahead to Component-Based Analyses where we introducean improved spindle separation approach based on spatialfilters.
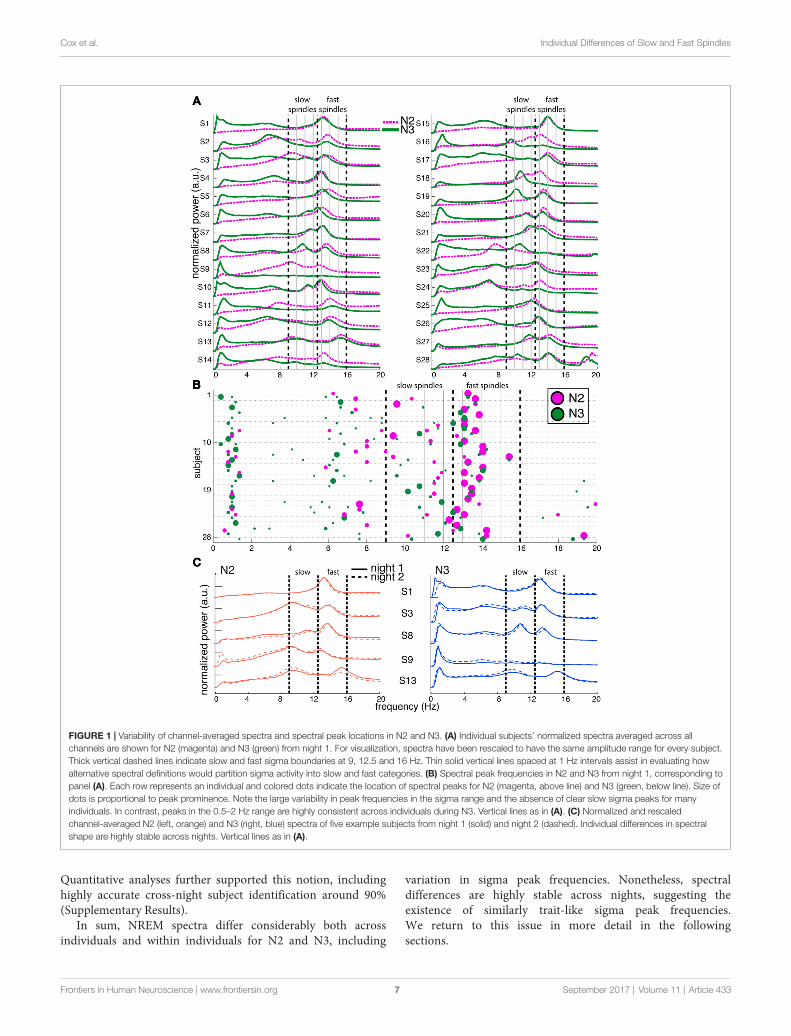
Channel-Averaged SpectraTo depict oscillatory activity across the cortex, we averaged58-channel EEG spectra across all channels for every 30 sepoch, and then across epochs. Figure 1A shows these channel-averaged spectra from night 1 for all 28 subjects during bothN2 (magenta) and N3 (green) in the 0–20 Hz range. Figure 1Bshows each individual’s detected N2 and N3 peak locations ascorrespondingly colored dots with surface areas proportionalto each peak’s prominence. In both panels (A,B), thick dashedvertical lines placed at 9, 12.5 and 16 Hz indicate boundariesthat best separate putative slow and fast sigma peaks acrosssubjects. These boundaries are based on careful inspection ofpeak frequency distributions in the channel averaged-spectra, aswell as the component-based spectra we present later, and agreewell with those used by some other groups (Mölle et al., 2011;Ujma et al., 2015). Nonetheless, the overlap between the chosenslow sigma range and classical alpha band activity is potentiallyproblematic. We justify interpreting dynamics in this band asspindle activity in the ‘‘Discussion’’ Section.
There was high variability in spectral profiles betweensubjects, especially in the prominence and number of visiblepeaks in the sigma range. Using a peak detection methodwith liberal sensitivity, we could identify one or more peaksin the broader 9–16 Hz range for all 28 subjects in bothN2 and N3. In N2, we observed 13 individuals with justone peak, 14 with two, and one subject with three (S13),
although there was typically one peak that was much morepronounced than the others. In N3, 12 individuals had justone identifiable peak, and 16 had two. Peaks in the fastsigma range (12.5–16 Hz) were relatively pronounced duringboth N2 (n = 27) and N3 (n = 24; including two subjectswho had N3 peaks exactly at 12.5 Hz but correspondingN2 peaks > 12.5 Hz), as is evident from the relatively largedots in this range in Figure 1B. In contrast, slow sigma peakswere often very shallow (small dots) or entirely absent inthe channel-averaged spectra, resulting in identified peaks infar fewer subjects (N2: 16, including one subject with peakat 12.5 Hz but corresponding N3 peak < 12.5 Hz; N3: 20).These findings illustrate that two separate sigma peaks can beuncovered from channel-averaged spectra in roughly half thesubjects.
Importantly, there was considerable variation betweensubjects in the precise frequencies of slow (N2: 11.1 ± 1.0 Hz[mean ± SD]; N3: 10.9 ± 0.8 Hz; no stage difference: t(14) = 1.2,P = 0.24) and fast sigma peaks (N2: 13.5 ± 0.6 Hz; N3:13.4 ± 0.6 Hz; trending to minimal stage difference: t(23) = 1.9,P = 0.07), without consistent separation into distinct slow andfast bands across subjects. Importantly, while the demarcationline at 12.5 Hz does a reasonable job for the group, someindividuals’ peaks in Figure 1A are centered right on, or veryclose to, that boundary (e.g., S4, S6, S23 and S25). We alsonote that many clear slow sigma peaks would have been missedentirely if the lower slow sigma boundaries were set at amore conventional 11 Hz, rather than 9 Hz (e.g., S9, S16, S18,S19). Naturally, this issue would only be exacerbated if thisthreshold were increased further. Similarly, depending on theprecise boundaries used, closely spaced peaks could be lumpedtogether into just one of the spindle classes. Thus, fixed frequencycriteria do not adequately capture the natural variation of spindlefrequencies across individuals.
As expected, N2 and N3 power profiles were oftenconsiderably different within the same individual(Figures 1A,B), most notably in the slow oscillation (0.5–2 Hz)and delta (2–4 Hz) range. Indeed, quantitative analyses indicatedthat an individual’s N2 and N3 spectra were generally as differentas spectra from different individuals (Supplementary Results).N2 and N3 differences in sigma amplitude were also evident.While spectral peak frequencies were relatively consistent forfast spindles, they did not correspond well between N2 andN3 in the slow sigma range (e.g., S3, S8, S18; note the disparityin location between magenta N2 dots and green N3 dots).Indeed, for subjects having identifiable peaks in both stages,peak frequencies were highly correlated across N2 and N3 forfast sigma (R = 0.91, P < 10−9), but less robustly for slow sigma(R = 0.53, P = 0.04). Thus, selection of slow and fast sigma bandshas to address variability both across subjects and between sleepstages.
We also examined power spectra within individuals acrossthe two available recording nights, and confirmed previousevidence that spectral profiles are exceptionally similar acrossnights (De Gennaro et al., 2005, 2008; Lewandowski et al.,2013), including stable N2-N3 differences (Figure 1C; seeSupplementary Figure S1 for spectra of all individuals).
Frontiers in Human Neuroscience | www.frontiersin.org 6 September 2017 | Volume 11 | Article 433
Cox et al. Individual Differences of Slow and Fast Spindles
FIGURE 1 | Variability of channel-averaged spectra and spectral peak locations in N2 and N3. (A) Individual subjects’ normalized spectra averaged across allchannels are shown for N2 (magenta) and N3 (green) from night 1. For visualization, spectra have been rescaled to have the same amplitude range for every subject.Thick vertical dashed lines indicate slow and fast sigma boundaries at 9, 12.5 and 16 Hz. Thin solid vertical lines spaced at 1 Hz intervals assist in evaluating howalternative spectral definitions would partition sigma activity into slow and fast categories. (B) Spectral peak frequencies in N2 and N3 from night 1, corresponding topanel (A). Each row represents an individual and colored dots indicate the location of spectral peaks for N2 (magenta, above line) and N3 (green, below line). Size ofdots is proportional to peak prominence. Note the large variability in peak frequencies in the sigma range and the absence of clear slow sigma peaks for manyindividuals. In contrast, peaks in the 0.5–2 Hz range are highly consistent across individuals during N3. Vertical lines as in (A). (C) Normalized and rescaledchannel-averaged N2 (left, orange) and N3 (right, blue) spectra of five example subjects from night 1 (solid) and night 2 (dashed). Individual differences in spectralshape are highly stable across nights. Vertical lines as in (A).
Quantitative analyses further supported this notion, includinghighly accurate cross-night subject identification around 90%(Supplementary Results).
In sum, NREM spectra differ considerably both acrossindividuals and within individuals for N2 and N3, including
variation in sigma peak frequencies. Nonetheless, spectraldifferences are highly stable across nights, suggesting theexistence of similarly trait-like sigma peak frequencies.We return to this issue in more detail in the followingsections.
Frontiers in Human Neuroscience | www.frontiersin.org 7 September 2017 | Volume 11 | Article 433
Cox et al. Individual Differences of Slow and Fast Spindles
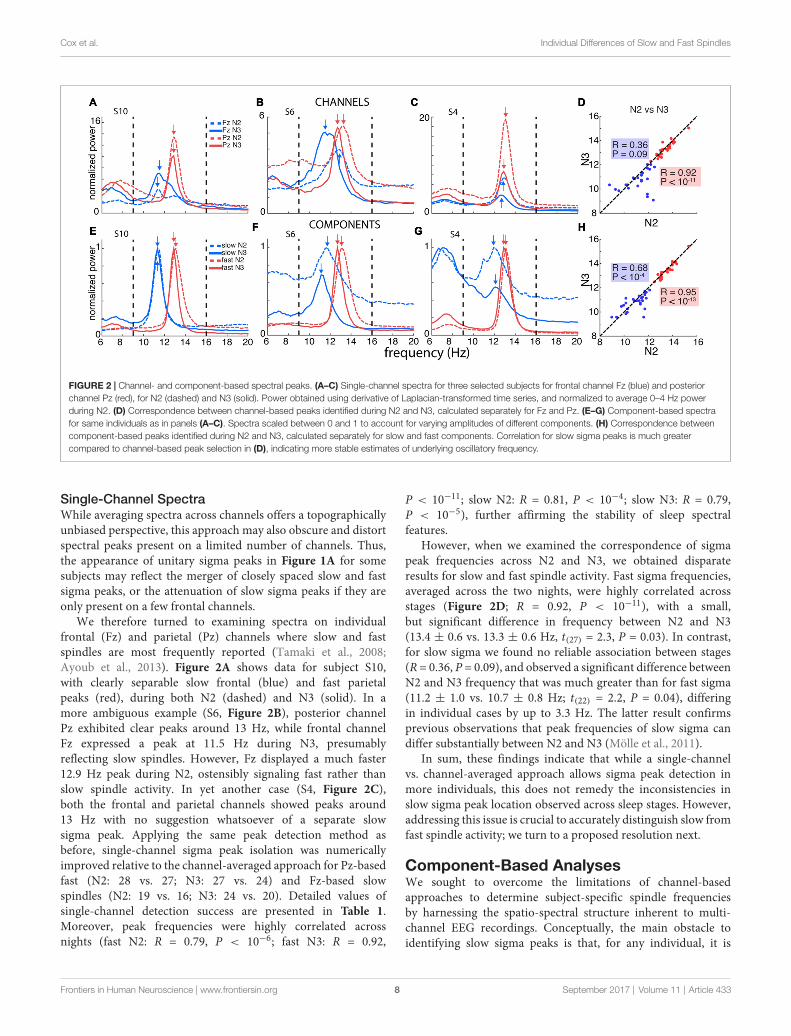
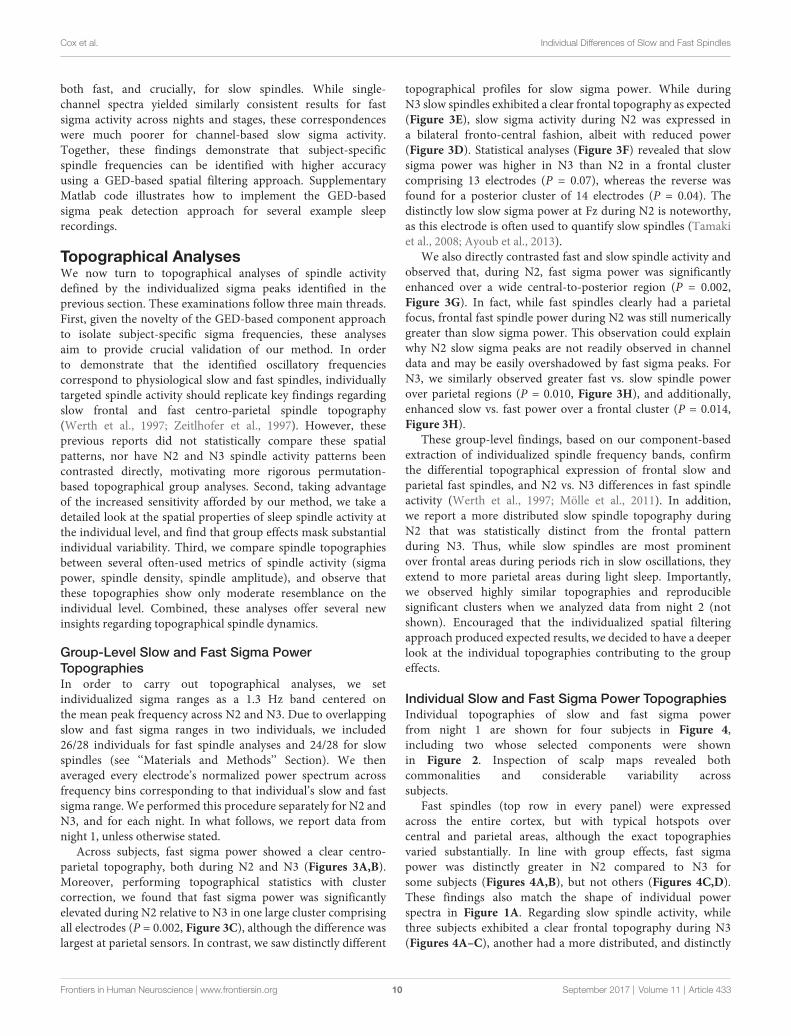
FIGURE 2 | Channel- and component-based spectral peaks. (A–C) Single-channel spectra for three selected subjects for frontal channel Fz (blue) and posteriorchannel Pz (red), for N2 (dashed) and N3 (solid). Power obtained using derivative of Laplacian-transformed time series, and normalized to average 0–4 Hz powerduring N2. (D) Correspondence between channel-based peaks identified during N2 and N3, calculated separately for Fz and Pz. (E–G) Component-based spectrafor same individuals as in panels (A–C). Spectra scaled between 0 and 1 to account for varying amplitudes of different components. (H) Correspondence betweencomponent-based peaks identified during N2 and N3, calculated separately for slow and fast components. Correlation for slow sigma peaks is much greatercompared to channel-based peak selection in (D), indicating more stable estimates of underlying oscillatory frequency.
Single-Channel SpectraWhile averaging spectra across channels offers a topographicallyunbiased perspective, this approach may also obscure and distortspectral peaks present on a limited number of channels. Thus,the appearance of unitary sigma peaks in Figure 1A for somesubjects may reflect the merger of closely spaced slow and fastsigma peaks, or the attenuation of slow sigma peaks if they areonly present on a few frontal channels.
We therefore turned to examining spectra on individualfrontal (Fz) and parietal (Pz) channels where slow and fastspindles are most frequently reported (Tamaki et al., 2008;Ayoub et al., 2013). Figure 2A shows data for subject S10,with clearly separable slow frontal (blue) and fast parietalpeaks (red), during both N2 (dashed) and N3 (solid). In amore ambiguous example (S6, Figure 2B), posterior channelPz exhibited clear peaks around 13 Hz, while frontal channelFz expressed a peak at 11.5 Hz during N3, presumablyreflecting slow spindles. However, Fz displayed a much faster12.9 Hz peak during N2, ostensibly signaling fast rather thanslow spindle activity. In yet another case (S4, Figure 2C),both the frontal and parietal channels showed peaks around13 Hz with no suggestion whatsoever of a separate slowsigma peak. Applying the same peak detection method asbefore, single-channel sigma peak isolation was numericallyimproved relative to the channel-averaged approach for Pz-basedfast (N2: 28 vs. 27; N3: 27 vs. 24) and Fz-based slowspindles (N2: 19 vs. 16; N3: 24 vs. 20). Detailed values ofsingle-channel detection success are presented in Table 1.Moreover, peak frequencies were highly correlated acrossnights (fast N2: R = 0.79, P < 10−6; fast N3: R = 0.92,
P < 10−11; slow N2: R = 0.81, P < 10−4; slow N3: R = 0.79,P < 10−5), further affirming the stability of sleep spectralfeatures.
However, when we examined the correspondence of sigmapeak frequencies across N2 and N3, we obtained disparateresults for slow and fast spindle activity. Fast sigma frequencies,averaged across the two nights, were highly correlated acrossstages (Figure 2D; R = 0.92, P < 10−11), with a small,but significant difference in frequency between N2 and N3(13.4 ± 0.6 vs. 13.3 ± 0.6 Hz, t(27) = 2.3, P = 0.03). In contrast,for slow sigma we found no reliable association between stages(R = 0.36, P = 0.09), and observed a significant difference betweenN2 and N3 frequency that was much greater than for fast sigma(11.2 ± 1.0 vs. 10.7 ± 0.8 Hz; t(22) = 2.2, P = 0.04), differingin individual cases by up to 3.3 Hz. The latter result confirmsprevious observations that peak frequencies of slow sigma candiffer substantially between N2 and N3 (Mölle et al., 2011).
In sum, these findings indicate that while a single-channelvs. channel-averaged approach allows sigma peak detection inmore individuals, this does not remedy the inconsistencies inslow sigma peak location observed across sleep stages. However,addressing this issue is crucial to accurately distinguish slow fromfast spindle activity; we turn to a proposed resolution next.
Component-Based AnalysesWe sought to overcome the limitations of channel-basedapproaches to determine subject-specific spindle frequenciesby harnessing the spatio-spectral structure inherent to multi-channel EEG recordings. Conceptually, the main obstacle toidentifying slow sigma peaks is that, for any individual, it is
Frontiers in Human Neuroscience | www.frontiersin.org 8 September 2017 | Volume 11 | Article 433
Cox et al. Individual Differences of Slow and Fast Spindles
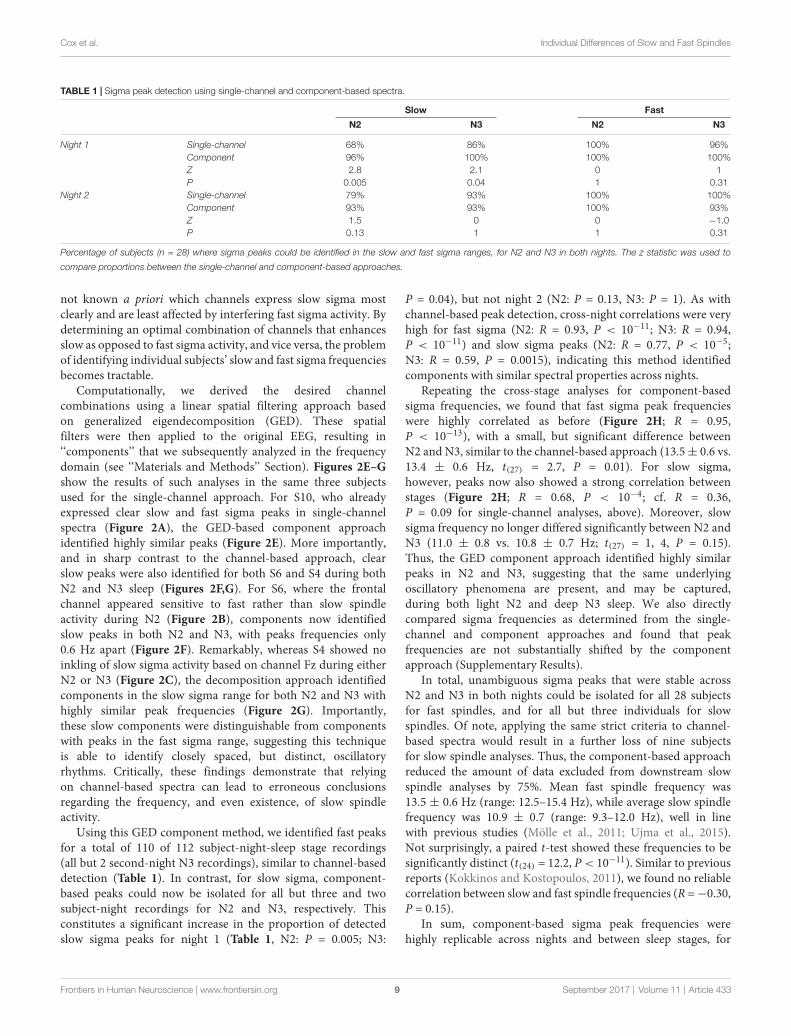
TABLE 1 | Sigma peak detection using single-channel and component-based spectra.
Slow Fast
N2 N3 N2 N3
Night 1 Single-channel 68% 86% 100% 96%Component 96% 100% 100% 100%Z 2.8 2.1 0 1P 0.005 0.04 1 0.31
Night 2 Single-channel 79% 93% 100% 100%Component 93% 93% 100% 93%Z 1.5 0 0 −1.0P 0.13 1 1 0.31
Percentage of subjects (n = 28) where sigma peaks could be identified in the slow and fast sigma ranges, for N2 and N3 in both nights. The z statistic was used to
compare proportions between the single-channel and component-based approaches.
not known a priori which channels express slow sigma mostclearly and are least affected by interfering fast sigma activity. Bydetermining an optimal combination of channels that enhancesslow as opposed to fast sigma activity, and vice versa, the problemof identifying individual subjects’ slow and fast sigma frequenciesbecomes tractable.
Computationally, we derived the desired channelcombinations using a linear spatial filtering approach basedon generalized eigendecomposition (GED). These spatialfilters were then applied to the original EEG, resulting in‘‘components’’ that we subsequently analyzed in the frequencydomain (see ‘‘Materials and Methods’’ Section). Figures 2E–Gshow the results of such analyses in the same three subjectsused for the single-channel approach. For S10, who alreadyexpressed clear slow and fast sigma peaks in single-channelspectra (Figure 2A), the GED-based component approachidentified highly similar peaks (Figure 2E). More importantly,and in sharp contrast to the channel-based approach, clearslow peaks were also identified for both S6 and S4 during bothN2 and N3 sleep (Figures 2F,G). For S6, where the frontalchannel appeared sensitive to fast rather than slow spindleactivity during N2 (Figure 2B), components now identifiedslow peaks in both N2 and N3, with peaks frequencies only0.6 Hz apart (Figure 2F). Remarkably, whereas S4 showed noinkling of slow sigma activity based on channel Fz during eitherN2 or N3 (Figure 2C), the decomposition approach identifiedcomponents in the slow sigma range for both N2 and N3 withhighly similar peak frequencies (Figure 2G). Importantly,these slow components were distinguishable from componentswith peaks in the fast sigma range, suggesting this techniqueis able to identify closely spaced, but distinct, oscillatoryrhythms. Critically, these findings demonstrate that relyingon channel-based spectra can lead to erroneous conclusionsregarding the frequency, and even existence, of slow spindleactivity.
Using this GED component method, we identified fast peaksfor a total of 110 of 112 subject-night-sleep stage recordings(all but 2 second-night N3 recordings), similar to channel-baseddetection (Table 1). In contrast, for slow sigma, component-based peaks could now be isolated for all but three and twosubject-night recordings for N2 and N3, respectively. Thisconstitutes a significant increase in the proportion of detectedslow sigma peaks for night 1 (Table 1, N2: P = 0.005; N3:
P = 0.04), but not night 2 (N2: P = 0.13, N3: P = 1). As withchannel-based peak detection, cross-night correlations were veryhigh for fast sigma (N2: R = 0.93, P < 10−11; N3: R = 0.94,P < 10−11) and slow sigma peaks (N2: R = 0.77, P < 10−5;N3: R = 0.59, P = 0.0015), indicating this method identifiedcomponents with similar spectral properties across nights.
Repeating the cross-stage analyses for component-basedsigma frequencies, we found that fast sigma peak frequencieswere highly correlated as before (Figure 2H; R = 0.95,P < 10−13), with a small, but significant difference betweenN2 and N3, similar to the channel-based approach (13.5± 0.6 vs.13.4 ± 0.6 Hz, t(27) = 2.7, P = 0.01). For slow sigma,however, peaks now also showed a strong correlation betweenstages (Figure 2H; R = 0.68, P < 10−4; cf. R = 0.36,P = 0.09 for single-channel analyses, above). Moreover, slowsigma frequency no longer differed significantly between N2 andN3 (11.0 ± 0.8 vs. 10.8 ± 0.7 Hz; t(27) = 1, 4, P = 0.15).Thus, the GED component approach identified highly similarpeaks in N2 and N3, suggesting that the same underlyingoscillatory phenomena are present, and may be captured,during both light N2 and deep N3 sleep. We also directlycompared sigma frequencies as determined from the single-channel and component approaches and found that peakfrequencies are not substantially shifted by the componentapproach (Supplementary Results).
In total, unambiguous sigma peaks that were stable acrossN2 and N3 in both nights could be isolated for all 28 subjectsfor fast spindles, and for all but three individuals for slowspindles. Of note, applying the same strict criteria to channel-based spectra would result in a further loss of nine subjectsfor slow spindle analyses. Thus, the component-based approachreduced the amount of data excluded from downstream slowspindle analyses by 75%. Mean fast spindle frequency was13.5 ± 0.6 Hz (range: 12.5–15.4 Hz), while average slow spindlefrequency was 10.9 ± 0.7 (range: 9.3–12.0 Hz), well in linewith previous studies (Mölle et al., 2011; Ujma et al., 2015).Not surprisingly, a paired t-test showed these frequencies to besignificantly distinct (t(24) = 12.2, P < 10−11). Similar to previousreports (Kokkinos and Kostopoulos, 2011), we found no reliablecorrelation between slow and fast spindle frequencies (R =−0.30,P = 0.15).
In sum, component-based sigma peak frequencies werehighly replicable across nights and between sleep stages, for
Frontiers in Human Neuroscience | www.frontiersin.org 9 September 2017 | Volume 11 | Article 433
Cox et al. Individual Differences of Slow and Fast Spindles
both fast, and crucially, for slow spindles. While single-channel spectra yielded similarly consistent results for fastsigma activity across nights and stages, these correspondenceswere much poorer for channel-based slow sigma activity.Together, these findings demonstrate that subject-specificspindle frequencies can be identified with higher accuracyusing a GED-based spatial filtering approach. SupplementaryMatlab code illustrates how to implement the GED-basedsigma peak detection approach for several example sleeprecordings.
Topographical AnalysesWe now turn to topographical analyses of spindle activitydefined by the individualized sigma peaks identified in theprevious section. These examinations follow three main threads.First, given the novelty of the GED-based component approachto isolate subject-specific sigma frequencies, these analysesaim to provide crucial validation of our method. In orderto demonstrate that the identified oscillatory frequenciescorrespond to physiological slow and fast spindles, individuallytargeted spindle activity should replicate key findings regardingslow frontal and fast centro-parietal spindle topography(Werth et al., 1997; Zeitlhofer et al., 1997). However, theseprevious reports did not statistically compare these spatialpatterns, nor have N2 and N3 spindle activity patterns beencontrasted directly, motivating more rigorous permutation-based topographical group analyses. Second, taking advantageof the increased sensitivity afforded by our method, we take adetailed look at the spatial properties of sleep spindle activity atthe individual level, and find that group effects mask substantialindividual variability. Third, we compare spindle topographiesbetween several often-used metrics of spindle activity (sigmapower, spindle density, spindle amplitude), and observe thatthese topographies show only moderate resemblance on theindividual level. Combined, these analyses offer several newinsights regarding topographical spindle dynamics.
Group-Level Slow and Fast Sigma PowerTopographiesIn order to carry out topographical analyses, we setindividualized sigma ranges as a 1.3 Hz band centered onthe mean peak frequency across N2 and N3. Due to overlappingslow and fast sigma ranges in two individuals, we included26/28 individuals for fast spindle analyses and 24/28 for slowspindles (see ‘‘Materials and Methods’’ Section). We thenaveraged every electrode’s normalized power spectrum acrossfrequency bins corresponding to that individual’s slow and fastsigma range. We performed this procedure separately for N2 andN3, and for each night. In what follows, we report data fromnight 1, unless otherwise stated.
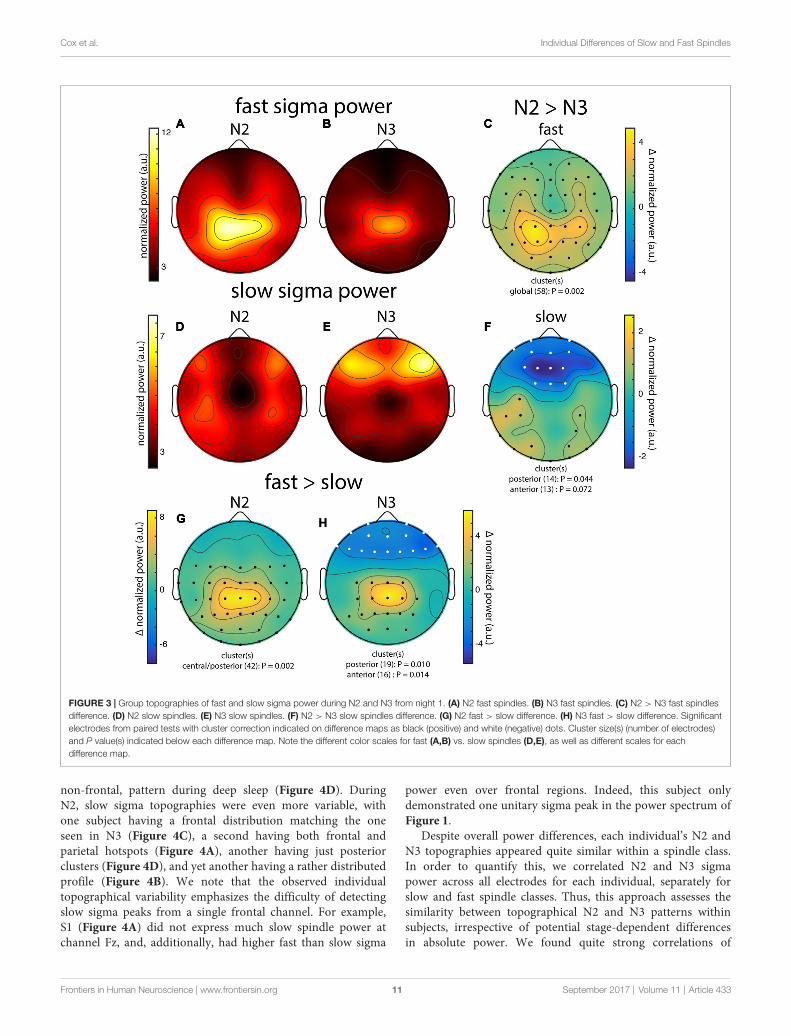
Across subjects, fast sigma power showed a clear centro-parietal topography, both during N2 and N3 (Figures 3A,B).Moreover, performing topographical statistics with clustercorrection, we found that fast sigma power was significantlyelevated during N2 relative to N3 in one large cluster comprisingall electrodes (P = 0.002, Figure 3C), although the difference waslargest at parietal sensors. In contrast, we saw distinctly different
topographical profiles for slow sigma power. While duringN3 slow spindles exhibited a clear frontal topography as expected(Figure 3E), slow sigma activity during N2 was expressed ina bilateral fronto-central fashion, albeit with reduced power(Figure 3D). Statistical analyses (Figure 3F) revealed that slowsigma power was higher in N3 than N2 in a frontal clustercomprising 13 electrodes (P = 0.07), whereas the reverse wasfound for a posterior cluster of 14 electrodes (P = 0.04). Thedistinctly low slow sigma power at Fz during N2 is noteworthy,as this electrode is often used to quantify slow spindles (Tamakiet al., 2008; Ayoub et al., 2013).
We also directly contrasted fast and slow spindle activity andobserved that, during N2, fast sigma power was significantlyenhanced over a wide central-to-posterior region (P = 0.002,Figure 3G). In fact, while fast spindles clearly had a parietalfocus, frontal fast spindle power during N2 was still numericallygreater than slow sigma power. This observation could explainwhy N2 slow sigma peaks are not readily observed in channeldata and may be easily overshadowed by fast sigma peaks. ForN3, we similarly observed greater fast vs. slow spindle powerover parietal regions (P = 0.010, Figure 3H), and additionally,enhanced slow vs. fast power over a frontal cluster (P = 0.014,Figure 3H).
These group-level findings, based on our component-basedextraction of individualized spindle frequency bands, confirmthe differential topographical expression of frontal slow andparietal fast spindles, and N2 vs. N3 differences in fast spindleactivity (Werth et al., 1997; Mölle et al., 2011). In addition,we report a more distributed slow spindle topography duringN2 that was statistically distinct from the frontal patternduring N3. Thus, while slow spindles are most prominentover frontal areas during periods rich in slow oscillations, theyextend to more parietal areas during light sleep. Importantly,we observed highly similar topographies and reproduciblesignificant clusters when we analyzed data from night 2 (notshown). Encouraged that the individualized spatial filteringapproach produced expected results, we decided to have a deeperlook at the individual topographies contributing to the groupeffects.
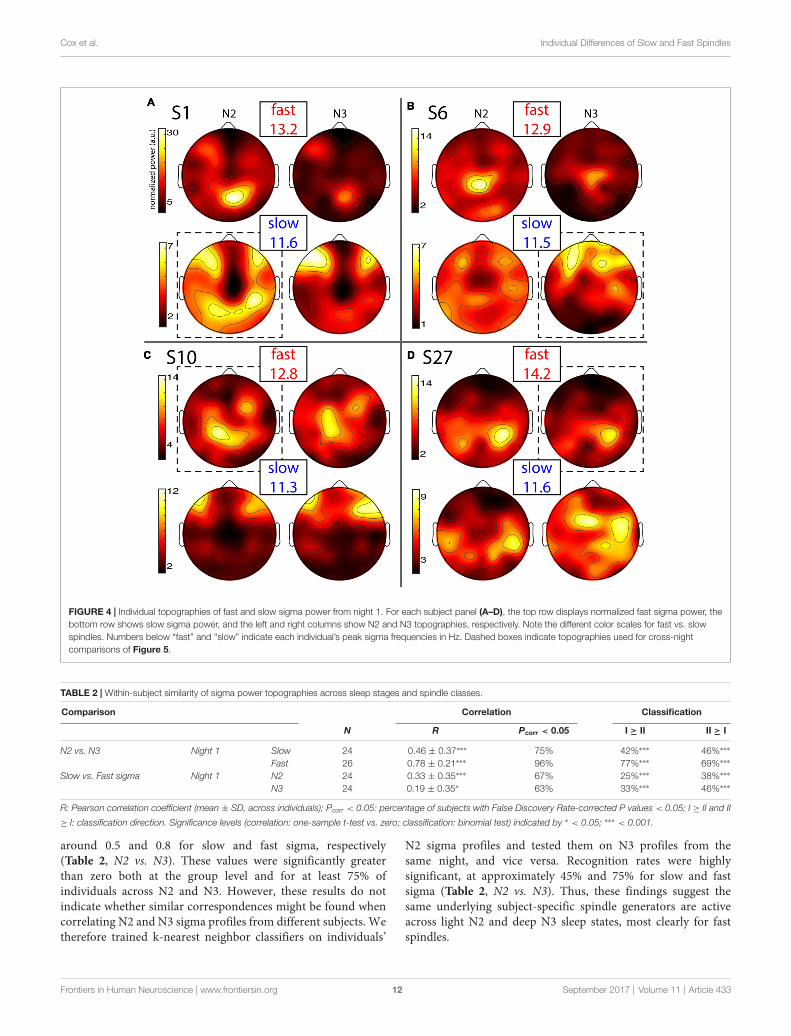
Individual Slow and Fast Sigma Power TopographiesIndividual topographies of slow and fast sigma powerfrom night 1 are shown for four subjects in Figure 4,including two whose selected components were shownin Figure 2. Inspection of scalp maps revealed bothcommonalities and considerable variability acrosssubjects.
Fast spindles (top row in every panel) were expressedacross the entire cortex, but with typical hotspots overcentral and parietal areas, although the exact topographiesvaried substantially. In line with group effects, fast sigmapower was distinctly greater in N2 compared to N3 forsome subjects (Figures 4A,B), but not others (Figures 4C,D).These findings also match the shape of individual powerspectra in Figure 1A. Regarding slow spindle activity, whilethree subjects exhibited a clear frontal topography during N3(Figures 4A–C), another had a more distributed, and distinctly
Frontiers in Human Neuroscience | www.frontiersin.org 10 September 2017 | Volume 11 | Article 433
Cox et al. Individual Differences of Slow and Fast Spindles
FIGURE 3 | Group topographies of fast and slow sigma power during N2 and N3 from night 1. (A) N2 fast spindles. (B) N3 fast spindles. (C) N2 > N3 fast spindlesdifference. (D) N2 slow spindles. (E) N3 slow spindles. (F) N2 > N3 slow spindles difference. (G) N2 fast > slow difference. (H) N3 fast > slow difference. Significantelectrodes from paired tests with cluster correction indicated on difference maps as black (positive) and white (negative) dots. Cluster size(s) (number of electrodes)and P value(s) indicated below each difference map. Note the different color scales for fast (A,B) vs. slow spindles (D,E), as well as different scales for eachdifference map.
non-frontal, pattern during deep sleep (Figure 4D). DuringN2, slow sigma topographies were even more variable, withone subject having a frontal distribution matching the oneseen in N3 (Figure 4C), a second having both frontal andparietal hotspots (Figure 4A), another having just posteriorclusters (Figure 4D), and yet another having a rather distributedprofile (Figure 4B). We note that the observed individualtopographical variability emphasizes the difficulty of detectingslow sigma peaks from a single frontal channel. For example,S1 (Figure 4A) did not express much slow spindle power atchannel Fz, and, additionally, had higher fast than slow sigma
power even over frontal regions. Indeed, this subject onlydemonstrated one unitary sigma peak in the power spectrum ofFigure 1.
Despite overall power differences, each individual’s N2 andN3 topographies appeared quite similar within a spindle class.In order to quantify this, we correlated N2 and N3 sigmapower across all electrodes for each individual, separately forslow and fast spindle classes. Thus, this approach assesses thesimilarity between topographical N2 and N3 patterns withinsubjects, irrespective of potential stage-dependent differencesin absolute power. We found quite strong correlations of
Frontiers in Human Neuroscience | www.frontiersin.org 11 September 2017 | Volume 11 | Article 433
Cox et al. Individual Differences of Slow and Fast Spindles
FIGURE 4 | Individual topographies of fast and slow sigma power from night 1. For each subject panel (A–D), the top row displays normalized fast sigma power, thebottom row shows slow sigma power, and the left and right columns show N2 and N3 topographies, respectively. Note the different color scales for fast vs. slowspindles. Numbers below “fast” and “slow” indicate each individual’s peak sigma frequencies in Hz. Dashed boxes indicate topographies used for cross-nightcomparisons of Figure 5.
TABLE 2 | Within-subject similarity of sigma power topographies across sleep stages and spindle classes.
Comparison Correlation Classification
N R Pcorr < 0.05 I ≥ II II ≥ I
N2 vs. N3 Night 1 Slow 24 0.46 ± 0.37∗∗∗ 75% 42%∗∗∗ 46%∗∗∗
Fast 26 0.78 ± 0.21∗∗∗ 96% 77%∗∗∗ 69%∗∗∗
Slow vs. Fast sigma Night 1 N2 24 0.33 ± 0.35∗∗∗ 67% 25%∗∗∗ 38%∗∗∗
N3 24 0.19 ± 0.35∗ 63% 33%∗∗∗ 46%∗∗∗
R: Pearson correlation coefficient (mean ± SD, across individuals); Pcorr < 0.05: percentage of subjects with False Discovery Rate-corrected P values < 0.05; I ≥ II and II
≥ I: classification direction. Significance levels (correlation: one-sample t-test vs. zero; classification: binomial test) indicated by ∗ < 0.05; ∗∗∗ < 0.001.
around 0.5 and 0.8 for slow and fast sigma, respectively(Table 2, N2 vs. N3). These values were significantly greaterthan zero both at the group level and for at least 75% ofindividuals across N2 and N3. However, these results do notindicate whether similar correspondences might be found whencorrelating N2 and N3 sigma profiles from different subjects. Wetherefore trained k-nearest neighbor classifiers on individuals’
N2 sigma profiles and tested them on N3 profiles from thesame night, and vice versa. Recognition rates were highlysignificant, at approximately 45% and 75% for slow and fastsigma (Table 2, N2 vs. N3). Thus, these findings suggest thesame underlying subject-specific spindle generators are activeacross light N2 and deep N3 sleep states, most clearly for fastspindles.
Frontiers in Human Neuroscience | www.frontiersin.org 12 September 2017 | Volume 11 | Article 433

Cox et al. Individual Differences of Slow and Fast Spindles
FIGURE 5 | Stability of individual differences in sigma power topographiesacross nights. (A) Slow N2 sigma for subject S1. (B) Slow N3 sigma forsubject S6. (C) Fast N2 sigma for subject S10. (D) Fast N3 sigma for subjectS27. To emphasize topographical similarity, color scales were scaled betweenminimum and maximum value for each topography.
As evident from Figure 4, each individual’s slow and fastsigma topographies appeared to correspond poorly. Quantifyingthe degree of similarity between these spatial profiles, we foundthat slow and fast sigma topographies had average correlationcoefficients of 0.3 and 0.2 during N2 and N3, respectively,indicating only limited within-subject correspondence of slowand fast sigma expression across the scalp (Table 2, slowvs. fast sigma). Again, however, these results do not accountfor the baseline similarity of slow and fast sigma profilesfrom different subjects. Using classifiers, we asked if knowing
individuals’ slow sigma profiles would allow us to recognizethem from their fast sigma topography, and vice versa. AcrossN2 and N3, we obtained significantly above chance cross-spindle-type classification rates of around 30% when trainedon slow sigma and tested on fast sigma, and of around 40%when trained on fast sigma and tested on slow (Table 2, slowvs. fast sigma). These findings indicate that, even though anindividual’s spatial profiles of slow and fast sigma expressionare quite distinct (low correlation), they still share a sufficientdegree of commonality to allow differentiation from otherindividuals’ sigma topographies in at least a third of oursubjects. Overall, however, individual slow and fast sigma profileswere much less similar than N2 and N3 topographies of thesame spindle type, suggesting these spindle classes are largelydistinct.
So far, it is unclear whether individual differences intopographical expression of sigma power constitute stable traits,or rather, reflect night-specific differences in brain state thatmay be equally pronounced for the same individual acrossnights. As shown for the examples in Figure 5, however,individual spatial differences were highly stable across nights,for both slow and fast sigma power, and for both N2 andN3. To quantify this effect, we correlated sigma power acrossall electrodes between the two nights for each individual. Wefound substantial evidence for individual topographical stabilityacross nights, with correlation values of around 0.6 for bothslow and fast sigma topographies, and during both N2 and N3(Table 3, sigma power). Note how these cross-night correlationswere much higher than cross-spindle-type correlations withinthe same night. We again turned to classifiers to ask ifindividuals can be recognized across nights based on theirspatial expression of sigma activity. Recognition performancewas significantly above chance for all analyses, but successfulin up to three times as many individuals for N2 than N3, andhigher for slow than fast sigma profiles (Table 3, sigma power).Whereas cross-night N3 fast sigma topographies were onlyslightly more similar within than between individuals, leadingto classification rates around 20%, this difference was muchgreater for N2 slow sigma profiles, yielding recognition accuracyaround 65%. The latter observation is noteworthy given thatslow sigma peaks were most difficult to isolate from channel-based spectra in this sleep stage, indicating that meaningfulslow sigma topographies may be extracted even under taxingcircumstances.
For all preceding and forthcoming classification analyses,it should be mentioned that recognition scores are influencedby both individual stability and between-subject variability.Higher ‘‘baseline’’ topographical similarity between differentindividuals for a particular sleep stage or spindle class couldmake it more difficult to differentiate between individuals,even if within-subject topographies are highly similar. Thus,the classifier approach takes between-subject variability intoaccount, complementing the topographical correlation analysesthat do not.
Together, these subject-specific analyses demonstrate thatindividual patterns of sigma expression are relatively stableacross sleep states, but much less so across slow and fast
Frontiers in Human Neuroscience | www.frontiersin.org 13 September 2017 | Volume 11 | Article 433

Cox et al. Individual Differences of Slow and Fast Spindles
TABLE 3 | Within-subject similarity of topographies across nights.
Comparison Correlation Classification
N R Pcorr < 0.05 I ≥ II II ≥ I
Sigma power Slow N2 24 0.67 ± 0.21∗∗∗ 96% 71%∗∗∗ 58%∗∗∗
N3 24 0.56 ± 0.25∗∗∗ 92% 38%∗∗∗ 46%∗∗∗
Fast N2 26 0.69 ± 0.20∗∗∗ 96% 46%∗∗∗ 54%∗∗∗
N3 26 0.53 ± 0.23∗∗∗ 88% 23%∗∗∗ 15%∗∗
Spindle density Slow N2 24 0.60 ± 0.26∗∗∗ 92% 33%∗∗∗ 46%∗∗∗
N3 24 0.52 ± 0.32∗∗∗ 75% 25%∗∗∗ 46%∗∗∗
Fast N2 26 0.46 ± 0.22∗∗∗ 77% 35%∗∗∗ 23%∗∗∗
N3 26 0.24 ± 0.25 ∗∗∗ 46% 15%∗∗ 19%∗∗∗
Spindle amplitude Slow N2 23 0.64 ± 0.25∗∗∗ 91% 43%∗∗∗ 48%∗∗∗
N3 17 0.57 ± 0.26∗∗∗ 88% 47%∗∗∗ 47%∗∗∗
Fast N2 25 0.59 ± 0.26∗∗∗ 88% 48%∗∗∗ 40%∗∗∗
N3 16 0.53 ± 0.22∗∗∗ 88% 31%∗∗∗ 38%∗∗∗
R: Pearson correlation coefficient; Pcorr < 0.05: percentage of subjects with False Discovery Rate-corrected P values < 0.05; I ≥ II and II ≥ I: classification direction.
Significance levels (correlation: one-sample t-test vs. zero; classification: binomial test) indicated by ∗∗ < 0.01; ∗∗∗ < 0.001. Note: cases where spindles were not detected
on every channel were excluded from spindle amplitude analyses.
sigma bands, providing additional support for the existence oftwo distinct spindle classes. Moreover, individual variability intopographical sigma expression is stable across nights, mostprominently for N2 sleep. As such, individual topographicalvariability of both slow and fast spindles appears to reflectanother individual trait of NREM sleep, similar to the cross-night stability of power spectra (Supplementary Results). In sum,while the previous section demonstrated clear indications ofcanonical slow and fast sigma topographies across subjects, thesegroup effects mask substantial individual variability that must betaken into consideration when analyzing the spatial properties ofspindle activity.
Topographies of Individually Detected Spindlesacross and within SubjectsApotential concern from the previous analyses is that by focusingon sigma power we do not treat spindles as distinct events withdesignated starts and ends. More generally, it is often assumed, atleast implicitly, that sigma power and properties of individuallydetected spindles (e.g., spindle density, spindle amplitude)capture largely similar aspects of underlying spindle activity.However, as we are unaware of studies directly comparing thesemetrics, we next turn to examinations of group-level and subject-specific topographies of discrete spindle properties, and relatethese to the sigma power patterns described in the previoussections.
We used an automated spindle detector (Cox et al., 2012,2014a) to isolate individual sleep spindles using the subject-specific frequencies identified earlier. Briefly, the algorithmfilters Laplacian-transformed channel data in the individualizedsigma range of interest, and applies upper and lower thresholdsbased on characteristics of the N2 sigma envelope (see‘‘Materials and Methods’’ Section). Of note, this thresholdapproach dynamically adapts to the level of sigma signalpresent at each channel, thus contrasting with the sigmapower approach that expressly does not account for suchdifferences. Moreover, by running the algorithm twice, targetingslow and fast sigma ranges separately, different thresholds are
applied for slow and fast spindle detection, aiding in isolatingdifferent-amplitude spindles. For example, upper thresholdswere significantly higher across subjects for slow vs. fast spindledetection on channel Fz (0.20 ± 0.06 vs. 0.18 ± 0.07 µV/cm2,t(27) = 3.6, P = 0.001), but this relation was reversed onchannel Pz (0.17 ± 0.07 vs. 0.21 ± 0.10 µV/cm2; t(27) = −2.4,P = 0.02). After detecting spindle events in this manner, wecalculated spindle density (number per minute) and meanspindle peak amplitude for each channel and individual,separately for N2 and N3, and separately for slow and fastspindles.
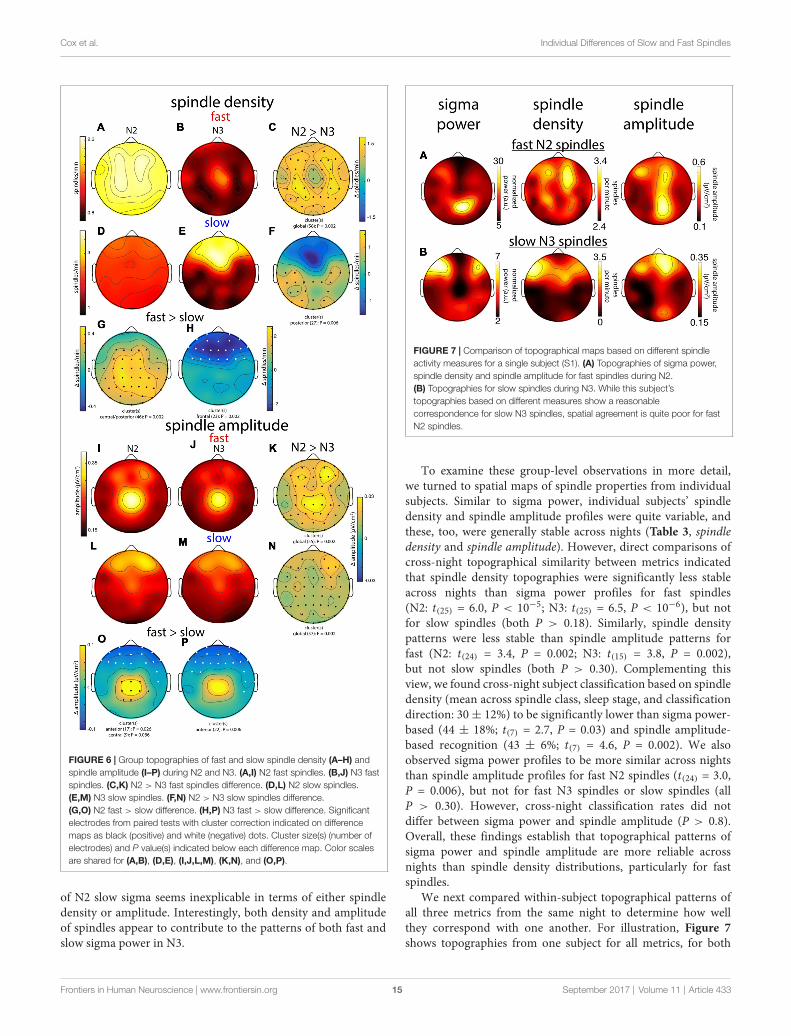
In general, group topographies of spindle density andpeak spindle amplitude were consistent with sigma powerprofiles presented in Figure 3. Compared to sigma power,spindle density profiles generally had a more diffuse appearance(Figures 6A,B,D,E), but topographical statistics indicated N2 vs.N3 differences for both fast (Figure 6C) and slow spindles(Figure 6F) similar to those seen for sigma power. Similarly, slowvs. fast spindle density topographies matched those observedfor sigma power (Figures 6G,H; noting that different thresholdswere applied for detecting these two spindle types). Spindleamplitude topographies also looked similar to sigma powerpatterns, albeit with a more focal appearance (Figures 6I,J,L,M).Similar to the other metrics, fast spindle amplitude wasgreater in N2 than N3 (Figure 6K). In addition, slow spindleswere also of significantly higher amplitude in N2 vs. N3(Figure 6N), including frontal regions where values weresubstantially lower in N2 for sigma power (significantly) andspindle density (numerically). Finally, fast and slow spindleamplitude topographies differed significantly as the other metricsdid (Figures 6O,P).
Combined, these group-level topographies provide someinsights regarding which aspects of spindle activity contributeto observed sigma power. In particular, the N2 fast sigmapower peak over centro-parietal regions (Figure 3) appears tobe predominantly driven by enhanced spindle amplitude in thisregion, but not by spindle density, which was quite uniformacross the scalp. In contrast, the bilateral fronto-central profile
Frontiers in Human Neuroscience | www.frontiersin.org 14 September 2017 | Volume 11 | Article 433
Cox et al. Individual Differences of Slow and Fast Spindles
FIGURE 6 | Group topographies of fast and slow spindle density (A–H) andspindle amplitude (I–P) during N2 and N3. (A,I) N2 fast spindles. (B,J) N3 fastspindles. (C,K) N2 > N3 fast spindles difference. (D,L) N2 slow spindles.(E,M) N3 slow spindles. (F,N) N2 > N3 slow spindles difference.(G,O) N2 fast > slow difference. (H,P) N3 fast > slow difference. Significantelectrodes from paired tests with cluster correction indicated on differencemaps as black (positive) and white (negative) dots. Cluster size(s) (number ofelectrodes) and P value(s) indicated below each difference map. Color scalesare shared for (A,B), (D,E), (I,J,L,M), (K,N), and (O,P).
of N2 slow sigma seems inexplicable in terms of either spindledensity or amplitude. Interestingly, both density and amplitudeof spindles appear to contribute to the patterns of both fast andslow sigma power in N3.
FIGURE 7 | Comparison of topographical maps based on different spindleactivity measures for a single subject (S1). (A) Topographies of sigma power,spindle density and spindle amplitude for fast spindles during N2.(B) Topographies for slow spindles during N3. While this subject’stopographies based on different measures show a reasonablecorrespondence for slow N3 spindles, spatial agreement is quite poor for fastN2 spindles.
To examine these group-level observations in more detail,we turned to spatial maps of spindle properties from individualsubjects. Similar to sigma power, individual subjects’ spindledensity and spindle amplitude profiles were quite variable, andthese, too, were generally stable across nights (Table 3, spindledensity and spindle amplitude). However, direct comparisons ofcross-night topographical similarity between metrics indicatedthat spindle density topographies were significantly less stableacross nights than sigma power profiles for fast spindles(N2: t(25) = 6.0, P < 10−5; N3: t(25) = 6.5, P < 10−6), but notfor slow spindles (both P > 0.18). Similarly, spindle densitypatterns were less stable than spindle amplitude patterns forfast (N2: t(24) = 3.4, P = 0.002; N3: t(15) = 3.8, P = 0.002),but not slow spindles (both P > 0.30). Complementing thisview, we found cross-night subject classification based on spindledensity (mean across spindle class, sleep stage, and classificationdirection: 30± 12%) to be significantly lower than sigma power-based (44 ± 18%; t(7) = 2.7, P = 0.03) and spindle amplitude-based recognition (43 ± 6%; t(7) = 4.6, P = 0.002). We alsoobserved sigma power profiles to be more similar across nightsthan spindle amplitude profiles for fast N2 spindles (t(24) = 3.0,P = 0.006), but not for fast N3 spindles or slow spindles (allP > 0.30). However, cross-night classification rates did notdiffer between sigma power and spindle amplitude (P > 0.8).Overall, these findings establish that topographical patterns ofsigma power and spindle amplitude are more reliable acrossnights than spindle density distributions, particularly for fastspindles.
We next compared within-subject topographical patterns ofall three metrics from the same night to determine how wellthey correspond with one another. For illustration, Figure 7shows topographies from one subject for all metrics, for both
Frontiers in Human Neuroscience | www.frontiersin.org 15 September 2017 | Volume 11 | Article 433

Cox et al. Individual Differences of Slow and Fast Spindles
TABLE 4 | Within-subject similarity of topographies based on different measures of spindle activity.
Comparison Correlation Classification
N R Pcorr < 0.05 I ≥ II II ≥ I
Sigma power vs. Spindle density Slow N2 24 0.17 ± 0.38∗ 46% 17%∗∗ 13%∗
N3 24 0.62 ± 0.23∗∗∗ 88% 58%∗∗∗ 75%∗∗∗
Fast N2 26 0.24 ± 0.26∗∗∗ 42% 19%∗∗∗ 27%∗∗∗
N3 26 0.41 ± 0.23∗∗∗ 73% 54%∗∗∗ 50%∗∗∗
Sigma power vs. Spindle amplitude Slow N2 24 0.16 ± 0.32∗ 38% 21%∗∗∗ 17%∗∗
N3 24 0.46 ± 0.26∗∗∗ 71% 13%∗ 21%∗∗∗
Fast N2 19 0.44 ± 0.23∗∗∗ 77% 42%∗∗∗ 31%∗∗∗
N3 18 0.56 ± 0.22∗∗∗ 54% 35%∗∗∗ 35%∗∗∗
Spindle density vs. Spindle amplitude Slow N2 24 0.38 ± 0.37∗∗∗ 71% 25%∗∗∗ 13%∗
N3 19 0.42 ± 0.36∗∗∗ 63% 21%∗∗∗ 29%∗∗∗
Fast N2 26 0.47 ± 0.20∗∗∗ 84% 42%∗∗∗ 35%∗∗∗
N3 18 0.27 ± 0.25∗∗∗ 38% 15%∗∗ 19%∗∗∗
R: Pearson correlation coefficient; Pcorr < 0.05: percentage of subjects with False Discovery Rate-corrected P values < 0.05; I ≥ II and II ≥ I: classification direction.
Significance levels (correlation: one-sample t-test vs. zero; classification: binomial test) indicated by ∗ < 0.05; ∗∗ < 0.01; ∗∗∗ < 0.001. Note: cases where spindles were
not detected on every channel were excluded from spindle amplitude analyses.
fast N2 spindles (Figure 7A) and slow N3 spindles (Figure 7B).In line with the group maps, this subject’s N2 fast sigmapower distribution appears to be more strongly driven byspindle amplitude, and to a lesser extent, if at all, by spindledensity (Figure 7A). In contrast, the slow N3 power topographyappears similarly related to spindle amplitude and spindle densityprofiles (Figure 7B). These observations suggest that amplitudeand prevalence of spindles may contribute to observed sigmapower in different ways depending on spindle class and sleepstage.
To quantify these visual observations, we directly comparedtopographical patterns between each pair of these three metricswithin individuals. Detailed values and statistics can be found inTable 4. Overall, within-subject spatial maps based on differentmetrics showed moderate correspondence, although resultsdepended importantly on sleep stage, spindle class, and whichmetrics were being compared. Confirming the observations fromFigures 3, 5, 7, fast sigma power topographies were more closelyrelated to spindle amplitude than spindle density for both N2(t(25) = 3.3, P = 0.003) and N3 (t(17) = 2.9, P = 0.01). In contrast,slow sigma power topographies were equally poorly related tospindle amplitude and density during N2 (t(23) =−0.1, P = 0.95),but more similar to spindle density than spindle amplitudetopographies during N3 (t(18) = −2.0, P = 0.06). In terms ofsubject discriminability, cross-metric subject recognition ratestypically did not exceed 40%, except for N3 sigma power vs.spindle density topographies. To place these findings in context,we achieved higher recognition performance for the majority ofcross-sleep stage and cross-night comparisons based on the samesigma power metric (Tables 2, 3, Figures 4, 5), than we did forcross-metric comparisons within the same night and sleep stage.
Overall, these spindle metric comparisons lead to fourconclusions. First, sigma power and spindle amplitude maps aremore stable across nights than spindle density profiles. Second,spindle amplitude and spindle density contribute differentlyto sigma power, depending on sleep stage and spindle classunder consideration. Third, topographical maps based ondifferent metrics are generally quite distinct even for the same
individual. This somewhat unexpected finding suggests that thechoice of spindle metric could have important downstreamramifications regarding topographical group maps, statistics,and interpretations. Finally, these findings again show thatgroup-level maps obscure substantial individual topographicalvariability of spindle expression.
DISCUSSION
The current study characterized the large between-subjectvariability of spindle frequencies and topographies, and assessedthe correspondence of spatial spindle expression between slowand fast spindle classes, sleep stages, nights, and severalmetrics of spindle activity. Employing a novel spatial filteringapproach to isolate subject-specific frequencies of slow and fastspindle activity, we replicated topographical properties of spindleexpression at the group-level (Werth et al., 1997; Zeitlhofer etal., 1997), strongly suggesting that we successfully isolated theoscillatory phenomena of interest. By then taking a more detailedlook at topographical aspects of these oscillatory dynamics,and, furthermore, by extending the subject-specific approachfrom the spectral to the spatial dimension, we made severalnovel observations about the organization of NREM spindledynamics.
Individual Differences in NREM Spectraand Sigma FrequenciesWe observed marked individual differences in the shapeof NREM power spectra (Figure 1). Analyses across nightsconfirmed several previous studies demonstrating the existenceof robust spectral power fingerprints during sleep (De Gennaroet al., 2005; Lewandowski et al., 2013). Indeed, these profiles havebeen shown to be the highly heritable (De Gennaro et al., 2008)and remain stable throughout development (Tarokh et al., 2011).In sharp contrast, we observed that N2 and N3 spectral profilesfor the same individual show considerable differences within thesame night. While spectral differences between N2 and N3 areinevitable given that these stages are defined by the amount of
Frontiers in Human Neuroscience | www.frontiersin.org 16 September 2017 | Volume 11 | Article 433

Cox et al. Individual Differences of Slow and Fast Spindles
slow wave (<4 Hz) activity, it is perhaps surprising that N2 andN3 spectral profiles are so different in higher frequency bands.
Indeed, one of the most prominent differences betweenN2 and N3 spectra appeared in the sigma range, and these sigmadifferences, too, were highly stable across nights (Figures 1A,C).While fast sigma peaks were more pronounced in N2 thanN3 across most individuals, slow sigma peaks did not showconsistent amplitude differences between N2 and N3. Yet, bothindividual sigma peak frequencies and individual topographicalpatterns of sigma power were highly stable across N2 and N3,suggesting that while the broader oscillatory context may changemarkedly from light to deep sleep, underlying thalamic spindlegenerators and their influence on neocortex remain relativelyfixed. Thus, the extent to which N2 and N3 are seen to be similardepends on which physiological aspects one considers.
The most striking observation from the spectral profiles,however, was the large between-subject variability of sigmarange frequencies, and the difficulty this poses for defining slowand fast sigma ranges that can provide adequate group-levelseparation of fast and slow spindles. Component-based slowand fast sigma frequencies ranged from 9.3 Hz to 12.0 Hz forslow spindles and from 12.5 Hz to 15.4 Hz for fast spindles,similar to what has been described previously (De Gennaro et al.,2005; Ujma et al., 2015). For this reason, it seems any attemptto define spindle activity in terms of fixed spectral criteria isdestined to fail in at least some instances. Thus, rather thanarguing in favor of specific spectral definitions for slow and fastspindle classes, we believe this variability provides motivation toidentify slow and fast sigma peaks in a subject-specific manner(Gottselig et al., 2002; Bódizs et al., 2009; Adamczyk et al., 2015;Ujma et al., 2015). However, we demonstrated that both channel-averaged spectra and spectra derived from single frontal andparietal channels are inadequate in this regard, and in manyinstances do not lead to reliable estimates of subject-specificsigma frequencies.
Separating Slow and Fast Sigma Peaks viaSpatial FiltersTo improve upon channel-based approaches, we employed anovel data-driven technique to identify individualized slow andfast sigma peaks. By making use of the fact that multi-channelEEG data has a spectral structure that is typically correlatedbetween nearby channels, we constructed spatial filters thatmaximally enhance spectral content in one frequency range atthe expense of another. When we compared component-derivedspectral peaks to both channel-averaged and single-channelspectra, we found a clear advantage for the spatial filteringapproach. Compared to peaks isolated from individual channels,the component-based approach allowed detection of slow sigmapeaks in approximately three-quarters of the sample that wouldhave otherwise been lost for downstream analyses. Nonetheless,it is important to note that channel- and component-based sigmapeak frequencies were significantly correlated (SupplementaryResults), reflecting the obvious dependence of GED-derivedspindle peaks on individual channel information.
Several channel-based approaches have been proposedto identify subject-specific sigma ranges (Bódizs et al., 2009;
Mölle et al., 2011; Ujma et al., 2015). While we did not directlycompare our technique to these approaches, we see importantbenefits to the GED-based spatial filtering approach. First,because it is data-driven, it makes no a priori assumptionsregarding which channels exhibit slow or fast spindle activity.Indeed, individual topographical maps exhibited substantialvariability in local spindle expression, such that anterior vs.posterior channel selection may not always successfully resolvedistinct peaks (Figure 4D). Second, our approach consistentlyreturned highly similar slow sigma frequencies for N2 andN3. This contrasts with observations of less well-matchedslow sigma peaks in N2 and N3 when using spectra averagedacross groups of channels (Mölle et al., 2011), or single-channel spectra (this study). Likely, this poor correspondenceis due to fast sigma peaks overshadowing slow sigma peaksduring N2 and thereby shifting peak locations, an issue thatthe GED approach inherently tries to avoid by increasingspectral power in one sigma band relative to the other. Severalmethodological considerations regarding the dependence ofthe GED approach on the Laplacian transform, initial filtersettings, and number of required channels, are discussed inthe Supplementary Discussion. Taken together, we suggestour method is a more sensitive technique to robustly identifyindividuals’ fast and especially slow spindle frequencies thanthose previously described. Based on this validation of theGED-based approach, we analyzed the spatial characteristics ofsleep spindles.
Sleep Spindle TopographiesWe analyzed topographical patterns of spindle expression both atthe group and individual level. Group-wise, we observed typicaldifferential topographies of slow and fast spindles, suggestingwe succeeded in separating the two spindle classes. Canonicalslow-frontal vs. fast-central topographies were observed inN3 forall spindle metrics (Figures 3, 6). In N2, we also observed acentral expression of fast spindle activity for sigma power andspindle amplitude, but a less typical fronto-central topographyfor slow sigma power, and a relatively uniform distributionof both slow and fast spindle densities. Direct statisticalcomparisons of slow and fast spindles supported distincttopographies for most sleep stage/spindle class/spindle metriccombinations. We also observed stronger fast spindle activityduring N2 than N3, regardless of metric, consistent with earlierobservations (Werth et al., 1997). In contrast, frontal slow sigmapower and slow spindle density were greater during N3 than N2,consistent with more pronounced slow sigma spectral peaks inN3 than N2. Here, it should be noted that N2 slow spindles havenot been examined in detail previously, likely because channel-based spectra did not unambiguously indicate their presenceduring N2. Thus, the increased sensitivity afforded by targetingsubject-specific spindle frequencies uncovers subtle differencesin sigma power expression during N2 and N3 sleep that mightotherwise be overlooked.
When we examined in detail individual topographicalprofiles of spindle expression, we observed substantial individualdifferences (Figure 4), refining earlier findings (Werth et al.,1997; Zeitlhofer et al., 1997; Finelli et al., 2001). Importantly,
Frontiers in Human Neuroscience | www.frontiersin.org 17 September 2017 | Volume 11 | Article 433
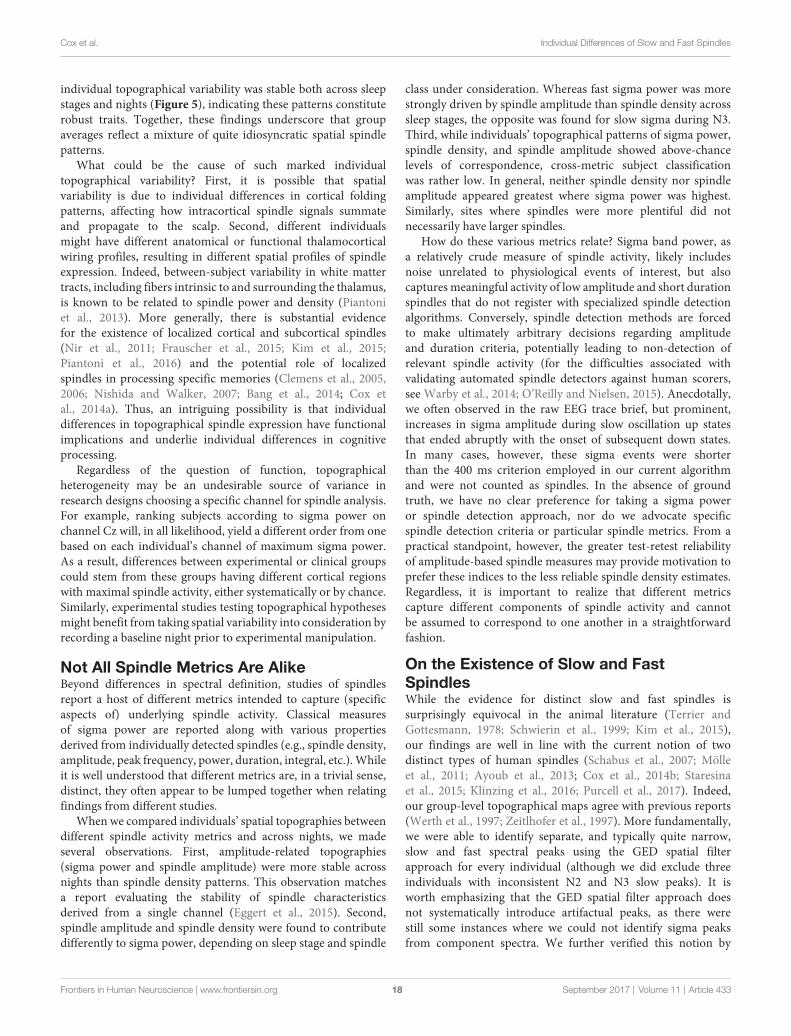
Cox et al. Individual Differences of Slow and Fast Spindles
individual topographical variability was stable both across sleepstages and nights (Figure 5), indicating these patterns constituterobust traits. Together, these findings underscore that groupaverages reflect a mixture of quite idiosyncratic spatial spindlepatterns.
What could be the cause of such marked individualtopographical variability? First, it is possible that spatialvariability is due to individual differences in cortical foldingpatterns, affecting how intracortical spindle signals summateand propagate to the scalp. Second, different individualsmight have different anatomical or functional thalamocorticalwiring profiles, resulting in different spatial profiles of spindleexpression. Indeed, between-subject variability in white mattertracts, including fibers intrinsic to and surrounding the thalamus,is known to be related to spindle power and density (Piantoniet al., 2013). More generally, there is substantial evidencefor the existence of localized cortical and subcortical spindles(Nir et al., 2011; Frauscher et al., 2015; Kim et al., 2015;Piantoni et al., 2016) and the potential role of localizedspindles in processing specific memories (Clemens et al., 2005,2006; Nishida and Walker, 2007; Bang et al., 2014; Cox etal., 2014a). Thus, an intriguing possibility is that individualdifferences in topographical spindle expression have functionalimplications and underlie individual differences in cognitiveprocessing.
Regardless of the question of function, topographicalheterogeneity may be an undesirable source of variance inresearch designs choosing a specific channel for spindle analysis.For example, ranking subjects according to sigma power onchannel Cz will, in all likelihood, yield a different order from onebased on each individual’s channel of maximum sigma power.As a result, differences between experimental or clinical groupscould stem from these groups having different cortical regionswith maximal spindle activity, either systematically or by chance.Similarly, experimental studies testing topographical hypothesesmight benefit from taking spatial variability into consideration byrecording a baseline night prior to experimental manipulation.
Not All Spindle Metrics Are AlikeBeyond differences in spectral definition, studies of spindlesreport a host of different metrics intended to capture (specificaspects of) underlying spindle activity. Classical measuresof sigma power are reported along with various propertiesderived from individually detected spindles (e.g., spindle density,amplitude, peak frequency, power, duration, integral, etc.).Whileit is well understood that different metrics are, in a trivial sense,distinct, they often appear to be lumped together when relatingfindings from different studies.
When we compared individuals’ spatial topographies betweendifferent spindle activity metrics and across nights, we madeseveral observations. First, amplitude-related topographies(sigma power and spindle amplitude) were more stable acrossnights than spindle density patterns. This observation matchesa report evaluating the stability of spindle characteristicsderived from a single channel (Eggert et al., 2015). Second,spindle amplitude and spindle density were found to contributedifferently to sigma power, depending on sleep stage and spindle
class under consideration. Whereas fast sigma power was morestrongly driven by spindle amplitude than spindle density acrosssleep stages, the opposite was found for slow sigma during N3.Third, while individuals’ topographical patterns of sigma power,spindle density, and spindle amplitude showed above-chancelevels of correspondence, cross-metric subject classificationwas rather low. In general, neither spindle density nor spindleamplitude appeared greatest where sigma power was highest.Similarly, sites where spindles were more plentiful did notnecessarily have larger spindles.
How do these various metrics relate? Sigma band power, asa relatively crude measure of spindle activity, likely includesnoise unrelated to physiological events of interest, but alsocaptures meaningful activity of low amplitude and short durationspindles that do not register with specialized spindle detectionalgorithms. Conversely, spindle detection methods are forcedto make ultimately arbitrary decisions regarding amplitudeand duration criteria, potentially leading to non-detection ofrelevant spindle activity (for the difficulties associated withvalidating automated spindle detectors against human scorers,see Warby et al., 2014; O’Reilly and Nielsen, 2015). Anecdotally,we often observed in the raw EEG trace brief, but prominent,increases in sigma amplitude during slow oscillation up statesthat ended abruptly with the onset of subsequent down states.In many cases, however, these sigma events were shorterthan the 400 ms criterion employed in our current algorithmand were not counted as spindles. In the absence of groundtruth, we have no clear preference for taking a sigma poweror spindle detection approach, nor do we advocate specificspindle detection criteria or particular spindle metrics. From apractical standpoint, however, the greater test-retest reliabilityof amplitude-based spindle measures may provide motivation toprefer these indices to the less reliable spindle density estimates.Regardless, it is important to realize that different metricscapture different components of spindle activity and cannotbe assumed to correspond to one another in a straightforwardfashion.
On the Existence of Slow and FastSpindlesWhile the evidence for distinct slow and fast spindles issurprisingly equivocal in the animal literature (Terrier andGottesmann, 1978; Schwierin et al., 1999; Kim et al., 2015),our findings are well in line with the current notion of twodistinct types of human spindles (Schabus et al., 2007; Mölleet al., 2011; Ayoub et al., 2013; Cox et al., 2014b; Staresinaet al., 2015; Klinzing et al., 2016; Purcell et al., 2017). Indeed,our group-level topographical maps agree with previous reports(Werth et al., 1997; Zeitlhofer et al., 1997). More fundamentally,we were able to identify separate, and typically quite narrow,slow and fast spectral peaks using the GED spatial filterapproach for every individual (although we did exclude threeindividuals with inconsistent N2 and N3 slow peaks). It isworth emphasizing that the GED spatial filter approach doesnot systematically introduce artifactual peaks, as there werestill some instances where we could not identify sigma peaksfrom component spectra. We further verified this notion by
Frontiers in Human Neuroscience | www.frontiersin.org 18 September 2017 | Volume 11 | Article 433
Cox et al. Individual Differences of Slow and Fast Spindles
performing control analyses in which we applied GED tocovariance matrices derived from data filtered in the 16–20 Hzand 20–24 Hz ranges. However, the returned componentsgenerally did not contain any peaks at all, or returned a peakthat was absent in all other night-sleep stage combinations. Thiscontrasts markedly with the clear congruence of componentpeak locations between nights and sleep stages in the sigmaband.
Previous studies described the existence of an anterior-posterior gradient of spindle frequency (Peter-Derex et al.,2012; Frauscher et al., 2015), but it is unclear how the distinctspectral peaks found here could have emerged from a morecontinuous distribution of sleep spindle frequencies. Instead,such findings could be equally explained in the framework ofa bimodal distribution of slow and fast spindles. As others(Werth et al., 1997; Zeitlhofer et al., 1997; Klinzing et al., 2016)and we have shown, both slow and fast spindles occur widelyacross the brain, but with more anterior or posterior biases.Thus, averaging over many spindles (or, regarding sigma power,many spectra derived from short data segments) can give riseto a topographical frequency gradient by sampling differentproportions of slow and fast spindles at different cortical sites.This issue could be exacerbated further when observations fromindividuals with different slow and fast spindle frequencies areaggregated.
Similarly, findings of varying spindle frequencies throughoutthe night or within sleep cycles (Werth et al., 1997; Himanenet al., 2002; Andrillon et al., 2011), may be explainedby shifting contributions of slow and fast spindle activityas opposed to the occurrence of progressively slower orfaster spindles. Indeed, while GED-based sigma frequencieswere stable from N2 to N3 (Figure 2B), channel-basedfrequencies were much more variable between sleep stages(Figure 2F), indicating that the same underlying combinationof slow and fast sigma generators can manifest in the powerspectrum as peaks with different locations. While we notethat individual spindles tend to decelerate over their course(Andrillon et al., 2011; O’Reilly and Nielsen, 2014; Zeroualiet al., 2014), we believe that the current evidence, includingour findings, is most consistent with two fundamentallydistinct human spindle classes. How this suggestion, basedon macroscopic and predominantly non-invasive evidence,relates to underlying thalamocortical circuitry is an openquestion.
As the 9–12.5 Hz range overlaps substantially with thecanonical waking alpha (8–12 Hz) band, it may be arguedthat our slow sigma range merely captures wake-like alphaintrusions. However, the observed group-level frontal (N3)and fronto-central (N2) topographies were decidedly differentfrom classical occipital alpha distributions, arguing against thisinterpretation. Previous evidence has also indicated differencesbetween individuals’ waking alpha and slow spindle frequencies(Kokkinos and Kostopoulos, 2011). Finally, we examined phase-amplitude coupling between ∼1 Hz slow oscillations and slowand fast spindles, using the same underlying data and theindividualized sigma frequencies identified here. These analyses,to be reported in a separate article, revealed expected differential
phase preferences of slow and fast spindles, with fast spindlesoccurring preferentially towards the up state, and slow spindlesin the down state (Mölle et al., 2011; Klinzing et al., 2016).Together, these considerations strongly suggest that NREMspectral peaks in the 9–12.5 Hz range do not constitute wake-likealpha activity.
Practical RecommendationsWe offer several suggestions regarding the examination ofsleep spindles measured with EEG. First, we believe the fieldwould benefit from targeting subject-specific frequencies.While it was outside the scope of the current work to directlycompare individualized spectral bands to a fixed frequencyapproach (see Ujma et al., 2015 for a comparison), we hopethe variability showcased in Figure 1 makes the point.Individuals with highest sigma power levels based on fixedspectral criteria are not necessarily the ones with greatestpower when using individually defined sigma frequencies.Fixed frequency criteria could therefore have undesiredeffects, e.g., when assessing the link between spindle activityand memory. As another concern, even small changes insigma range settings can have comparatively large effectson an individual’s topography, as ‘‘true’’ slow and fasttopographies are differentially enhanced, attenuated, andmixed. While we hope our spatial filtering approach will proveuseful in this regard, the precise method employed is lessimportant than adopting an individualized approach in the firstplace.
Second, when subject-specific frequency selection is notfeasible, we suggest fixed criteria be based on visual inspectionof power spectra. In our sample, approximate slow and fastspindle ranges of 9–12.5 Hz and 12.5–16 Hz would likelyhave worked reasonably well. Moreover, based on visualinspection of the distribution of peak frequencies in a sampleof 161 individuals (Ujma et al., 2015; their Figure 2) theseranges appear to be a sensible choice for young, healthyindividuals. However, we caution against blindly followingthis suggestion, as slow and fast sigma peak distributionsmay overlap (Ujma et al., 2015), or may be clustered indifferent spectral bands in different age ranges or clinical groups(Shinomiya et al., 1999). It is also possible that no sensibledemarcation frequency can be found, in which case it may bepreferable to not further differentiate spindles into slow and fastclasses.
Finally, we recommend careful examination of spindledetection criteria used in the literature. Study conclusionsregarding the specific involvement of slow or fast spindlesthat appear at odds may no longer be when one considersin detail the spectral criteria employed. Specifically, wesuggest that studies placing lower bounds for slow spindlesat 11 or 12 Hz may have missed their slow spindle targetin some subjects, and/or confused fast for slow spindles byartificially separating the fast sigma range into two. Ratherthan criticizing these studies, however, we simply wish to alertresearchers and clinicians that seemingly minor methodologicaldetails could have a major impact on the interpretation ofresults.
Frontiers in Human Neuroscience | www.frontiersin.org 19 September 2017 | Volume 11 | Article 433

Cox et al. Individual Differences of Slow and Fast Spindles
CONCLUSION
Despite decades of progress, the functional role of sleep spindlesin general, and of slow and fast spindles in particular, is stillunclear. While some recent evidence suggests fast spindles aremore strongly implicated in cognitive processes (Tamaki et al.,2008, 2009; Barakat et al., 2011; Cox et al., 2014a; Rihm etal., 2014; Fang et al., 2017), only few studies finding suchlinks target the purported brain rhythms in an individualizedmanner (Mölle et al., 2011). But if slow and fast spindlesdo indeed turn out to serve different functions, to serve thesame function differently, or to be differentially affected inneuropsychiatric disorders, it becomes critical that these spindletypes be adequately separated. We hope our approach will proveuseful in this respect, and we suggest that proper understandingof sleep spindle dynamics and their functional role requiresaddressing individual variability as much as accounting forshared organizational principles.
AUTHOR CONTRIBUTIONS
RC, RS and DSM: conceived and designed the experiments.RC: analyzed the data, contributed reagents/materials/analysistools, and prepared figures. RC, ACS, DSM and RS: interpretedresults and contributed to the writing of the manuscript.
FUNDING
This work was supported by grants from The NetherlandsOrganization for Scientific Research (NWO) to RC (446-14-009);National Institutes of Health to ACS (F32-NS093901),RS (MH048832), DSM (K24MH099421), RS and DSM(MH092638); The Harvard Clinical and Translational ScienceCenter (TR001102); and the Stanley Center of the BroadInstitute.
ACKNOWLEDGMENTS
We thank Bengi Baran, Cameron Callahan, David Correll,Charmaine Demanuele, Rachel Fowler, Elaine Parr, Ben Seicoland Tessa Vuper for their data collection and preprocessingefforts, and Mike X Cohen for methodological suggestions.
SUPPLEMENTARY MATERIAL
The Supplementary Material for this article can be foundonline at: http://journal.frontiersin.org/article/10.3389/fnhum.2017.00433/full#supplementary-materialSupplementary code for slow/fast sigma peak separation can befound at https://doi.org/10.6084/m9.figshare.4905677
REFERENCES
Achermann, P., and Borbély, A. A. (1998). Temporal evolution of coherenceand power in the human sleep electroencephalogram. J. Sleep Res. 7, 36–41.doi: 10.1046/j.1365-2869.7.s1.6.x
Adamczyk, M., Genzel, L., Dresler, M., Steiger, A., and Friess, E. (2015). Automaticsleep spindle detection and genetic influence estimation using continuouswavelet transform. Front. Hum. Neurosci. 9:624. doi: 10.3389/fnhum.2015.00624
Andrillon, T., Nir, Y., Staba, R. J., Ferrarelli, F., Cirelli, C., Tononi, G., et al. (2011).Sleep spindles in humans: insights from intracranial EEG and unit recordings.J. Neurosci. 31, 17821–17834. doi: 10.1523/JNEUROSCI.2604-11.2011
Ayoub, A., Aumann, D., Hörschelmann, A., Kouchekmanesch, A., Paul, P.,Born, J., et al. (2013). Differential effects on fast and slow spindle activityand the sleep slow oscillation in humans with carbamazepine and flunarizineto antagonize voltage-dependent Na+ and Ca2+ channel activity. Sleep 36,905–911. doi: 10.5665/sleep.2722
Bang, J. W., Khalilzadeh, O., Hämäläinen, M., Watanabe, T., and Sasaki, Y.(2014). Location specific sleep spindle activity in the early visual areasand perceptual learning. Vision Res. 99, 162–171. doi: 10.1016/j.visres.2013.12.014
Barakat, M., Doyon, J., Debas, K., Vandewalle, G., Morin, A., Poirier, G., etal. (2011). Fast and slow spindle involvement in the consolidation of anew motor sequence. Behav. Brain Res. 217, 117–121. doi: 10.1016/j.bbr.2010.10.019
Benjamini, Y., and Hochberg, Y. (1995). Controlling the false discovery rate:a practical and powerful approach to multiple testing. J. R. Stat. Soc. 57,289–300.
Bódizs, R., Körmendi, J., Rigó, P., and Lázár, A. S. (2009). The individualadjustment method of sleep spindle analysis: methodological improvementsand roots in the fingerprint paradigm. J. Neurosci. Methods 178, 205–213.doi: 10.1016/j.jneumeth.2008.11.006
Bonjean, M., Baker, T., Lemieux, M., Timofeev, I., Sejnowski, T., andBazhenov, M. (2011). Corticothalamic feedback controls sleep spindleduration in vivo. J. Neurosci. 31, 9124–9134. doi: 10.1523/JNEUROSCI.0077-11.2011
Clemens, Z., Fabó, D., and Halász, P. (2005). Overnight verbal memory retentioncorrelates with the number of sleep spindles. Neuroscience 132, 529–535.doi: 10.1016/j.neuroscience.2005.01.011
Clemens, Z., Fabó, D., and Halász, P. (2006). Twenty-four hours retentionof visuospatial memory correlates with the number of parietalsleep spindles. Neurosci. Lett. 403, 52–56. doi: 10.1016/j.neulet.2006.04.035
Cohen, M. X. (2014). Comparison of different spatial transformations applied toEEG data: a case study of error processing. Int. J. Psychophysiol. 97, 245–257.doi: 10.1016/j.ijpsycho.2014.09.013
Cohen, M. X. (2017). Comparison of linear spatial filters for identifying oscillatoryactivity in multichannel data. J. Neurosci. Methods 278, 1–26. doi: 10.1016/j.jneumeth.2016.12.016
Cohen, M. X., and Gulbinaite, R. (2017). Rhythmic entrainment sourceseparation: optimizing analyses of neural responses to rhythmic sensorystimulation. Neuroimage 147, 43–56. doi: 10.1016/j.neuroimage.2016.11.036
Contreras, D., Destexhe, A., Sejnowski, T. J., and Steriade, M. (1997).Spatiotemporal patterns of spindle oscillations in cortex and thalamus.J. Neurosci. 17, 1179–1196.
Cover, T., and Hart, P. (1967). Nearest neighbor pattern classification. IEEE Trans.Inf. Theory 13, 21–27. doi: 10.1109/TIT.1967.1053964
Cox, R., Hofman, W. F., de Boer, M., and Talamini, L. M. (2014a). Local sleepspindle modulations in relation to specific memory cues. Neuroimage 99,103–110. doi: 10.1016/j.neuroimage.2014.05.028
Cox, R., van Driel, J., de Boer, M., and Talamini, L. M. (2014b). Slowoscillations during sleep coordinate interregional communication incortical networks. J. Neurosci. 34, 16890–16901. doi: 10.1523/JNEUROSCI.1953-14.2014
Cox, R., Hofman, W. F., and Talamini, L. M. (2012). Involvement of spindles inmemory consolidation is slow wave sleep-specific. Learn. Mem. 19, 264–267.doi: 10.1101/lm.026252.112
de Cheveigné, A., and Arzounian, D. (2015). Scanning for oscillations. J. NeuralEng. 12:66020. doi: 10.1088/1741-2560/12/6/066020
De Gennaro, L., and Ferrara, M. (2003). Sleep spindles: an overview. Sleep Med.Rev. 7, 423–440. doi: 10.1053/smrv.2002.0252
Frontiers in Human Neuroscience | www.frontiersin.org 20 September 2017 | Volume 11 | Article 433
Cox et al. Individual Differences of Slow and Fast Spindles
De Gennaro, L., Ferrara, M., Vecchio, F., Curcio, G., and Bertini, M. (2005). Anelectroencephalographic fingerprint of human sleep. Neuroimage 26, 114–122.doi: 10.1016/j.neuroimage.2005.01.020
De Gennaro, L., Marzano, C., Fratello, F., Moroni, F., Pellicciari, M. C.,Ferlazzo, F., et al. (2008). The electroencephalographic fingerprint ofsleep is genetically determined: a twin study. Ann. Neurol. 64, 455–460.doi: 10.1002/ana.21434
Delorme, A., and Makeig, S. (2004). EEGLAB: an open source toolbox for analysisof single-trial EEG dynamics including independent component analysis.J. Neurosci. Methods 134, 9–21. doi: 10.1016/j.jneumeth.2003.10.009
Eggert, T., Sauter, C., Dorn, H., Peter, A., Hansen, M.-L., Marasanov, A., et al.(2015). Individual stability of sleep spindle characteristics in healthy youngmales. Somnologie 19, 38–45. doi: 10.1007/s11818-015-0697-x
Fang, Z., Sergeeva, V., Ray, L. B., Viczko, J., Owen, A. M., and Fogel, S. M. (2017).Sleep spindles and intellectual ability: epiphenomenon or directly related?NMRBiomed. 29, 167–182. doi: 10.1162/jocn_a_01034
Ferrarelli, F., Huber, R., Peterson, M., Massimini, M., Murphy, M., Riedner, B.,et al. (2007). Reduced sleep spindle activity in schizophrenia patients. Am.J. Psychiatry 164, 483–492. doi: 10.1176/appi.ajp.164.3.483
Finelli, L. A., Achermann, P., and Borbély, A. A. (2001). Individual ‘fingerprints’in human sleep EEG topography. Neuropsychopharmacology 25, S57–S62.doi: 10.1016/S0893-133X(01)00320-7
First, M. B., Spitzer, R. L., Gibbon, M., and Williams, J. B. W. (2002).Structured Clinical Interview For DSM-IV-TR Axis I Disorders, ResearchVersion, Non-Patient Edition. New York, NY: Biometrics Research, New YorkState Psychiatric Institute.
Frauscher, B., von Ellenrieder, N., Dubeau, F., and Gotman, J. (2015). Scalpspindles are associated with widespread intracranial activity with unexpectedlylow synchrony. Neuroimage 105, 1–12. doi: 10.1016/j.neuroimage.2014.10.048
Gottselig, J. M., Bassetti, C. L., and Achermann, P. (2002). Power and coherenceof sleep spindle frequency activity following hemispheric stroke. Brain 125,373–383. doi: 10.1093/brain/awf021
Himanen, S. L., Virkkala, J., Huhtala, H., and Hasan, J. (2002). Spindle frequenciesin sleep EEG show U-shape within first four NREM sleep episodes. J. Sleep Res.11, 35–42. doi: 10.1046/j.1365-2869.2002.00273.x
Hoedlmoser, K., Heib, D. P. J., Roell, J., Peigneux, P., Sadeh, A., Gruber, G., et al.(2014). Slow sleep spindle activity, declarative memory and general cognitiveabilities in children. Sleep 37, 1501–1513. doi: 10.5665/sleep.4000
Holz, J., Piosczyk, H., Feige, B., Spiegelhalder, K., Baglioni, C., Riemann, D.,et al. (2012). EEG Σ and slow-wave activity during NREM sleep correlate withovernight declarative and procedural memory consolidation. J. Sleep Res. 21,612–619. doi: 10.1111/j.1365-2869.2012.01017.x
Iber, C., Ancoli-Israel, S., Chesson, A., and Quan, S. (2007). The AASM ManualFor the Scoring of Sleep and Associates Events: Rules, Terminology and TechnicalSpecifications.Westchester, IL: American Academy of Sleep Medicine.
Kayser, J., and Tenke, C. E. (2006). Principal components analysis of Laplacianwaveforms as a generic method for identifying ERP generator patterns: I.Evaluation with auditory oddball tasks. Clin. Neurophysiol. 117, 348–368.doi: 10.1016/j.clinph.2005.08.034
Kim, D., Hwang, E., Lee, M., Sung, H., and Choi, J. H. (2015). Characterizationof topographically specific sleep spindles in mice. Sleep 38, 85–96.doi: 10.5665/sleep.4330
Klinzing, J. G., Mölle, M., Weber, F., Supp, G., Hipp, J. F., Engel, A. K., et al.(2016). Spindle activity phase-locked to sleep slow oscillations. Neuroimage134, 607–616. doi: 10.1016/j.neuroimage.2016.04.031
Kokkinos, V., and Kostopoulos, G. K. (2011). Human non-rapid eye movementstage II sleep spindles are blocked upon spontaneous K-complex coincidenceand resume as higher frequency spindles afterwards. J. Sleep Res. 20, 57–72.doi: 10.1111/j.1365-2869.2010.00830.x
Lewandowski, A., Rosipal, R., and Dorffner, G. (2013). On the individualityof sleep EEG spectra. J. Psychophysiol. 27, 105–112. doi: 10.1027/0269-8803/a000092
Lustenberger, C., Boyle, M. R., Alagapan, S., Mellin, J. M., Vaughn, B. V.,and Fröhlich, F. (2016). Feedback-controlled transcranial alternating currentstimulation reveals a functional role of sleep spindles in motor memoryconsolidation. Curr. Biol. 26, 2127–2136. doi: 10.1016/j.cub.2016.06.044
Lüthi, A. (2013). Sleep spindles where they come from, what they do. Neurosci. 20,243–256. doi: 10.1177/1073858413500854
Makeig, S., Jung, T.-P., Bell, A. J., Ghahremani, D., and Sejnowski, T. J. (1997).Blind separation of auditory event-related brain responses into independentcomponents. Proc. Natl. Acad. Sci. U S A 94, 10979–10984. doi: 10.1073/pnas.94.20.10979
Maris, E., andOostenveld, R. (2007). Nonparametric statistical testing of EEG- andMEG-data. J. Neurosci. Methods 164, 177–190. doi: 10.1016/j.jneumeth.2007.03.024
Mednick, S. C., McDevitt, E. A., Walsh, J. K., Wamsley, E., Paulus, M.,Kanady, J. C., et al. (2013). The critical role of sleep spindles inhippocampal-dependent memory: a pharmacology study. J. Neurosci. 33,4494–4504. doi: 10.1523/JNEUROSCI.3127-12.2013
Mölle, M., Bergmann, T. O., Marshall, L., and Born, J. (2011). Fast andslow spindles during the sleep slow oscillation: disparate coalescence andengagement in memory processing. Sleep 34, 1411–1421. doi: 10.5665/SLEEP.1290
Muller, L., Piantoni, G., Koller, D., Cash, S. S., Halgren, E., and Sejnowski, T. J.(2016). Rotating waves during human sleep spindles organize globalpatterns of activity that repeat precisely through the night. Elife 5:e17267.doi: 10.7554/eLife.17267
Nikulin, V. V., Nolte, G., and Curio, G. (2011). A novel method for reliable and fastextraction of neuronal EEG/MEG oscillations on the basis of spatio-spectraldecomposition. Neuroimage 55, 1528–1535. doi: 10.1016/j.neuroimage.2011.01.057
Nir, Y., Staba, R. J., Andrillon, T., Vyazovskiy, V. V., Cirelli, C., Fried, I., et al.(2011). Regional slow waves and spindles in human sleep. Neuron 70, 153–169.doi: 10.1016/j.neuron.2011.02.043
Nishida, M., and Walker, M. P. (2007). Daytime naps, motor memoryconsolidation and regionally specific sleep spindles. PLoS One 2:e341.doi: 10.1371/journal.pone.0000341
O’Reilly, C., Godin, I., Montplaisir, J., andNielsen, T. (2015). REM sleep behaviourdisorder is associated with lower fast and higher slow sleep spindle densities.J. Sleep Res. 24, 593–601. doi: 10.1111/jsr.12309
O’Reilly, C., and Nielsen, T. (2015). Automatic sleep spindle detection:benchmarking with fine temporal resolution using open science tools. Front.Hum. Neurosci. 9:353. doi: 10.3389/fnhum.2015.00353
O’Reilly, C., and Nielsen, T. (2014). Assessing EEG sleep spindle propagation.Part 2: experimental characterization. J. Neurosci. Methods 221, 215–227.doi: 10.1016/j.jneumeth.2013.08.014
Oostenveld, R., Fries, P., Maris, E., and Schoffelen, J. M. (2011). FieldTrip:open source software for advanced analysis of MEG, EEG, andinvasive electrophysiological data. Comput. Intell. Neurosci. 2011:156869.doi: 10.1155/2011/156869
Perrin, F., Pernier, J., Bertrand, O., and Echallier, J. F. (1989). Sphericalsplines for scalp potential and current density mapping. Electroencephalogr.Clin. Neurophysiol. 72, 184–187. doi: 10.1016/0013-4694(89)90180-6
Peter-Derex, L., Comte, J. C., Mauguière, F., and Salin, P. A. (2012). Density andfrequency caudo-rostral gradients of sleep spindles recorded in the humancortex. Sleep 35, 69–79. doi: 10.5665/sleep.1588
Piantoni, G., Halgren, E., and Cash, S. S. (2016). Spatiotemporal characteristicsof sleep spindles depend on cortical location. Neuroimage 146, 236–245.doi: 10.1016/j.neuroimage.2016.11.010
Piantoni, G., Poil, S.-S., Linkenkaer-Hansen, K., Verweij, I. M., Ramautar, J. R.,Van Someren, E. J. W., et al. (2013). Individual differences in whitematter diffusion affect sleep oscillations. J. Neurosci. 33, 227–233.doi: 10.1523/JNEUROSCI.2030-12.2013
Purcell, S. M., Manoach, D. S., Demanuele, C., Cade, B. E., Mariani, S.,Cox, R., et al. (2017). Characterizing sleep spindles in 11,630 individualsfrom the national sleep research resource. Nat. Commun. 8:15930.doi: 10.1038/ncomms15930
Ramanathan, D. S., Gulati, T., and Ganguly, K. (2015). Sleep-dependentreactivation of ensembles in motor cortex promotes skill consolidation. PLoSBiol. 13:e1002263. doi: 10.1371/journal.pbio.1002263
Rasch, B., and Born, J. (2013). About sleep’s role in memory. Physiol. Rev. 93,681–766. doi: 10.1152/physrev.00032.2012
Rihm, J. S., Diekelmann, S., Born, J., and Rasch, B. (2014). Reactivating memoriesduring sleep by odors: odor specificity and associated changes in sleeposcillations. J. Cogn. Neurosci. 26, 1806–1818. doi: 10.1162/jocn_a_00579
Frontiers in Human Neuroscience | www.frontiersin.org 21 September 2017 | Volume 11 | Article 433
Cox et al. Individual Differences of Slow and Fast Spindles
Schabus, M., Dang-Vu, T. T., Albouy, G., Balteau, E., Boly, M., Carrier, J., et al.(2007). Hemodynamic cerebral correlates of sleep spindles during humannon-rapid eye movement sleep. Proc. Natl. Acad. Sci. U S A 104, 13164–13169.doi: 10.1073/pnas.0703084104
Schabus, M., Gruber, G., Parapatics, S., Sauter, C., Klösch, G., Anderer, P.,et al. (2004). Sleep spindles and their significance for declarative memoryconsolidation. Sleep 27, 1479–1485. doi: 10.1093/sleep/27.7.1479
Schwierin, B., Achermann, P., Deboer, T., Oleksenko, A., Borbély, A. A.,and Tobler, I. (1999). Regional differences in the dynamics of the corticalEEG in the rat after sleep deprivation. Clin. Neurophysiol. 110, 869–875.doi: 10.1016/s1388-2457(99)00020-6
Shinomiya, S., Nagata, K., Takahashi, K., and Masumura, T. (1999). Developmentof sleep spindles in young children and adolescents. Clin. Electroencephalogr.30, 39–43. doi: 10.1177/155005949903000203
Sleigh, J. W., Steyn-Ross, D. A., Steyn-Ross, M. L., Williams, M. L., and Smith, P.(2001). Comparison of changes in electroencephalographic measures duringinduction of general anaesthesia: influence of the gamma frequency bandelectromyogram signal. Br. J. Anaesth. 86, 50–58. doi: 10.1093/bja/86.1.50
Souza, R. T. F. D., Gerhardt, G. J. L., Schönwald, S. V., Rybarczyk-Filho, J. L., andLemke, N. (2016). Synchronization and propagation of global sleep spindles.PLoS One 11:e0151369. doi: 10.1371/journal.pone.0151369
Staresina, B. P., Bergmann, T. O., Bonnefond, M., van der Meij, R., Jensen, O.,Deuker, L., et al. (2015). Hierarchical nesting of slow oscillations, spindles andripples in the human hippocampus during sleep. Nat. Neurosci. 18, 1679–1686.doi: 10.1038/nn.4119
Steriade, M., Domich, L., Oakson, G., and Deschenes, M. (1987). The deafferentedreticular thalamic nucleus generates spindle rhythmicity. J. Neurophysiol. 57,260–273.
Tamaki, M., Matsuoka, T., Nittono, H., and Hori, T. (2008). Fast sleepspindle (13–15 hz) activity correlates with sleep-dependent improvement invisuomotor performance. Sleep 31, 204–211. doi: 10.1093/sleep/31.2.204
Tamaki, M., Matsuoka, T., Nittono, H., and Hori, T. (2009). Activation offast sleep spindles at the premotor cortex and parietal areas contributes tomotor learning: a study using sLORETA. Clin. Neurophysiol. 120, 878–886.doi: 10.1016/j.clinph.2009.03.006
Tarokh, L., Carskadon, M. A., and Achermann, P. (2011). Trait-like characteristicsof the sleep EEG across adolescent development. J. Neurosci. 31, 6371–6378.doi: 10.1523/JNEUROSCI.5533-10.2011
Tenke, C. E., and Kayser, J. (2015). Surface Laplacians (SL) and phase propertiesof EEG rhythms: simulated generators in a volume-conduction model. Int.J. Psychophysiol. 97, 285–298. doi: 10.1016/j.ijpsycho.2015.05.008
Terrier, G., and Gottesmann, C. (1978). Study of cortical spindles duringsleep in the rat. Brain Res. Bull. 3, 701–706. doi: 10.1016/0361-9230(78)90021-7
Ujma, P. P., Gombos, F., Genzel, L., Konrad, B. N., Simor, P., Steiger, A., et al.(2015). A comparison of two sleep spindle detectionmethods based on all nightaverages: individually adjusted vs. fixed frequencies. Front. Hum. Neurosci.9:52. doi: 10.3389/fnhum.2015.00052
Walker, M. P., Brakefield, T., Morgan, A., Hobson, J. A., and Stickgold, R. (2002).Practice with sleepmakes perfect: sleep-dependentmotor skill learning.Neuron35, 205–211. doi: 10.1016/S0896-6273(02)00746-8
Wamsley, E. J., Shinn, A. K., Tucker, M. A., Ono, K. E., McKinley, S. K.,Ely, A. V., et al. (2013). The effects of eszopiclone on sleep spindles andmemoryconsolidation in schizophrenia: a randomized placebo-controlled trial. Sleep 36,1369–1376. doi: 10.5665/sleep.2968
Warby, S. C., Wendt, S. L., Welinder, P., Munk, E. G. S., Carrillo, O.,Sorensen, H. B., et al. (2014). Sleep-spindle detection: crowdsourcing andevaluating performance of experts, non-experts and automated methods. Nat.Methods 11, 385–392. doi: 10.1038/nmeth.2855
Werth, E., Achermann, P., Dijk, D. J., and Borbély, A. A. (1997). Spindle frequencyactivity in the sleep EEG: individual differences and topographic distribution.Electroencephalogr. Clin. Neurophysiol. 103, 535–542. doi: 10.1016/s0013-4694(97)00070-9
Zeitlhofer, J., Gruber, G., Anderer, P., Asenbaum, S., Schimicek, P., and Saletu, B.(1997). Topographic distribution of sleep spindles in young healthy subjects.J. Sleep Res. 6, 149–155. doi: 10.1046/j.1365-2869.1997.00046.x
Zerouali, Y., Lina, J.-M., Sekerovic, Z., Godbout, J., Dube, J., Jolicoeur, P., et al.(2014). A time-frequency analysis of the dynamics of cortical networks of sleepspindles fromMEG-EEG recordings. Front. Neurosci. 8:310. doi: 10.3389/fnins.2014.00310
Conflict of Interest Statement: The authors declare that the research wasconducted in the absence of any commercial or financial relationships that couldbe construed as a potential conflict of interest.
Copyright © 2017 Cox, Schapiro, Manoach and Stickgold. This is an open-accessarticle distributed under the terms of the Creative Commons Attribution License(CC BY). The use, distribution or reproduction in other forums is permitted,provided the original author(s) or licensor are credited and that the originalpublication in this journal is cited, in accordance with accepted academic practice.No use, distribution or reproduction is permitted which does not comply with theseterms.
Frontiers in Human Neuroscience | www.frontiersin.org 22 September 2017 | Volume 11 | Article 433