Embed Size (px)
Citation preview
ed-TH / sa- MA
Shrinking Universe
Cut our coal benchmark price forecast to US$55 per ton
Paris climate agreement is negative for thermal coal
Meanwhile, currently natural gas is competitive vs. thermal coal price
Stock price correction is a de-rating process and NOT an opportunity to buy
Cut our coal benchmark price to US$55 per ton. We cut our long-term coal benchmark price to US$55 per ton from US$67 previously. Current low crude oil and gas prices will exert more pressure on coal price and demand, as natural gas, which is more environmentally friendly than coal, is trading at a minor disparity vs. coal for the first time. This is would potentially accelerate energy substitution from coal to gas after the Paris climate deal on Dec 2015, which was participated by 200 countries. Moreover, we also believe the current pollution issue in China coastal area will put environmental issues in the government's top priority via pushing ultra low emission energy mix going forward. This means thermal coal energy mix will continue to drop ahead, and our thesis that thermal coal import peaked in 2014 and will continue to drop ahead remains intact.
Insignificant supply cuts. Amid the coal demand downtrend, we see insignificant supply cuts by major coal miners from both Indonesia and Australia. Indonesia's largest coal miners have indicated that production volume could drop next year. However, the official production target has not been released yet. We cut our FY16 and FY17 thermal coal stocks earnings by 10% and 15% on average respectively, mainly on production cuts as miners will not lower their strip ratios to reduce cash cost at the current coal price level, to preserve their reserves.
No positive catalyst for coal stocks. Stock price tumbled 50% on average last year and we believe it was part of coal stocks' valuation de-rating amid the structural changes in the coal sector and NOT an opportunity to buy coal stocks. Low coal price in the long run also casts uncertainties on miners' long-term earnings, cash flows and coal reserves' economic feasibility. Our top Fully Valued call remain HRUM with lower target price of Rp450 on lower ASP and production volume outlook.
JCI : 4,523.98
Analyst William Simadiputra +62 2130034939 [email protected]
STOCKS
Source: DBS Vickers Tambang Batubara Bukit Asam: Indonesia largest coal miners with 1.99bn ton of coal reserves. Main coal mining concession located in Tanjung Enim, south Sumatera
Adaro Energy: Indonesia second largest coal producer. It also has subsidiaries that operate in the mining contracting, barging and ship loading business
Indo Tambangraya Megah: One of the largest coal mining company Banpu. Coal consession located in Kalimantan, Indonesia
Harum Energy: Ninth largest coal producers in Indonesia combined coal reserves life of 7 years
DBS Group Research . Equity 18 Jan 2016
Indonesia Industry Focus
Thermal Coal Sector
Refer to important disclosures at the end of this report
Price Mkt Cap Target Price Performance (%)
Rp US$m Rp 3 mth 12 mth Rating
Tambang Batubara 4,465 736 5,100 (30.8) (60.1) HOLD Adaro Energy 449 1,027 505 (29.8) (52.5) HOLD Indo Tambangraya 5,425 438 6,100 (46.4) (63.8) HOLD Harum Energy 670 130 450 (25.6) (61.4) FULLY
Industry Focus
Thermal Coal Sector
Page 2
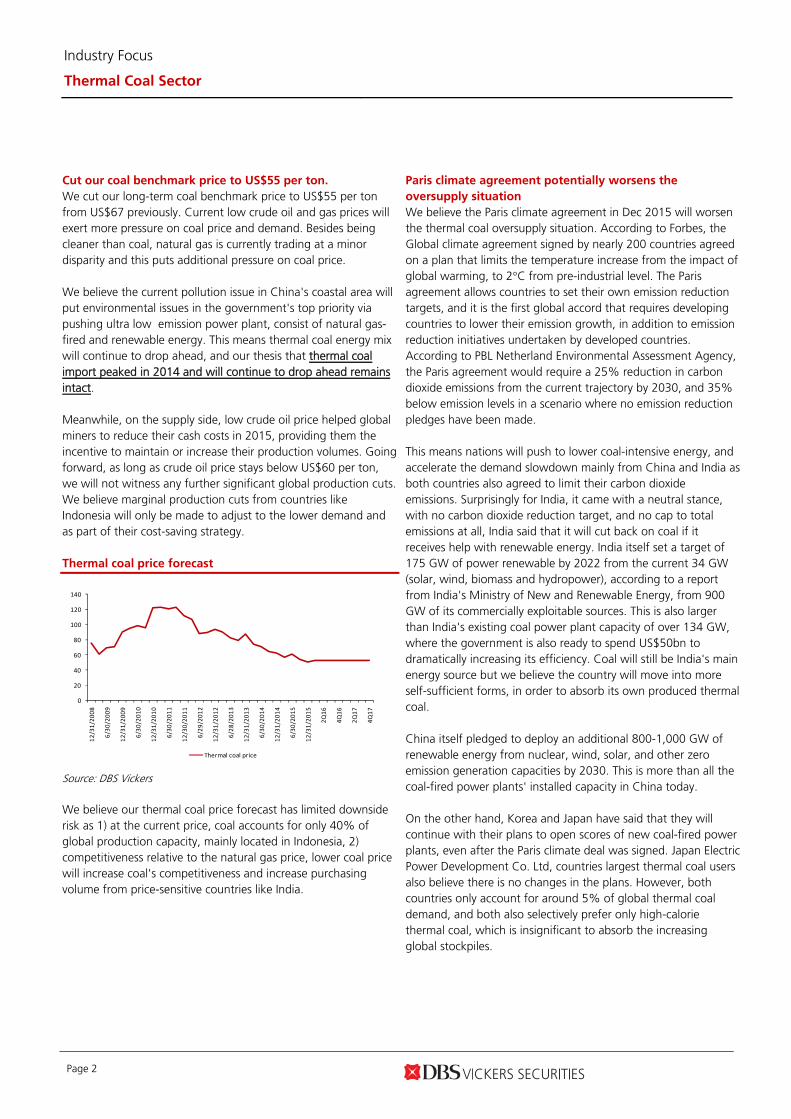
Cut our coal benchmark price to US$55 per ton.
We cut our long-term coal benchmark price to US$55 per ton from US$67 previously. Current low crude oil and gas prices will exert more pressure on coal price and demand. Besides being cleaner than coal, natural gas is currently trading at a minor disparity and this puts additional pressure on coal price. We believe the current pollution issue in China's coastal area will put environmental issues in the government's top priority via pushing ultra low emission power plant, consist of natural gas-fired and renewable energy. This means thermal coal energy mix will continue to drop ahead, and our thesis that thermal coal import peaked in 2014 and will continue to drop ahead remains intact. Meanwhile, on the supply side, low crude oil price helped global miners to reduce their cash costs in 2015, providing them the incentive to maintain or increase their production volumes. Going forward, as long as crude oil price stays below US$60 per ton, we will not witness any further significant global production cuts. We believe marginal production cuts from countries like Indonesia will only be made to adjust to the lower demand and as part of their cost-saving strategy. Thermal coal price forecast
0
20
40
60
80
100
120
140
12/31/2008
6/30/2009
12/31/2009
6/30/2010
12/31/2010
6/30/2011
12/30/2011
6/29/2012
12/31/2012
6/28/2013
12/31/2013
6/30/2014
12/31/2014
6/30/2015
12/31/2015
2Q16
4Q16
2Q17
4Q17
Thermal coal price
Source: DBS Vickers We believe our thermal coal price forecast has limited downside risk as 1) at the current price, coal accounts for only 40% of global production capacity, mainly located in Indonesia, 2) competitiveness relative to the natural gas price, lower coal price will increase coal's competitiveness and increase purchasing volume from price-sensitive countries like India.
Paris climate agreement potentially worsens the
oversupply situation
We believe the Paris climate agreement in Dec 2015 will worsen the thermal coal oversupply situation. According to Forbes, the Global climate agreement signed by nearly 200 countries agreed on a plan that limits the temperature increase from the impact of global warming, to 2°C from pre-industrial level. The Paris agreement allows countries to set their own emission reduction targets, and it is the first global accord that requires developing countries to lower their emission growth, in addition to emission reduction initiatives undertaken by developed countries. According to PBL Netherland Environmental Assessment Agency, the Paris agreement would require a 25% reduction in carbon dioxide emissions from the current trajectory by 2030, and 35% below emission levels in a scenario where no emission reduction pledges have been made. This means nations will push to lower coal-intensive energy, and accelerate the demand slowdown mainly from China and India as both countries also agreed to limit their carbon dioxide emissions. Surprisingly for India, it came with a neutral stance, with no carbon dioxide reduction target, and no cap to total emissions at all, India said that it will cut back on coal if it receives help with renewable energy. India itself set a target of 175 GW of power renewable by 2022 from the current 34 GW (solar, wind, biomass and hydropower), according to a report from India's Ministry of New and Renewable Energy, from 900 GW of its commercially exploitable sources. This is also larger than India's existing coal power plant capacity of over 134 GW, where the government is also ready to spend US$50bn to dramatically increasing its efficiency. Coal will still be India's main energy source but we believe the country will move into more self-sufficient forms, in order to absorb its own produced thermal coal. China itself pledged to deploy an additional 800-1,000 GW of renewable energy from nuclear, wind, solar, and other zero emission generation capacities by 2030. This is more than all the coal-fired power plants' installed capacity in China today. On the other hand, Korea and Japan have said that they will continue with their plans to open scores of new coal-fired power plants, even after the Paris climate deal was signed. Japan Electric Power Development Co. Ltd, countries largest thermal coal users also believe there is no changes in the plans. However, both countries only account for around 5% of global thermal coal demand, and both also selectively prefer only high-calorie thermal coal, which is insignificant to absorb the increasing global stockpiles.
Industry Focus
Thermal Coal Sector
Page 3
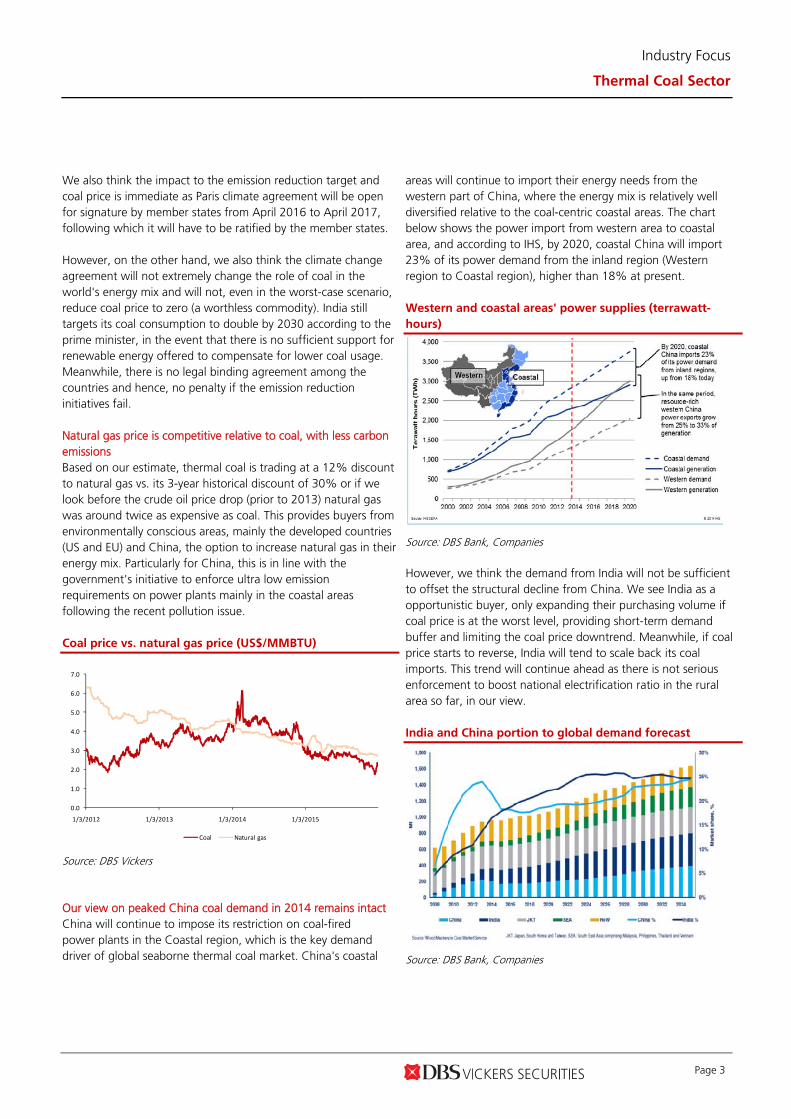
We also think the impact to the emission reduction target and coal price is immediate as Paris climate agreement will be open for signature by member states from April 2016 to April 2017, following which it will have to be ratified by the member states. However, on the other hand, we also think the climate change agreement will not extremely change the role of coal in the world's energy mix and will not, even in the worst-case scenario, reduce coal price to zero (a worthless commodity). India still targets its coal consumption to double by 2030 according to the prime minister, in the event that there is no sufficient support for renewable energy offered to compensate for lower coal usage. Meanwhile, there is no legal binding agreement among the countries and hence, no penalty if the emission reduction initiatives fail. Natural gas price is competitive relative to coal, with less carbon emissions Based on our estimate, thermal coal is trading at a 12% discount to natural gas vs. its 3-year historical discount of 30% or if we look before the crude oil price drop (prior to 2013) natural gas was around twice as expensive as coal. This provides buyers from environmentally conscious areas, mainly the developed countries (US and EU) and China, the option to increase natural gas in their energy mix. Particularly for China, this is in line with the government's initiative to enforce ultra low emission requirements on power plants mainly in the coastal areas following the recent pollution issue. Coal price vs. natural gas price (US$/MMBTU)
0.0
1.0
2.0
3.0
4.0
5.0
6.0
7.0
1/3/2012 1/3/2013 1/3/2014 1/3/2015
Coal Natural gas
Source: DBS Vickers Our view on peaked China coal demand in 2014 remains intact China will continue to impose its restriction on coal-fired power plants in the Coastal region, which is the key demand driver of global seaborne thermal coal market. China's coastal
areas will continue to import their energy needs from the western part of China, where the energy mix is relatively well diversified relative to the coal-centric coastal areas. The chart below shows the power import from western area to coastal area, and according to IHS, by 2020, coastal China will import 23% of its power demand from the inland region (Western region to Coastal region), higher than 18% at present. Western and coastal areas' power supplies (terrawatt-
hours)
Source: DBS Bank, Companies However, we think the demand from India will not be sufficient to offset the structural decline from China. We see India as a opportunistic buyer, only expanding their purchasing volume if coal price is at the worst level, providing short-term demand buffer and limiting the coal price downtrend. Meanwhile, if coal price starts to reverse, India will tend to scale back its coal imports. This trend will continue ahead as there is not serious enforcement to boost national electrification ratio in the rural area so far, in our view. India and China portion to global demand forecast
Source: DBS Bank, Companies
Industry Focus
Thermal Coal Sector
Page 4
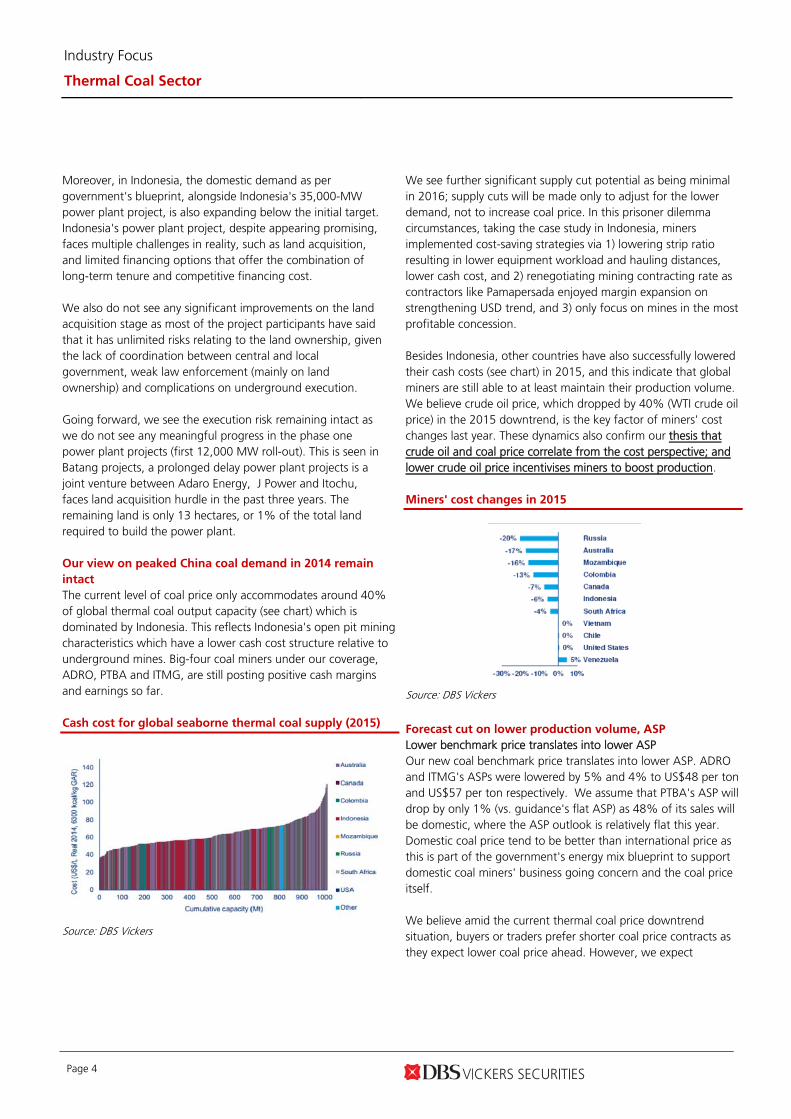
Moreover, in Indonesia, the domestic demand as per government's blueprint, alongside Indonesia's 35,000-MW power plant project, is also expanding below the initial target. Indonesia's power plant project, despite appearing promising, faces multiple challenges in reality, such as land acquisition, and limited financing options that offer the combination of long-term tenure and competitive financing cost. We also do not see any significant improvements on the land acquisition stage as most of the project participants have said that it has unlimited risks relating to the land ownership, given the lack of coordination between central and local government, weak law enforcement (mainly on land ownership) and complications on underground execution. Going forward, we see the execution risk remaining intact as we do not see any meaningful progress in the phase one power plant projects (first 12,000 MW roll-out). This is seen in Batang projects, a prolonged delay power plant projects is a joint venture between Adaro Energy, J Power and Itochu, faces land acquisition hurdle in the past three years. The remaining land is only 13 hectares, or 1% of the total land required to build the power plant. Our view on peaked China coal demand in 2014 remain
intact The current level of coal price only accommodates around 40% of global thermal coal output capacity (see chart) which is dominated by Indonesia. This reflects Indonesia's open pit mining characteristics which have a lower cash cost structure relative to underground mines. Big-four coal miners under our coverage, ADRO, PTBA and ITMG, are still posting positive cash margins and earnings so far. Cash cost for global seaborne thermal coal supply (2015)
Source: DBS Vickers
We see further significant supply cut potential as being minimal in 2016; supply cuts will be made only to adjust for the lower demand, not to increase coal price. In this prisoner dilemma circumstances, taking the case study in Indonesia, miners implemented cost-saving strategies via 1) lowering strip ratio resulting in lower equipment workload and hauling distances, lower cash cost, and 2) renegotiating mining contracting rate as contractors like Pamapersada enjoyed margin expansion on strengthening USD trend, and 3) only focus on mines in the most profitable concession. Besides Indonesia, other countries have also successfully lowered their cash costs (see chart) in 2015, and this indicate that global miners are still able to at least maintain their production volume. We believe crude oil price, which dropped by 40% (WTI crude oil price) in the 2015 downtrend, is the key factor of miners' cost changes last year. These dynamics also confirm our thesis that crude oil and coal price correlate from the cost perspective; and lower crude oil price incentivises miners to boost production. Miners' cost changes in 2015
Source: DBS Vickers
Forecast cut on lower production volume, ASP
Lower benchmark price translates into lower ASP Our new coal benchmark price translates into lower ASP. ADRO and ITMG's ASPs were lowered by 5% and 4% to US$48 per ton and US$57 per ton respectively. We assume that PTBA's ASP will drop by only 1% (vs. guidance's flat ASP) as 48% of its sales will be domestic, where the ASP outlook is relatively flat this year. Domestic coal price tend to be better than international price as this is part of the government's energy mix blueprint to support domestic coal miners' business going concern and the coal price itself. We believe amid the current thermal coal price downtrend situation, buyers or traders prefer shorter coal price contracts as they expect lower coal price ahead. However, we expect
Industry Focus
Thermal Coal Sector
Page 5
companies' ASPs relative to Newcastle benchmark price to narrow as buyers try to find better coal pricing by benchmarking other coal price indices. Production volume cut We cut our FY16 and FY17 earnings forecasts for our coal coverage on lower ASP. Moreover, we also cut our PTBA and ADRO coal production by 4% and 4% to 47m ton and 19.8m ton respectively as we believe both companies will need to cut their productions to stay profitable. We further cut ITMG coal production by 15% to 25m ton, as we adjust our coal benchmark price forecast and its ASP and ITMG need to do so in order to stay in healthy margin. Our earnings forecast is in line with our view that Indonesia coal miners will only marginally cut their production given that they have successfully lowered their operational cost mainly on lower fuel cost and mining contracting rate. We are currently 12% below the consensus forecast as we believe consensus has not fully accounted for the low thermal coal price in the next two years, at least, and the implication to companies' financial performance. Overall, our lower production assumption is based on our view that the coal miners have little more room to reduce their costs via lowering their strip ratios. Miners who have successfully
lowered their strip ratios in the last three years, have seen lower cash costs. However, we believe implementing such a strategy in the coming years will put miners' reserves at risk as shorter coal hauling means some of the reserves will not be feasibly mineable in the near future. This lead to our production cut assumption is the best option to miners to maintain profitability and reserves simultaneously. Slightly lower profitability, thanks to production cuts and efficiencies Our new forecast implies a slight profitability contraction as production cuts, focus on the most profitable concession and continuous efficiencies will limit the negative impact on the lower ASP assumption. On the other hand, we believe the low crude oil price does not fully translate into steeply lower cash cost per ton as a steep drop in crude oil price does not translate into lower national industrial fuel price and coal production cost. We estimate the industrial fuel price to drop around 15% this year, translating into 5% lower cash cost per ton in FY16 (30% of fuel cost component assumption). On the mining contracting rate, we believe there will only be a minimal cut mainly for large coal companies such as ADRO and PTBA, thanks to their bargaining power.

Industry Focus
Thermal Coal Sector
Page 6
ITMG earnings revision summary
2015F 2016F 2017F
Old New Changes Old New Changes Old New Chang
es Revenue (US$mn) 1,672 1,672 0% 1,752 1,393 -21% 1,657 1,117 -33% Gross profit (US$mn) 317 317 0% 290 224 -23% 254 177 -30% EBITDA (US$mn) 230 230 0% 198 163 -18% 172 146 -15% Net profit (US$mn) 144 144 0% 120 94 -22% 99 80 -19%
Production volume (mn ton) 27.5 27.5 0% 29.5 25.0 -15% 30 23.0 -22% ASP (US$ per ton) 60.9 60.9 0% 59.5 56.6 -5% 57 49.5 -14% Cash cost per ton (US$/ton) 39.09 39.09 0% 39.6 36.9 -7% 38 31.76 -16%
Source : Company, DBS Vickers ADRO earnings revision summary
2015F 2016F 2017F
Old New Changes Old New Changes Old New Changes Revenue (US$mn) 2,820 2,820 0% 2,666 2,423 -9% 2666 2,191 -18% Gross profit (US$mn) 618 618 0% 594 538 -10% 603 461 -24% EBITDA (US$mn) 605 605 0% 565 528 -7% 578 474 -18% Net profit (US$mn) 196 196 0% 173 154 -11% 178 126 -29%
Production volume (mn ton) 52.5 52.5 0% 49.0 47.0 -4% 46.5 44.5 -4% ASP (US$ per ton) 50.8 50.8 0% 51.0 48.0 -6% 53.5 45.2 -15%
Source : Company, DBS Vickers PTBA earnings revision summary
2015F 2016F 2017F
Old New Changes Old New Changes Old New Changes Revenue (US$mn) 14,276 14,276 0% 14,276 13,998 -2% 14790.6 13,998 -5% Gross profit (US$mn) 3,802 3,802 0% 3,924 2,816 -28% 3869.5 3,192 -18% EBITDA (US$mn) 2,382 2,382 0% 2,469 1,728 -30% 2317.4 2,045 -12% Net profit (US$mn) 1,848 1,848 0% 1,917 1,363 -29% 1835.0 1,631 -11%
Production volume (mn ton) 22.0 18.5 -16% 20.5 19.8 -4% 22.8 21.8 -4% ASP (US$ per ton) 716.0 716.0 0% 692.0 684.4 -1% 689 679.0 -1% Cash cost per ton (US$/ton) 632.00 632.00 0% 625.00 607.00 -3% 620 607.00 -2% Source : Company, DBS Vickers
HRUM earnings revision summary
2015F 2016F 2017F
Old New Changes Old New Changes Old New Changes Revenue (US$mn) 285 285 0% 228 183 -20% 228 183 -20% Gross profit (US$mn) 50 65 30% 37 27 -28% 32 26 -20% EBITDA (US$mn) 19 34 77% 20 16 -22% 22 21 -8% Net profit (US$mn) 6 15 165% 10 7 -29% 11 10 -11%
Production volume (mn ton) 5.0 5.0 0% 4.0 3.5 -13% 4 3.5 -13% ASP (US$ per ton) 57.0 57.0 0% 57.0 52.3 -8% 57.0 52.3 -8% Op. cash cost per ton (US$/ton) 36.00 36.00 0% 36.00 34.00 -6% 36 34.15 -5% Source : Company, DBS Vickers

Industry Focus
Thermal Coal Sector
Page 7
Valuation: De-rating reflects structural changes in the
sector What happened in 2015 Coal stock price dropped by 55% on average last year. We believe the combination of weak quarterly financial results and weak outlook on overall commodity price performance in 2015. We see the stock price correction as a sign of stock valuation de-rating on the structural changes in the coal sector, instead of cyclical stock price correction. This also reflects market awareness that the commodity stocks, particularly coal mining stocks, will suffer another painful year. Coal stocks performance in 2015
‐50%
‐64%‐60%
‐39%
‐70%
‐60%
‐50%
‐40%
‐30%
‐20%
‐10%
0%
ADRO PTBA ITMG Jakmine Index
Series1
Source: DBS Vickers We also do not see the recent share price correction as an opportunity to buy coal mining stocks as we see no positive catalysts for the next twelve months. Miners have not published their 2016 operational guidance but majorly clued 'difficult' year will still persist. Moreover, after our earnings forecast update, inputting the lower ASP and the implication on overall mining activities, coal stock valuation do not show major discount as good entry point, in our view. Currently coal stocks are trading at their historical low PE multiple (see chart, -2SD), but we see this as fair. Historical multiple is not an appropriate comparison, in our view, given the different circumstances the coal miners face today vs. five years ago. Current coal price is also 40% lower than its five-year average level and there are implications on the coal miners operational and earnings performance, which we believe should be translated into their stock valuation and performance. As such, we do not see stock price reaching double-digit multiples unless coal price at least recover to above US$67 per ton level, or to our prior thermal coal forecast.
What we think in 2016 In the next twelve months, power plant catalyst is not a strong angle to push coal stocks in our view, as it will be more about multi-year construction and operational refinement before it will be truly profitable and coal stocks could be re-rated as utility company. HRUM remain our Fully Valued call for Indonesia coal sector since we believe it will be the worst impacted coal miners if the coal price to stay low at current level. We do not have HRUM historical PE band since HRUM was on negative earnings in FY14. ITMG looks quite attractive at this point as it dividend yield has reach double digits of 12%. However, we are concerned about ITMG's capability to pursue its dividend payment consistently. We do not doubt management's shareholder return policy, but are instead worried about how ITMG manage its profitability and production amid its depleting coal reserves simultaneously. On ADRO, we like its low cash cost structure (operational and financial cost) and initiative on power plant projects. However, on the other hand, we believe ADRO is not immune to production cuts in order to stay profitable in the next two years. Moreover, we see weak earnings momentum to still persist in the next two years. PTBA's overall performance is good and its mine mouth power plant project means PTBA is not exposed to the land acquisition issue like what other power plant players face nowadays. However, we believe PTBA will achieve lower-than-targeted production and sales volume if efficiencies remain the management's focus. PTBA Five-year forward PE band
A v g : 1 4 .4 x
+ 1 s d : 1 7 .5 x
+ 2 s d : 2 0 .6 x
‐1 s d : 1 1 .3 x
‐2 s d : 8 .2 x
6 . 4
8 . 4
1 0 .4
1 2 .4
1 4 .4
1 6 .4
1 8 .4
2 0 .4
2 2 .4
J a n -1 2 J a n -1 3 J a n -1 4 J a n -1 5
( x )
Source: DBS Vickers
Industry Focus
Thermal Coal Sector
Page 8
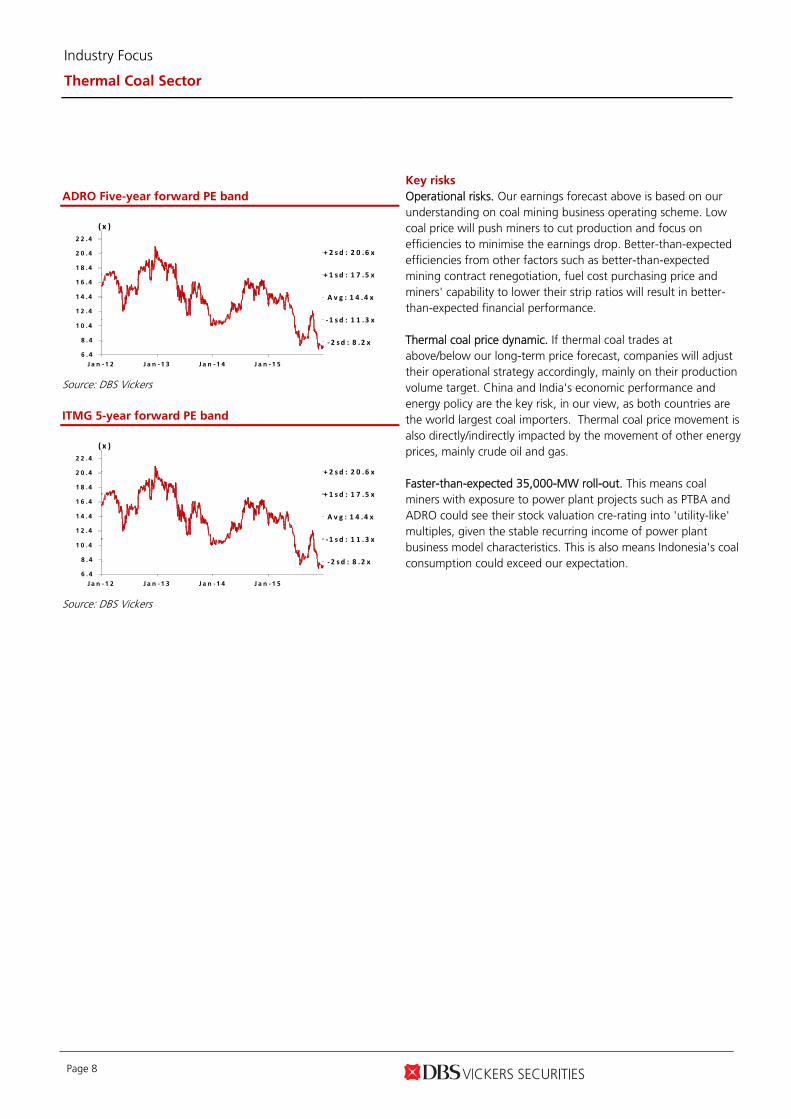
ADRO Five-year forward PE band
A v g : 1 4 .4 x
+ 1 s d : 1 7 .5 x
+ 2 s d : 2 0 .6 x
‐1 s d : 1 1 .3 x
‐2 sd : 8 .2 x
6 . 4
8 . 4
1 0 .4
1 2 .4
1 4 .4
1 6 .4
1 8 .4
2 0 .4
2 2 .4
J a n -1 2 J a n -1 3 J a n -1 4 J a n -1 5
( x )
Source: DBS Vickers
ITMG 5-year forward PE band
A v g : 1 4 .4 x
+ 1 s d : 1 7 .5 x
+ 2 s d : 2 0 .6 x
‐1 s d : 1 1 .3 x
‐2 sd : 8 .2 x
6 . 4
8 . 4
1 0 .4
1 2 .4
1 4 .4
1 6 .4
1 8 .4
2 0 .4
2 2 .4
J a n -1 2 J a n -1 3 J a n -1 4 J a n -1 5
( x )
Source: DBS Vickers
Key risks Operational risks. Our earnings forecast above is based on our understanding on coal mining business operating scheme. Low coal price will push miners to cut production and focus on efficiencies to minimise the earnings drop. Better-than-expected efficiencies from other factors such as better-than-expected mining contract renegotiation, fuel cost purchasing price and miners' capability to lower their strip ratios will result in better-than-expected financial performance. Thermal coal price dynamic. If thermal coal trades at above/below our long-term price forecast, companies will adjust their operational strategy accordingly, mainly on their production volume target. China and India's economic performance and energy policy are the key risk, in our view, as both countries are the world largest coal importers. Thermal coal price movement is also directly/indirectly impacted by the movement of other energy prices, mainly crude oil and gas. Faster-than-expected 35,000-MW roll-out. This means coal miners with exposure to power plant projects such as PTBA and ADRO could see their stock valuation cre-rating into 'utility-like' multiples, given the stable recurring income of power plant business model characteristics. This is also means Indonesia's coal consumption could exceed our expectation.

Industry Focus
Thermal Coal Sector
Page 9
Company Guides
ASIAN INSIGHTS VICKERS SECURITIES ed: TH / sa: MA
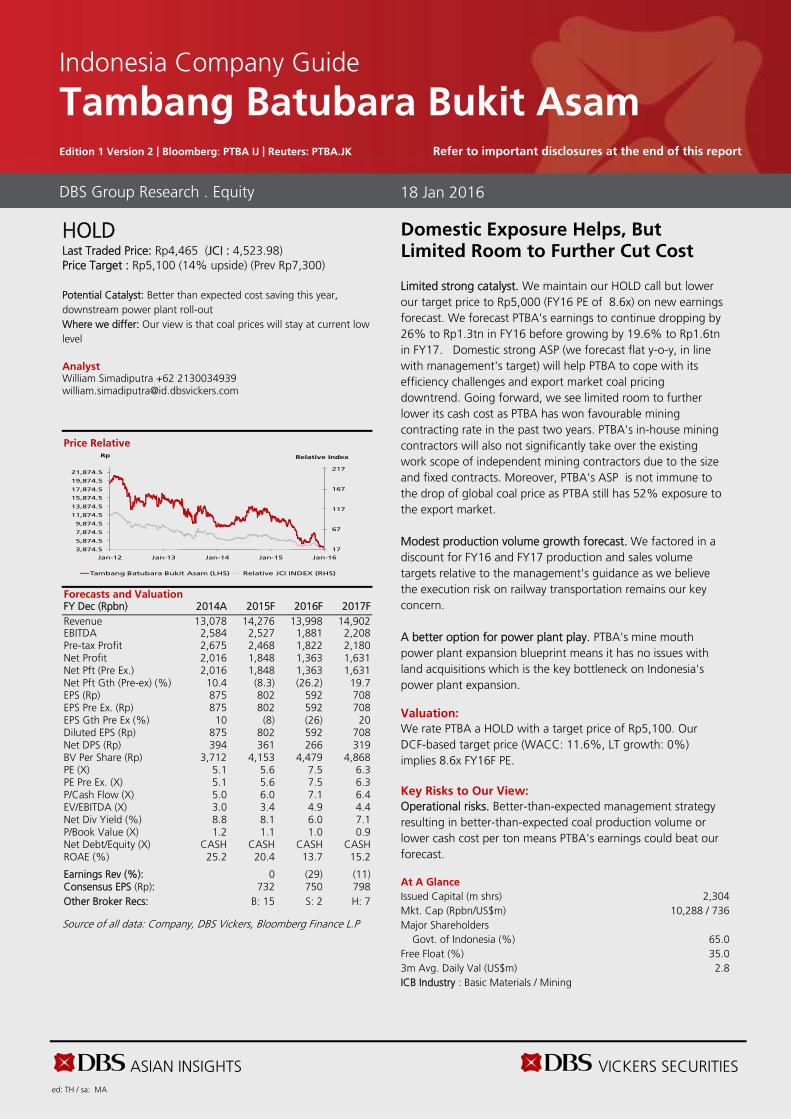
HOLD Last Traded Price: Rp4,465 (JCI : 4,523.98) Price Target : Rp5,100 (14% upside) (Prev Rp7,300) Potential Catalyst: Better than expected cost saving this year, downstream power plant roll-out Where we differ: Our view is that coal prices will stay at current low level
Analyst William Simadiputra +62 2130034939 [email protected]
Price Relative
Forecasts and Valuation FY Dec (Rpbn) 2014A 2015F 2016F 2017F Revenue 13,078 14,276 13,998 14,902 EBITDA 2,584 2,527 1,881 2,208 Pre-tax Profit 2,675 2,468 1,822 2,180 Net Profit 2,016 1,848 1,363 1,631 Net Pft (Pre Ex.) 2,016 1,848 1,363 1,631 Net Pft Gth (Pre-ex) (%) 10.4 (8.3) (26.2) 19.7 EPS (Rp) 875 802 592 708 EPS Pre Ex. (Rp) 875 802 592 708 EPS Gth Pre Ex (%) 10 (8) (26) 20 Diluted EPS (Rp) 875 802 592 708 Net DPS (Rp) 394 361 266 319 BV Per Share (Rp) 3,712 4,153 4,479 4,868 PE (X) 5.1 5.6 7.5 6.3 PE Pre Ex. (X) 5.1 5.6 7.5 6.3 P/Cash Flow (X) 5.0 6.0 7.1 6.4 EV/EBITDA (X) 3.0 3.4 4.9 4.4 Net Div Yield (%) 8.8 8.1 6.0 7.1 P/Book Value (X) 1.2 1.1 1.0 0.9 Net Debt/Equity (X) CASH CASH CASH CASH ROAE (%) 25.2 20.4 13.7 15.2 Earnings Rev (%): 0 (29) (11) Consensus EPS (Rp): 732 750 798 Other Broker Recs: B: 15 S: 2 H: 7
Source of all data: Company, DBS Vickers, Bloomberg Finance L.P
Domestic Exposure Helps, But Limited Room to Further Cut Cost Limited strong catalyst. We maintain our HOLD call but lower our target price to Rp5,000 (FY16 PE of 8.6x) on new earnings forecast. We forecast PTBA's earnings to continue dropping by 26% to Rp1.3tn in FY16 before growing by 19.6% to Rp1.6tn in FY17. Domestic strong ASP (we forecast flat y-o-y, in line with management's target) will help PTBA to cope with its efficiency challenges and export market coal pricing downtrend. Going forward, we see limited room to further lower its cash cost as PTBA has won favourable mining contracting rate in the past two years. PTBA's in-house mining contractors will also not significantly take over the existing work scope of independent mining contractors due to the size and fixed contracts. Moreover, PTBA's ASP is not immune to the drop of global coal price as PTBA still has 52% exposure to the export market. Modest production volume growth forecast. We factored in a discount for FY16 and FY17 production and sales volume targets relative to the management's guidance as we believe the execution risk on railway transportation remains our key concern. A better option for power plant play. PTBA's mine mouth power plant expansion blueprint means it has no issues with land acquisitions which is the key bottleneck on Indonesia's power plant expansion. Valuation:
We rate PTBA a HOLD with a target price of Rp5,100. Our DCF-based target price (WACC: 11.6%, LT growth: 0%) implies 8.6x FY16F PE. Key Risks to Our View:
Operational risks. Better-than-expected management strategy resulting in better-than-expected coal production volume or lower cash cost per ton means PTBA's earnings could beat our forecast. At A Glance Issued Capital (m shrs) 2,304 Mkt. Cap (Rpbn/US$m) 10,288 / 736 Major Shareholders Govt. of Indonesia (%) 65.0 Free Float (%) 35.0 3m Avg. Daily Val (US$m) 2.8 ICB Industry : Basic Materials / Mining
DBS Group Research . Equity 18 Jan 2016
Indonesia Company Guide
Tambang Batubara Bukit Asam Edition 1 Version 2 | Bloomberg: PTBA IJ | Reuters: PTBA.JK Refer to important disclosures at the end of this report
17
67
117
167
217
3,874.5
5,874.5
7,874.5
9,874.5
11,874.5
13,874.5
15,874.5
17,874.5
19,874.5
21,874.5
Jan-12 Jan-13 Jan-14 Jan-15 Jan-16
Relative IndexRp
Tambang Batubara Bukit Asam (LHS) Relative JCI INDEX (RHS)
ASIAN INSIGHTS VICKERS SECURITIES Page 11
Company Guide
Tambang Batubara Bukit Asam
CRITICAL DATA POINTS TO WATCH
Earnings Drivers:
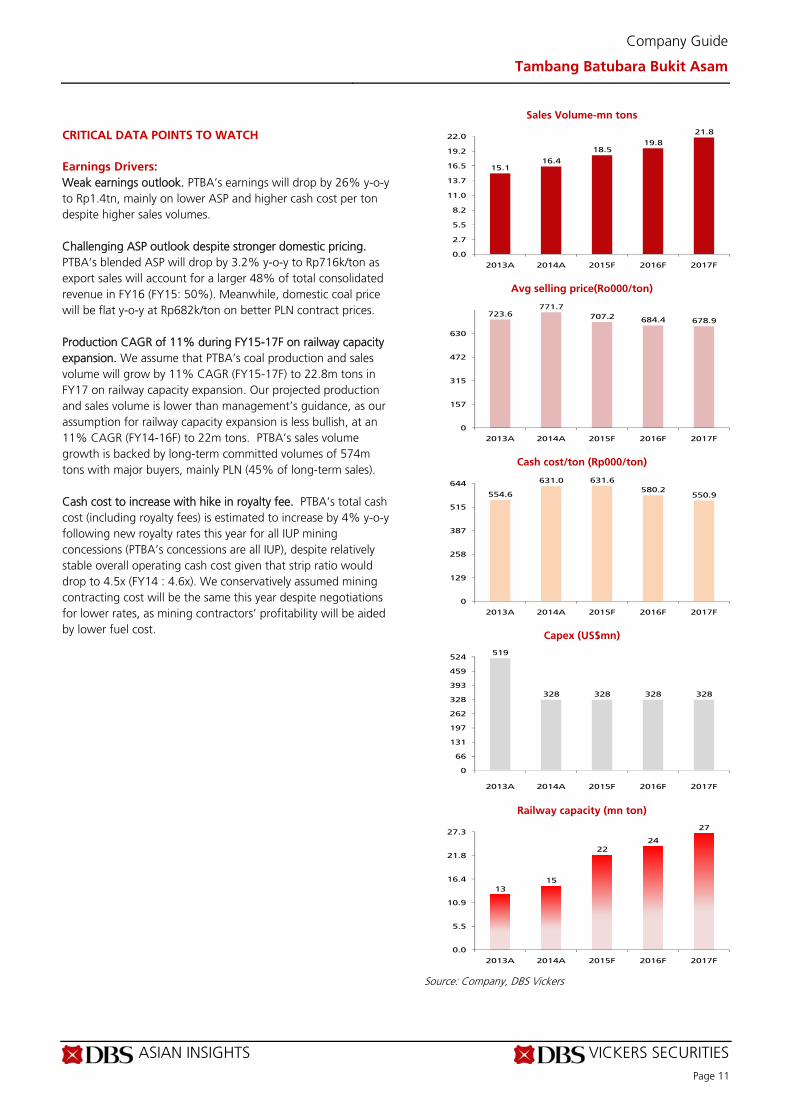
Weak earnings outlook. PTBA’s earnings will drop by 26% y-o-y to Rp1.4tn, mainly on lower ASP and higher cash cost per ton despite higher sales volumes. Challenging ASP outlook despite stronger domestic pricing. PTBA’s blended ASP will drop by 3.2% y-o-y to Rp716k/ton as export sales will account for a larger 48% of total consolidated revenue in FY16 (FY15: 50%). Meanwhile, domestic coal price will be flat y-o-y at Rp682k/ton on better PLN contract prices. Production CAGR of 11% during FY15-17F on railway capacity expansion. We assume that PTBA’s coal production and sales volume will grow by 11% CAGR (FY15-17F) to 22.8m tons in FY17 on railway capacity expansion. Our projected production and sales volume is lower than management’s guidance, as our assumption for railway capacity expansion is less bullish, at an 11% CAGR (FY14-16F) to 22m tons. PTBA’s sales volume growth is backed by long-term committed volumes of 574m tons with major buyers, mainly PLN (45% of long-term sales). Cash cost to increase with hike in royalty fee. PTBA’s total cash cost (including royalty fees) is estimated to increase by 4% y-o-y following new royalty rates this year for all IUP mining concessions (PTBA’s concessions are all IUP), despite relatively stable overall operating cash cost given that strip ratio would drop to 4.5x (FY14 : 4.6x). We conservatively assumed mining contracting cost will be the same this year despite negotiations for lower rates, as mining contractors’ profitability will be aided by lower fuel cost.
Sales Volume-mn tons
Avg selling price(Ro000/ton)
Cash cost/ton (Rp000/ton)
Capex (US$mn)
Railway capacity (mn ton)
Source: Company, DBS Vickers
15.116.4
18.519.8
21.8
0.0
2.7
5.5
8.2
11.0
13.7
16.5
19.2
22.0
2013A 2014A 2015F 2016F 2017F
723.6771.7
707.2 684.4 678.9
0
157
315
472
630
2013A 2014A 2015F 2016F 2017F
554.6
631.0 631.6
580.2550.9
0
129
258
387
515
644
2013A 2014A 2015F 2016F 2017F
519
328 328 328 328
0
66
131
197
262
328
393
459
524
2013A 2014A 2015F 2016F 2017F
1315
2224
27
0.0
5.5
10.9
16.4
21.8
27.3
2013A 2014A 2015F 2016F 2017F
ASIAN INSIGHTS VICKERS SECURITIES Page 12
Company Guide
Tambang Batubara Bukit Asam
Balance Sheet:
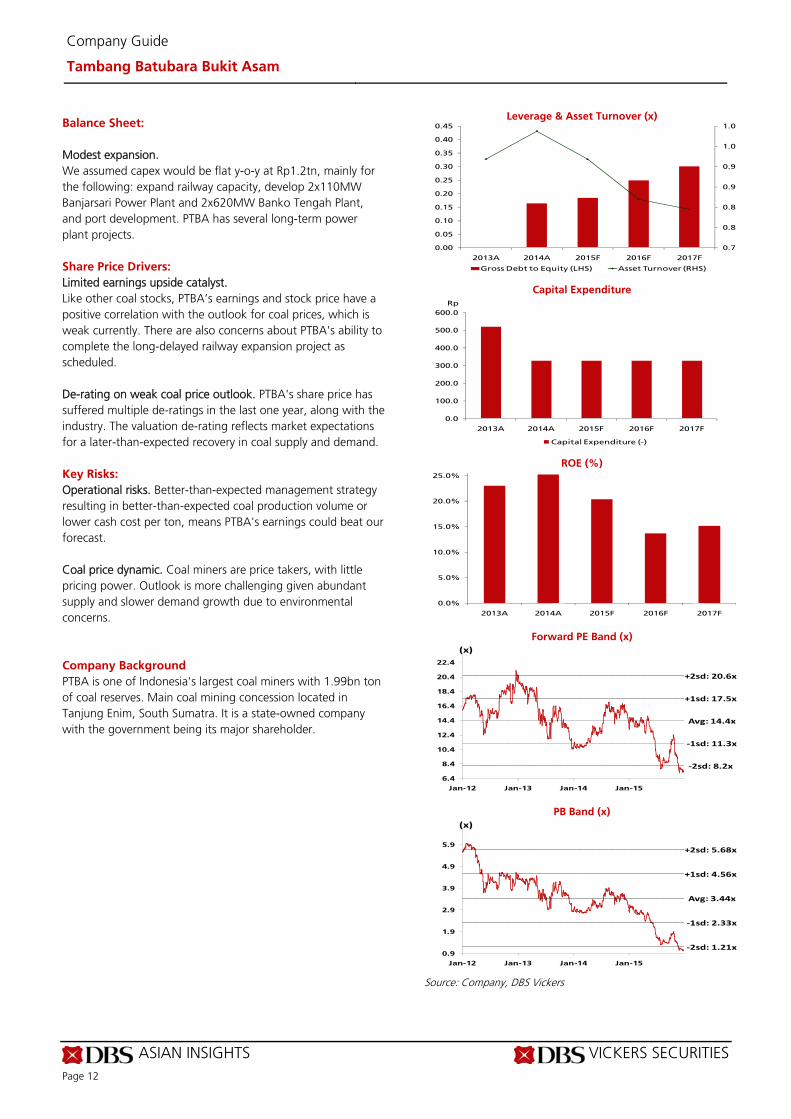
Modest expansion. We assumed capex would be flat y-o-y at Rp1.2tn, mainly for the following: expand railway capacity, develop 2x110MW Banjarsari Power Plant and 2x620MW Banko Tengah Plant, and port development. PTBA has several long-term power plant projects.
Share Price Drivers:
Limited earnings upside catalyst. Like other coal stocks, PTBA’s earnings and stock price have a positive correlation with the outlook for coal prices, which is weak currently. There are also concerns about PTBA's ability to complete the long-delayed railway expansion project as scheduled. De-rating on weak coal price outlook. PTBA's share price has suffered multiple de-ratings in the last one year, along with the industry. The valuation de-rating reflects market expectations for a later-than-expected recovery in coal supply and demand.
Key Risks:
Operational risks. Better-than-expected management strategy resulting in better-than-expected coal production volume or lower cash cost per ton, means PTBA's earnings could beat our forecast. Coal price dynamic. Coal miners are price takers, with little pricing power. Outlook is more challenging given abundant supply and slower demand growth due to environmental concerns.
Company Background
PTBA is one of Indonesia's largest coal miners with 1.99bn ton of coal reserves. Main coal mining concession located in Tanjung Enim, South Sumatra. It is a state-owned company with the government being its major shareholder.
Leverage & Asset Turnover (x)
Capital Expenditure
ROE (%)
Forward PE Band (x)
PB Band (x)
Source: Company, DBS Vickers
0.7
0.8
0.8
0.9
0.9
1.0
1.0
0.00
0.05
0.10
0.15
0.20
0.25
0.30
0.35
0.40
0.45
2013A 2014A 2015F 2016F 2017F
Gross Debt to Equity (LHS) Asset Turnover (RHS)
0.0
100.0
200.0
300.0
400.0
500.0
600.0
2013A 2014A 2015F 2016F 2017F
Capital Expenditure (-)
Rp
0.0%
5.0%
10.0%
15.0%
20.0%
25.0%
2013A 2014A 2015F 2016F 2017F
Avg: 14.4x
+1sd: 17.5x
+2sd: 20.6x
‐1sd: 11.3x
‐2sd: 8.2x
6.4
8.4
10.4
12.4
14.4
16.4
18.4
20.4
22.4
Jan-12 Jan-13 Jan-14 Jan-15
(x)
Avg: 3.44x
+1sd: 4.56x
+2sd: 5.68x
‐1sd: 2.33x
‐2sd: 1.21x0.9
1.9
2.9
3.9
4.9
5.9
Jan-12 Jan-13 Jan-14 Jan-15
(x)

ASIAN INSIGHTS VICKERS SECURITIES Page 13
Company Guide
Tambang Batubara Bukit Asam
Key Assumptions
FY Dec 2013A 2014A 2015F 2016F 2017F Sales Volume-mn tons 15.1 16.4 18.5 19.8 21.8 Avg selling 724 772 707 684 679 Cash cost/ton (Rp000/ton) 555 631 632 580 551 Capex (US$mn) 519 328 328 328 328 Railway capacity (mn ton) 12.8 14.8 22.0 24.0 27.0
Income Statement (Rpbn)
FY Dec 2013A 2014A 2015F 2016F 2017F Revenue 11,209 13,078 14,276 13,998 14,902 Cost of Goods Sold (7,746) (9,056) (10,474) (11,182) (11,710) Gross Profit 3,464 4,022 3,802 2,816 3,192 Other Opng (Exp)/Inc (1,311) (1,712) (1,570) (1,260) (1,341) Operating Profit 2,153 2,310 2,231 1,556 1,851 Other Non Opg (Exp)/Inc 0.0 0.0 0.0 0.0 0.0 Associates & JV Inc 74.9 146 146 153 163 Net Interest (Exp)/Inc 234 219 91.3 113 166 Exceptional Gain/(Loss) 0.0 0.0 0.0 0.0 0.0 Pre-tax Profit 2,461 2,675 2,468 1,822 2,180 Tax (607) (656) (617) (455) (545) Minority Interest (28.1) (3.0) (3.3) (3.3) (3.5) Preference Dividend 0.0 0.0 0.0 0.0 0.0 Net Profit 1,826 2,016 1,848 1,363 1,631 Net Profit before Except. 1,826 2,016 1,848 1,363 1,631 EBITDA 2,322 2,584 2,527 1,881 2,208 Growth Revenue Gth (%) (3.3) 16.7 9.2 (1.9) 6.5 EBITDA Gth (%) (36.5) 11.3 (2.2) (25.6) 17.4 Opg Profit Gth (%) (40.1) 7.3 (3.4) (30.3) 18.9 Net Profit Gth (Pre-ex) (%) (37.0) 10.4 (8.3) (26.2) 19.7 Margins & Ratio Gross Margins (%) 30.9 30.8 26.6 20.1 21.4 Opg Profit Margin (%) 19.2 17.7 15.6 11.1 12.4 Net Profit Margin (%) 16.3 15.4 12.9 9.7 10.9 ROAE (%) 23.0 25.2 20.4 13.7 15.2 ROA (%) 15.0 15.2 11.9 8.0 8.7 ROCE (%) 15.9 16.5 13.5 8.4 9.0 Div Payout Ratio (%) 45.0 45.0 45.0 45.0 45.0 Net Interest Cover (x) NM NM NM NM NM
Source: Company, DBS Vickers
Downtrend in ASP trend on export sales ASP drag, despite solid domestic coal pricing
ASIAN INSIGHTS VICKERS SECURITIES Page 14
Company Guide
Tambang Batubara Bukit Asam
Quarterly / Interim Income Statement (Rpbn)
FY Dec 3Q2014 4Q2014 1Q2015 2Q2015 3Q2015 Revenue 3,229 3,422 3,277 3,235 3,990 Cost of Goods Sold (2,277) (2,467) (2,506) (2,292) (2,740) Gross Profit 952 955 771 942 1,250 Other Oper. (Exp)/Inc (179) (217) (226) (114) (145) Operating Profit 458 459 359 534 905 Net Interest (Exp)/Inc (7.9) (35.6) (29.7) (31.6) (65.3) Exceptional Gain/(Loss) 0.0 0.0 0.0 0.0 0.0 Pre-tax Profit 556 530 463 636 952 Tax (129) (103) (122) (182) (242) Minority Interest (0.8) 7.40 (0.1) 0.38 0.82 Net Profit 426 434 341 455 710 Net profit bef Except. 426 434 341 455 710 EBITDA 402 663 0.0 0.0 0.0 Growth Revenue Gth (%) (3.1) 6.0 (4.2) (1.3) 23.4 EBITDA Gth (%) (48.2) 65.0 nm nm nm Opg Profit Gth (%) (37.0) 0.2 (21.7) 48.6 69.5 Net Profit Gth (Pre-ex) (%) (31.3) 1.9 (21.6) 33.5 56.3 Margins Gross Margins (%) 29.5 27.9 23.5 29.1 31.3 Opg Profit Margins (%) 14.2 13.4 11.0 16.5 22.7 Net Profit Margins (%) 13.2 12.7 10.4 14.1 17.8
Balance Sheet (Rpbn)
FY Dec 2013A 2014A 2015F 2016F 2017F Net Fixed Assets 2,803 3,988 4,165 4,320 4,453 Invts in Associates & JVs 0.0 0.0 0.0 0.0 0.0 Other LT Assets 2,394 3,408 4,733 5,966 7,200 Cash & ST Invts 3,344 4,039 3,706 3,870 4,081 Inventory 902 1,033 1,195 1,276 1,336 Debtors 1,428 1,439 1,571 1,541 1,640 Other Current Assets 806 905 905 905 905 Total Assets 11,677 14,812 16,276 17,877 19,616 ST Debt 0.0 467 0.0 0.0 0.0 Creditor 472 546 631 674 705 Other Current Liab 1,789 2,561 2,561 2,561 2,561 LT Debt 0.0 962 1,791 2,600 3,409 Other LT Liabilities 1,865 1,605 1,605 1,605 1,605 Shareholder’s Equity 7,437 8,554 9,570 10,320 11,217 Minority Interests 114 117 117 117 117 Total Cap. & Liab. 11,677 14,812 16,276 17,877 19,616 Non-Cash Wkg. Capital 875 271 479 486 614 Net Cash/(Debt) 3,344 2,610 1,916 1,270 671 Debtors Turn (avg days) 48.4 40.0 38.5 40.6 39.0 Creditors Turn (avg days) 14.8 20.8 20.8 21.6 21.9 Inventory Turn (avg days) 39.8 39.6 39.4 41.0 41.4 Asset Turnover (x) 0.9 1.0 0.9 0.8 0.8 Current Ratio (x) 2.9 2.1 2.3 2.3 2.4 Quick Ratio (x) 2.1 1.5 1.7 1.7 1.8 Net Debt/Equity (X) CASH CASH CASH CASH CASH Net Debt/Equity ex MI (X) CASH CASH CASH CASH CASH Capex to Debt (%) N/A 22.9 18.3 12.6 9.6 Z-Score (X) 4.7 3.8 3.6 3.4 3.2
Source: Company, DBS Vickers
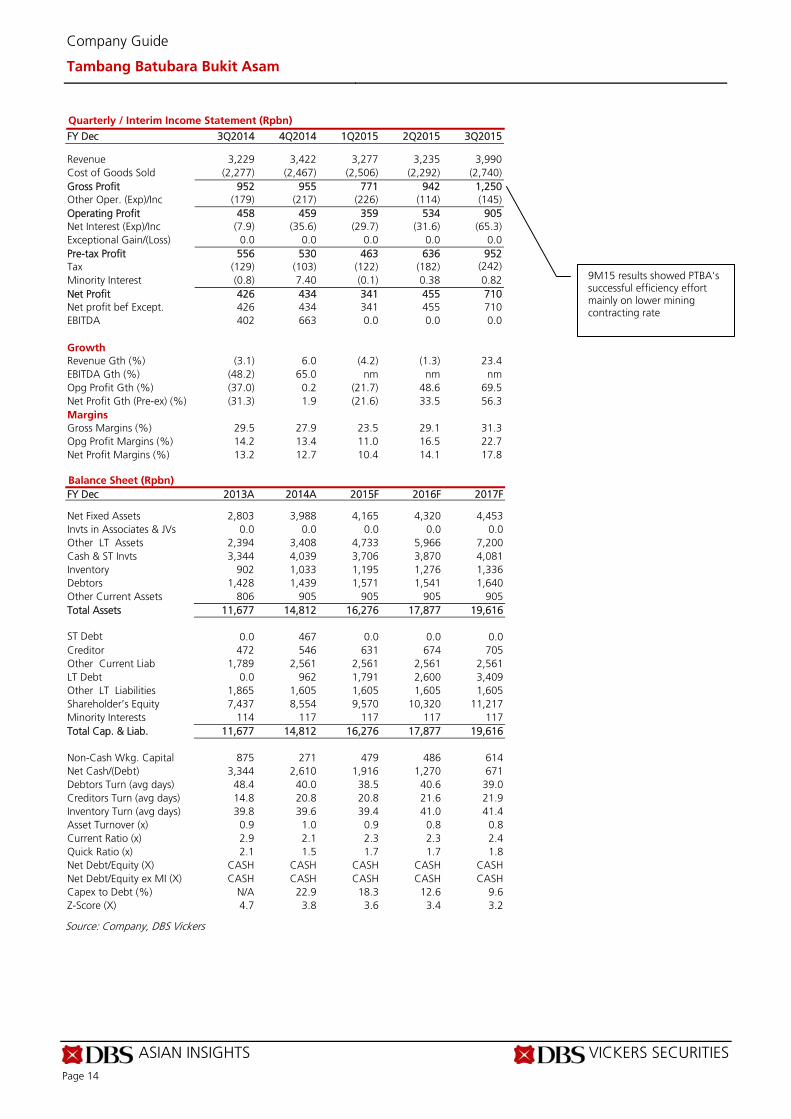
9M15 results showed PTBA's successful efficiency effort mainly on lower mining contracting rate
ASIAN INSIGHTS VICKERS SECURITIES Page 15
Company Guide
Tambang Batubara Bukit Asam
Cash Flow Statement (Rpbn)
FY Dec 2013A 2014A 2015F 2016F 2017F Pre-Tax Profit 2,461 2,675 2,468 1,822 2,180 Dep. & Amort. 94.0 129 150 172 194 Tax Paid (607) (656) (617) (455) (545) Assoc. & JV Inc/(loss) 0.0 0.0 0.0 0.0 0.0 Chg in Wkg.Cap. 304 (69.6) (208) (7.6) (128) Other Operating CF 609 (31.8) (77.5) (79.6) (82.1) Net Operating CF 2,861 2,046 1,716 1,452 1,619 Capital Exp.(net) (519) (328) (328) (328) (328) Other Invts.(net) (984) (1,307) (1,252) (1,156) (1,156) Invts in Assoc. & JV 0.0 0.0 0.0 0.0 0.0 Div from Assoc & JV 0.0 0.0 0.0 0.0 0.0 Other Investing CF (2,244) (255) 0.0 0.0 0.0 Net Investing CF (3,747) (1,889) (1,579) (1,484) (1,484) Div Paid (822) (907) (832) (613) (734) Chg in Gross Debt (9.7) 1,429 362 809 809 Capital Issues 0.0 0.0 0.0 0.0 0.0 Other Financing CF 7.00 17.0 0.0 0.0 0.0 Net Financing CF (824) 539 (470) 196 75.0 Currency Adjustments 0.0 0.0 0.0 0.0 0.0 Chg in Cash (1,710) 696 (333) 164 211 Opg CFPS (Rp) 1,110 918 835 633 758 Free CFPS (Rp) 1,017 746 603 488 561
Source: Company, DBS Vickers
Target Price & Ratings History
Source: DBS Vickers
S.No. Date Closing PriceTarget Price
Rating
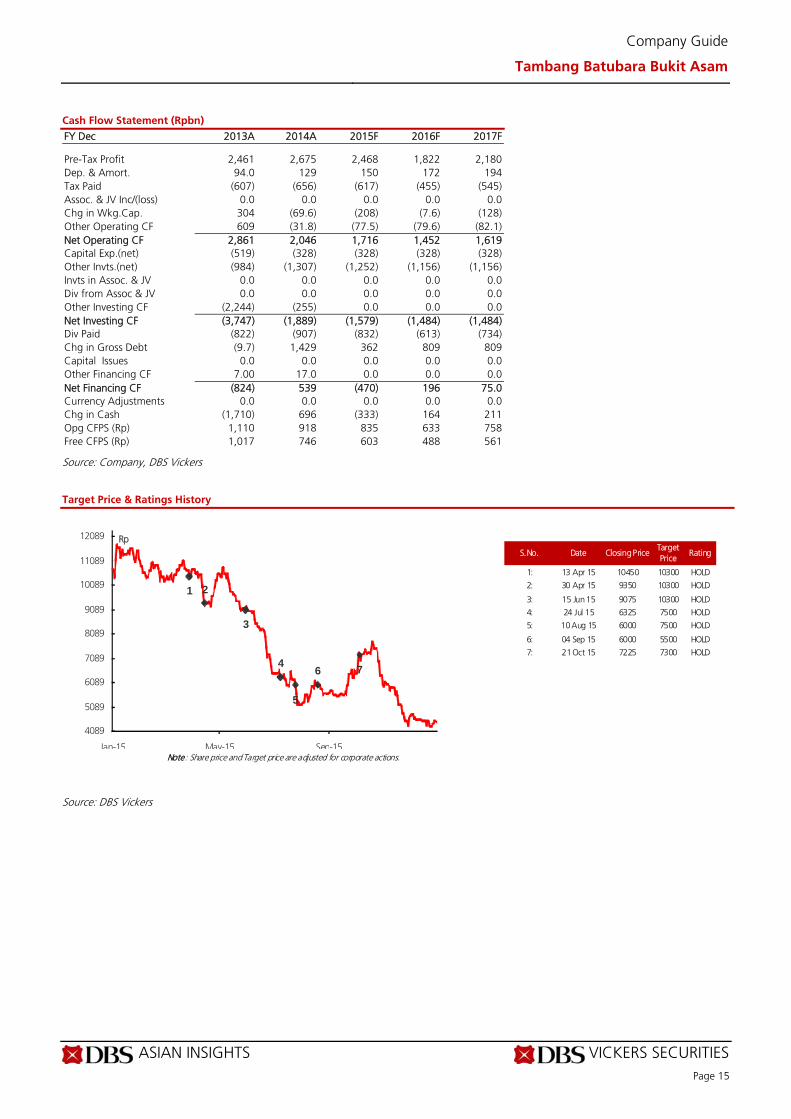
1: 13 Apr 15 10450 10300 HOLD
2: 30 Apr 15 9350 10300 HOLD
3: 15 Jun 15 9075 10300 HOLD
4: 24 Jul 15 6325 7500 HOLD
5: 10 Aug 15 6000 7500 HOLD
6: 04 Sep 15 6000 5500 HOLD
7: 21 Oct 15 7225 7300 HOLD
Note: Share price and Target price are adjusted for corporate actions.
1 2
3
4
5
6 7
4089
5089
6089
7089
8089
9089
10089
11089
12089
Jan-15 May-15 Sep-15
Rp
ASIAN INSIGHTS VICKERS SECURITIES ed: TH / sa: MA
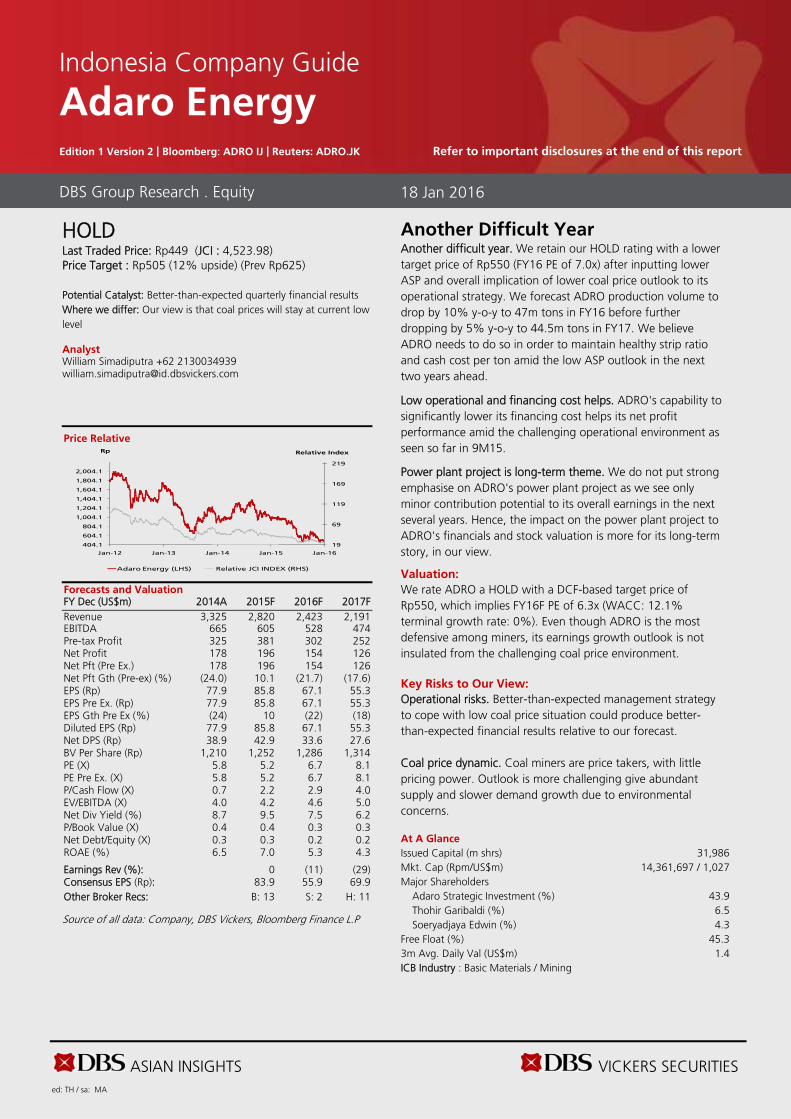
HOLD Last Traded Price: Rp449 (JCI : 4,523.98) Price Target : Rp505 (12% upside) (Prev Rp625) Potential Catalyst: Better-than-expected quarterly financial results Where we differ: Our view is that coal prices will stay at current low level Analyst William Simadiputra +62 2130034939 [email protected]
Price Relative
Forecasts and Valuation FY Dec (US$m) 2014A 2015F 2016F 2017F Revenue 3,325 2,820 2,423 2,191 EBITDA 665 605 528 474 Pre-tax Profit 325 381 302 252 Net Profit 178 196 154 126 Net Pft (Pre Ex.) 178 196 154 126 Net Pft Gth (Pre-ex) (%) (24.0) 10.1 (21.7) (17.6) EPS (Rp) 77.9 85.8 67.1 55.3 EPS Pre Ex. (Rp) 77.9 85.8 67.1 55.3 EPS Gth Pre Ex (%) (24) 10 (22) (18) Diluted EPS (Rp) 77.9 85.8 67.1 55.3 Net DPS (Rp) 38.9 42.9 33.6 27.6 BV Per Share (Rp) 1,210 1,252 1,286 1,314 PE (X) 5.8 5.2 6.7 8.1 PE Pre Ex. (X) 5.8 5.2 6.7 8.1 P/Cash Flow (X) 0.7 2.2 2.9 4.0 EV/EBITDA (X) 4.0 4.2 4.6 5.0 Net Div Yield (%) 8.7 9.5 7.5 6.2 P/Book Value (X) 0.4 0.4 0.3 0.3 Net Debt/Equity (X) 0.3 0.3 0.2 0.2 ROAE (%) 6.5 7.0 5.3 4.3 Earnings Rev (%): 0 (11) (29) Consensus EPS (Rp): 83.9 55.9 69.9 Other Broker Recs: B: 13 S: 2 H: 11
Source of all data: Company, DBS Vickers, Bloomberg Finance L.P
Another Difficult Year Another difficult year. We retain our HOLD rating with a lower target price of Rp550 (FY16 PE of 7.0x) after inputting lower ASP and overall implication of lower coal price outlook to its operational strategy. We forecast ADRO production volume to drop by 10% y-o-y to 47m tons in FY16 before further dropping by 5% y-o-y to 44.5m tons in FY17. We believe ADRO needs to do so in order to maintain healthy strip ratio and cash cost per ton amid the low ASP outlook in the next two years ahead.
Low operational and financing cost helps. ADRO's capability to significantly lower its financing cost helps its net profit performance amid the challenging operational environment as seen so far in 9M15.
Power plant project is long-term theme. We do not put strong emphasise on ADRO's power plant project as we see only minor contribution potential to its overall earnings in the next several years. Hence, the impact on the power plant project to ADRO's financials and stock valuation is more for its long-term story, in our view.
Valuation:
We rate ADRO a HOLD with a DCF-based target price of Rp550, which implies FY16F PE of 6.3x (WACC: 12.1% terminal growth rate: 0%). Even though ADRO is the most defensive among miners, its earnings growth outlook is not insulated from the challenging coal price environment. Key Risks to Our View:
Operational risks. Better-than-expected management strategy to cope with low coal price situation could produce better-than-expected financial results relative to our forecast. Coal price dynamic. Coal miners are price takers, with little pricing power. Outlook is more challenging give abundant supply and slower demand growth due to environmental concerns. At A Glance Issued Capital (m shrs) 31,986 Mkt. Cap (Rpm/US$m) 14,361,697 / 1,027 Major Shareholders Adaro Strategic Investment (%) 43.9 Thohir Garibaldi (%) 6.5 Soeryadjaya Edwin (%) 4.3 Free Float (%) 45.3 3m Avg. Daily Val (US$m) 1.4 ICB Industry : Basic Materials / Mining
DBS Group Research . Equity 18 Jan 2016
Indonesia Company Guide
Adaro Energy Edition 1 Version 2 | Bloomberg: ADRO IJ | Reuters: ADRO.JK Refer to important disclosures at the end of this report
19
69
119
169
219
404.1
604.1
804.1
1,004.1
1,204.1
1,404.1
1,604.1
1,804.1
2,004.1
Jan-12 Jan-13 Jan-14 Jan-15 Jan-16
Relative IndexRp
Adaro Energy (LHS) Relative JCI INDEX (RHS)
ASIAN INSIGHTS VICKERS SECURITIES Page 17
Company Guide
Adaro Energy
CRITICAL DATA POINTS TO WATCH
Earnings Drivers:
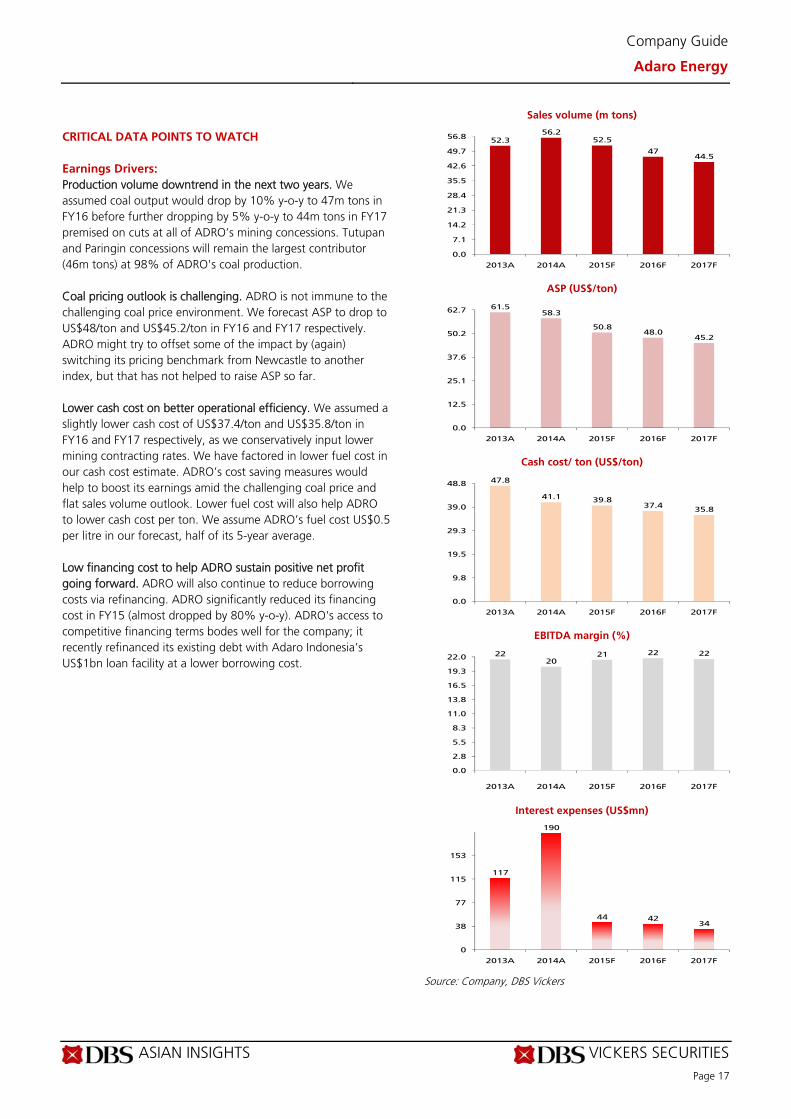
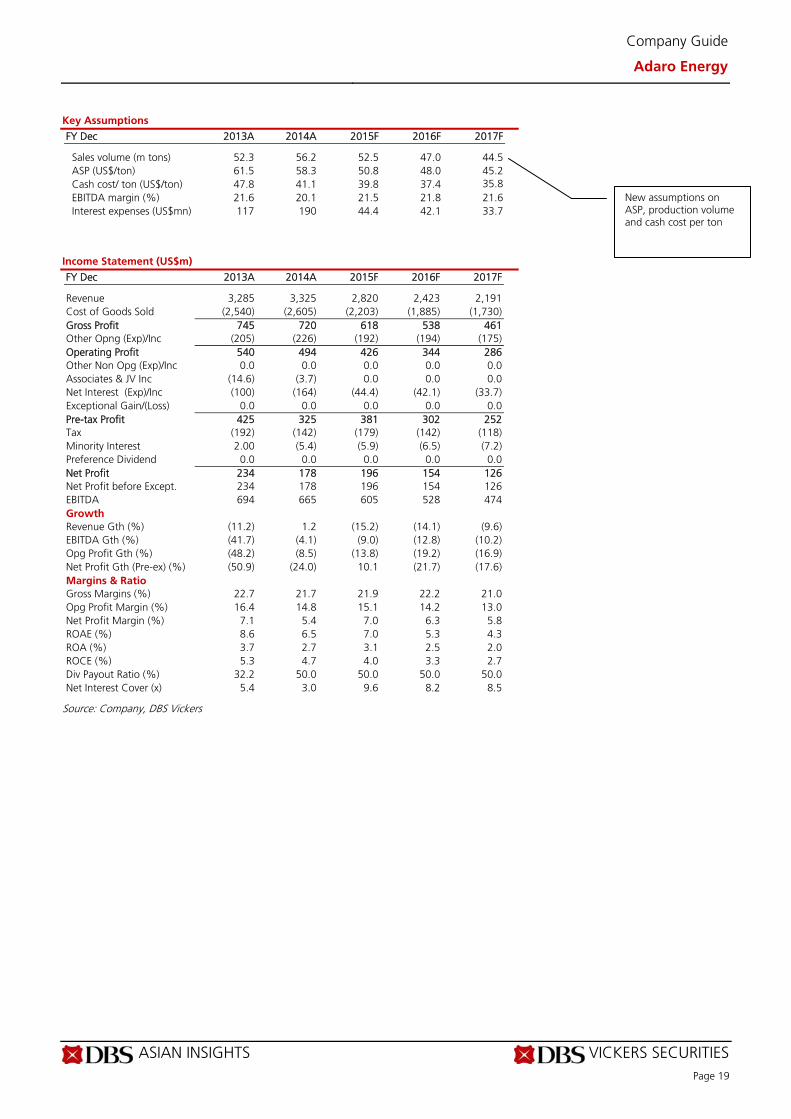
Production volume downtrend in the next two years. We assumed coal output would drop by 10% y-o-y to 47m tons in FY16 before further dropping by 5% y-o-y to 44m tons in FY17 premised on cuts at all of ADRO’s mining concessions. Tutupan and Paringin concessions will remain the largest contributor (46m tons) at 98% of ADRO's coal production. Coal pricing outlook is challenging. ADRO is not immune to the challenging coal price environment. We forecast ASP to drop to US$48/ton and US$45.2/ton in FY16 and FY17 respectively. ADRO might try to offset some of the impact by (again) switching its pricing benchmark from Newcastle to another index, but that has not helped to raise ASP so far. Lower cash cost on better operational efficiency. We assumed a slightly lower cash cost of US$37.4/ton and US$35.8/ton in FY16 and FY17 respectively, as we conservatively input lower mining contracting rates. We have factored in lower fuel cost in our cash cost estimate. ADRO’s cost saving measures would help to boost its earnings amid the challenging coal price and flat sales volume outlook. Lower fuel cost will also help ADRO to lower cash cost per ton. We assume ADRO’s fuel cost US$0.5 per litre in our forecast, half of its 5-year average. Low financing cost to help ADRO sustain positive net profit going forward. ADRO will also continue to reduce borrowing costs via refinancing. ADRO significantly reduced its financing cost in FY15 (almost dropped by 80% y-o-y). ADRO's access to competitive financing terms bodes well for the company; it recently refinanced its existing debt with Adaro Indonesia’s US$1bn loan facility at a lower borrowing cost.
Sales volume (m tons)
ASP (US$/ton)
Cash cost/ ton (US$/ton)
EBITDA margin (%)
Interest expenses (US$mn)
Source: Company, DBS Vickers
52.356.2
52.5
4744.5
0.0
7.1
14.2
21.3
28.4
35.5
42.6
49.7
56.8
2013A 2014A 2015F 2016F 2017F
61.558.3
50.848.0
45.2
0.0
12.5
25.1
37.6
50.2
62.7
2013A 2014A 2015F 2016F 2017F
47.8
41.1 39.837.4
35.8
0.0
9.8
19.5
29.3
39.0
48.8
2013A 2014A 2015F 2016F 2017F
2220
21 22 22
0.0
2.8
5.5
8.3
11.0
13.8
16.5
19.3
22.0
2013A 2014A 2015F 2016F 2017F
117
190
44 4234
0
38
77
115
153
2013A 2014A 2015F 2016F 2017F
ASIAN INSIGHTS VICKERS SECURITIES Page 18
Company Guide
Adaro Energy
Balance Sheet:
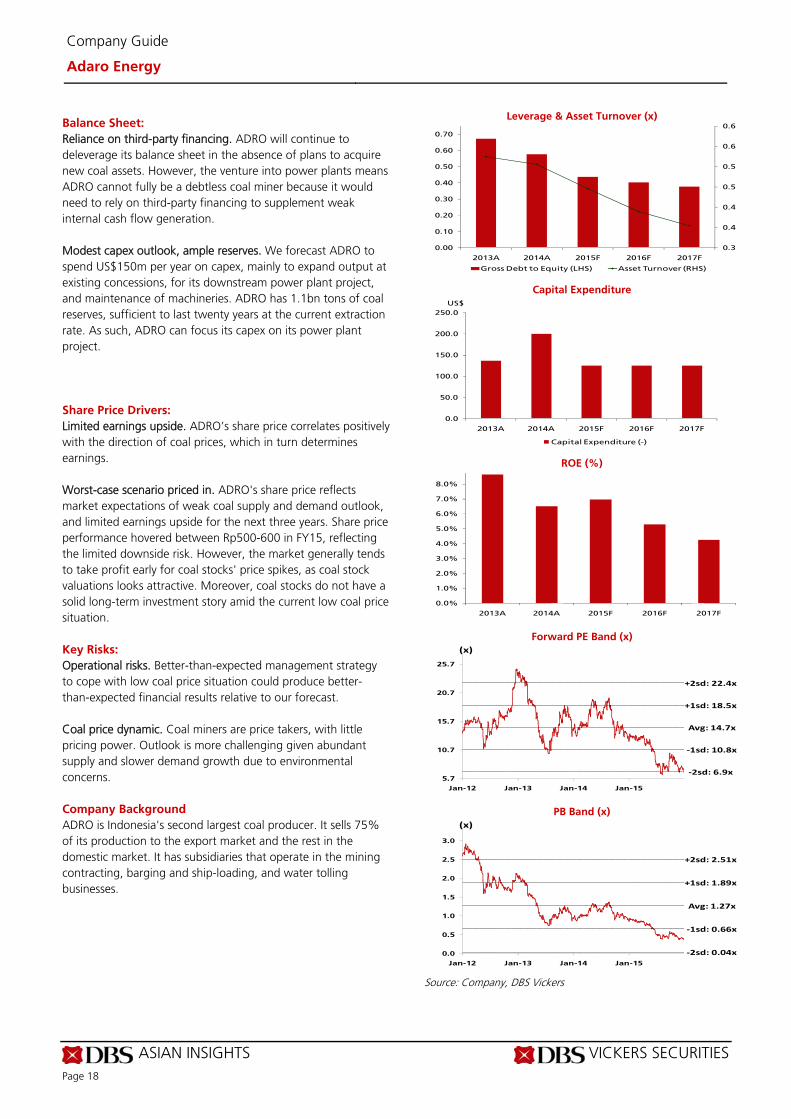
Reliance on third-party financing. ADRO will continue to deleverage its balance sheet in the absence of plans to acquire new coal assets. However, the venture into power plants means ADRO cannot fully be a debtless coal miner because it would need to rely on third-party financing to supplement weak internal cash flow generation. Modest capex outlook, ample reserves. We forecast ADRO to spend US$150m per year on capex, mainly to expand output at existing concessions, for its downstream power plant project, and maintenance of machineries. ADRO has 1.1bn tons of coal reserves, sufficient to last twenty years at the current extraction rate. As such, ADRO can focus its capex on its power plant project.
Share Price Drivers:
Limited earnings upside. ADRO’s share price correlates positively with the direction of coal prices, which in turn determines earnings. Worst-case scenario priced in. ADRO's share price reflects market expectations of weak coal supply and demand outlook, and limited earnings upside for the next three years. Share price performance hovered between Rp500-600 in FY15, reflecting the limited downside risk. However, the market generally tends to take profit early for coal stocks' price spikes, as coal stock valuations looks attractive. Moreover, coal stocks do not have a solid long-term investment story amid the current low coal price situation.
Key Risks:
Operational risks. Better-than-expected management strategy to cope with low coal price situation could produce better-than-expected financial results relative to our forecast. Coal price dynamic. Coal miners are price takers, with little pricing power. Outlook is more challenging given abundant supply and slower demand growth due to environmental concerns.
Company Background
ADRO is Indonesia's second largest coal producer. It sells 75% of its production to the export market and the rest in the domestic market. It has subsidiaries that operate in the mining contracting, barging and ship-loading, and water tolling businesses.
Leverage & Asset Turnover (x)
Capital Expenditure
ROE (%)
Forward PE Band (x)
PB Band (x)
Source: Company, DBS Vickers
0.3
0.4
0.4
0.5
0.5
0.6
0.6
0.00
0.10
0.20
0.30
0.40
0.50
0.60
0.70
2013A 2014A 2015F 2016F 2017F
Gross Debt to Equity (LHS) Asset Turnover (RHS)
0.0
50.0
100.0
150.0
200.0
250.0
2013A 2014A 2015F 2016F 2017F
Capital Expenditure (-)
US$
0.0%
1.0%
2.0%
3.0%
4.0%
5.0%
6.0%
7.0%
8.0%
2013A 2014A 2015F 2016F 2017F
Avg: 14.7x
+1sd: 18.5x
+2sd: 22.4x
‐1sd: 10.8x
‐2sd: 6.9x5.7
10.7
15.7
20.7
25.7
Jan-12 Jan-13 Jan-14 Jan-15
(x)
Avg: 1.27x
+1sd: 1.89x
+2sd: 2.51x
‐1sd: 0.66x
‐2sd: 0.04x0.0
0.5
1.0
1.5
2.0
2.5
3.0
Jan-12 Jan-13 Jan-14 Jan-15
(x)
ASIAN INSIGHTS VICKERS SECURITIES Page 19
Company Guide
Adaro Energy
Key Assumptions
FY Dec 2013A 2014A 2015F 2016F 2017F Sales volume (m tons) 52.3 56.2 52.5 47.0 44.5 ASP (US$/ton) 61.5 58.3 50.8 48.0 45.2 Cash cost/ ton (US$/ton) 47.8 41.1 39.8 37.4 35.8 EBITDA margin (%) 21.6 20.1 21.5 21.8 21.6 Interest expenses (US$mn) 117 190 44.4 42.1 33.7
Income Statement (US$m)
FY Dec 2013A 2014A 2015F 2016F 2017F Revenue 3,285 3,325 2,820 2,423 2,191 Cost of Goods Sold (2,540) (2,605) (2,203) (1,885) (1,730) Gross Profit 745 720 618 538 461 Other Opng (Exp)/Inc (205) (226) (192) (194) (175) Operating Profit 540 494 426 344 286 Other Non Opg (Exp)/Inc 0.0 0.0 0.0 0.0 0.0 Associates & JV Inc (14.6) (3.7) 0.0 0.0 0.0 Net Interest (Exp)/Inc (100) (164) (44.4) (42.1) (33.7) Exceptional Gain/(Loss) 0.0 0.0 0.0 0.0 0.0 Pre-tax Profit 425 325 381 302 252 Tax (192) (142) (179) (142) (118) Minority Interest 2.00 (5.4) (5.9) (6.5) (7.2) Preference Dividend 0.0 0.0 0.0 0.0 0.0 Net Profit 234 178 196 154 126 Net Profit before Except. 234 178 196 154 126 EBITDA 694 665 605 528 474 Growth Revenue Gth (%) (11.2) 1.2 (15.2) (14.1) (9.6) EBITDA Gth (%) (41.7) (4.1) (9.0) (12.8) (10.2) Opg Profit Gth (%) (48.2) (8.5) (13.8) (19.2) (16.9) Net Profit Gth (Pre-ex) (%) (50.9) (24.0) 10.1 (21.7) (17.6) Margins & Ratio Gross Margins (%) 22.7 21.7 21.9 22.2 21.0 Opg Profit Margin (%) 16.4 14.8 15.1 14.2 13.0 Net Profit Margin (%) 7.1 5.4 7.0 6.3 5.8 ROAE (%) 8.6 6.5 7.0 5.3 4.3 ROA (%) 3.7 2.7 3.1 2.5 2.0 ROCE (%) 5.3 4.7 4.0 3.3 2.7 Div Payout Ratio (%) 32.2 50.0 50.0 50.0 50.0 Net Interest Cover (x) 5.4 3.0 9.6 8.2 8.5
Source: Company, DBS Vickers
New assumptions on ASP, production volume and cash cost per ton
ASIAN INSIGHTS VICKERS SECURITIES Page 20
Company Guide
Adaro Energy
Quarterly / Interim Income Statement (US$m)
FY Dec 3Q2014 4Q2014 1Q2015 2Q2015 3Q2015 Revenue 814 818 711 688 713 Cost of Goods Sold (661) (684) (545) (554) (576) Gross Profit 153 134 166 133 138 Other Oper. (Exp)/Inc (42.6) (112) (49.8) (26.9) (40.1) Operating Profit 111 21.7 116 106 97.7 Other Non Opg (Exp)/Inc 7.66 (17.0) 151 (10.8) (13.2) Net Interest (Exp)/Inc (52.4) (51.0) (164) 0.0 0.0 Pre-tax Profit 66.1 (46.3) 103 95.6 84.4 Tax (12.9) 4.90 (43.3) (36.1) (23.3) Minority Interest (0.6) (0.9) (0.4) 0.34 (0.6) Net Profit 52.6 (42.3) 59.1 59.9 60.6 Net profit bef Except. 52.6 (42.3) 59.1 59.9 60.6 EBITDA 118 177 177 177 177 Growth Revenue Gth (%) (4.0) 0.4 (13.1) (3.3) 3.7 EBITDA Gth (%) (3.8) 49.4 0.0 0.0 0.0 Opg Profit Gth (%) (7.4) (80.4) 434.6 (8.1) (8.3) Net Profit Gth (Pre-ex) (%) 32.2 (180.5) (239.6) 1.5 1.0 Margins Gross Margins (%) 18.8 16.4 23.3 19.4 19.3 Opg Profit Margins (%) 13.6 2.6 16.3 15.5 13.7 Net Profit Margins (%) 6.5 (5.2) 8.3 8.7 8.5
Balance Sheet (US$m)
FY Dec 2013A 2014A 2015F 2016F 2017F Net Fixed Assets 3,893 3,715 3,660 3,601 3,538 Invts in Associates & JVs 0.0 0.0 0.0 0.0 0.0 Other LT Assets 1,470 1,427 1,447 1,467 1,489 Cash & ST Invts 681 745 487 562 571 Inventory 103 96.7 51.0 43.7 40.1 Debtors 310 286 364 312 282 Other Current Assets 278 144 229 227 223 Total Assets 6,734 6,414 6,238 6,214 6,144 ST Debt 117 193 133 56.3 56.3 Creditor 327 351 442 379 261 Other Current Liab 330 231 242 254 267 LT Debt 2,033 1,688 1,347 1,348 1,293 Other LT Liabilities 732 693 693 693 693 Shareholder’s Equity 2,705 2,766 2,865 2,941 3,004 Minority Interests 490 492 516 542 569 Total Cap. & Liab. 6,734 6,414 6,238 6,214 6,144 Non-Cash Wkg. Capital 33.6 (55.4) (41.3) (50.2) 17.8 Net Cash/(Debt) (1,469) (1,135) (992) (842) (779) Debtors Turn (avg days) 43.7 32.7 42.0 50.9 49.5 Creditors Turn (avg days) 64.1 50.9 71.6 88.1 75.7 Inventory Turn (avg days) 12.4 15.0 13.3 10.2 9.9 Asset Turnover (x) 0.5 0.5 0.4 0.4 0.4 Current Ratio (x) 1.8 1.6 1.4 1.7 1.9 Quick Ratio (x) 1.3 1.3 1.0 1.3 1.5 Net Debt/Equity (X) 0.5 0.3 0.3 0.2 0.2 Net Debt/Equity ex MI (X) 0.5 0.4 0.3 0.3 0.3 Capex to Debt (%) 6.3 10.6 8.5 8.9 9.3 Z-Score (X) 1.3 1.4 1.3 1.3 1.4
Source: Company, DBS Vickers
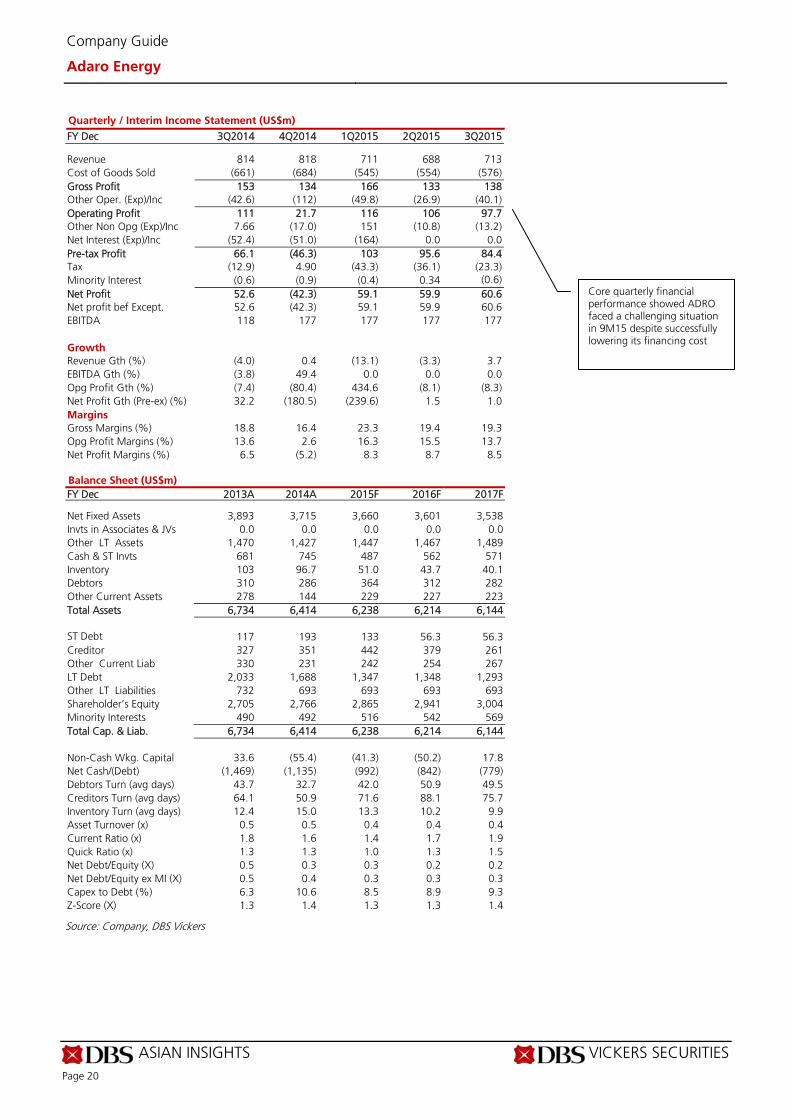
Core quarterly financial performance showed ADRO faced a challenging situation in 9M15 despite successfully lowering its financing cost

ASIAN INSIGHTS VICKERS SECURITIES Page 21
Company Guide
Adaro Energy
Cash Flow Statement (US$m)
FY Dec 2013A 2014A 2015F 2016F 2017F Pre-Tax Profit 425 325 381 302 252 Dep. & Amort. 169 176 180 184 188 Tax Paid (192) (142) (179) (142) (118) Assoc. & JV Inc/(loss) 0.0 0.0 0.0 0.0 0.0 Chg in Wkg.Cap. 321 54.2 59.1 (5.2) (84.5) Other Operating CF 2.00 1,033 18.7 19.3 19.9 Net Operating CF 724 1,447 460 358 257 Capital Exp.(net) (136) (200) (125) (125) (125) Other Invts.(net) (91.5) 6.40 (19.8) (20.8) (21.8) Invts in Assoc. & JV 0.0 0.0 0.0 0.0 0.0 Div from Assoc & JV 0.0 0.0 0.0 0.0 0.0 Other Investing CF 231 (692) (84.8) 2.00 3.87 Net Investing CF 3.63 (886) (230) (144) (143) Div Paid (75.5) (89.1) (98.1) (76.8) (63.2) Chg in Gross Debt (594) (269) (401) (75.1) (54.6) Capital Issues 0.0 0.0 0.0 0.0 0.0 Other Financing CF 317 (138) 11.5 12.1 12.7 Net Financing CF (353) (496) (488) (140) (105) Currency Adjustments 0.0 0.0 0.0 0.0 0.0 Chg in Cash 375 64.5 (258) 74.5 9.14 Opg CFPS (US cts.) 176 609 175 159 149 Free CFPS (US cts.) 257 545 146 102 57.8
Source: Company, DBS Vickers
Target Price & Ratings History
Source: DBS Vickers
S.No. Date Closing PriceTarget Price
Rating
1: 13 Apr 15 955 1030 HOLD
2: 04 May 15 845 1020 HOLD
3: 23 Jul 15 595 630 HOLD
4: 02 Sep 15 610 500 FULLY VALUED
5: 04 Sep 15 580 550 HOLD
6: 02 Nov 15 610 625 HOLD
Note: Share price and Target price are adjusted for corporate actions.
1 2
3
4
5
6
426
526
626
726
826
926
1026
Jan-15 May-15 Sep-15
Rp
Regular capex for existing concession maintenance and other minor expansion
ASIAN INSIGHTS VICKERS SECURITIES ed: TH / sa: MA
HOLD
Last Traded Price: Rp5,425 (JCI : 4,523.98) Price Target : Rp6,100 (12% upside) (Prev Rp6,900) Potential Catalyst: Double digit dividend yield Where we differ: Our view is that coal prices will stay at current low level
Analyst William Simadiputra +62 2130034939 [email protected]
Price Relative
Forecasts and Valuation FY Dec (US$m) 2014A 2015F 2016F 2017F Revenue 1,943 1,672 1,393 1,117 EBITDA 310 230 163 146 Pre-tax Profit 262 197 129 110 Net Profit 200 144 93.8 80.5 Net Pft (Pre Ex.) 200 144 93.8 80.5 Net Pft Gth (Pre-ex) (%) (13.1) (28.1) (34.8) (14.3) EPS (Rp) 2,478 1,782 1,161 996 EPS Pre Ex. (Rp) 2,478 1,782 1,161 996 EPS Gth Pre Ex (%) (13) (28) (35) (14) Diluted EPS (Rp) 2,478 1,782 1,161 996 Net DPS (Rp) 1,115 1,247 813 697 BV Per Share (Rp) 11,122 11,657 12,005 12,304 PE (X) 2.2 3.0 4.7 5.4 PE Pre Ex. (X) 2.2 3.0 4.7 5.4 P/Cash Flow (X) 1.9 1.5 3.0 3.3 EV/EBITDA (X) 0.7 0.2 0.1 0.0 Net Div Yield (%) 20.6 23.0 15.0 12.8 P/Book Value (X) 0.5 0.5 0.5 0.4 Net Debt/Equity (X) CASH CASH CASH CASH ROAE (%) 22.3 15.6 9.8 8.2 Earnings Rev (%): 0 (10) 1 Consensus EPS (Rp): 1,552 1,329 1,189 Other Broker Recs: B: 10 S: 5 H: 12
Source of all data: Company, DBS Vickers, Bloomberg Finance L.P
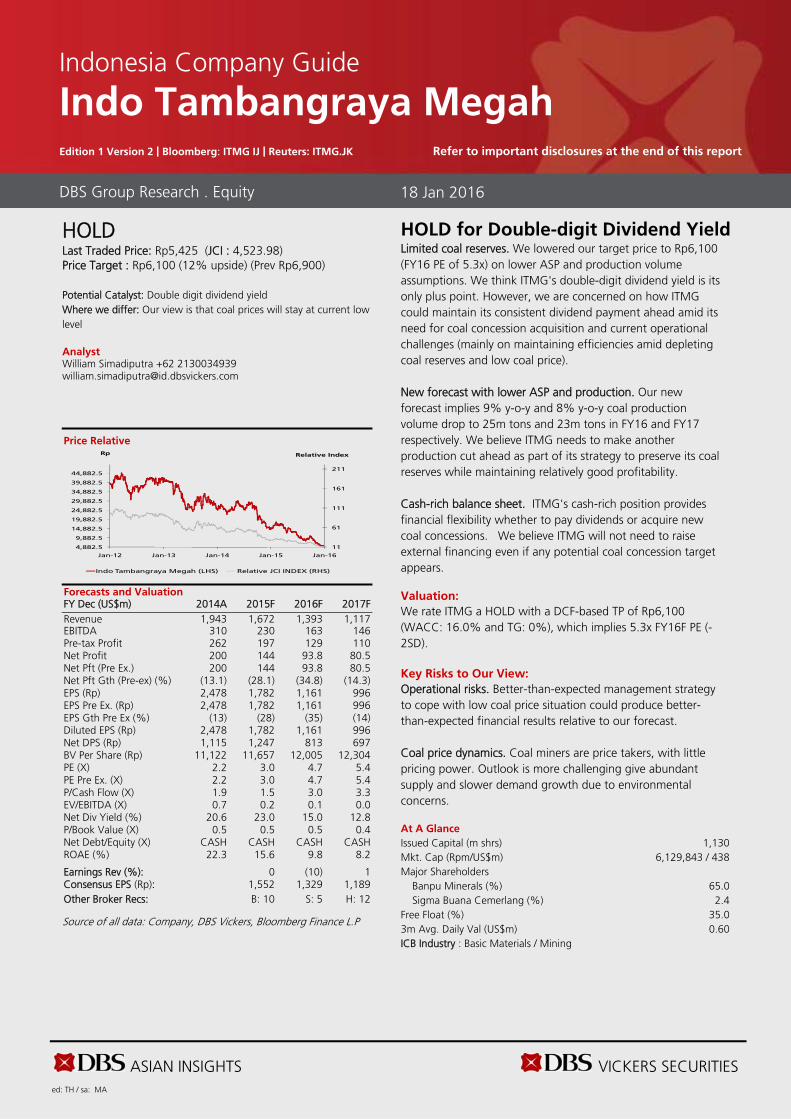
HOLD for Double-digit Dividend Yield Limited coal reserves. We lowered our target price to Rp6,100 (FY16 PE of 5.3x) on lower ASP and production volume assumptions. We think ITMG's double-digit dividend yield is its only plus point. However, we are concerned on how ITMG could maintain its consistent dividend payment ahead amid its need for coal concession acquisition and current operational challenges (mainly on maintaining efficiencies amid depleting coal reserves and low coal price). New forecast with lower ASP and production. Our new forecast implies 9% y-o-y and 8% y-o-y coal production volume drop to 25m tons and 23m tons in FY16 and FY17 respectively. We believe ITMG needs to make another production cut ahead as part of its strategy to preserve its coal reserves while maintaining relatively good profitability. Cash-rich balance sheet. ITMG's cash-rich position provides financial flexibility whether to pay dividends or acquire new coal concessions. We believe ITMG will not need to raise external financing even if any potential coal concession target appears. Valuation:
We rate ITMG a HOLD with a DCF-based TP of Rp6,100 (WACC: 16.0% and TG: 0%), which implies 5.3x FY16F PE (-2SD). Key Risks to Our View:
Operational risks. Better-than-expected management strategy to cope with low coal price situation could produce better-than-expected financial results relative to our forecast. Coal price dynamics. Coal miners are price takers, with little pricing power. Outlook is more challenging give abundant supply and slower demand growth due to environmental concerns. At A Glance Issued Capital (m shrs) 1,130 Mkt. Cap (Rpm/US$m) 6,129,843 / 438 Major Shareholders Banpu Minerals (%) 65.0 Sigma Buana Cemerlang (%) 2.4 Free Float (%) 35.0 3m Avg. Daily Val (US$m) 0.60 ICB Industry : Basic Materials / Mining
DBS Group Research . Equity 18 Jan 2016
Indonesia Company Guide
Indo Tambangraya Megah Edition 1 Version 2 | Bloomberg: ITMG IJ | Reuters: ITMG.JK Refer to important disclosures at the end of this report
11
61
111
161
211
4,882.5
9,882.5
14,882.5
19,882.5
24,882.5
29,882.5
34,882.5
39,882.5
44,882.5
Jan-12 Jan-13 Jan-14 Jan-15 Jan-16
Relative IndexRp
Indo Tambangraya Megah (LHS) Relative JCI INDEX (RHS)

ASIAN INSIGHTS VICKERS SECURITIES Page 23
Company Guide
Indo Tambangraya Megah
CRITICAL DATA POINTS TO WATCH
Earnings Drivers:
Earnings to drop further in FY16. We forecast earnings to drop by 35% y-o-y to US$94m in FY16 before dropping further by 14% to US$80m in FY16. FY16 and FY17 earnings will be dragged by a lower top line due to weaker ASP and lower sales volume. Production volume to be flat. In line with guidance and the group’s focus on profitability rather than production, we assumed production volume will drop to 25m tons and 23m tons in FY16 and FY17 respectively. ITMG’s mines have seven years left. We also assumed that blended strip ratio will drop to 9.3x from 9.9x last year. The lower strip ratio is possible this year if ITMG is able to secure purchase contracts for lower quality coal. Weaker ASP. There will be persistent oversupply ahead, and we forecast the benchmark coal price to remain low at US$55 per ton. This will affect ITMG’s coal pricing ahead. We assumed a lower ASP of US$55.7/ton for FY16. Our ASP assumption implies a 12% discount to our forecast benchmark price. Modest drop in cash cost. We expect cash cost to drop to US$37/ton (-10% y-o-y) in FY16 before falling further to US$32 in FY17 as management focuses on profitability rather than volume expansion. We also assumed that fuel cost would drop further to US$0.5/litre in FY16, on lower crude price. However, we see limited room for mining contracting fee to be renegotiated lower given ITMG’s flat volume. Miners with higher strip ratios will benefit from lower fuel cost. These include ITMG, which we believe will be the largest beneficiary of lower fuel cost because of high usage of machineries. The lower crude oil price has had a positive impact on ITMG’s profitability, as seen in 4Q14; fuel cost fell by 25% q-o-q to US$0.65/litre, and its cash cost fell to US$54.9/ton (-10% q-o-q).
Sales volume (m tons)
Avg selling price (US$/ton)
Cash cost (US$/ton)
Fuel cost (US$/liter)
Capex
Source: Company, DBS Vickers
29.5 29.127.5
2523
0.0
3.7
7.4
11.2
14.9
18.6
22.3
26.1
29.8
2013A 2014A 2015F 2016F 2017F
74.9
65.660.8
55.7
48.5
0.0
15.3
30.6
45.8
61.1
76.4
2013A 2014A 2015F 2016F 2017F
45.243.6
39.136.9
31.8
0.0
9.2
18.4
27.7
36.9
46.1
2013A 2014A 2015F 2016F 2017F
1 1
1
0 0
0.00
0.12
0.24
0.36
0.48
0.60
0.72
0.84
0.96
2013A 2014A 2015F 2016F 2017F
50 50
40 40 40
0.0
10.1
20.2
30.3
40.4
50.5
2013A 2014A 2015F 2016F 2017F

ASIAN INSIGHTS VICKERS SECURITIES Page 24
Company Guide
Indo Tambangraya Megah
Balance Sheet:
Cash-rich balance sheet. ITMG's cash-rich position provides financial flexibility whether to pay dividends or acquire new coal concessions. We believe ITMG will not need to raise external financing even if any potential coal concession target appears.
Share Price Drivers:
Stock de-rating on bleak industry outlook. ITMG’s stock price has de-rated because of concerns over its depleting reserves, but this could be a sign of a sizeable acquisition ahead to remain in operation. The limited reserves could also hurt earnings if it needs to cut output further, and reduce the ability to lower strip ratio.
Key Risks:
Drop in coal prices. Coal miners are price-takers, with little pricing power. And, the pricing outlook is more challenging now, given abundant supply and slower coal demand growth because of environmental concerns. Regulatory changes such as an export ban and increase in royalty fees. The coal industry is strictly regulated. Potential changes in policies such as an export ban, higher royalty fees, and production limits, could have an adverse impact on coal miners’ earnings. Operational risk. If ITMG fails to secure meaningful coal reserves in the future, it may have to halt operations. Moreover, the efficiency-focused strategy may not lead to meaningful reductions in cash cost. Profitability risk. We assume ITMG could maintain its cash margin by lowering its production based on our estimates. It is possible that ITMG may need to further cut its coal production volume if the remaining profitable concessions are lower than our expectations. Company Background
One of the largest coal mining companies owned by Banpu.
Leverage & Asset Turnover (x)
Capital Expenditure
ROE (%)
Forward PE Band (x)
PB Band (x)
Source: Company, DBS Vickers
0.8
0.9
1.0
1.1
1.2
1.3
1.4
1.5
1.6
0.00
0.01
0.01
0.02
0.02
0.03
0.03
0.04
0.04
0.05
0.05
2013A 2014A 2015F 2016F 2017F
Gross Debt to Equity (LHS) Asset Turnover (RHS)
0.0
20.0
40.0
60.0
80.0
100.0
120.0
2013A 2014A 2015F 2016F 2017F
Capital Expenditure (-)
US$
0.0%
5.0%
10.0%
15.0%
20.0%
2013A 2014A 2015F 2016F 2017F
Avg: 13.3x
+1sd: 17.3x
+2sd: 21.3x
‐1sd: 9.3x
‐2sd: 5.4x4.2
6.2
8.2
10.2
12.2
14.2
16.2
18.2
20.2
22.2
Jan-12 Jan-13 Jan-14 Jan-15
(x)
Avg: 3.15x
+1sd: 4.76x
+2sd: 6.38x
‐1sd: 1.53x
0.0
1.0
2.0
3.0
4.0
5.0
6.0
7.0
Jan-12 Jan-13 Jan-14 Jan-15
(x)
ASIAN INSIGHTS VICKERS SECURITIES Page 25
Company Guide
Indo Tambangraya Megah
Key Assumptions
FY Dec 2013A 2014A 2015F 2016F 2017F Sales volume (m tons) 29.5 29.1 27.5 25.0 23.0 Avg selling price (US$/ton) 74.9 65.6 60.8 55.7 48.5 Cash cost (US$/ton) 45.2 43.6 39.1 36.9 31.8 Fuel cost (US$/liter) 0.95 0.95 0.65 0.47 0.47 Capex 50.0 50.0 40.0 40.0 40.0
Income Statement (US$m)
FY Dec 2013A 2014A 2015F 2016F 2017F Revenue 2,179 1,943 1,672 1,393 1,117 Cost of Goods Sold (1,670) (1,535) (1,356) (1,168) (940) Gross Profit 509 408 317 224 177 Other Opng (Exp)/Inc (172) (172) (142) (118) (89.3) Operating Profit 337 236 175 106 87.7 Other Non Opg (Exp)/Inc (24.5) 20.7 0.0 0.0 0.0 Associates & JV Inc 0.0 0.0 0.0 0.0 0.0 Net Interest (Exp)/Inc 7.95 5.37 22.5 22.5 22.5 Exceptional Gain/(Loss) 0.0 0.0 0.0 0.0 0.0 Pre-tax Profit 321 262 197 129 110 Tax (90.5) (61.8) (53.2) (34.7) (29.8) Minority Interest 0.0 0.0 0.0 0.0 0.0 Preference Dividend 0.0 0.0 0.0 0.0 0.0 Net Profit 230 200 144 93.8 80.5 Net Profit before Except. 230 200 144 93.8 80.5 EBITDA 313 310 230 163 146 Growth Revenue Gth (%) (10.7) (10.8) (13.9) (16.7) (19.8) EBITDA Gth (%) (50.7) (0.9) (26.0) (29.2) (10.3) Opg Profit Gth (%) (39.6) (30.1) (26.0) (39.3) (17.3) Net Profit Gth (Pre-ex) (%) (46.7) (13.1) (28.1) (34.8) (14.3) Margins & Ratio Gross Margins (%) 23.4 21.0 18.9 16.1 15.9 Opg Profit Margin (%) 15.5 12.1 10.4 7.6 7.9 Net Profit Margin (%) 10.6 10.3 8.6 6.7 7.2 ROAE (%) 24.4 22.3 15.6 9.8 8.2 ROA (%) 16.4 15.2 10.7 6.8 5.8 ROCE (%) 24.3 19.0 13.2 7.7 6.2 Div Payout Ratio (%) 42.7 39.1 50.3 45.6 60.0 Net Interest Cover (x) NM NM NM NM NM
Source: Company, DBS Vickers
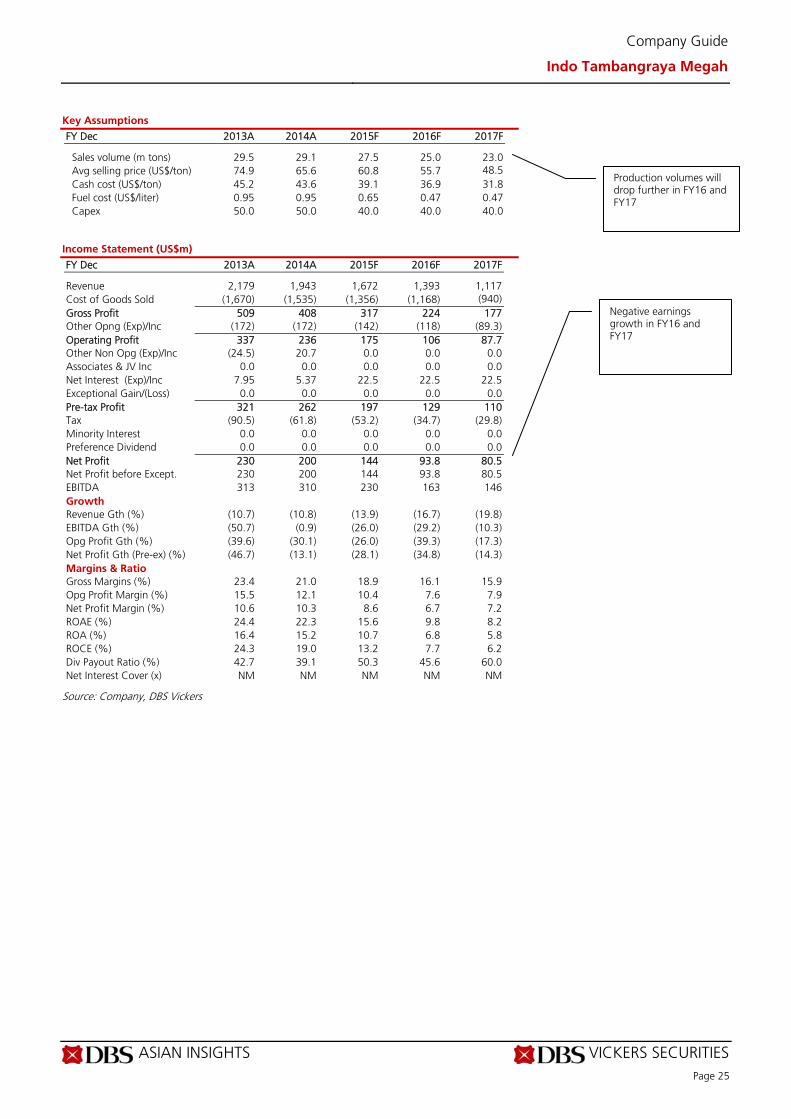
Production volumes will drop further in FY16 and FY17
Negative earnings growth in FY16 and FY17

ASIAN INSIGHTS VICKERS SECURITIES Page 26
Company Guide
Indo Tambangraya Megah
Quarterly / Interim Income Statement (US$m)
FY Dec 3Q2014 4Q2014 1Q2015 2Q2015 3Q2015 Revenue 522 455 428 397 382 Cost of Goods Sold (431) (362) (329) (322) (296) Gross Profit 91.9 92.9 99.0 75.2 85.6 Other Oper. (Exp)/Inc (44.0) (49.7) (39.7) (37.5) (36.2) Operating Profit 47.9 43.2 59.3 37.7 49.4 Other Non Opg (Exp)/Inc (14.3) (11.8) 1.50 (8.1) (11.5) Net Interest (Exp)/Inc 0.0 0.28 0.99 0.95 0.91 Pre-tax Profit 33.6 30.4 61.8 30.6 38.7 Tax (12.7) 0.94 (24.0) (10.4) (13.8) Net Profit 20.9 31.4 37.8 20.2 24.9 Net profit bef Except. 20.9 31.4 37.8 20.2 24.9 EBITDA 33.6 30.2 74.0 55.0 55.0 Growth Revenue Gth (%) 13.2 (12.9) (6.0) (7.2) (3.7) EBITDA Gth (%) (43.7) (10.2) 145.4 (25.7) 0.0 Opg Profit Gth (%) (7.4) (9.9) 37.3 (36.3) 30.8 Net Profit Gth (Pre-ex) (%) (60.1) 50.1 20.5 (46.4) 23.1 Margins Gross Margins (%) 17.6 20.4 23.1 19.0 22.4 Opg Profit Margins (%) 9.2 9.5 13.9 9.5 12.9 Net Profit Margins (%) 4.0 6.9 8.8 5.1 6.5
Balance Sheet (US$m)
FY Dec 2013A 2014A 2015F 2016F 2017F Net Fixed Assets 317 286 271 264 256 Invts in Associates & JVs 0.0 0.0 0.0 0.0 0.0 Other LT Assets 404 452 475 498 523 Cash & ST Invts 289 226 383 416 442 Inventory 118 150 67.5 58.2 46.8 Debtors 169 170 152 126 101 Other Current Assets 30.1 23.2 24.4 25.6 26.9 Total Assets 1,327 1,307 1,372 1,389 1,397 ST Debt 0.0 0.0 0.0 0.0 0.0 Creditor 166 166 175 151 121 Other Current Liab 209 199 208 219 230 LT Debt 0.0 0.0 0.0 0.0 0.0 Other LT Liabilities 53.6 44.6 46.8 49.1 51.6 Shareholder’s Equity 898 899 942 970 994 Minority Interests 0.0 0.0 0.0 0.0 0.0 Total Cap. & Liab. 1,327 1,307 1,372 1,389 1,397 Non-Cash Wkg. Capital (56.8) (20.7) (140) (159) (176) Net Cash/(Debt) 289 226 383 416 442 Debtors Turn (avg days) 33.0 31.9 35.2 36.5 37.3 Creditors Turn (avg days) 38.4 40.8 47.8 53.5 56.3 Inventory Turn (avg days) 29.4 33.1 30.5 20.6 21.7 Asset Turnover (x) 1.6 1.5 1.2 1.0 0.8 Current Ratio (x) 1.6 1.6 1.6 1.7 1.8 Quick Ratio (x) 1.2 1.1 1.4 1.5 1.5 Net Debt/Equity (X) CASH CASH CASH CASH CASH Net Debt/Equity ex MI (X) CASH CASH CASH CASH CASH Capex to Debt (%) N/A N/A N/A N/A N/A Z-Score (X) 4.2 4.1 3.6 3.5 3.3
Source: Company, DBS Vickers
Quarterly growth showed weakening trend on lower ASP and production volume
However, ITMG successfully maintains relatively stable profitability
Net cash position provide ITMG flexibility whether to pay dividends or pursue coal concessions acquisition
ASIAN INSIGHTS VICKERS SECURITIES Page 27
Company Guide
Indo Tambangraya Megah
Cash Flow Statement (US$m)
FY Dec 2013A 2014A 2015F 2016F 2017F Pre-Tax Profit 321 262 197 129 110 Dep. & Amort. 55.2 53.6 55.0 56.6 58.3 Tax Paid 0.0 0.0 0.0 0.0 0.0 Assoc. & JV Inc/(loss) 0.0 0.0 0.0 0.0 0.0 Chg in Wkg.Cap. 170 (25.6) 109 9.35 5.68 Other Operating CF (339) (57.9) (64.2) (46.2) (41.8) Net Operating CF 207 232 297 148 132 Capital Exp.(net) (50.0) (106) (40.0) (50.0) (50.0) Other Invts.(net) 0.0 0.0 0.0 0.0 0.0 Invts in Assoc. & JV 0.0 0.0 0.0 0.0 0.0 Div from Assoc & JV 0.0 0.0 0.0 0.0 0.0 Other Investing CF (92.3) (79.1) (11.7) (12.2) (12.8) Net Investing CF (142) (185) (51.7) (62.2) (62.8) Div Paid (184) (90.1) (101) (65.7) (56.3) Chg in Gross Debt 0.0 0.0 0.0 0.0 0.0 Capital Issues 0.0 0.0 0.0 0.0 0.0 Other Financing CF (40.6) (19.6) 12.2 12.8 13.4 Net Financing CF (225) (110) (88.6) (52.9) (42.9) Currency Adjustments 0.0 0.0 0.0 0.0 0.0 Chg in Cash (160) (62.6) 157 33.2 26.6 Opg CFPS (US cts.) 458 3,191 2,326 1,720 1,568 Free CFPS (US cts.) 1,941 1,561 3,179 1,217 1,019
Source: Company, DBS Vickers
Target Price & Ratings History
Source: DBS Vickers
S.No. Date Closing PriceTarget Price
Rating
1: 13 Apr 15 15050 18500 HOLD
2: 12 May 15 15350 18500 HOLD
3: 23 Jul 15 10375 11100 HOLD
4: 14 Aug 15 9500 11100 HOLD
5: 04 Sep 15 8625 8000 HOLD
6: 11 Nov 15 7700 8000 HOLD
7: 03 Dec 15 6600 6900 HOLD
Note: Share price and Target price are adjusted for corporate actions.
1
2
3
4
5
6
75153
7153
9153
11153
13153
15153
17153
19153
Jan-15 May-15 Sep-15
Rp
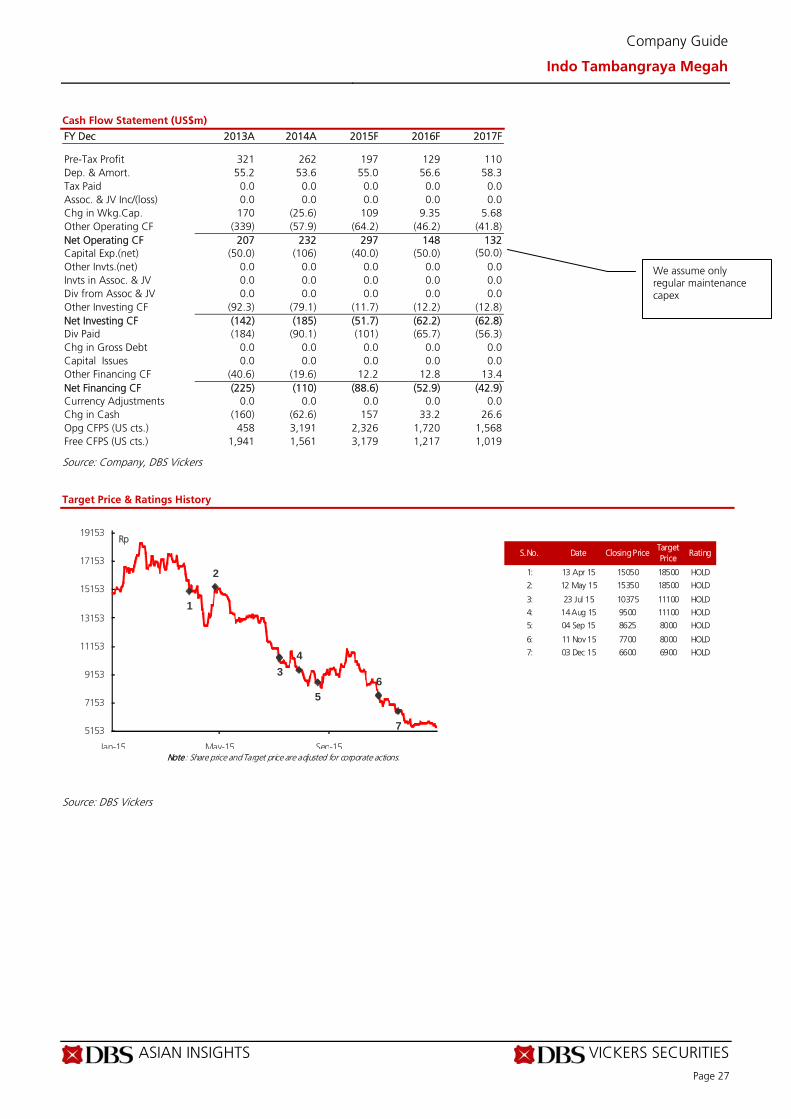
We assume only regular maintenance capex

ASIAN INSIGHTS VICKERS SECURITIES ed: TH / sa: MA
FULLY VALUED Last Traded Price: Rp670 (JCI : 4,523.98) Price Target : Rp450 (33% downside) (Prev Rp700) Potential Catalyst: Coal concession acquisition Where we differ: We believe HRUM is the most negatively impacted by the low coal price trend Analyst William Simadiputra +62 2130034939 [email protected]
Price Relative
Forecasts and Valuation FY Dec (US$m) 2014A 2015F 2016F 2017F Revenue 478 285 183 183 EBITDA 32.1 29.4 12.6 17.6 Pre-tax Profit 24.1 25.5 11.7 16.2 Net Profit 0.41 15.0 6.78 9.57 Net Pft (Pre Ex.) 0.41 15.0 6.78 9.57 Net Pft Gth (Pre-ex) (%) (99.0) 3,552.0 (54.8) 41.2 EPS (Rp) 2.13 77.7 35.1 49.6 EPS Pre Ex. (Rp) 2.13 77.7 35.1 49.6 EPS Gth Pre Ex (%) (99) 3,552 (55) 41 Diluted EPS (Rp) 2.13 77.7 35.1 49.6 Net DPS (Rp) 155 23.3 10.5 14.9 BV Per Share (Rp) 1,490 1,544 1,569 1,603 PE (X) 314.9 8.6 19.1 13.5 PE Pre Ex. (X) 314.9 8.6 19.1 13.5 P/Cash Flow (X) 2.4 nm 4.8 5.8 EV/EBITDA (X) 0.1 1.1 1.7 1.0 Net Div Yield (%) 23.1 3.5 1.6 2.2 P/Book Value (X) 0.4 0.4 0.4 0.4 Net Debt/Equity (X) CASH CASH CASH CASH ROAE (%) 0.1 5.1 2.3 3.1 Earnings Rev (%): 0 (60) (11) Consensus EPS (Rp): 28.0 42.0 69.9 Other Broker Recs: B: 0 S: 7 H: 5
Source of all data: Company, DBS Vickers, Bloomberg Finance L.P
Fragile Lowering our TP to Rp450, reiterate FULLY VALUED. We see HRUM's earnings outlook to be sensitive to its execution capability to maintain profitability amid the lower ASP and coal reserve outlook. Cut our FY16 and FY17 earnings forecast by 29% and 11% on lower production volume and ASP respectively. We believe HRUM needs to lower its production volume on new lower ASP assumption in order to stay at positive earnings. Prioritising profitability. We assume HRUM could lower its cash cost per ton by 8% in FY16 and FY17 relative to our previous forecast. HRUM will focus on shortening its overburden hauling distances and maintaining equipment productivities. Limited reserves, acquisition is key. Since HRUM has not found any strong acquisition candidate yet, the company will continue its exploration programme at its Santan Batu Bara (SBB) Biarawa block in 2016. HRUM believes the block hosts the largest coal resources and resources relative to the rest of the blocks at SBB. Valuation:
We rate HRUM as FULLY VALUED with a target price of Rp450, which implies 13.9x FY16F PE. Our DCF-based TP assumes 15.1% WACC and 0% terminal growth. Key Risks to Our View:
Coal price. Coal price is the key risk for coal miners, as they are price takers with minimal pricing power. Outlook is more challenging due to abundant supply and slower coal demand growth due to environmental concerns. However, on the other hand, if the coal price rebounds, we will need to reverse back our miners' reserve assumption and target price. Concession acquisition. If HRUM announces any new reserve acquisition, we should add the new reserves to our forecast and valuation, resulting in a higher target price. At A Glance Issued Capital (m shrs) 2,704 Mkt. Cap (Rpm/US$m) 1,811,425 / 130 Major Shareholders Karuni Bara Perkasa (%) 69.7 Free Float (%) 30.2 3m Avg. Daily Val (US$m) 0.04 ICB Industry : Basic Materials / Mining
DBS Group Research . Equity 18 Jan 2016
Indonesia Company Guide
Harum Energy Edition 1 Version 2 | Bloomberg: HRUM IJ | Reuters: HRUM.JK Refer to important disclosures at the end of this report
7
57
107
157
207
603.0
1,603.0
2,603.0
3,603.0
4,603.0
5,603.0
6,603.0
7,603.0
8,603.0
9,603.0
Jan-12 Jan-13 Jan-14 Jan-15 Jan-16
Relative IndexRp
Harum Energy (LHS) Relative JCI INDEX (RHS)
ASIAN INSIGHTS VICKERS SECURITIES Page 29
Company Guide
Harum Energy
CRITICAL DATA POINTS TO WATCH
Earnings Drivers:
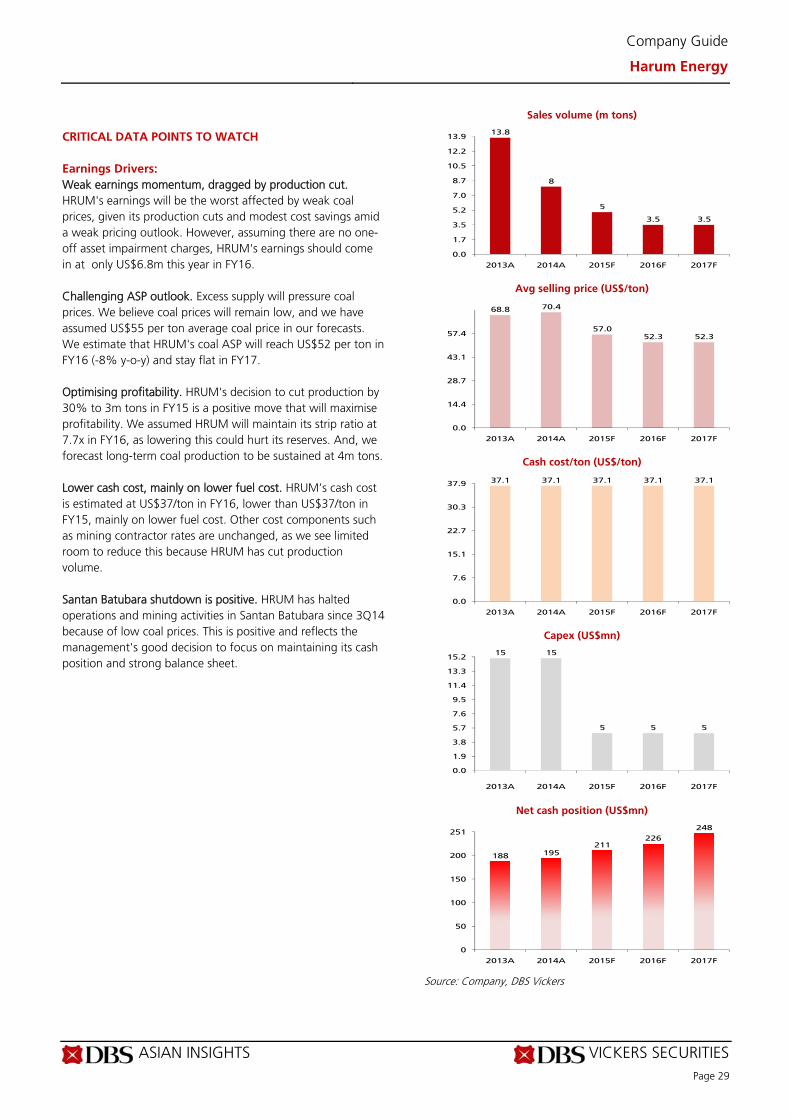
Weak earnings momentum, dragged by production cut. HRUM's earnings will be the worst affected by weak coal prices, given its production cuts and modest cost savings amid a weak pricing outlook. However, assuming there are no one-off asset impairment charges, HRUM's earnings should come in at only US$6.8m this year in FY16. Challenging ASP outlook. Excess supply will pressure coal prices. We believe coal prices will remain low, and we have assumed US$55 per ton average coal price in our forecasts. We estimate that HRUM's coal ASP will reach US$52 per ton in FY16 (-8% y-o-y) and stay flat in FY17.
Optimising profitability. HRUM's decision to cut production by 30% to 3m tons in FY15 is a positive move that will maximise profitability. We assumed HRUM will maintain its strip ratio at 7.7x in FY16, as lowering this could hurt its reserves. And, we forecast long-term coal production to be sustained at 4m tons. Lower cash cost, mainly on lower fuel cost. HRUM’s cash cost is estimated at US$37/ton in FY16, lower than US$37/ton in FY15, mainly on lower fuel cost. Other cost components such as mining contractor rates are unchanged, as we see limited room to reduce this because HRUM has cut production volume. Santan Batubara shutdown is positive. HRUM has halted operations and mining activities in Santan Batubara since 3Q14 because of low coal prices. This is positive and reflects the management's good decision to focus on maintaining its cash position and strong balance sheet.
Sales volume (m tons)
Avg selling price (US$/ton)
Cash cost/ton (US$/ton)
Capex (US$mn)
Net cash position (US$mn)
Source: Company, DBS Vickers
13.8
8
5
3.5 3.5
0.0
1.7
3.5
5.2
7.0
8.7
10.5
12.2
13.9
2013A 2014A 2015F 2016F 2017F
68.8 70.4
57.052.3 52.3
0.0
14.4
28.7
43.1
57.4
2013A 2014A 2015F 2016F 2017F
37.1 37.1 37.1 37.1 37.1
0.0
7.6
15.1
22.7
30.3
37.9
2013A 2014A 2015F 2016F 2017F
15 15
5 5 5
0.0
1.9
3.8
5.7
7.6
9.5
11.4
13.3
15.2
2013A 2014A 2015F 2016F 2017F
188 195211
226
248
0
50
100
150
200
251
2013A 2014A 2015F 2016F 2017F
ASIAN INSIGHTS VICKERS SECURITIES Page 30
Company Guide
Harum Energy
Balance Sheet:
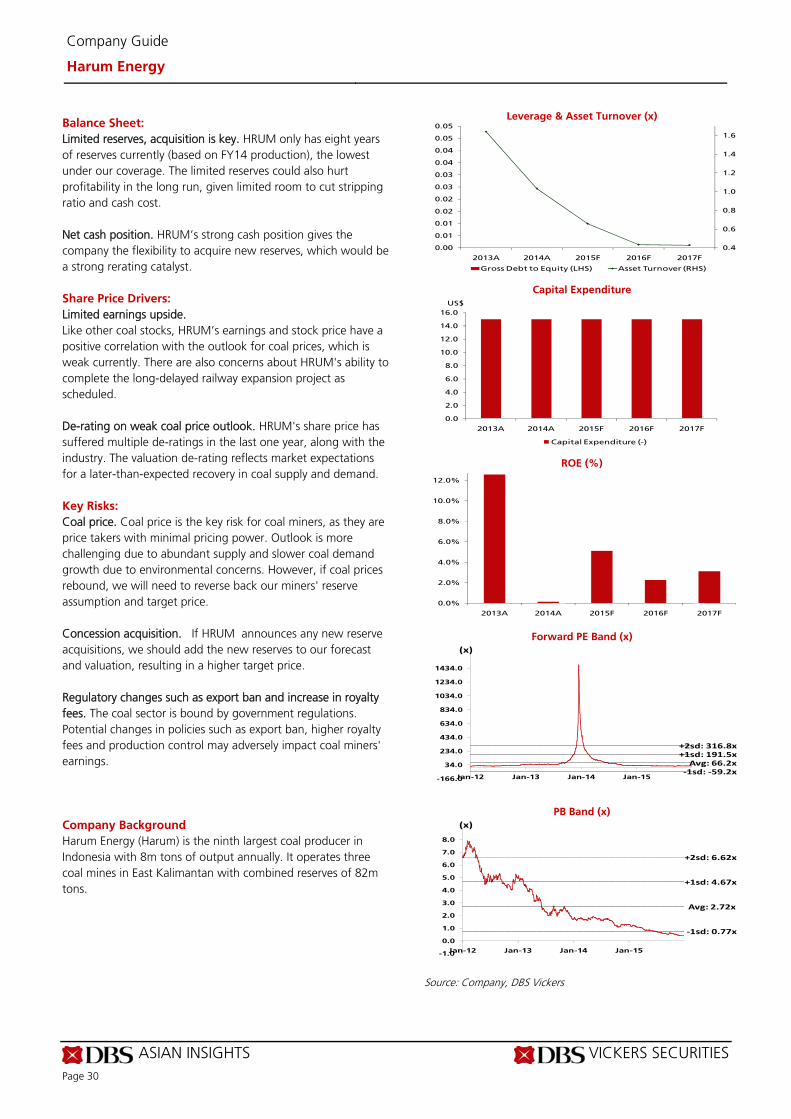
Limited reserves, acquisition is key. HRUM only has eight years of reserves currently (based on FY14 production), the lowest under our coverage. The limited reserves could also hurt profitability in the long run, given limited room to cut stripping ratio and cash cost. Net cash position. HRUM’s strong cash position gives the company the flexibility to acquire new reserves, which would be a strong rerating catalyst.
Share Price Drivers:
Limited earnings upside. Like other coal stocks, HRUM’s earnings and stock price have a positive correlation with the outlook for coal prices, which is weak currently. There are also concerns about HRUM's ability to complete the long-delayed railway expansion project as scheduled. De-rating on weak coal price outlook. HRUM's share price has suffered multiple de-ratings in the last one year, along with the industry. The valuation de-rating reflects market expectations for a later-than-expected recovery in coal supply and demand.
Key Risks:
Coal price. Coal price is the key risk for coal miners, as they are price takers with minimal pricing power. Outlook is more challenging due to abundant supply and slower coal demand growth due to environmental concerns. However, if coal prices rebound, we will need to reverse back our miners' reserve assumption and target price. Concession acquisition. If HRUM announces any new reserve acquisitions, we should add the new reserves to our forecast and valuation, resulting in a higher target price. Regulatory changes such as export ban and increase in royalty fees. The coal sector is bound by government regulations. Potential changes in policies such as export ban, higher royalty fees and production control may adversely impact coal miners' earnings.
Company Background
Harum Energy (Harum) is the ninth largest coal producer in Indonesia with 8m tons of output annually. It operates three coal mines in East Kalimantan with combined reserves of 82m tons.
Leverage & Asset Turnover (x)
Capital Expenditure
ROE (%)
Forward PE Band (x)
PB Band (x)
Source: Company, DBS Vickers
0.4
0.6
0.8
1.0
1.2
1.4
1.6
0.00
0.01
0.01
0.02
0.02
0.03
0.03
0.04
0.04
0.05
0.05
2013A 2014A 2015F 2016F 2017F
Gross Debt to Equity (LHS) Asset Turnover (RHS)
0.0
2.0
4.0
6.0
8.0
10.0
12.0
14.0
16.0
2013A 2014A 2015F 2016F 2017F
Capital Expenditure (-)
US$
0.0%
2.0%
4.0%
6.0%
8.0%
10.0%
12.0%
2013A 2014A 2015F 2016F 2017F
Avg: 66.2x+1sd: 191.5x+2sd: 316.8x
‐1sd: ‐59.2x-166.0
34.0
234.0
434.0
634.0
834.0
1034.0
1234.0
1434.0
Jan-12 Jan-13 Jan-14 Jan-15
(x)
Avg: 2.72x
+1sd: 4.67x
+2sd: 6.62x
‐1sd: 0.77x
-1.0
0.0
1.0
2.0
3.0
4.0
5.0
6.0
7.0
8.0
Jan-12 Jan-13 Jan-14 Jan-15
(x)
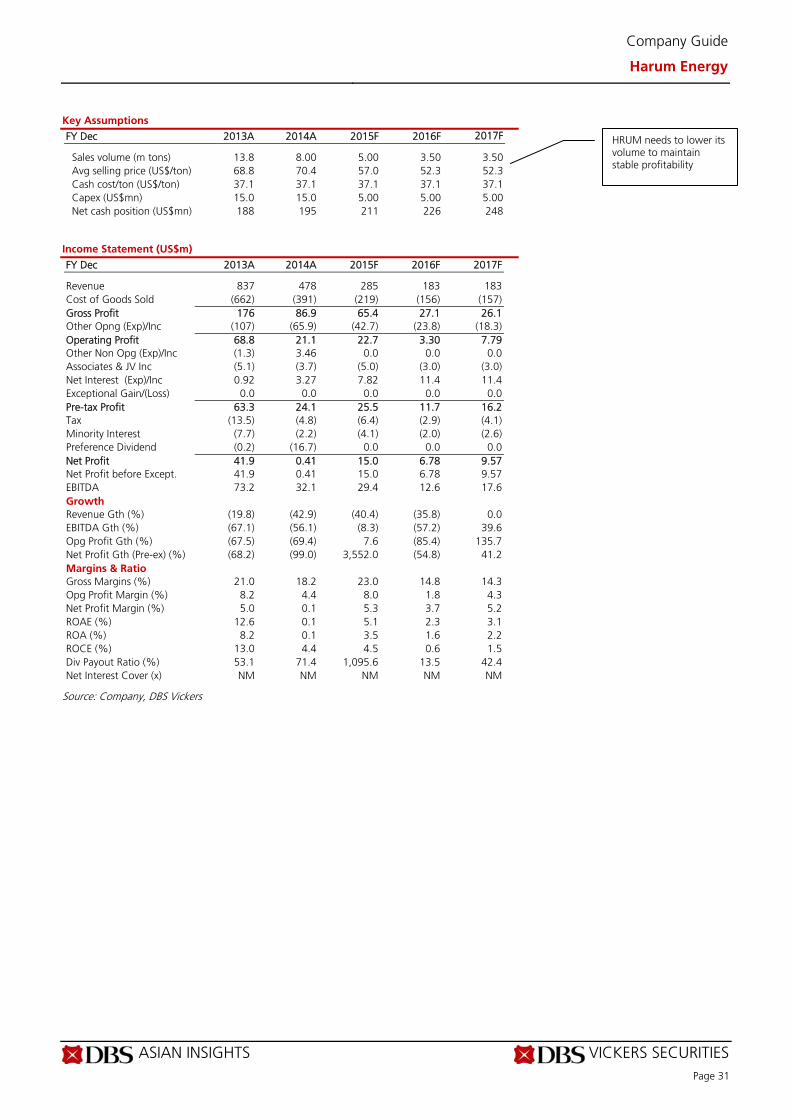
ASIAN INSIGHTS VICKERS SECURITIES Page 31
Company Guide
Harum Energy
Key Assumptions
FY Dec 2013A 2014A 2015F 2016F 2017F Sales volume (m tons) 13.8 8.00 5.00 3.50 3.50 Avg selling price (US$/ton) 68.8 70.4 57.0 52.3 52.3 Cash cost/ton (US$/ton) 37.1 37.1 37.1 37.1 37.1 Capex (US$mn) 15.0 15.0 5.00 5.00 5.00 Net cash position (US$mn) 188 195 211 226 248
Income Statement (US$m)
FY Dec 2013A 2014A 2015F 2016F 2017F Revenue 837 478 285 183 183 Cost of Goods Sold (662) (391) (219) (156) (157) Gross Profit 176 86.9 65.4 27.1 26.1 Other Opng (Exp)/Inc (107) (65.9) (42.7) (23.8) (18.3) Operating Profit 68.8 21.1 22.7 3.30 7.79 Other Non Opg (Exp)/Inc (1.3) 3.46 0.0 0.0 0.0 Associates & JV Inc (5.1) (3.7) (5.0) (3.0) (3.0) Net Interest (Exp)/Inc 0.92 3.27 7.82 11.4 11.4 Exceptional Gain/(Loss) 0.0 0.0 0.0 0.0 0.0 Pre-tax Profit 63.3 24.1 25.5 11.7 16.2 Tax (13.5) (4.8) (6.4) (2.9) (4.1) Minority Interest (7.7) (2.2) (4.1) (2.0) (2.6) Preference Dividend (0.2) (16.7) 0.0 0.0 0.0 Net Profit 41.9 0.41 15.0 6.78 9.57 Net Profit before Except. 41.9 0.41 15.0 6.78 9.57 EBITDA 73.2 32.1 29.4 12.6 17.6 Growth Revenue Gth (%) (19.8) (42.9) (40.4) (35.8) 0.0 EBITDA Gth (%) (67.1) (56.1) (8.3) (57.2) 39.6 Opg Profit Gth (%) (67.5) (69.4) 7.6 (85.4) 135.7 Net Profit Gth (Pre-ex) (%) (68.2) (99.0) 3,552.0 (54.8) 41.2 Margins & Ratio Gross Margins (%) 21.0 18.2 23.0 14.8 14.3 Opg Profit Margin (%) 8.2 4.4 8.0 1.8 4.3 Net Profit Margin (%) 5.0 0.1 5.3 3.7 5.2 ROAE (%) 12.6 0.1 5.1 2.3 3.1 ROA (%) 8.2 0.1 3.5 1.6 2.2 ROCE (%) 13.0 4.4 4.5 0.6 1.5 Div Payout Ratio (%) 53.1 71.4 1,095.6 13.5 42.4 Net Interest Cover (x) NM NM NM NM NM
Source: Company, DBS Vickers
HRUM needs to lower its volume to maintain stable profitability
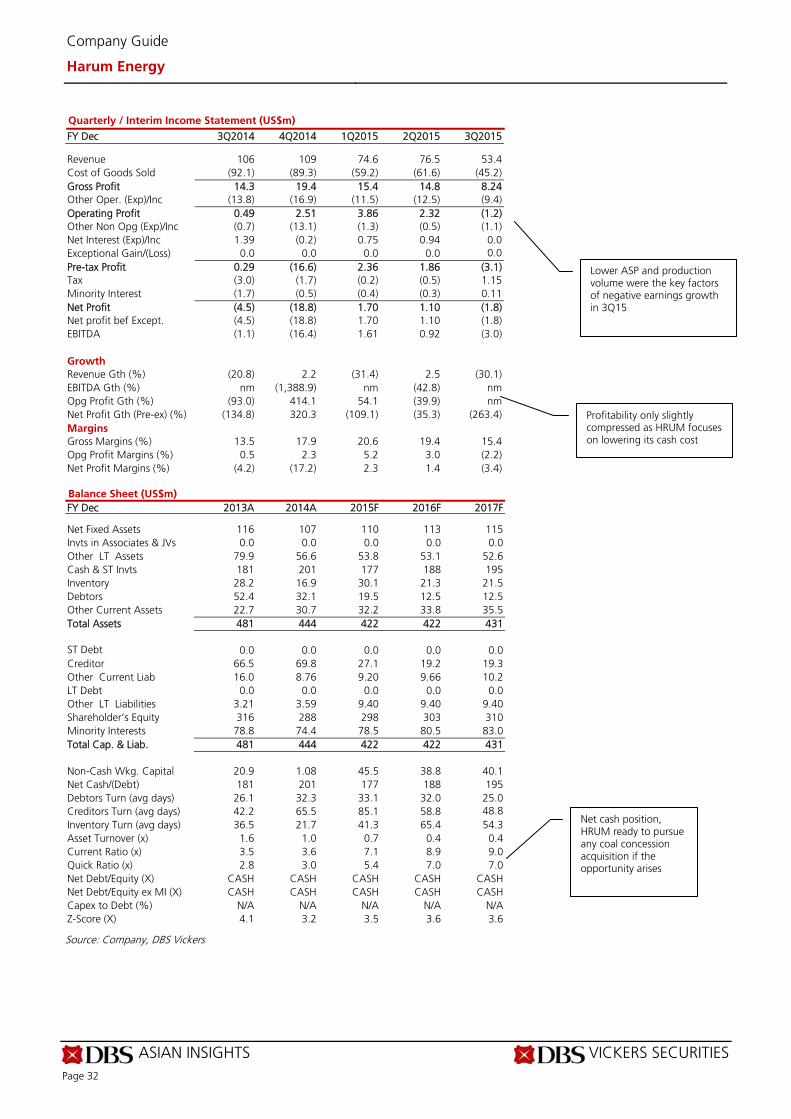
ASIAN INSIGHTS VICKERS SECURITIES Page 32
Company Guide
Harum Energy
Quarterly / Interim Income Statement (US$m)
FY Dec 3Q2014 4Q2014 1Q2015 2Q2015 3Q2015 Revenue 106 109 74.6 76.5 53.4 Cost of Goods Sold (92.1) (89.3) (59.2) (61.6) (45.2) Gross Profit 14.3 19.4 15.4 14.8 8.24 Other Oper. (Exp)/Inc (13.8) (16.9) (11.5) (12.5) (9.4) Operating Profit 0.49 2.51 3.86 2.32 (1.2) Other Non Opg (Exp)/Inc (0.7) (13.1) (1.3) (0.5) (1.1) Net Interest (Exp)/Inc 1.39 (0.2) 0.75 0.94 0.0 Exceptional Gain/(Loss) 0.0 0.0 0.0 0.0 0.0 Pre-tax Profit 0.29 (16.6) 2.36 1.86 (3.1) Tax (3.0) (1.7) (0.2) (0.5) 1.15 Minority Interest (1.7) (0.5) (0.4) (0.3) 0.11 Net Profit (4.5) (18.8) 1.70 1.10 (1.8) Net profit bef Except. (4.5) (18.8) 1.70 1.10 (1.8) EBITDA (1.1) (16.4) 1.61 0.92 (3.0) Growth Revenue Gth (%) (20.8) 2.2 (31.4) 2.5 (30.1) EBITDA Gth (%) nm (1,388.9) nm (42.8) nm Opg Profit Gth (%) (93.0) 414.1 54.1 (39.9) nm Net Profit Gth (Pre-ex) (%) (134.8) 320.3 (109.1) (35.3) (263.4) Margins Gross Margins (%) 13.5 17.9 20.6 19.4 15.4 Opg Profit Margins (%) 0.5 2.3 5.2 3.0 (2.2) Net Profit Margins (%) (4.2) (17.2) 2.3 1.4 (3.4)
Balance Sheet (US$m)
FY Dec 2013A 2014A 2015F 2016F 2017F Net Fixed Assets 116 107 110 113 115 Invts in Associates & JVs 0.0 0.0 0.0 0.0 0.0 Other LT Assets 79.9 56.6 53.8 53.1 52.6 Cash & ST Invts 181 201 177 188 195 Inventory 28.2 16.9 30.1 21.3 21.5 Debtors 52.4 32.1 19.5 12.5 12.5 Other Current Assets 22.7 30.7 32.2 33.8 35.5 Total Assets 481 444 422 422 431 ST Debt 0.0 0.0 0.0 0.0 0.0 Creditor 66.5 69.8 27.1 19.2 19.3 Other Current Liab 16.0 8.76 9.20 9.66 10.2 LT Debt 0.0 0.0 0.0 0.0 0.0 Other LT Liabilities 3.21 3.59 9.40 9.40 9.40 Shareholder’s Equity 316 288 298 303 310 Minority Interests 78.8 74.4 78.5 80.5 83.0 Total Cap. & Liab. 481 444 422 422 431 Non-Cash Wkg. Capital 20.9 1.08 45.5 38.8 40.1 Net Cash/(Debt) 181 201 177 188 195 Debtors Turn (avg days) 26.1 32.3 33.1 32.0 25.0 Creditors Turn (avg days) 42.2 65.5 85.1 58.8 48.8 Inventory Turn (avg days) 36.5 21.7 41.3 65.4 54.3 Asset Turnover (x) 1.6 1.0 0.7 0.4 0.4 Current Ratio (x) 3.5 3.6 7.1 8.9 9.0 Quick Ratio (x) 2.8 3.0 5.4 7.0 7.0 Net Debt/Equity (X) CASH CASH CASH CASH CASH Net Debt/Equity ex MI (X) CASH CASH CASH CASH CASH Capex to Debt (%) N/A N/A N/A N/A N/A Z-Score (X) 4.1 3.2 3.5 3.6 3.6
Source: Company, DBS Vickers
Lower ASP and production volume were the key factors of negative earnings growth in 3Q15
Profitability only slightly compressed as HRUM focuses on lowering its cash cost
Net cash position, HRUM ready to pursue any coal concession acquisition if the opportunity arises
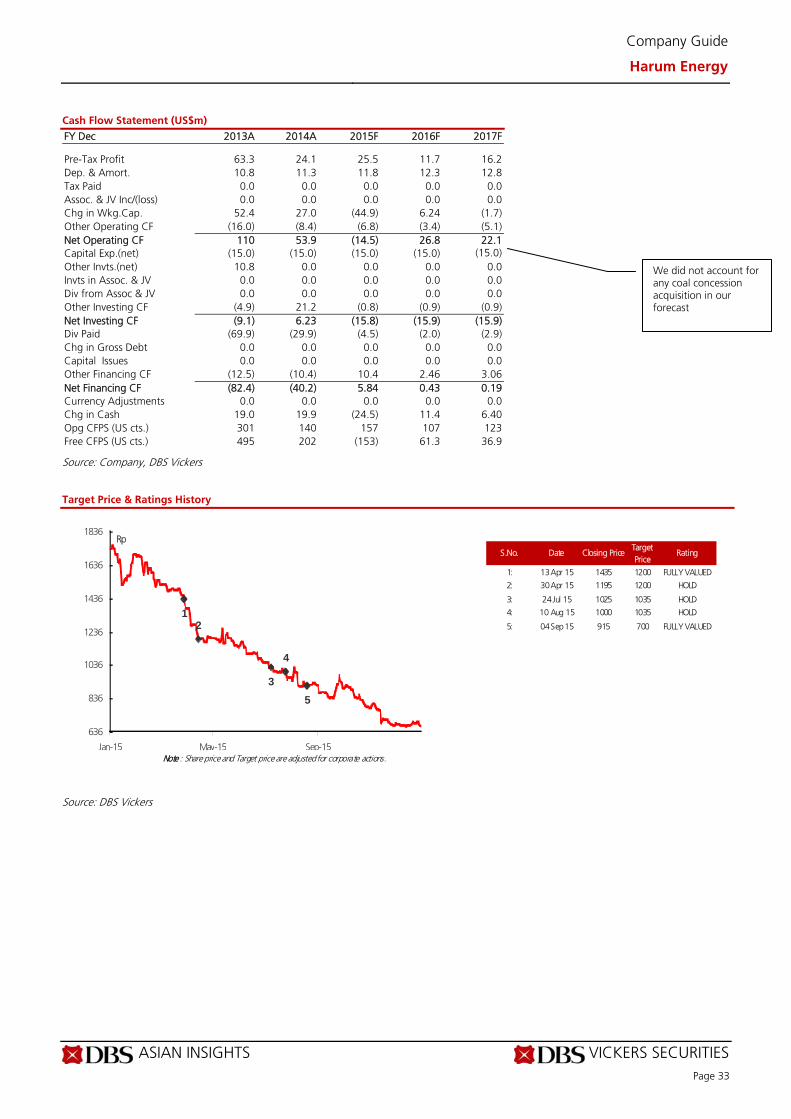
ASIAN INSIGHTS VICKERS SECURITIES Page 33
Company Guide
Harum Energy
Cash Flow Statement (US$m)
FY Dec 2013A 2014A 2015F 2016F 2017F Pre-Tax Profit 63.3 24.1 25.5 11.7 16.2 Dep. & Amort. 10.8 11.3 11.8 12.3 12.8 Tax Paid 0.0 0.0 0.0 0.0 0.0 Assoc. & JV Inc/(loss) 0.0 0.0 0.0 0.0 0.0 Chg in Wkg.Cap. 52.4 27.0 (44.9) 6.24 (1.7) Other Operating CF (16.0) (8.4) (6.8) (3.4) (5.1) Net Operating CF 110 53.9 (14.5) 26.8 22.1 Capital Exp.(net) (15.0) (15.0) (15.0) (15.0) (15.0) Other Invts.(net) 10.8 0.0 0.0 0.0 0.0 Invts in Assoc. & JV 0.0 0.0 0.0 0.0 0.0 Div from Assoc & JV 0.0 0.0 0.0 0.0 0.0 Other Investing CF (4.9) 21.2 (0.8) (0.9) (0.9) Net Investing CF (9.1) 6.23 (15.8) (15.9) (15.9) Div Paid (69.9) (29.9) (4.5) (2.0) (2.9) Chg in Gross Debt 0.0 0.0 0.0 0.0 0.0 Capital Issues 0.0 0.0 0.0 0.0 0.0 Other Financing CF (12.5) (10.4) 10.4 2.46 3.06 Net Financing CF (82.4) (40.2) 5.84 0.43 0.19 Currency Adjustments 0.0 0.0 0.0 0.0 0.0 Chg in Cash 19.0 19.9 (24.5) 11.4 6.40 Opg CFPS (US cts.) 301 140 157 107 123 Free CFPS (US cts.) 495 202 (153) 61.3 36.9
Source: Company, DBS Vickers
Target Price & Ratings History
Source: DBS Vickers
S.No. Date Closing PriceTarget Price
Rating
1: 13 Apr 15 1435 1200 FULLY VALUED
2: 30 Apr 15 1195 1200 HOLD
3: 24 Jul 15 1025 1035 HOLD
4: 10 Aug 15 1000 1035 HOLD
5: 04 Sep 15 915 700 FULLY VALUED
Note : Share price and Target price are adjusted for corporate actions.
12
3
4
5
636
836
1036
1236
1436
1636
1836
Jan-15 May-15 Sep-15
Rp
We did not account for any coal concession acquisition in our forecast
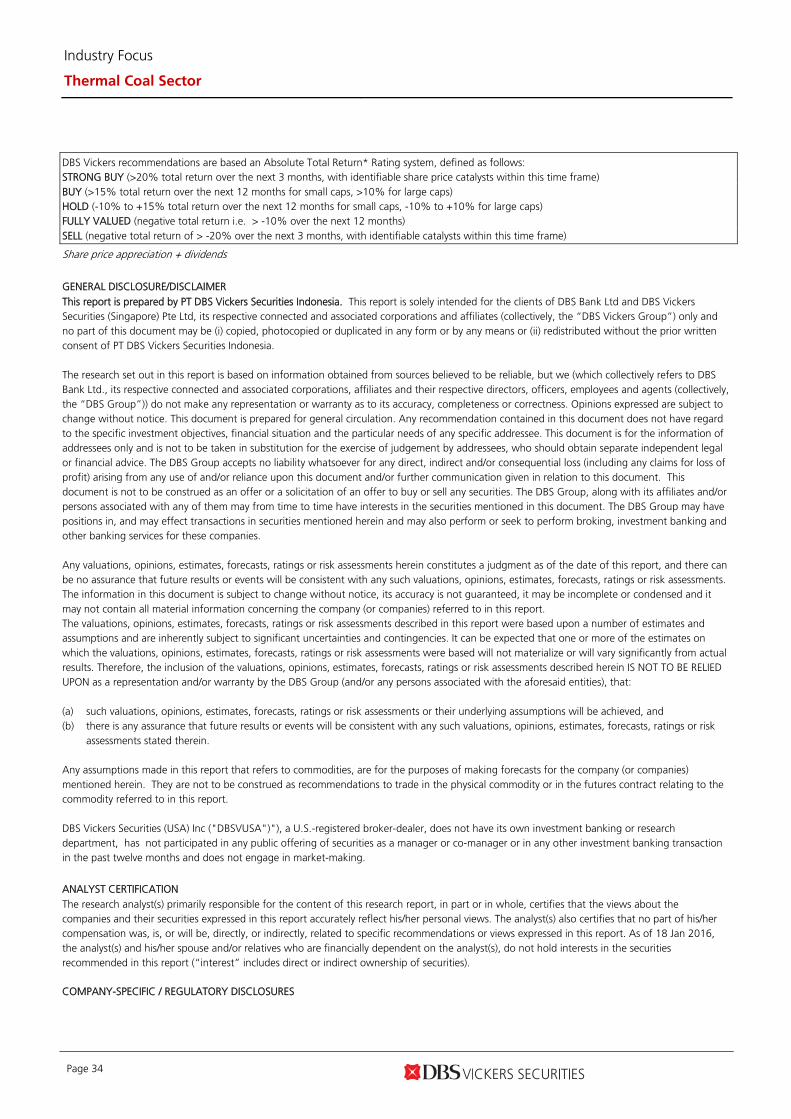
Industry Focus
Thermal Coal Sector
Page 34
DBS Vickers recommendations are based an Absolute Total Return* Rating system, defined as follows: STRONG BUY (>20% total return over the next 3 months, with identifiable share price catalysts within this time frame) BUY (>15% total return over the next 12 months for small caps, >10% for large caps) HOLD (-10% to +15% total return over the next 12 months for small caps, -10% to +10% for large caps) FULLY VALUED (negative total return i.e. > -10% over the next 12 months) SELL (negative total return of > -20% over the next 3 months, with identifiable catalysts within this time frame)
Share price appreciation + dividends
GENERAL DISCLOSURE/DISCLAIMER This report is prepared by PT DBS Vickers Securities Indonesia. This report is solely intended for the clients of DBS Bank Ltd and DBS Vickers Securities (Singapore) Pte Ltd, its respective connected and associated corporations and affiliates (collectively, the “DBS Vickers Group”) only and no part of this document may be (i) copied, photocopied or duplicated in any form or by any means or (ii) redistributed without the prior written consent of PT DBS Vickers Securities Indonesia. The research set out in this report is based on information obtained from sources believed to be reliable, but we (which collectively refers to DBS Bank Ltd., its respective connected and associated corporations, affiliates and their respective directors, officers, employees and agents (collectively, the “DBS Group”)) do not make any representation or warranty as to its accuracy, completeness or correctness. Opinions expressed are subject to change without notice. This document is prepared for general circulation. Any recommendation contained in this document does not have regard to the specific investment objectives, financial situation and the particular needs of any specific addressee. This document is for the information of addressees only and is not to be taken in substitution for the exercise of judgement by addressees, who should obtain separate independent legal or financial advice. The DBS Group accepts no liability whatsoever for any direct, indirect and/or consequential loss (including any claims for loss of profit) arising from any use of and/or reliance upon this document and/or further communication given in relation to this document. This document is not to be construed as an offer or a solicitation of an offer to buy or sell any securities. The DBS Group, along with its affiliates and/or persons associated with any of them may from time to time have interests in the securities mentioned in this document. The DBS Group may have positions in, and may effect transactions in securities mentioned herein and may also perform or seek to perform broking, investment banking and other banking services for these companies. Any valuations, opinions, estimates, forecasts, ratings or risk assessments herein constitutes a judgment as of the date of this report, and there can be no assurance that future results or events will be consistent with any such valuations, opinions, estimates, forecasts, ratings or risk assessments. The information in this document is subject to change without notice, its accuracy is not guaranteed, it may be incomplete or condensed and it may not contain all material information concerning the company (or companies) referred to in this report. The valuations, opinions, estimates, forecasts, ratings or risk assessments described in this report were based upon a number of estimates and assumptions and are inherently subject to significant uncertainties and contingencies. It can be expected that one or more of the estimates on which the valuations, opinions, estimates, forecasts, ratings or risk assessments were based will not materialize or will vary significantly from actual results. Therefore, the inclusion of the valuations, opinions, estimates, forecasts, ratings or risk assessments described herein IS NOT TO BE RELIED UPON as a representation and/or warranty by the DBS Group (and/or any persons associated with the aforesaid entities), that: (a) such valuations, opinions, estimates, forecasts, ratings or risk assessments or their underlying assumptions will be achieved, and (b) there is any assurance that future results or events will be consistent with any such valuations, opinions, estimates, forecasts, ratings or risk
assessments stated therein. Any assumptions made in this report that refers to commodities, are for the purposes of making forecasts for the company (or companies) mentioned herein. They are not to be construed as recommendations to trade in the physical commodity or in the futures contract relating to the commodity referred to in this report. DBS Vickers Securities (USA) Inc ("DBSVUSA")"), a U.S.-registered broker-dealer, does not have its own investment banking or research department, has not participated in any public offering of securities as a manager or co-manager or in any other investment banking transaction in the past twelve months and does not engage in market-making.
ANALYST CERTIFICATION The research analyst(s) primarily responsible for the content of this research report, in part or in whole, certifies that the views about the companies and their securities expressed in this report accurately reflect his/her personal views. The analyst(s) also certifies that no part of his/her compensation was, is, or will be, directly, or indirectly, related to specific recommendations or views expressed in this report. As of 18 Jan 2016, the analyst(s) and his/her spouse and/or relatives who are financially dependent on the analyst(s), do not hold interests in the securities recommended in this report (“interest” includes direct or indirect ownership of securities).
COMPANY-SPECIFIC / REGULATORY DISCLOSURES
Industry Focus
Thermal Coal Sector
Page 35
1. PT DBS Vickers Securities Indonesia (''DBSVI'') does not have a proprietary position in the securities recommended in this report as of 15
January 2016.
2. Compensation for investment banking services: DBSVUSA does not have its own investment banking or research department, nor has it participated in any public offering of securities as a
manager or co-manager or in any other investment banking transaction in the past twelve months. Any US persons wishing to obtain further information, including any clarification on disclosures in this disclaimer, or to effect a transaction in any security discussed in this document should contact DBSVUSA exclusively.
RESTRICTIONS ON DISTRIBUTION
General This report is not directed to, or intended for distribution to or use by, any person or entity who is a citizen or resident of or located in any locality, state, country or other jurisdiction where such distribution, publication, availability or use would be contrary to law or regulation.
Australia This report is being distributed in Australia by DBS Bank Ltd. (“DBS”) or DBS Vickers Securities (Singapore) Pte Ltd (“DBSVS”), both of which are exempted from the requirement to hold an Australian Financial Services Licence under the Corporation Act 2001 (“CA”) in respect of financial services provided to the recipients. Both DBS and DBSVS are regulated by the Monetary Authority of Singapore under the laws of Singapore, which differ from Australian laws. Distribution of this report is intended only for “wholesale investors” within the meaning of the CA.
Hong Kong This report is being distributed in Hong Kong by DBS Vickers (Hong Kong) Limited which is licensed and regulated by the Hong Kong Securities and Futures Commission.
Indonesia This report is being distributed in Indonesia by PT DBS Vickers Securities Indonesia.
Malaysia This report is distributed in Malaysia by AllianceDBS Research Sdn Bhd ("ADBSR"). Recipients of this report, received from ADBSR are to contact the undersigned at 603-2604 3333 in respect of any matters arising from or in connection with this report. In addition to the General Disclosure/Disclaimer found at the preceding page, recipients of this report are advised that ADBSR (the preparer of this report), its holding company Alliance Investment Bank Berhad, their respective connected and associated corporations, affiliates, their directors, officers, employees, agents and parties related or associated with any of them may have positions in, and may effect transactions in the securities mentioned herein and may also perform or seek to perform broking, investment banking/corporate advisory and other services for the subject companies. They may also have received compensation and/or seek to obtain compensation for broking, investment banking/corporate advisory and other services from the subject companies.
Wong Ming Tek, Executive Director, ADBSR
Singapore This report is distributed in Singapore by DBS Bank Ltd (Company Regn. No. 196800306E) or DBSVS (Company Regn No. 198600294G), both of which are Exempt Financial Advisers as defined in the Financial Advisers Act and regulated by the Monetary Authority of Singapore. DBS Bank Ltd and/or DBSVS, may distribute reports produced by its respective foreign entities, affiliates or other foreign research houses pursuant to an arrangement under Regulation 32C of the Financial Advisers Regulations. Where the report is distributed in Singapore to a person who is not an Accredited Investor, Expert Investor or an Institutional Investor, DBS Bank Ltd accepts legal responsibility for the contents of the report to such persons only to the extent required by law. Singapore recipients should contact DBS Bank Ltd at 6327 2288 for matters arising from, or in connection with the report.
Thailand This report is being distributed in Thailand by DBS Vickers Securities (Thailand) Co Ltd. Research reports distributed are only intended for institutional clients only and no other person may act upon it.
United Kingdom This report is being distributed in the UK by DBS Vickers Securities (UK) Ltd, who is an authorised person in the meaning of the Financial Services and Markets Act and is regulated by The Financial Conduct Authority. Research distributed in the UK is intended only for institutional clients.
Dubai
This research report is being distributed in The Dubai International Financial Centre (“DIFC”) by DBS Bank Ltd., (DIFC Branch) having its office at PO Box 506538, 3rd Floor, Building 3, East Wing, Gate Precinct, Dubai International Financial Centre (DIFC), Dubai, United Arab Emirates. DBS Bank Ltd., (DIFC Branch) is regulated by The Dubai Financial Services Authority. This research report is intended only for professional clients (as defined in the DFSA rulebook) and no other person may act upon it.
United States This report was prepared by PT DBS Vickers Securities Indonesia. DBSVUSA did not participate in its preparation. The research analyst(s) named on this report are not registered as research analysts with FINRA and are not associated persons of DBSVUSA. The research analyst(s) are not subject to FINRA Rule 2241 restrictions on analyst compensation, communications with a subject company, public appearances and trading securities held by a research analyst. This report is being distributed in the United States by DBSVUSA, which accepts responsibility for its contents. This report may only be distributed to Major U.S. Institutional Investors (as defined in SEC Rule 15a-6) and to such other institutional investors and qualified persons as DBSVUSA may authorize. Any U.S. person receiving this report who wishes to effect transactions in any securities referred to herein should contact DBSVUSA directly and not its affiliate.
Other jurisdiction In any other jurisdictions, except if otherwise restricted by laws or regulations, this report is intended only for qualified, professional, institutional or sophisticated investors as defined in the laws and regulations of such jurisdictions.
PT DBS Vickers Securities Indonesia
DBS Bank Tower, Ciputra World 1, 32/F Jl. Prof. Dr. Satrio Kav. 3-5, Jakarta 12940, Indonesia
Tel. 6221-3003 4900, Fax: 6221-3003 4943