Embed Size (px)
Citation preview
INFLUENCE OF TRAFFIC ON INDOOR AIR
QUALITY OF NATURALLY AND
MECHANICALLY VENTILATED BUILDING
LOCATED NEAR AN URBAN ROADWAY
Rohit J, Chithra V.S, Kishore Kumar M,
Shiva Nagendra S.M and Sivanandan R
DEPARTMENT OF CIVIL ENGINEERING
IIT MADRAS
Introduction
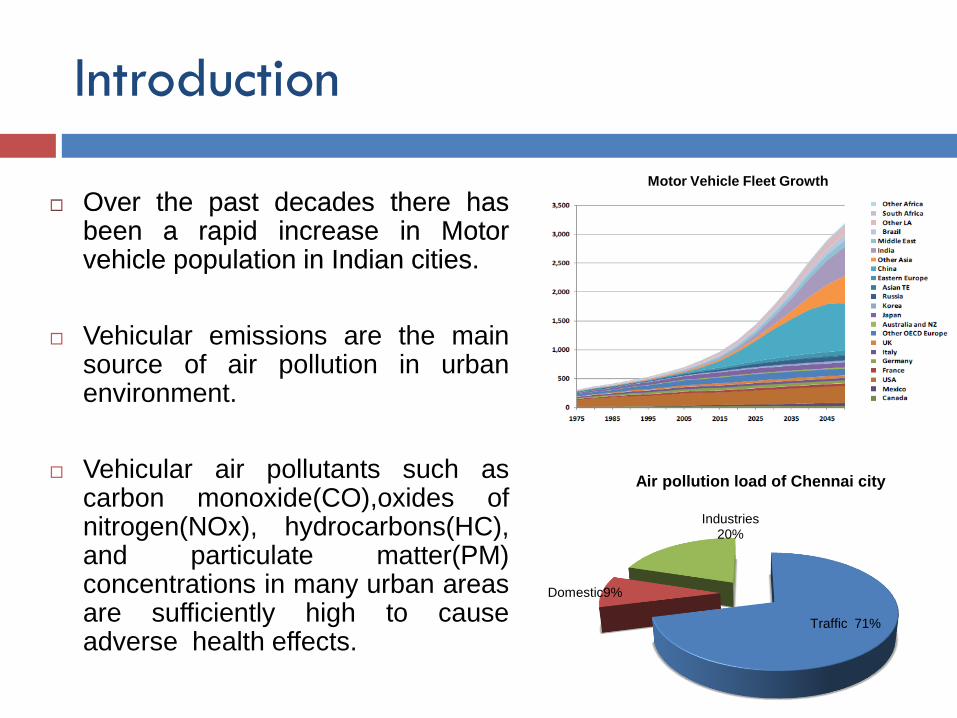
Over the past decades there hasbeen a rapid increase in Motorvehicle population in Indian cities.
Vehicular emissions are the mainsource of air pollution in urbanenvironment.
Vehicular air pollutants such ascarbon monoxide(CO),oxides ofnitrogen(NOx), hydrocarbons(HC),and particulate matter(PM)concentrations in many urban areasare sufficiently high to causeadverse health effects.
Traffic 71%
Domestic9%
Industries 20%
Air pollution load of Chennai city
Motor Vehicle Fleet Growth
Continued…
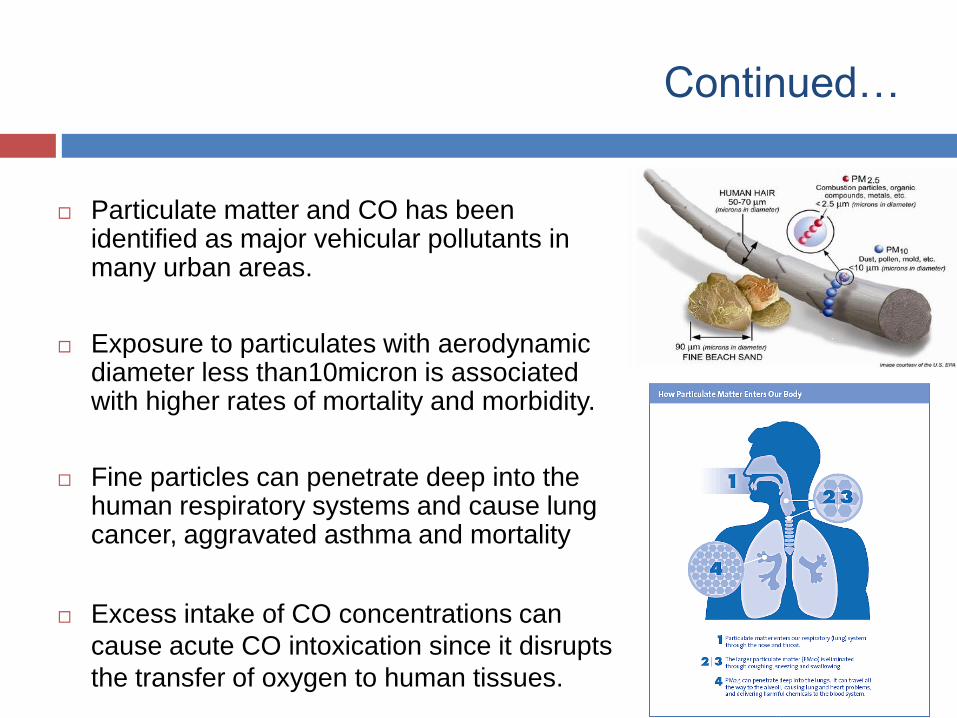
Particulate matter and CO has been identified as major vehicular pollutants in many urban areas.
Exposure to particulates with aerodynamic diameter less than10micron is associated with higher rates of mortality and morbidity.
Fine particles can penetrate deep into the human respiratory systems and cause lung cancer, aggravated asthma and mortality
Excess intake of CO concentrations can
cause acute CO intoxication since it disrupts
the transfer of oxygen to human tissues.
Continued…
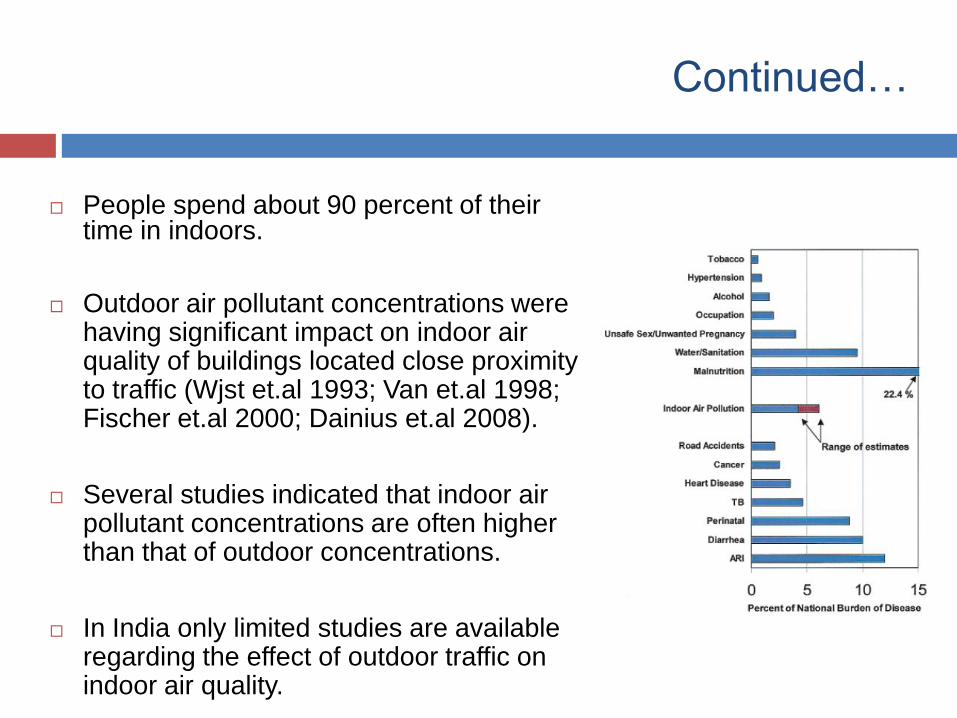
People spend about 90 percent of their time in indoors.
Outdoor air pollutant concentrations were having significant impact on indoor air quality of buildings located close proximity to traffic (Wjst et.al 1993; Van et.al 1998; Fischer et.al 2000; Dainius et.al 2008).
Several studies indicated that indoor air pollutant concentrations are often higher than that of outdoor concentrations.
In India only limited studies are available regarding the effect of outdoor traffic on indoor air quality.
AIM
The Aim of this research work is to study the influence
of traffic related emissions on indoor air quality in
naturally and mechanically ventilated buildings
located close to busy roadway in Chennai city.
About Chennai
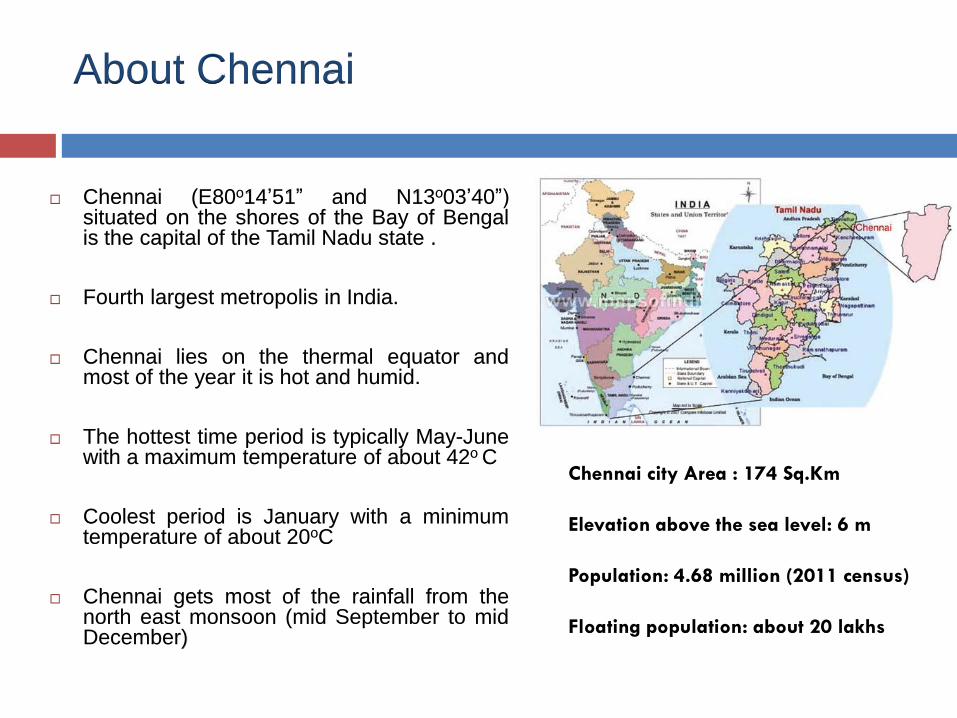
Chennai (E80o14’51” and N13o03’40”)situated on the shores of the Bay of Bengalis the capital of the Tamil Nadu state .
Fourth largest metropolis in India.
Chennai lies on the thermal equator andmost of the year it is hot and humid.
The hottest time period is typically May-Junewith a maximum temperature of about 42o C
Coolest period is January with a minimumtemperature of about 20oC
Chennai gets most of the rainfall from thenorth east monsoon (mid September to midDecember)
Chennai city Area : 174 Sq.Km
Elevation above the sea level: 6 m
Population: 4.68 million (2011 census)
Floating population: about 20 lakhs
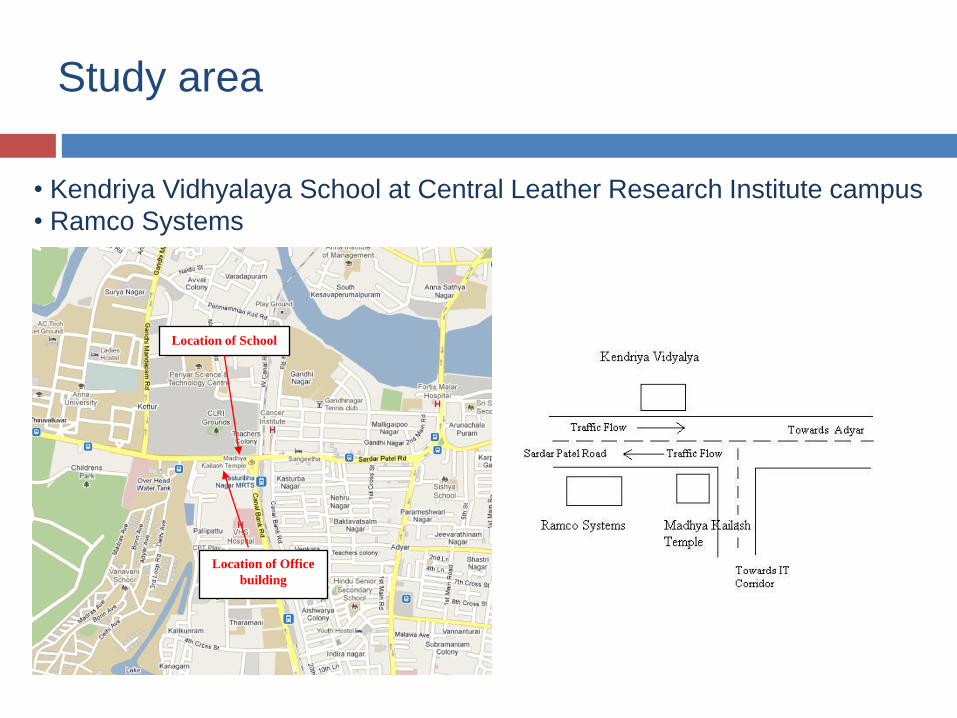
Study area
• Kendriya Vidhyalaya School at Central Leather Research Institute campus
• Ramco Systems
Location of School
Location of Office
building
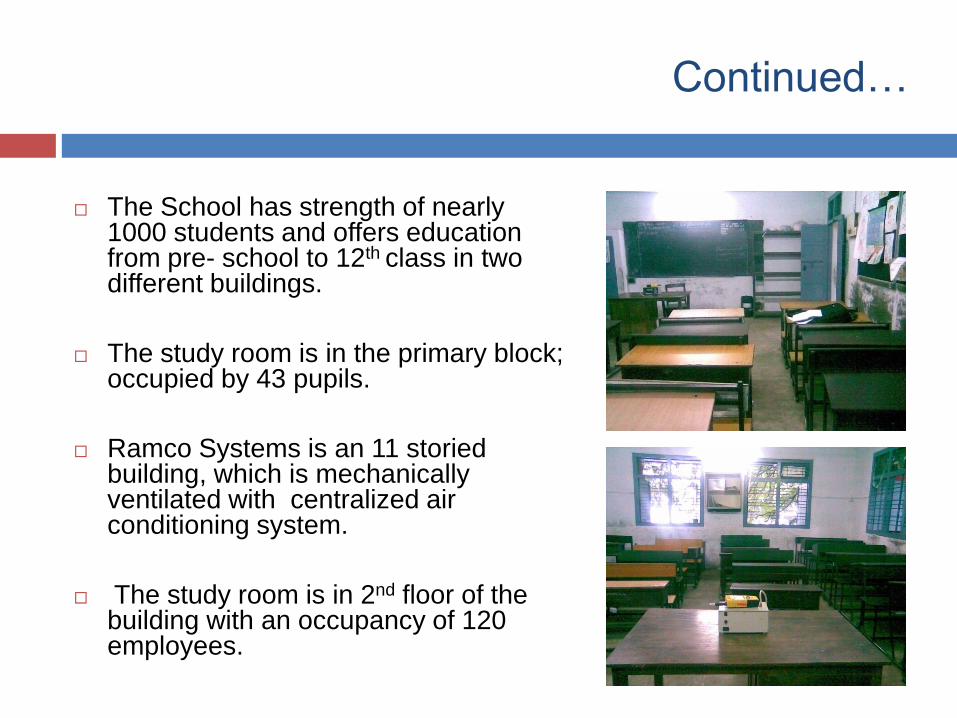
Continued…
The School has strength of nearly 1000 students and offers education from pre- school to 12th class in two different buildings.
The study room is in the primary block; occupied by 43 pupils.
Ramco Systems is an 11 storied building, which is mechanically ventilated with centralized air conditioning system.
The study room is in 2nd floor of the building with an occupancy of 120 employees.
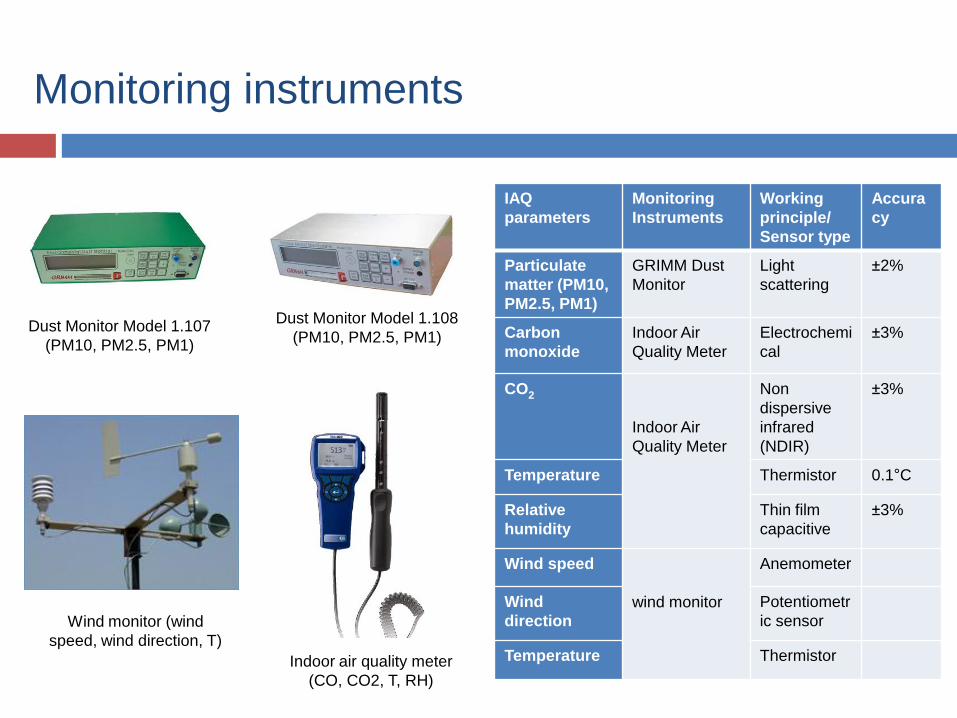
Monitoring instruments
Dust Monitor Model 1.108
(PM10, PM2.5, PM1)Dust Monitor Model 1.107
(PM10, PM2.5, PM1)
Indoor air quality meter
(CO, CO2, T, RH)
Wind monitor (wind
speed, wind direction, T)
IAQ
parameters
Monitoring
Instruments
Working
principle/
Sensor type
Accura
cy
Particulate
matter (PM10,
PM2.5, PM1)
GRIMM Dust
Monitor
Light
scattering
±2%
Carbon
monoxide
Indoor Air
Quality Meter
Electrochemi
cal
±3%
CO2
Indoor Air
Quality Meter
Non
dispersive
infrared
(NDIR)
±3%
Temperature Thermistor 0.1°C
Relative
humidity
Thin film
capacitive
±3%
Wind speed
wind monitor
Anemometer
Wind
direction
Potentiometr
ic sensor
Temperature Thermistor
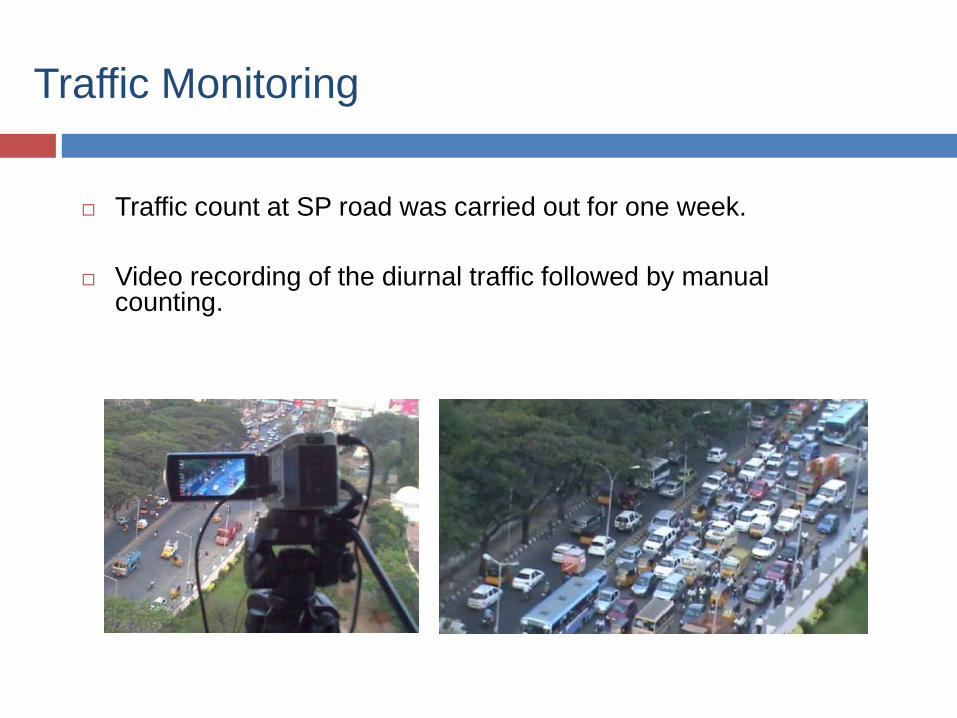
Traffic Monitoring
Traffic count at SP road was carried out for one week.
Video recording of the diurnal traffic followed by manual counting.
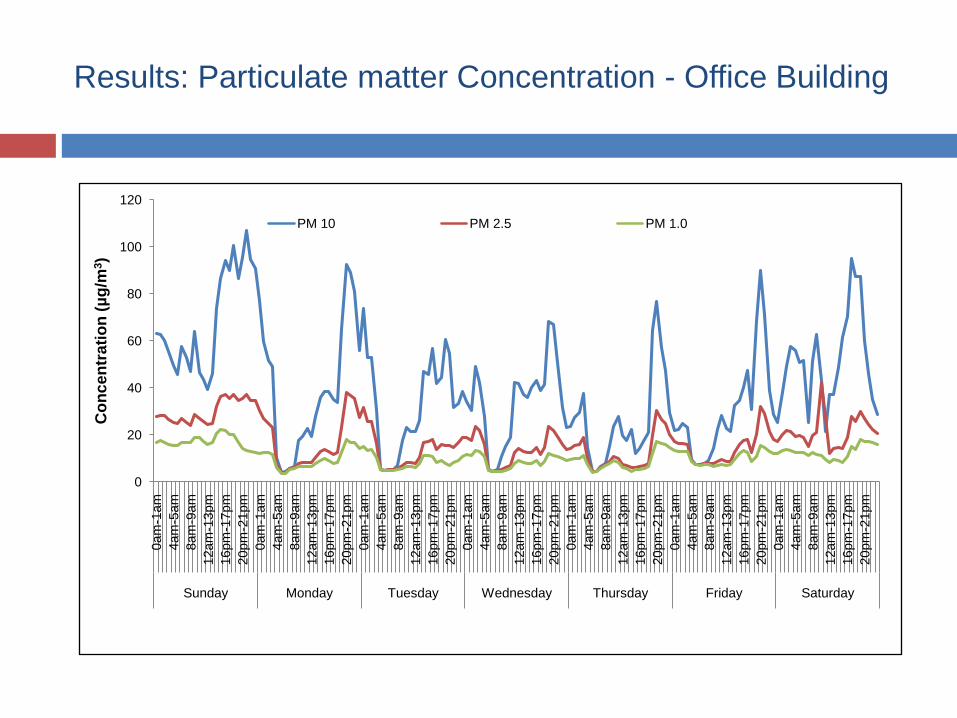
Results: Particulate matter Concentration - Office Building
0
20
40
60
80
100
120
0am
-1am
4am
-5am
8am
-9am
12am
-13pm
16pm
-17pm
20pm
-21pm
0am
-1am
4am
-5am
8am
-9am
12am
-13pm
16pm
-17pm
20pm
-21pm
0am
-1am
4am
-5am
8am
-9am
12am
-13pm
16pm
-17pm
20pm
-21pm
0am
-1am
4am
-5am
8am
-9am
12am
-13pm
16pm
-17pm
20pm
-21pm
0am
-1am
4am
-5am
8am
-9am
12am
-13pm
16pm
-17pm
20pm
-21pm
0am
-1am
4am
-5am
8am
-9am
12am
-13pm
16pm
-17pm
20pm
-21pm
0am
-1am
4am
-5am
8am
-9am
12am
-13pm
16pm
-17pm
20pm
-21pm
Sunday Monday Tuesday Wednesday Thursday Friday Saturday
Co
nc
en
tra
tio
n (
µg
/m3)
PM 10 PM 2.5 PM 1.0
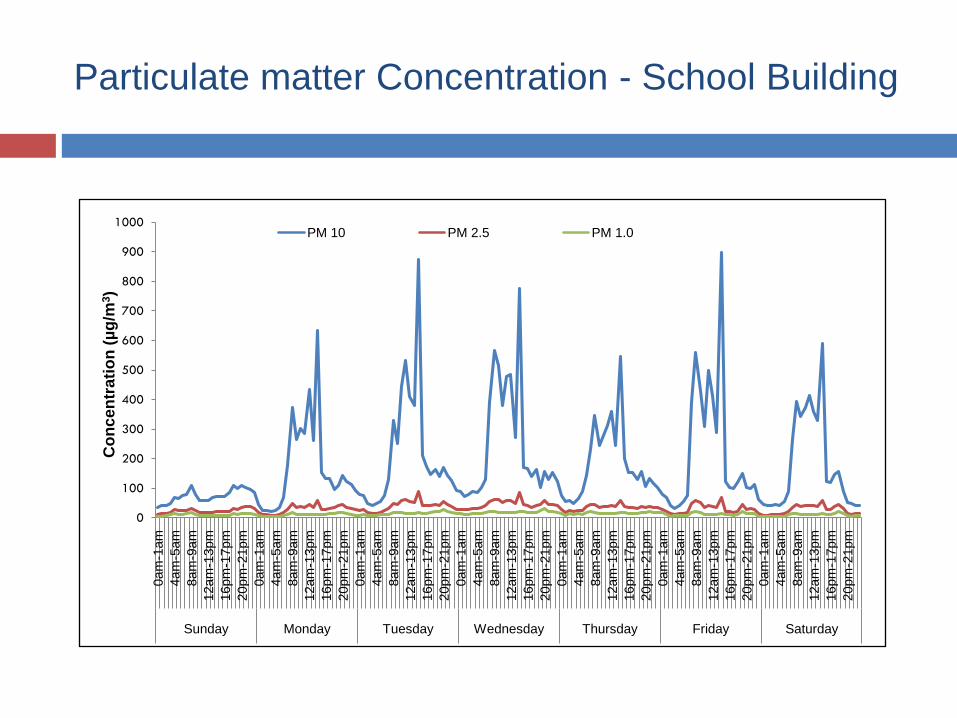
Particulate matter Concentration - School Building
0
100
200
300
400
500
600
700
800
900
1000
0am
-1am
4am
-5am
8am
-9am
12am
-13pm
16pm
-17pm
20pm
-21pm
0am
-1am
4am
-5am
8am
-9am
12am
-13pm
16pm
-17pm
20pm
-21pm
0am
-1am
4am
-5am
8am
-9am
12am
-13pm
16pm
-17pm
20pm
-21pm
0am
-1am
4am
-5am
8am
-9am
12am
-13pm
16pm
-17pm
20pm
-21pm
0am
-1am
4am
-5am
8am
-9am
12am
-13pm
16pm
-17pm
20pm
-21pm
0am
-1am
4am
-5am
8am
-9am
12am
-13pm
16pm
-17pm
20pm
-21pm
0am
-1am
4am
-5am
8am
-9am
12am
-13pm
16pm
-17pm
20pm
-21pm
Sunday Monday Tuesday Wednesday Thursday Friday Saturday
Co
nc
en
tra
tio
n (
µg
/m3)
PM 10 PM 2.5 PM 1.0
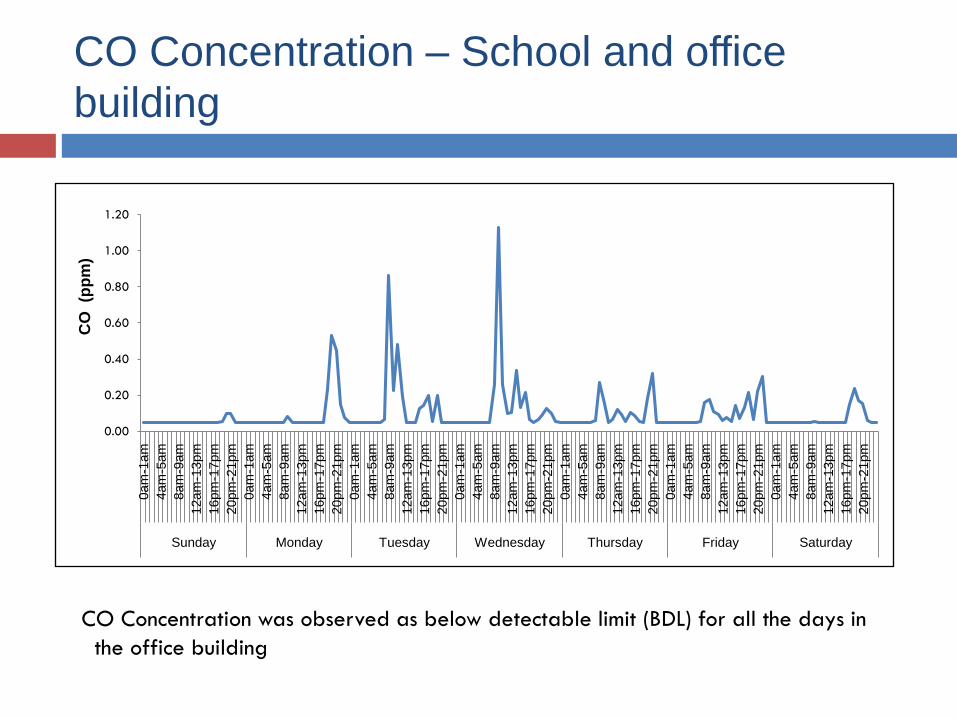
CO Concentration – School and office
building
0.00
0.20
0.40
0.60
0.80
1.00
1.20
0am
-1am
4am
-5am
8am
-9am
12am
-13pm
16pm
-17pm
20pm
-21pm
0am
-1am
4am
-5am
8am
-9am
12am
-13pm
16pm
-17pm
20pm
-21pm
0am
-1am
4am
-5am
8am
-9am
12am
-13pm
16pm
-17pm
20pm
-21pm
0am
-1am
4am
-5am
8am
-9am
12am
-13pm
16pm
-17pm
20pm
-21pm
0am
-1am
4am
-5am
8am
-9am
12am
-13pm
16pm
-17pm
20pm
-21pm
0am
-1am
4am
-5am
8am
-9am
12am
-13pm
16pm
-17pm
20pm
-21pm
0am
-1am
4am
-5am
8am
-9am
12am
-13pm
16pm
-17pm
20pm
-21pm
Sunday Monday Tuesday Wednesday Thursday Friday Saturday
CO
(p
pm
)
CO Concentration was observed as below detectable limit (BDL) for all the days in
the office building
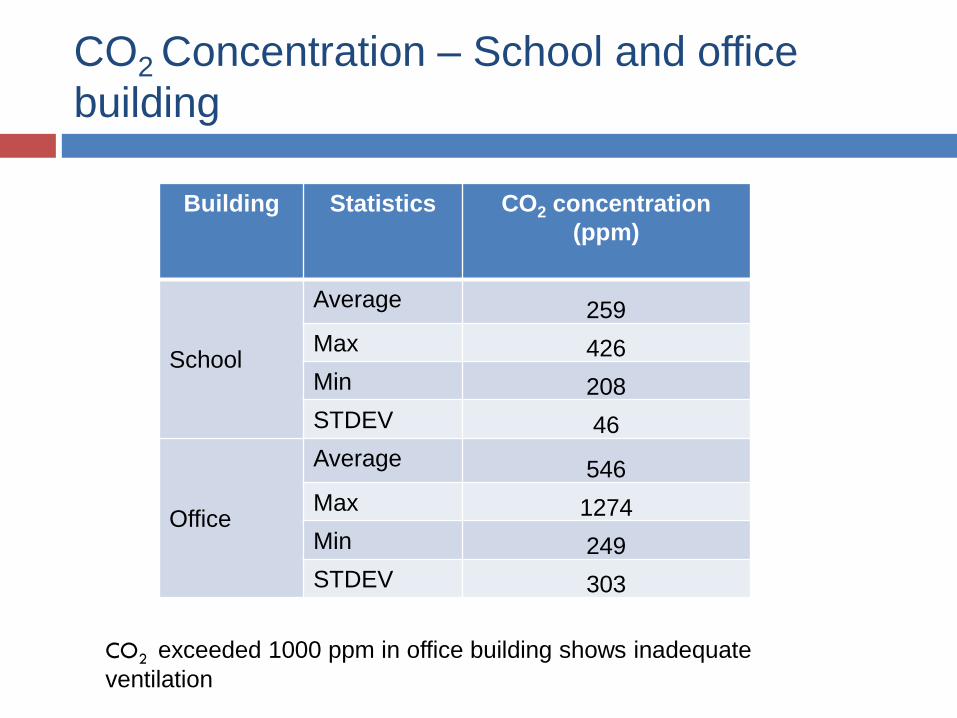
CO2 Concentration – School and office
building
Building Statistics CO2 concentration
(ppm)
School
Average 259
Max 426
Min 208
STDEV 46
Office
Average 546
Max 1274
Min 249
STDEV 303
CO2 exceeded 1000 ppm in office building shows inadequate
ventilation
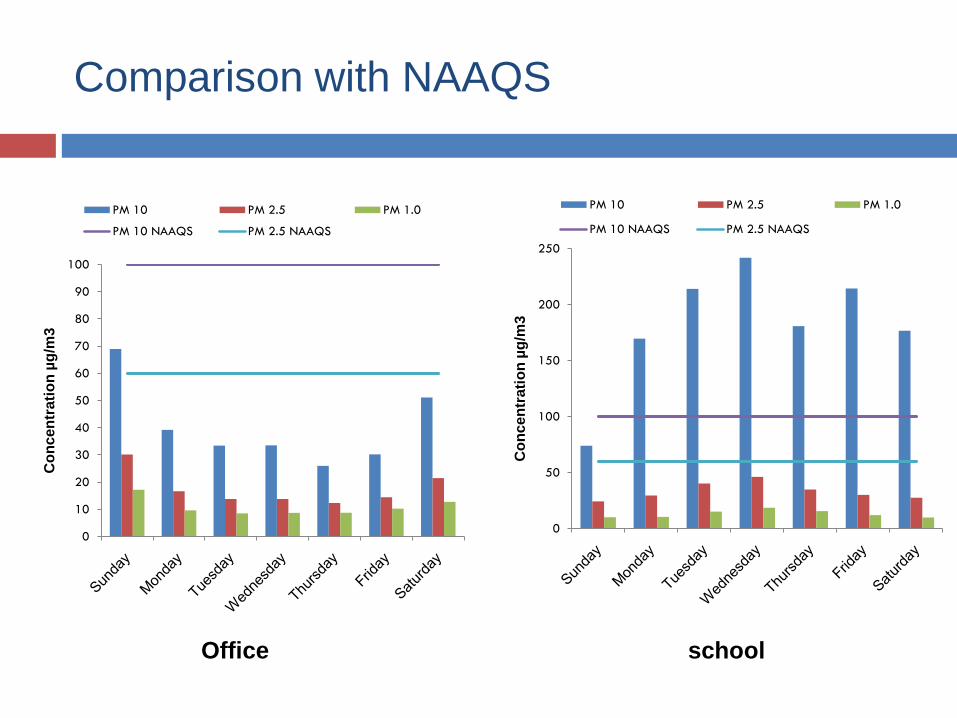
Comparison with NAAQS
0
10
20
30
40
50
60
70
80
90
100
Co
nc
en
tra
tio
n µ
g/m
3
PM 10 PM 2.5 PM 1.0
PM 10 NAAQS PM 2.5 NAAQS
0
50
100
150
200
250
Co
nc
en
tra
tio
n µ
g/m
3
PM 10 PM 2.5 PM 1.0
PM 10 NAAQS PM 2.5 NAAQS
Office school
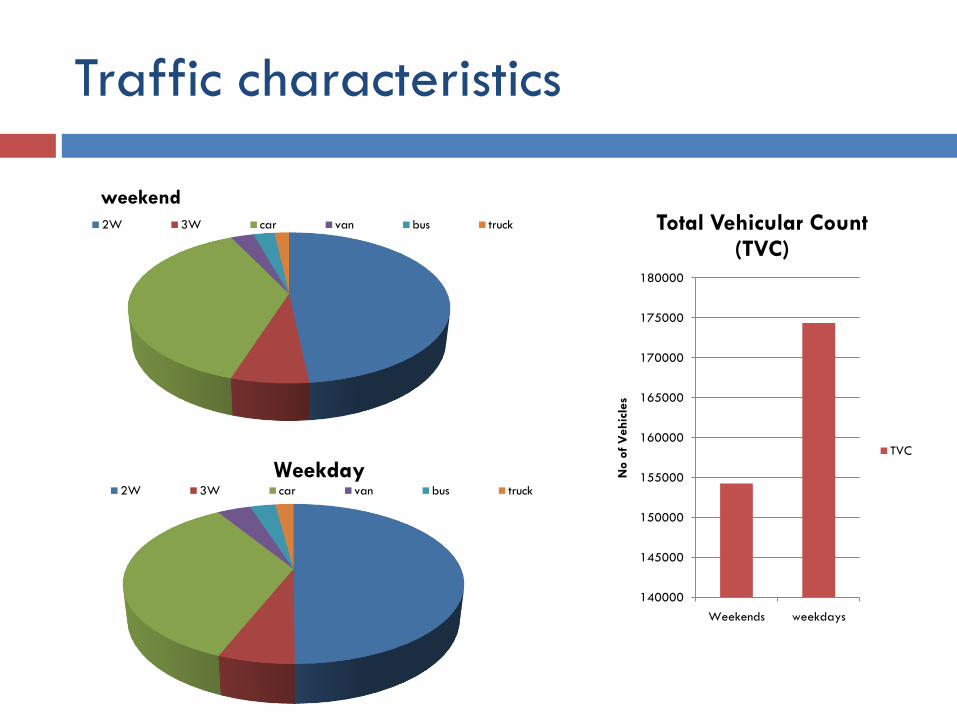
Traffic characteristics
140000
145000
150000
155000
160000
165000
170000
175000
180000
Weekends weekdaysN
o o
f V
ehic
les
Total Vehicular Count (TVC)
TVC
weekend
2W 3W car van bus truck
Weekday2W 3W car van bus truck
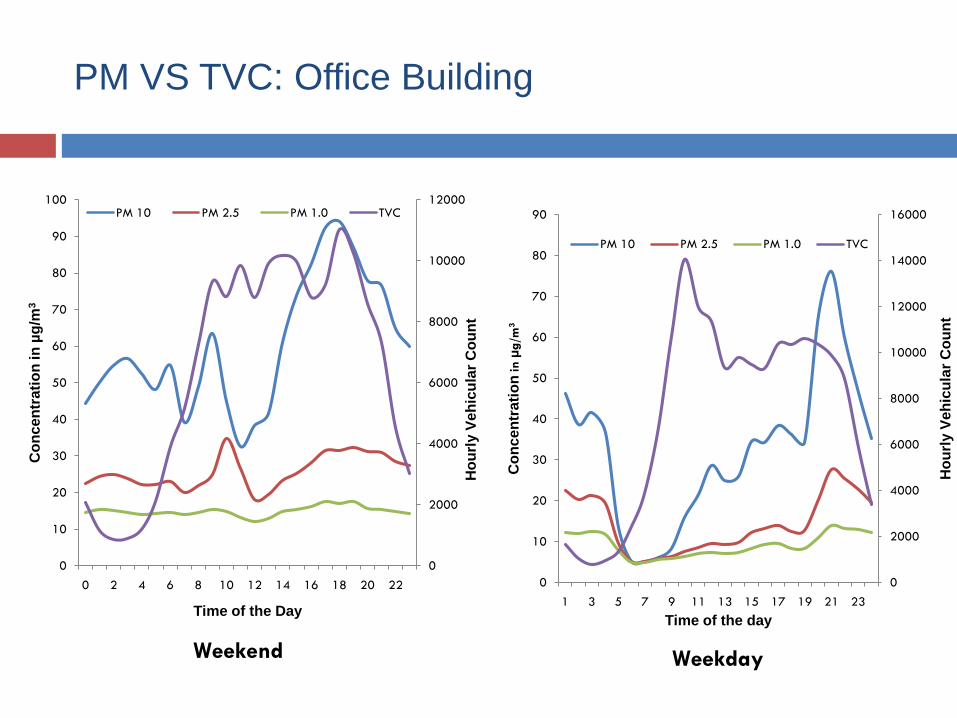
PM VS TVC: Office Building
0
2000
4000
6000
8000
10000
12000
0
10
20
30
40
50
60
70
80
90
100
0 2 4 6 8 10 12 14 16 18 20 22
Ho
url
y V
eh
icu
lar
Co
un
t
Co
nc
en
tra
tio
n in
µg
/m3
Time of the Day
PM 10 PM 2.5 PM 1.0 TVC
0
2000
4000
6000
8000
10000
12000
14000
16000
0
10
20
30
40
50
60
70
80
90
1 3 5 7 9 11 13 15 17 19 21 23
Ho
url
y V
eh
icu
lar
Co
un
t
Co
nc
en
tra
tio
nin
µg/m
3
Time of the day
PM 10 PM 2.5 PM 1.0 TVC
Weekend Weekday
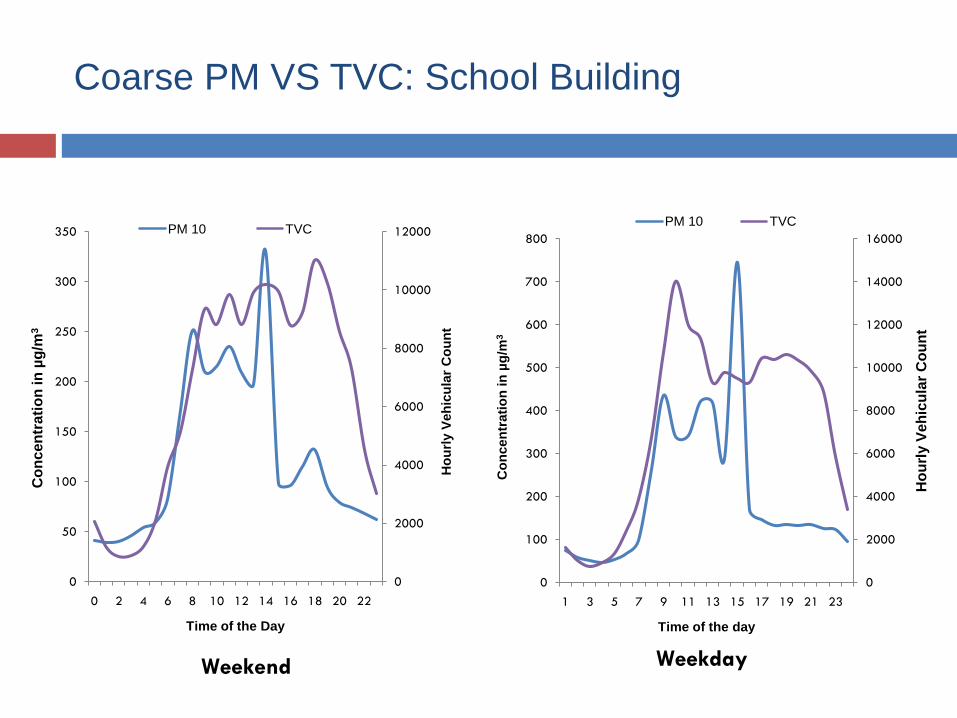
Coarse PM VS TVC: School Building
Weekend Weekday
0
2000
4000
6000
8000
10000
12000
0
50
100
150
200
250
300
350
0 2 4 6 8 10 12 14 16 18 20 22
Ho
url
y V
eh
icu
lar
Co
un
t
Co
nc
en
tra
tio
n in
µg
/m3
Time of the Day
PM 10 TVC
0
2000
4000
6000
8000
10000
12000
14000
16000
0
100
200
300
400
500
600
700
800
1 3 5 7 9 11 13 15 17 19 21 23
Ho
url
y V
eh
icu
lar
Co
un
t
Co
ncen
trati
on
in
µg
/m3
Time of the day
PM 10 TVC
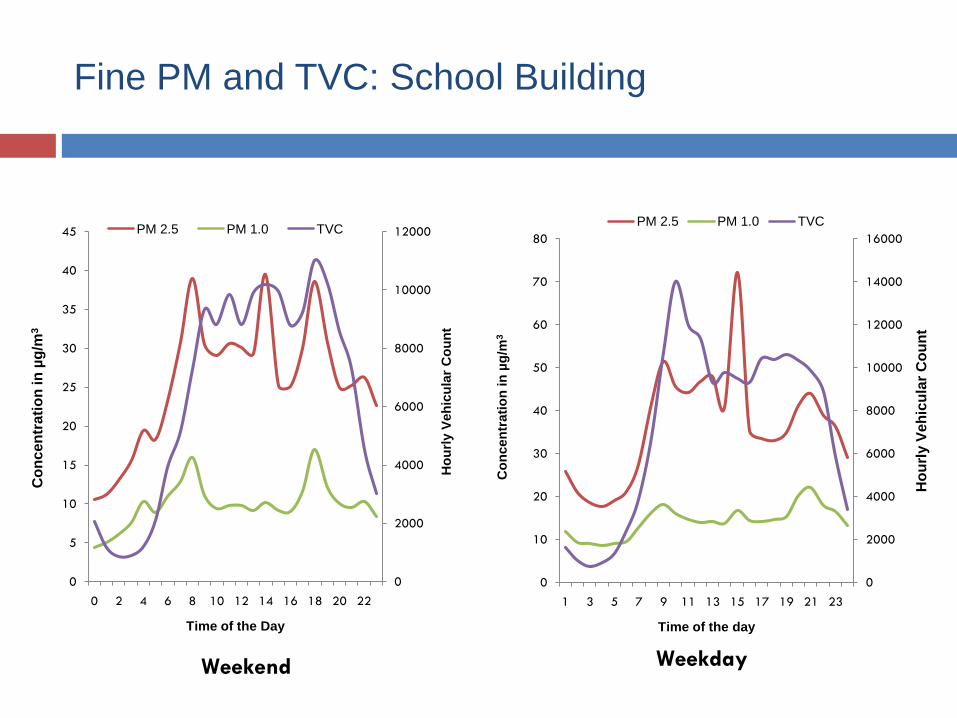
Fine PM and TVC: School Building
0
2000
4000
6000
8000
10000
12000
0
5
10
15
20
25
30
35
40
45
0 2 4 6 8 10 12 14 16 18 20 22
Ho
url
y V
eh
icu
lar
Co
un
t
Co
nc
en
tra
tio
n in
µg
/m3
Time of the Day
PM 2.5 PM 1.0 TVC
0
2000
4000
6000
8000
10000
12000
14000
16000
0
10
20
30
40
50
60
70
80
1 3 5 7 9 11 13 15 17 19 21 23
Ho
url
y V
eh
icu
lar
Co
un
t
Co
ncen
trati
on
in
µg
/m3
Time of the day
PM 2.5 PM 1.0 TVC
Weekend Weekday
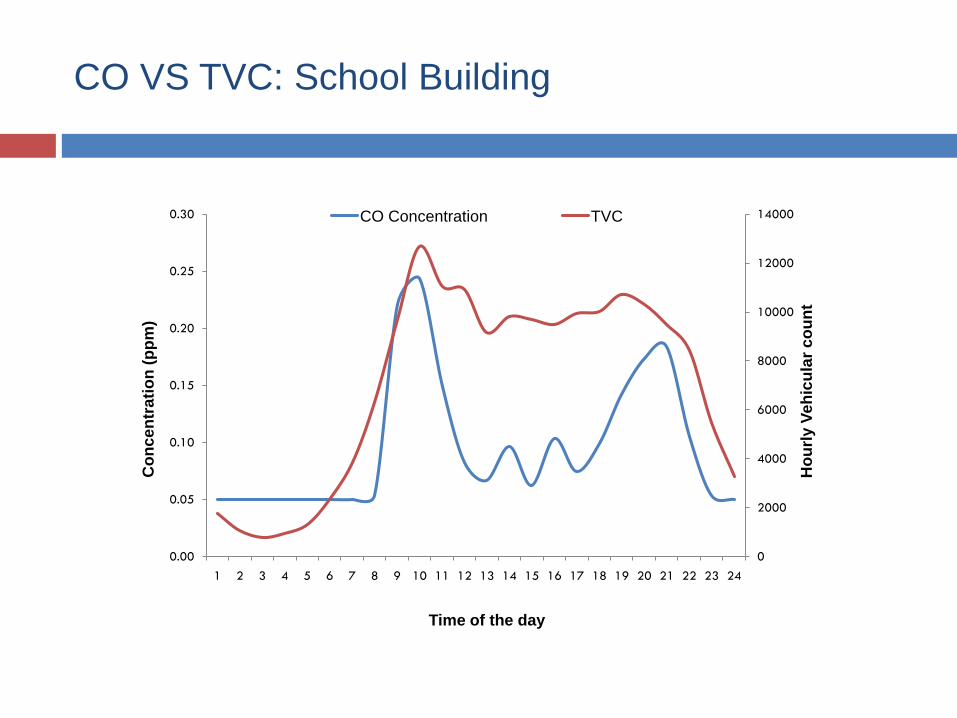
CO VS TVC: School Building
0
2000
4000
6000
8000
10000
12000
14000
0.00
0.05
0.10
0.15
0.20
0.25
0.30
1 2 3 4 5 6 7 8 9 10 11 12 13 14 15 16 17 18 19 20 21 22 23 24
Ho
url
y V
eh
icu
lar
co
un
t
Co
nc
en
tra
tio
n (
pp
m)
Time of the day
CO Concentration TVC
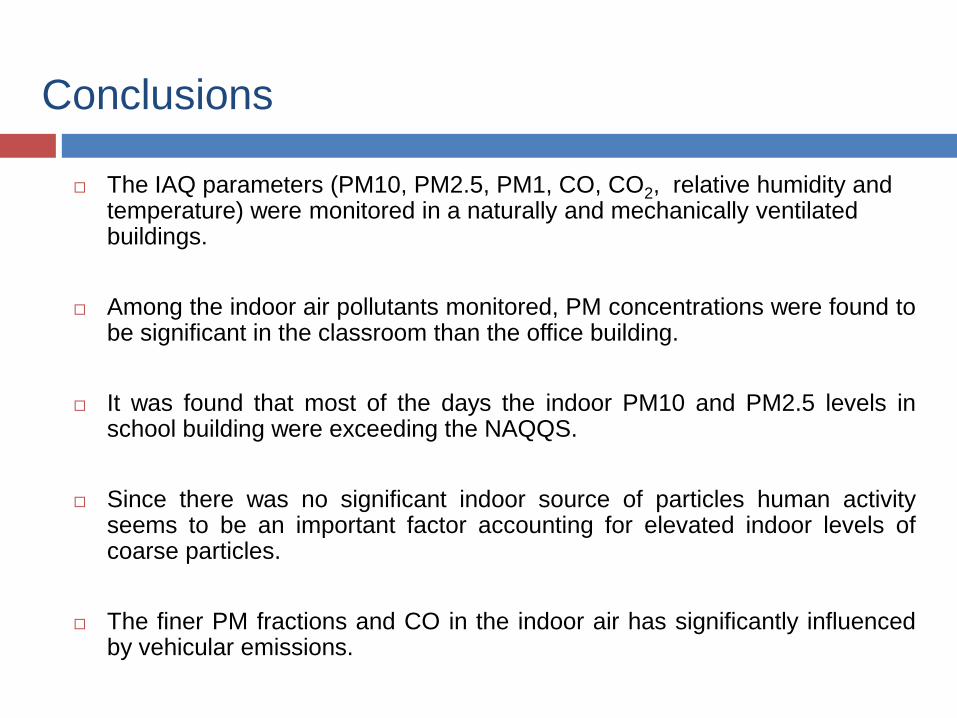
Conclusions
The IAQ parameters (PM10, PM2.5, PM1, CO, CO2, relative humidity and temperature) were monitored in a naturally and mechanically ventilated buildings.
Among the indoor air pollutants monitored, PM concentrations were found to be significant in the classroom than the office building.
It was found that most of the days the indoor PM10 and PM2.5 levels in school building were exceeding the NAQQS.
Since there was no significant indoor source of particles human activity seems to be an important factor accounting for elevated indoor levels of coarse particles.
The finer PM fractions and CO in the indoor air has significantly influenced by vehicular emissions.
References
Bartlett, K.H., Kennedy, S.M., Brauer, M., Netten, C.V. and Dill, B. (2004)
Evaluation and Determinants of Airborne Bacterial Concentrations in
School Classrooms, Journal of Occupational and Environmental
Hygiene, 1, 639–647.
Fromme H., Twardella D., Dietrich S., Heitmann D., Schierl R., Liebl B. and
Ruden H. (2007), Particulate matter in the indoor air of classrooms—
exploratory results from Munich and surrounding area, Atmospheric
Environment, Vol. 41, pp.854–86.
Ramachandran, G., Adgate, J. L., Banerjee, S., Church, T.
R., Jones, D., Fredrickson, A and Sexton, K. (2005) Indoor Air Quality in
Two Urban Elementary Schools—Measurements of Airborne Fungi, Carpet
Allergens, CO2, Temperature, and Relative Humidity, Journal of
Occupational and Environmental Hygiene, 2, 553–566.
Wjst, M., Reitmeir, P., Dold, S., Wulff, A., Nicolai, T., Von L.E. and Mutius
E., (1993), Road traffic and adverse effects on respiratory health in
children. British Medical Journal, Vol. 307, pp. 596-600.

Thank you