Embed Size (px)
Citation preview
City of Virginia Beach
Indoor Sports Venue Feasibility Study
Final Report
October 2006
BRAILSFORD & DUNLAVEY
© Brailsford & Dunlavey 2006

(This page intentionally blank)
PREFACE
Brailsford & Dunlavey Indoor Sports Venue Feasibility Study Page 1
In the summer of 2006, Brailsford & Dunlavey (“B&D”) was retained by the City of Virginia Beach to complete a feasibility study for a new indoor sports facility. The study included interviews with key stakeholders to define project objectives, an analysis of demographics and area characteristics, review of comparable facilities, site analysis, a preliminary program, and an analysis of development alternatives. This report sets forth B&D’s findings and recommendations with respect to project feasibility. The findings contained herein represent the professional opinions of B&D personnel based on assumptions and conditions detailed in this report. B&D analysts have conducted research using both primary and secondary information sources which are deemed to be reliable, but whose accuracy B&D cannot guarantee. Due to variations in national and global economic and legal conditions, actual project costs, revenues, and demand projections may vary. Brailsford & Dunlavey would like to give special thanks to the City staff members involved in this study for their guidance throughout the process. A full list of these members is included below. Throughout the process, B&D coordinated efforts with and reported to a committee comprised of the following individuals:
Cindy Curtis, Director, Department of Parks & Recreation Barry Frankenfield, Design and Development Administrator
Rick Rowe, Parks Coordinators Doug Cherry, Coordinator Amy Woodson, Supervisor
Jeff Bass, Recreation Specialist Jay Smith, Athletics
Charleen Cooper, Administrative Support Buddy Wheeler, Convention and Visitors Bureau
Rob Hudome, Department of Economic Development B&D would also like to thank the staff of the Mariners for providing additional information concerning the team and the Sportsplex.

PREFACE
Brailsford & Dunlavey Indoor Sports Venue Feasibility Study Page 2
TABLE OF CONTENTS
Brailsford & Dunlavey Indoor Sports Venue Feasibility Study Page i
SECTION A ......... Executive Summary B. ........ Market Analysis C ......... Site Analysis
EXHIBITS
1 ..........Market Demographics 2 ..........Development Budget

TABLE OF CONTENTS
Brailsford & Dunlavey Indoor Sports Venue Feasibility Study Page ii

Section A

This page intentionally blank
EXECUTIVE SUMMARY
Brailsford & Dunlavey Indoor Sports Venue Feasibility Study Page 1
INTRODUCTION In the summer of 2006, Brailsford & Dunlavey (“B&D”) was retained by the City of Virginia Beach (“City”) to complete a feasibility study for a new indoor sports facility in Princess Anne Commons (“Commons”) as well as an operational assessment of the existing Sportsplex. This report addresses the new indoor sports facility. In keeping with the vision of the Commons to create a vibrant place to “live, work, play, and learn,” the City identified the need to explore the viability of a new indoor sports venue. This venue would complement the existing inventory of athletic and recreation spaces within the Commons and serve to make this area a year-round destination. EXISTING CONDITIONS The Commons encompasses about 1,500 acres of a wide array of venues including the Sportsplex, U.S. Field Hockey National Training Facility, the new Athletic Complex, Virginia Beach Amphitheatre, Hampton Roads Soccer Complex, and TPC golf course. In addition to these athletic and recreation facilities there are a number of projects being developed including a new healthcare campus, expansion of the academic corridor, and new technology-based businesses. WORK PLAN The following tasks were completed to identify opportunities for a new indoor facility:
• A visioning session with key stakeholders to establish strategic objectives and identify current gaps of facilities, services, and available programs.
• A detailed market analysis to examine existing demographics and market characteristics in order to define the target market and identify opportunities.
• Interviews with multiple public and private entities to gain an understanding of the existing conditions.
• Site analysis of a new indoor venue within Princess Anne Commons. • A preliminary building program was developed based on the market analysis and the
City’s strategic objectives • Development alternatives for the project based on the financial estimates and
partnership opportunities.

EXECUTIVE SUMMARY
Brailsford & Dunlavey Indoor Sports Venue Feasibility Study Page 2
SUMMARY OF FINDINGS The primary findings and conclusions of the analysis are outlined below and detailed in the following sections and exhibits of the report: STRATEGIC OBJECTIVES • Working with key stakeholders, B&D established strategic objectives for the project that
would be used as a guide throughout the study to keep it within the City’s vision. In considering the parameters of the project the following were identified as the project objectives:
o Stay consistent with the vision for Princess Anne Commons of Live, Work, Play, and Learn
o Develop a year-round facility to improve amateur sports in the region o Assist in improving brand awareness for the Commons o Create a link between all facilities in the Commons o Strike a balance between serving as a community asset and driving economic impact
MARKET DEMOGRAPHICS • The Virginia Beach region is a growing market and, in most cases, is outpacing the state in
terms of population growth, income, education, and other demographic characteristics. The market segment within a 20-minute drive time of the site has a significant population base and is growing at a faster rate than the overall City of Virginia Beach.
• According to a Virginia Beach Parks and Recreation community survey conducted in 2005,
awareness and usage of parks is high with 72% of households visiting a Virginia Beach park within the last year. The survey results showed that community participation in recreation programs (34%) is above the national average of 29%. The data suggest that the area surrounding the potential site is strong in terms of marketability and has a captive audience.
COMPARABLE FACILITIES • Overall the City provides six recreation centers that range in size from 22,000 to 83,000
square feet. Currently, Parks and Recreation has a significant shortage of indoor court space and is using space at the public schools to meet the growing demand.
• There continues to be private development interest in building sports facilities; however, the
majority of recreational facilities are still unable to carry all of their operating and development costs. The ability for these facilities to be financially successful is dependent upon, first, their ability to charge market rate for their programs and services (which is often inconsistent with the City/County’s goal of accessibility); and, second, their ability to reduce or eliminate debt service by either off-setting development costs with public contributions (land, infrastructure,
EXECUTIVE SUMMARY
Brailsford & Dunlavey Indoor Sports Venue Feasibility Study Page 3
etc.), minimizing the overall construction cost (using pre-fabricated or other low cost building systems), and/or utilizing other public/private partnerships and donations.
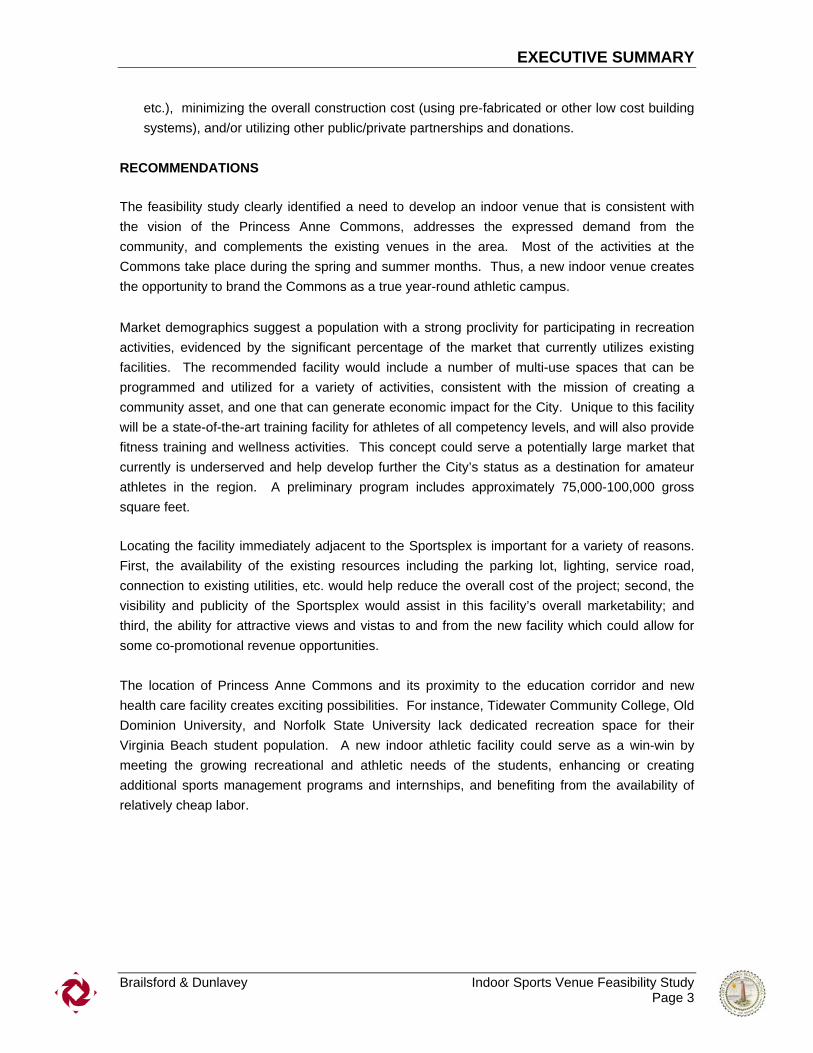
RECOMMENDATIONS The feasibility study clearly identified a need to develop an indoor venue that is consistent with the vision of the Princess Anne Commons, addresses the expressed demand from the community, and complements the existing venues in the area. Most of the activities at the Commons take place during the spring and summer months. Thus, a new indoor venue creates the opportunity to brand the Commons as a true year-round athletic campus.
Market demographics suggest a population with a strong proclivity for participating in recreation activities, evidenced by the significant percentage of the market that currently utilizes existing facilities. The recommended facility would include a number of multi-use spaces that can be programmed and utilized for a variety of activities, consistent with the mission of creating a community asset, and one that can generate economic impact for the City. Unique to this facility will be a state-of-the-art training facility for athletes of all competency levels, and will also provide fitness training and wellness activities. This concept could serve a potentially large market that currently is underserved and help develop further the City’s status as a destination for amateur athletes in the region. A preliminary program includes approximately 75,000-100,000 gross square feet. Locating the facility immediately adjacent to the Sportsplex is important for a variety of reasons. First, the availability of the existing resources including the parking lot, lighting, service road, connection to existing utilities, etc. would help reduce the overall cost of the project; second, the visibility and publicity of the Sportsplex would assist in this facility’s overall marketability; and third, the ability for attractive views and vistas to and from the new facility which could allow for some co-promotional revenue opportunities. The location of Princess Anne Commons and its proximity to the education corridor and new health care facility creates exciting possibilities. For instance, Tidewater Community College, Old Dominion University, and Norfolk State University lack dedicated recreation space for their Virginia Beach student population. A new indoor athletic facility could serve as a win-win by meeting the growing recreational and athletic needs of the students, enhancing or creating additional sports management programs and internships, and benefiting from the availability of relatively cheap labor.
EXECUTIVE SUMMARY
Brailsford & Dunlavey Indoor Sports Venue Feasibility Study Page 4
NEXT STEPS This study identified an opportunity to develop an indoor facility that can serve the growing needs of the Virginia Beach community. The next steps involve determining the best method to develop and finance this project. Possible next steps include:
• Presentation of the findings of this study to the City Council to determine its overall interest in pursuing and financing this project.
• Continued discussions with the local institutions of higher education, Sentara Health, and
others to look at additional sources of funds.
• If the City has limited debt capacity and is not interested in funding this project, consider developing an RFP to test private development interest. The RFP should be flexible enough to allow for maximum creativity among the responses but rigid enough to ensure that the Princess Anne Commons design guidelines and program needs addressed in this study are met. In B&D’s experience, there are only a handful of groups that have this expertise, so the responses would be limited. In fact, there is a real possibility that the City may not receive a single response that meets all of its requirements. In B&D’s experience, the ability to sweeten the pot (i.e. include other facilities or developments in the mix) could help make a potential deal more attractive and viable to private groups.
• Each response would need to include a proforma and business plan to show how the
building would be built and operated. In addition, the responses should focus on four key areas. First, the overall long-term viability of the project with a focus on minimizing the risk to the City; second, assumptions regarding the pricing for facilities, services, and programs; third, operating cost assumptions ensuring that they include realistic projections for staffing, utilities, insurance, etc; and fourth, overall design and construction quality of the facility and how it fits within the overall context of the Princess Anne Commons Master Plan.

Section B

This page intentionally blank
MARKET ANALYSIS
Brailsford & Dunlavey Indoor Sports Venue Feasibility Study Page 1
INTRODUCTION This comprehensive market analysis is intended to measure and evaluate the Virginia Beach market and its ability to support a new indoor venue. The study relies on the findings of a detailed market analysis to establish the basis for outlining an appropriate building program and projecting the financial performance of the facility. In addition, the study evaluates various site locations and configurations and provides the basis from which the City can make educated and informed project-related decisions. METHODOLOGY Brailsford & Dunlavey utilized both primary and secondary sources to complete several exercises and gain a thorough understanding of the City’s needs and regional market. The process started with defining strategic objectives for the project by conducting several interviews with key city stakeholders. The following components were completed to support the market analysis: • Defined strategic objectives with key city officials; • Analyzed demographic and economic data for the region; • Reviewed existing recreation facilities both regionally and nationally; • Evaluated market opportunities; and • Developed preliminary program. STRATEGIC OBJECTIVES In order to define project parameters and set strategic objectives, B&D conducted interviews with several city officials. These individuals included representatives from the Department of Economic Development, Convention and Visitors Bureau, and Parks and Recreation. The sessions were intended to focus on the specific needs of the city and determine how a new indoor venue would help achieve these goals. The individuals involved in these discussions represented different constituencies and therefore had different goals for the development of a new facility. In determining how a new facility would meet a diverse set of needs, the common ground was achieving a balance between serving community needs and generating economic impact for the city. In considering the parameters of the project the following were identified as the project objectives: • Stay consistent with the vision for Princess Anne Commons of Live, Work, Play, and Learn • Develop a year-round facility to improve amateur sports in the region • Assist in improving brand awareness for the Commons • Create a link between all facilities in the Commons • Strike a balance between serving as a community asset and driving economic impact
MARKET ANALYSIS
Brailsford & Dunlavey Indoor Sports Venue Feasibility Study Page 2
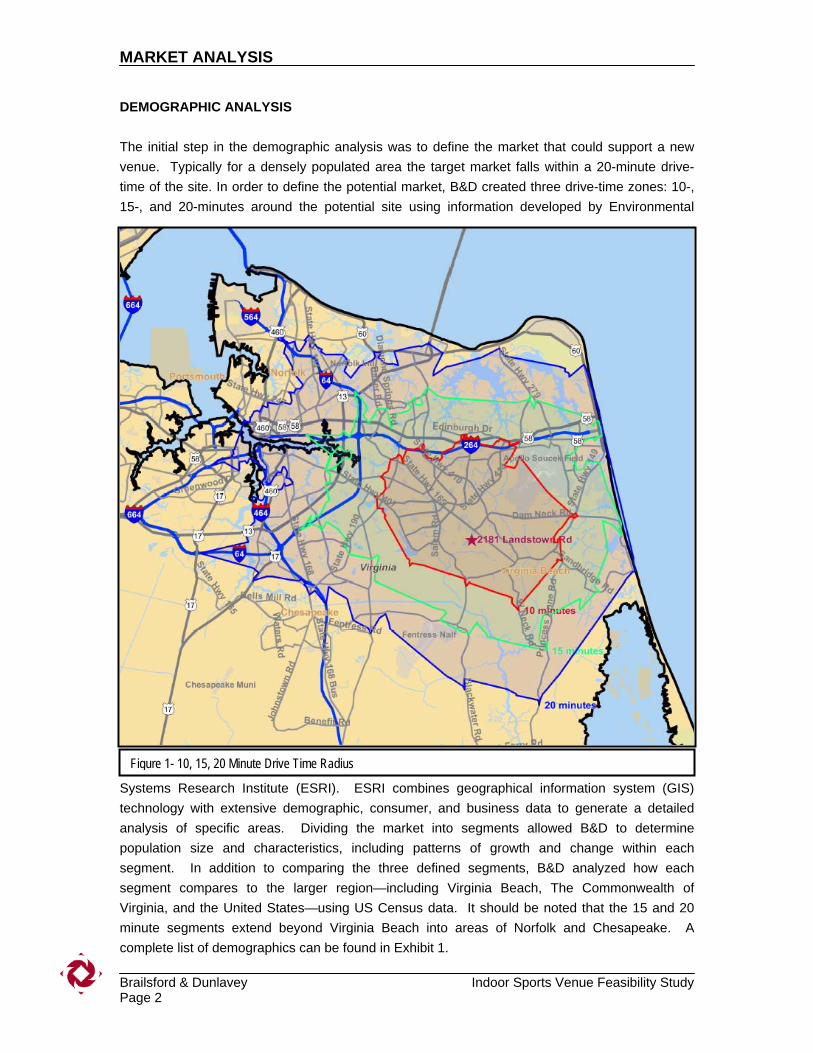
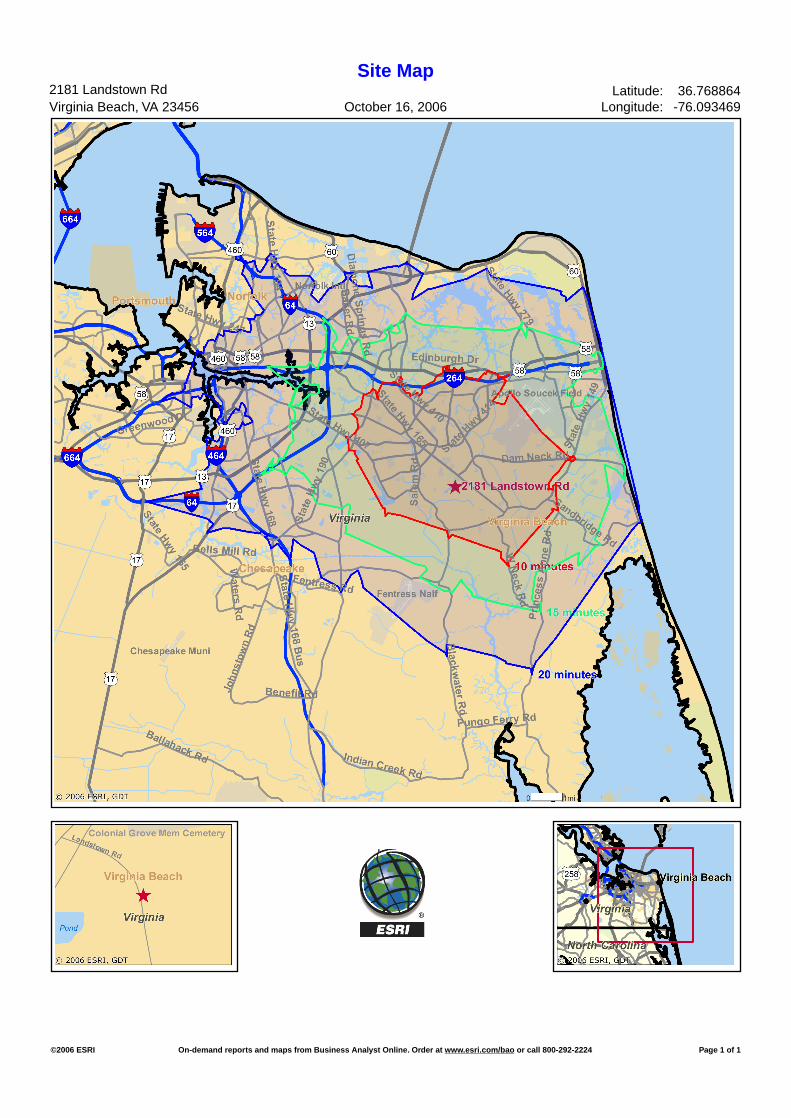
DEMOGRAPHIC ANALYSIS The initial step in the demographic analysis was to define the market that could support a new venue. Typically for a densely populated area the target market falls within a 20-minute drive-time of the site. In order to define the potential market, B&D created three drive-time zones: 10-, 15-, and 20-minutes around the potential site using information developed by Environmental
Systems Research Institute (ESRI). ESRI combines geographical information system (GIS) technology with extensive demographic, consumer, and business data to generate a detailed analysis of specific areas. Dividing the market into segments allowed B&D to determine population size and characteristics, including patterns of growth and change within each segment. In addition to comparing the three defined segments, B&D analyzed how each segment compares to the larger region—including Virginia Beach, The Commonwealth of Virginia, and the United States—using US Census data. It should be noted that the 15 and 20 minute segments extend beyond Virginia Beach into areas of Norfolk and Chesapeake. A complete list of demographics can be found in Exhibit 1.
Figure 1- 10, 15, 20 Minute Drive Time Radius
MARKET ANALYSIS
Brailsford & Dunlavey Indoor Sports Venue Feasibility Study Page 3
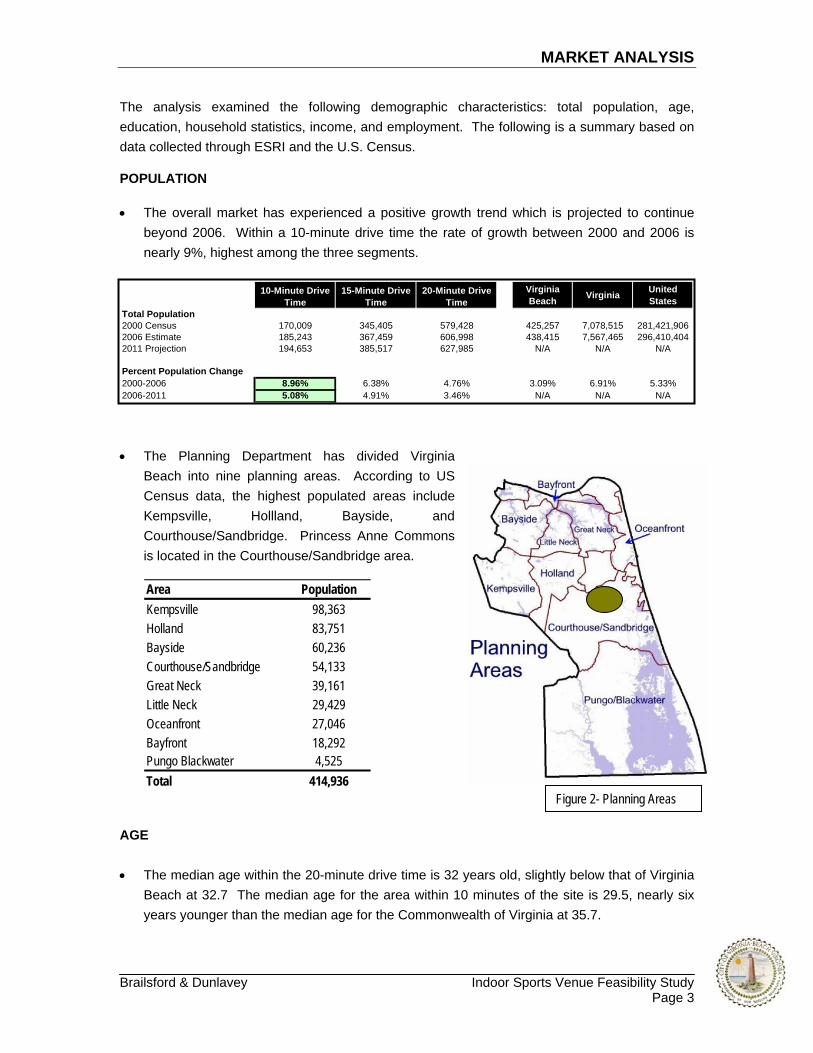
The analysis examined the following demographic characteristics: total population, age, education, household statistics, income, and employment. The following is a summary based on data collected through ESRI and the U.S. Census. POPULATION • The overall market has experienced a positive growth trend which is projected to continue
beyond 2006. Within a 10-minute drive time the rate of growth between 2000 and 2006 is nearly 9%, highest among the three segments.
• The Planning Department has divided Virginia
Beach into nine planning areas. According to US Census data, the highest populated areas include Kempsville, Hollland, Bayside, and Courthouse/Sandbridge. Princess Anne Commons is located in the Courthouse/Sandbridge area.
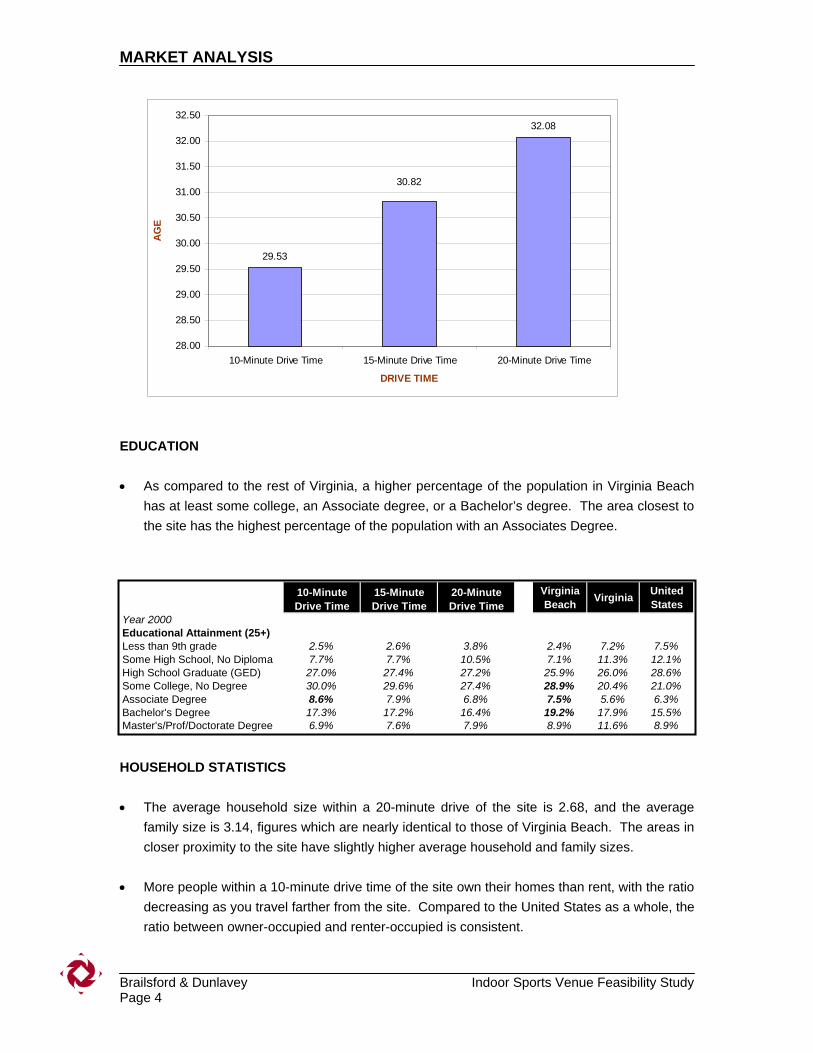
AGE • The median age within the 20-minute drive time is 32 years old, slightly below that of Virginia
Beach at 32.7 The median age for the area within 10 minutes of the site is 29.5, nearly six years younger than the median age for the Commonwealth of Virginia at 35.7.
10-Minute Drive Time
15-Minute Drive Time
20-Minute Drive Time
Virginia Beach Virginia United
StatesTotal Population2000 Census 170,009 345,405 579,428 425,257 7,078,515 281,421,9062006 Estimate 185,243 367,459 606,998 438,415 7,567,465 296,410,4042011 Projection 194,653 385,517 627,985 N/A N/A N/A
Percent Population Change2000-2006 8.96% 6.38% 4.76% 3.09% 6.91% 5.33%2006-2011 5.08% 4.91% 3.46% N/A N/A N/A
Area PopulationKempsville 98,363Holland 83,751Bayside 60,236Courthouse/Sandbridge 54,133Great Neck 39,161Little Neck 29,429Oceanfront 27,046Bayfront 18,292Pungo Blackwater 4,525Total 414,936
Figure 2- Planning Areas
MARKET ANALYSIS
Brailsford & Dunlavey Indoor Sports Venue Feasibility Study Page 4
EDUCATION • As compared to the rest of Virginia, a higher percentage of the population in Virginia Beach
has at least some college, an Associate degree, or a Bachelor’s degree. The area closest to the site has the highest percentage of the population with an Associates Degree.
HOUSEHOLD STATISTICS • The average household size within a 20-minute drive of the site is 2.68, and the average
family size is 3.14, figures which are nearly identical to those of Virginia Beach. The areas in closer proximity to the site have slightly higher average household and family sizes.
• More people within a 10-minute drive time of the site own their homes than rent, with the ratio
decreasing as you travel farther from the site. Compared to the United States as a whole, the ratio between owner-occupied and renter-occupied is consistent.
10-Minute Drive Time
15-Minute Drive Time
20-Minute Drive Time
Virginia Beach Virginia United
StatesYear 2000Educational Attainment (25+)Less than 9th grade 2.5% 2.6% 3.8% 2.4% 7.2% 7.5%Some High School, No Diploma 7.7% 7.7% 10.5% 7.1% 11.3% 12.1%High School Graduate (GED) 27.0% 27.4% 27.2% 25.9% 26.0% 28.6%Some College, No Degree 30.0% 29.6% 27.4% 28.9% 20.4% 21.0%Associate Degree 8.6% 7.9% 6.8% 7.5% 5.6% 6.3%Bachelor's Degree 17.3% 17.2% 16.4% 19.2% 17.9% 15.5%Master's/Prof/Doctorate Degree 6.9% 7.6% 7.9% 8.9% 11.6% 8.9%
29.53
32.08
30.82
28.00
28.50
29.00
29.50
30.00
30.50
31.00
31.50
32.00
32.50
10-Minute Drive Time 15-Minute Drive Time 20-Minute Drive Time
DRIVE TIME
AGE
MARKET ANALYSIS
Brailsford & Dunlavey Indoor Sports Venue Feasibility Study Page 5
• The average travel time to the workplace within each age segment is rather consistent and ranges between 23 and 24 minutes.
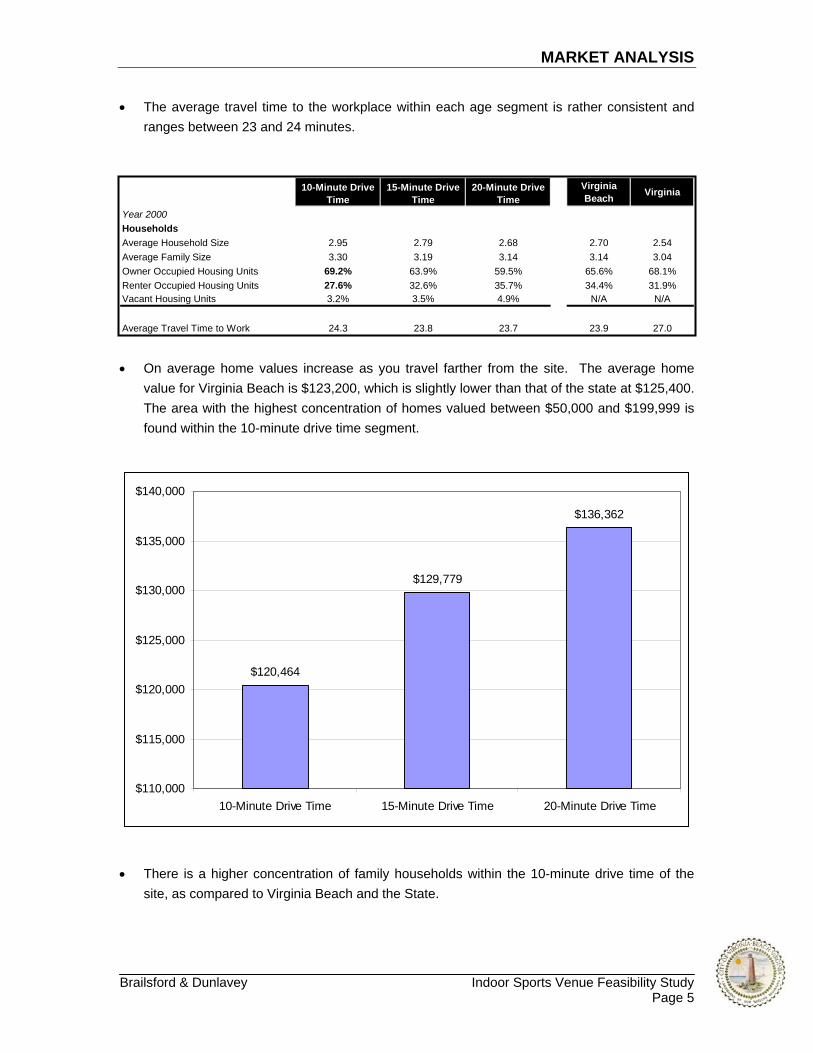
• On average home values increase as you travel farther from the site. The average home
value for Virginia Beach is $123,200, which is slightly lower than that of the state at $125,400. The area with the highest concentration of homes valued between $50,000 and $199,999 is found within the 10-minute drive time segment.
• There is a higher concentration of family households within the 10-minute drive time of the
site, as compared to Virginia Beach and the State.
$120,464
$129,779
$136,362
$110,000
$115,000
$120,000
$125,000
$130,000
$135,000
$140,000
10-Minute Drive Time 15-Minute Drive Time 20-Minute Drive Time
10-Minute Drive Time
15-Minute Drive Time
20-Minute Drive Time
Virginia Beach Virginia
Year 2000HouseholdsAverage Household Size 2.95 2.79 2.68 2.70 2.54Average Family Size 3.30 3.19 3.14 3.14 3.04Owner Occupied Housing Units 69.2% 63.9% 59.5% 65.6% 68.1%Renter Occupied Housing Units 27.6% 32.6% 35.7% 34.4% 31.9%Vacant Housing Units 3.2% 3.5% 4.9% N/A N/A
Average Travel Time to Work 24.3 23.8 23.7 23.9 27.0

MARKET ANALYSIS
Brailsford & Dunlavey Indoor Sports Venue Feasibility Study Page 6
• The Virginia Beach area is more diverse in terms of race and ethnicity, as compared to
Virginia and the rest of the United States. The diversity is higher within the 20-minute drive time of the site.
INCOME • The average income for the target market is higher than that of Virginia Beach and the State.
Within a 10-minute drive time of the site there is a higher concentration of wealth for those making between $35,000 and $99,999.
10-Minute Drive Time
15-Minute Drive Time
20-Minute Drive Time
Virginia Beach Virginia United States
Year 2000Households by TypeFamily Households 77.7% 73.8% 71.1% 71.8% 68.5% 68.1% Married-couple Family 60.4% 56.5% 51.3% 55.7% 52.8% 51.7% With Related Children 35.8% 31.7% 27.1% 28.6% 23.9% 23.5% Other Family (No Spouse) 17.3% 17.3% 19.8% N/A N/A N/A With Related Children 12.8% 12.4% 14.1% N/A N/A N/ANonfamily Households 22.3% 26.2% 28.9% 28.2% 31.5% 31.9% Householder Living Alone 15.4% 18.6% 21.6% 20.4% 25.1% 25.8% Householder Not Living Alone 7.0% 7.6% 7.3% N/A N/A N/A
$54,771
$48,705
$41,994
$46,677
$55,991$56,426
$0
$10,000
$20,000
$30,000
$40,000
$50,000
$60,000
10-MinuteDrive Time
15-MinuteDrive Time
20-MinuteDrive Time
Virginia Beach Virginia United States
MARKET ANALYSIS
Brailsford & Dunlavey Indoor Sports Venue Feasibility Study Page 7
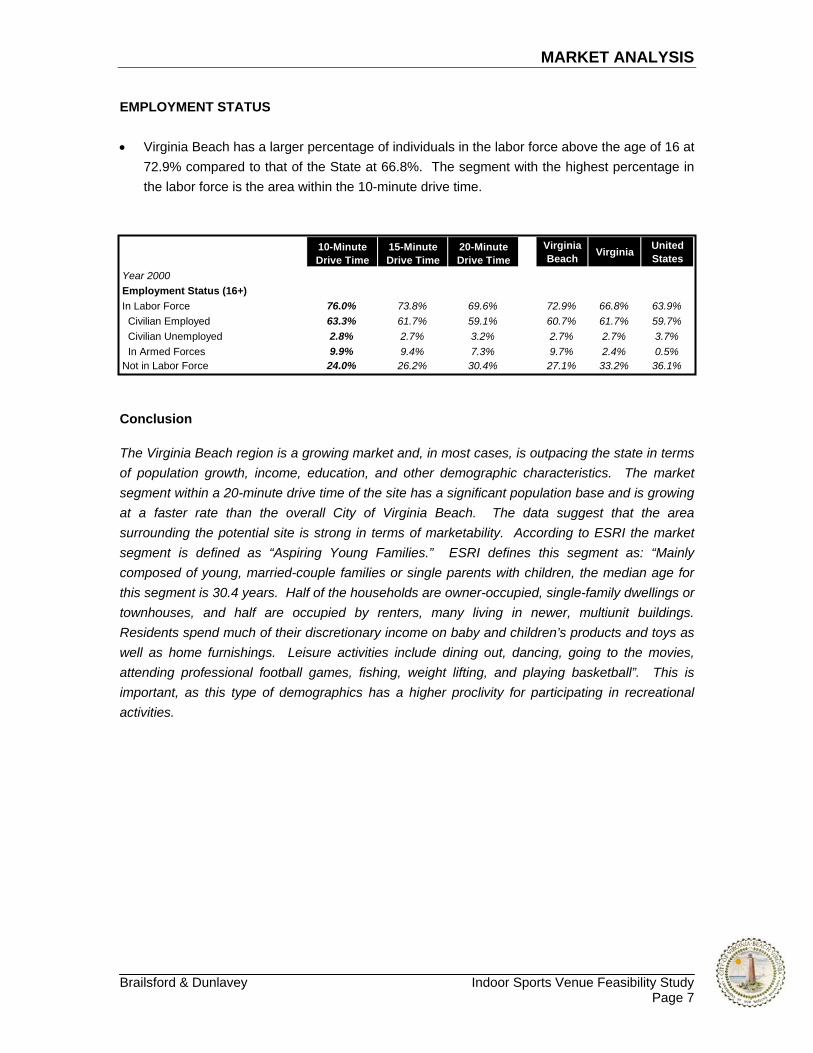
EMPLOYMENT STATUS • Virginia Beach has a larger percentage of individuals in the labor force above the age of 16 at
72.9% compared to that of the State at 66.8%. The segment with the highest percentage in the labor force is the area within the 10-minute drive time.
Conclusion The Virginia Beach region is a growing market and, in most cases, is outpacing the state in terms of population growth, income, education, and other demographic characteristics. The market segment within a 20-minute drive time of the site has a significant population base and is growing at a faster rate than the overall City of Virginia Beach. The data suggest that the area surrounding the potential site is strong in terms of marketability. According to ESRI the market segment is defined as “Aspiring Young Families.” ESRI defines this segment as: “Mainly composed of young, married-couple families or single parents with children, the median age for this segment is 30.4 years. Half of the households are owner-occupied, single-family dwellings or townhouses, and half are occupied by renters, many living in newer, multiunit buildings. Residents spend much of their discretionary income on baby and children’s products and toys as well as home furnishings. Leisure activities include dining out, dancing, going to the movies, attending professional football games, fishing, weight lifting, and playing basketball”. This is important, as this type of demographics has a higher proclivity for participating in recreational activities.
10-Minute Drive Time
15-Minute Drive Time
20-Minute Drive Time
Virginia Beach Virginia United
StatesYear 2000Employment Status (16+)In Labor Force 76.0% 73.8% 69.6% 72.9% 66.8% 63.9% Civilian Employed 63.3% 61.7% 59.1% 60.7% 61.7% 59.7% Civilian Unemployed 2.8% 2.7% 3.2% 2.7% 2.7% 3.7% In Armed Forces 9.9% 9.4% 7.3% 9.7% 2.4% 0.5%Not in Labor Force 24.0% 26.2% 30.4% 27.1% 33.2% 36.1%

MARKET ANALYSIS
Brailsford & Dunlavey Indoor Sports Venue Feasibility Study Page 8
COMPARABLE FACILITY ANALYSIS OBJECTIVE The objective of this analysis was to examine different operating models for indoor and outdoor recreation facilities. In addition, an analysis of the indoor sportsplexes, local recreation facilities within Virginia Beach, and facilities utilized by teams competing in the First Division of the United Soccer League (USL) was undertaken to gain an understanding of the facilities’ programmatic offerings, featured amenities and major revenue opportunities. METHODOLOGY B&D surveyed several sportsplex facilities, local recreation facilities within Virginia Beach, and facilities currently utilized by member teams of the USL’s First Division. This exercise is important to properly assess facility demand, revenue opportunities and strategies. B&D selected four indoor sportsplexes to profile programmatic offerings, and major revenue opportunities, of each center. The following facilities were selected for a comparative analysis:
• Bloomington Sportsplex – Bloomington, IN • Dulles Sportsplex – DC Metropolitan Area • Taylor Sportsplex – Taylor, MI • Triangle Sportsplex – Hillsborough, NC
B&D also included the City’s public recreation centers in this study. Interviews with facility managers and staff provided information on facility size, features, and amenities. The following recreational facilities are located within the City:
• Bayside • Bowcreek • Kempsville • Princess Anne • Seatack • Great Neck
Finally, B&D surveyed member teams of the USL’s First Division to gain an understanding of the facilities used by teams that compete against the Virginia Beach Mariners. The following teams comprise the First Division of the USL:
• Atlanta Silverbacks • Charleston Battery • Miami FC • Minnesota Thunder • Montreal Impact • Portland Timbers
• Puerto Rico Islanders • Rochester Raging Rhinos • Seattle Sounders • Toronto Lynx • Vancouver Whitecaps
MARKET ANALYSIS
Brailsford & Dunlavey Indoor Sports Venue Feasibility Study Page 9
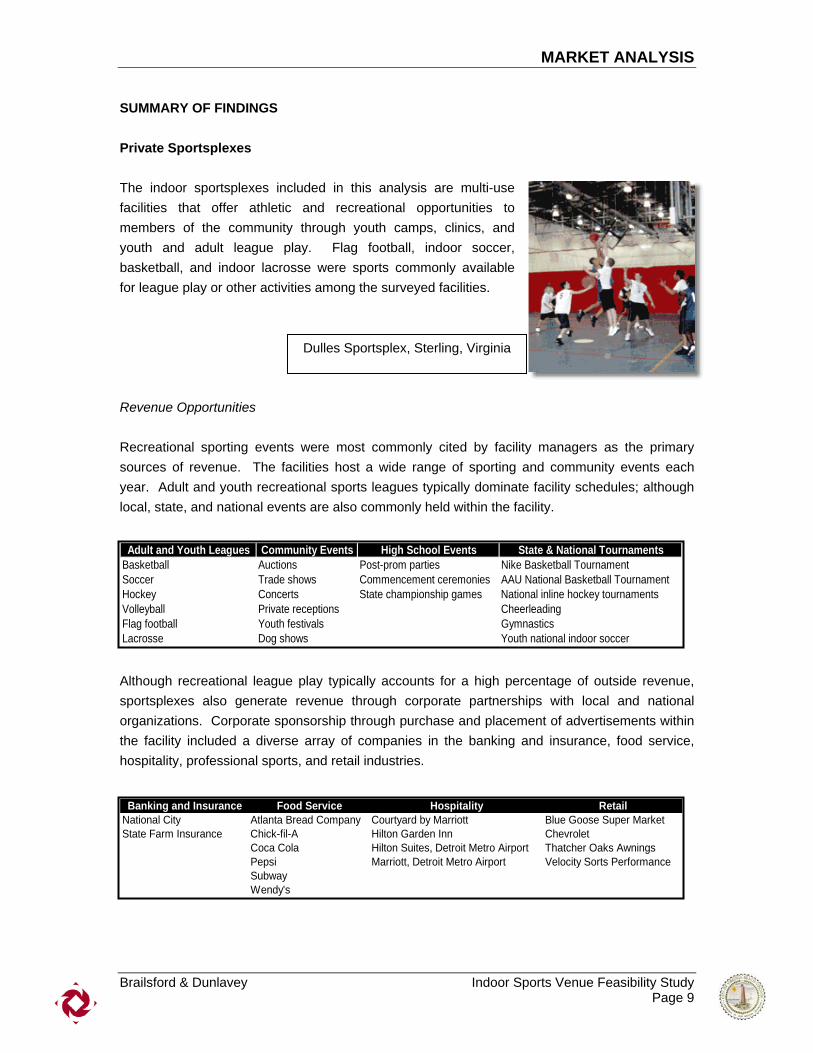
SUMMARY OF FINDINGS Private Sportsplexes
The indoor sportsplexes included in this analysis are multi-use facilities that offer athletic and recreational opportunities to members of the community through youth camps, clinics, and youth and adult league play. Flag football, indoor soccer, basketball, and indoor lacrosse were sports commonly available for league play or other activities among the surveyed facilities. Revenue Opportunities Recreational sporting events were most commonly cited by facility managers as the primary sources of revenue. The facilities host a wide range of sporting and community events each year. Adult and youth recreational sports leagues typically dominate facility schedules; although local, state, and national events are also commonly held within the facility.
Although recreational league play typically accounts for a high percentage of outside revenue, sportsplexes also generate revenue through corporate partnerships with local and national organizations. Corporate sponsorship through purchase and placement of advertisements within the facility included a diverse array of companies in the banking and insurance, food service, hospitality, professional sports, and retail industries.
Adult and Youth Leagues Community Events High School Events State & National TournamentsBasketball Auctions Post-prom parties Nike Basketball TournamentSoccer Trade shows Commencement ceremonies AAU National Basketball TournamentHockey Concerts State championship games National inline hockey tournamentsVolleyball Private receptions CheerleadingFlag football Youth festivals GymnasticsLacrosse Dog shows Youth national indoor soccer
Dulles Sportsplex, Sterling, Virginia
Banking and Insurance Food Service Hospitality RetailNational City Atlanta Bread Company Courtyard by Marriott Blue Goose Super MarketState Farm Insurance Chick-fil-A Hilton Garden Inn Chevrolet
Coca Cola Hilton Suites, Detroit Metro Airport Thatcher Oaks AwningsPepsi Marriott, Detroit Metro Airport Velocity Sorts PerformanceSubwayWendy's
MARKET ANALYSIS
Brailsford & Dunlavey Indoor Sports Venue Feasibility Study Page 10
• The average size of the surveyed sportsplexes was 101,392 gross square feet. Taylor Sportsplex, the largest of the facilities, measured 146,958 gross square feet, while the smallest—Dulles Sportsplex—measured 75,000 gross square feet.
• Commonly featured amenities among the sportsplexes included multiple-use courts
(basketball, volleyball), indoor multi-use fields, pro-shop, and concessions.
• Sportsplexes are generally managed by private management groups. These facilities indicated that they were able to cover operating expenses and in some cases partnered with their respective municipality for assistance with development costs.
• In addition to offering a wide array of recreational and athletic opportunities these facilities
derived significant revenue from renting out private rooms and field spaces. • Two of the four facilities offer annual membership to users, based on a tiered fee structure.
Annual membership fees at the Bloomington and Triangle Sportsplexes were, respectively, $456 and $470 for single adults; $600 and $555 for couples; and $660 and $620 for families.
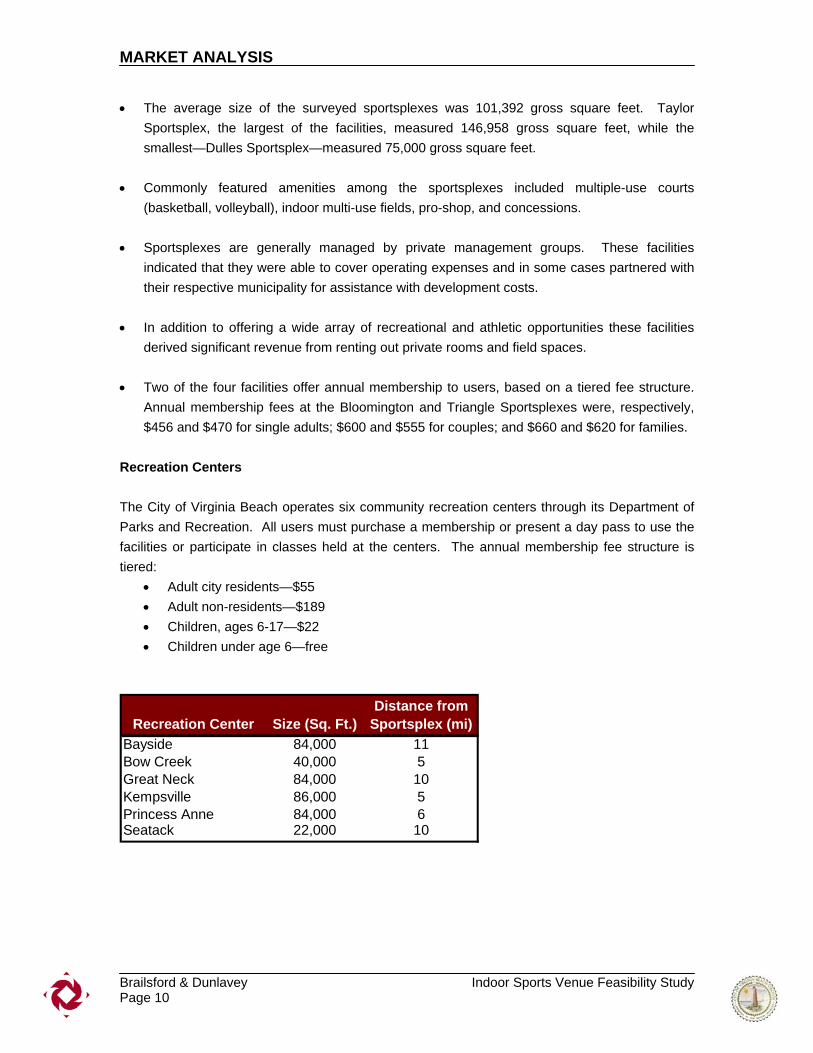
Recreation Centers The City of Virginia Beach operates six community recreation centers through its Department of Parks and Recreation. All users must purchase a membership or present a day pass to use the facilities or participate in classes held at the centers. The annual membership fee structure is tiered:
• Adult city residents—$55 • Adult non-residents—$189 • Children, ages 6-17—$22 • Children under age 6—free
Recreation Center Size (Sq. Ft.)Distance from
Sportsplex (mi)Bayside 84,000 11Bow Creek 40,000 5Great Neck 84,000 10Kempsville 86,000 5Princess Anne 84,000 6Seatack 22,000 10
MARKET ANALYSIS
Brailsford & Dunlavey Indoor Sports Venue Feasibility Study Page 11
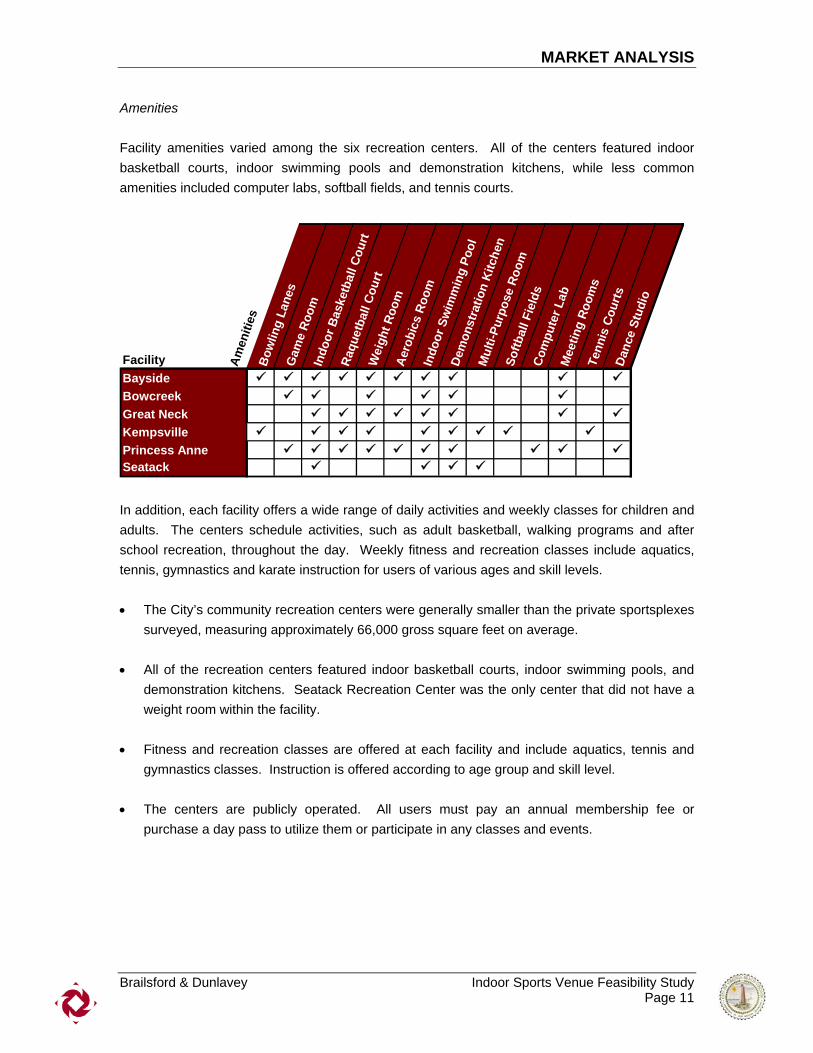
Amenities Facility amenities varied among the six recreation centers. All of the centers featured indoor basketball courts, indoor swimming pools and demonstration kitchens, while less common amenities included computer labs, softball fields, and tennis courts.
In addition, each facility offers a wide range of daily activities and weekly classes for children and adults. The centers schedule activities, such as adult basketball, walking programs and after school recreation, throughout the day. Weekly fitness and recreation classes include aquatics, tennis, gymnastics and karate instruction for users of various ages and skill levels. • The City’s community recreation centers were generally smaller than the private sportsplexes
surveyed, measuring approximately 66,000 gross square feet on average. • All of the recreation centers featured indoor basketball courts, indoor swimming pools, and
demonstration kitchens. Seatack Recreation Center was the only center that did not have a weight room within the facility.
• Fitness and recreation classes are offered at each facility and include aquatics, tennis and
gymnastics classes. Instruction is offered according to age group and skill level. • The centers are publicly operated. All users must pay an annual membership fee or
purchase a day pass to utilize them or participate in any classes and events.
Facility Amen
ities
Bow
ling
Lane
s G
ame
Room
Indo
or B
aske
tbal
l Cou
rtRa
quet
ball
Cour
tW
eigh
t Roo
mAe
robi
cs R
oom
Indo
or S
wim
min
g Po
olDe
mon
stra
tion
Kitc
hen
Mul
ti-Pu
rpos
e Ro
omSo
ftbal
l Fie
lds
Com
pute
r Lab
Mee
ting
Room
sTe
nnis
Cou
rtsDa
nce
Stud
io
Bayside
Princess AnneSeatack
BaysideBowcreekGreat NeckKempsville
MARKET ANALYSIS
Brailsford & Dunlavey Indoor Sports Venue Feasibility Study Page 12
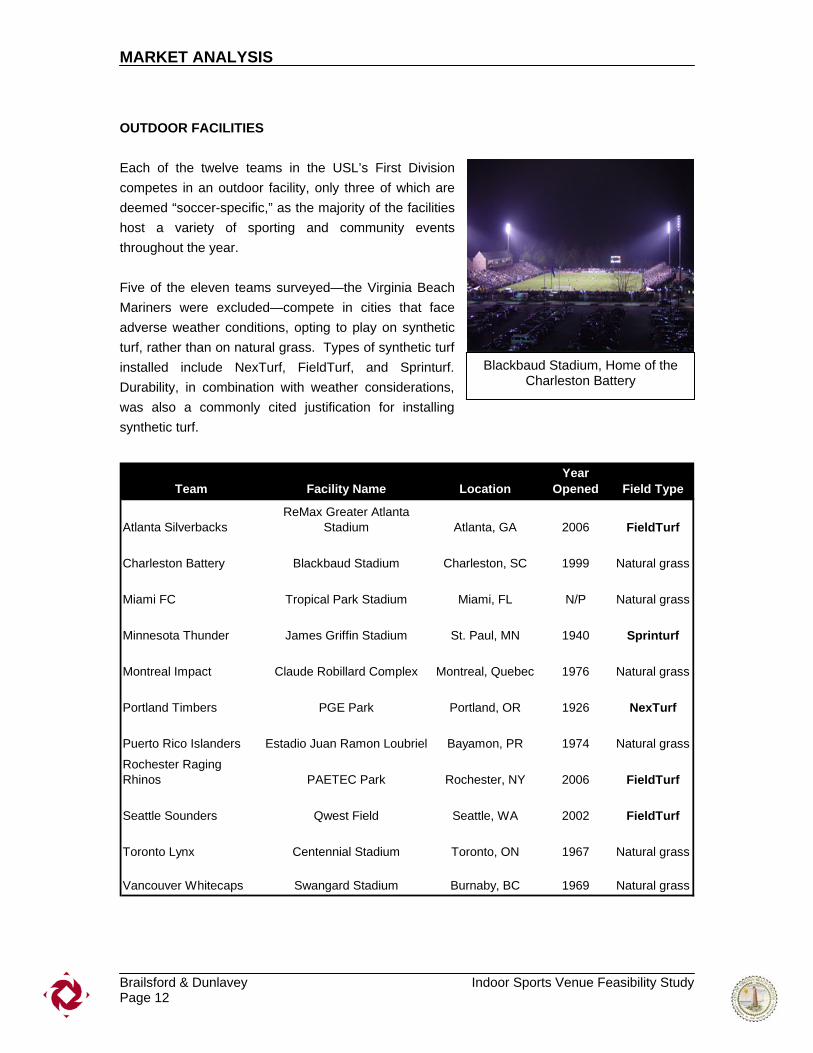
OUTDOOR FACILITIES Each of the twelve teams in the USL’s First Division competes in an outdoor facility, only three of which are deemed “soccer-specific,” as the majority of the facilities host a variety of sporting and community events throughout the year. Five of the eleven teams surveyed—the Virginia Beach Mariners were excluded—compete in cities that face adverse weather conditions, opting to play on synthetic turf, rather than on natural grass. Types of synthetic turf installed include NexTurf, FieldTurf, and Sprinturf. Durability, in combination with weather considerations, was also a commonly cited justification for installing synthetic turf.
Blackbaud Stadium, Home of the Charleston Battery
Team Facility Name LocationYear
Opened Field Type
Atlanta Silverbacks ReMax Greater Atlanta
Stadium Atlanta, GA 2006 FieldTurf
Charleston Battery Blackbaud Stadium Charleston, SC 1999 Natural grass
Miami FC Tropical Park Stadium Miami, FL N/P Natural grass
Minnesota Thunder James Griffin Stadium St. Paul, MN 1940 Sprinturf
Montreal Impact Claude Robillard Complex Montreal, Quebec 1976 Natural grass
Portland Timbers PGE Park Portland, OR 1926 NexTurf
Puerto Rico Islanders Estadio Juan Ramon Loubriel Bayamon, PR 1974 Natural grass
Rochester Raging Rhinos PAETEC Park Rochester, NY 2006 FieldTurf
Seattle Sounders Qwest Field Seattle, WA 2002 FieldTurf
Toronto Lynx Centennial Stadium Toronto, ON 1967 Natural grass
Vancouver Whitecaps Swangard Stadium Burnaby, BC 1969 Natural grass
MARKET ANALYSIS
Brailsford & Dunlavey Indoor Sports Venue Feasibility Study Page 13
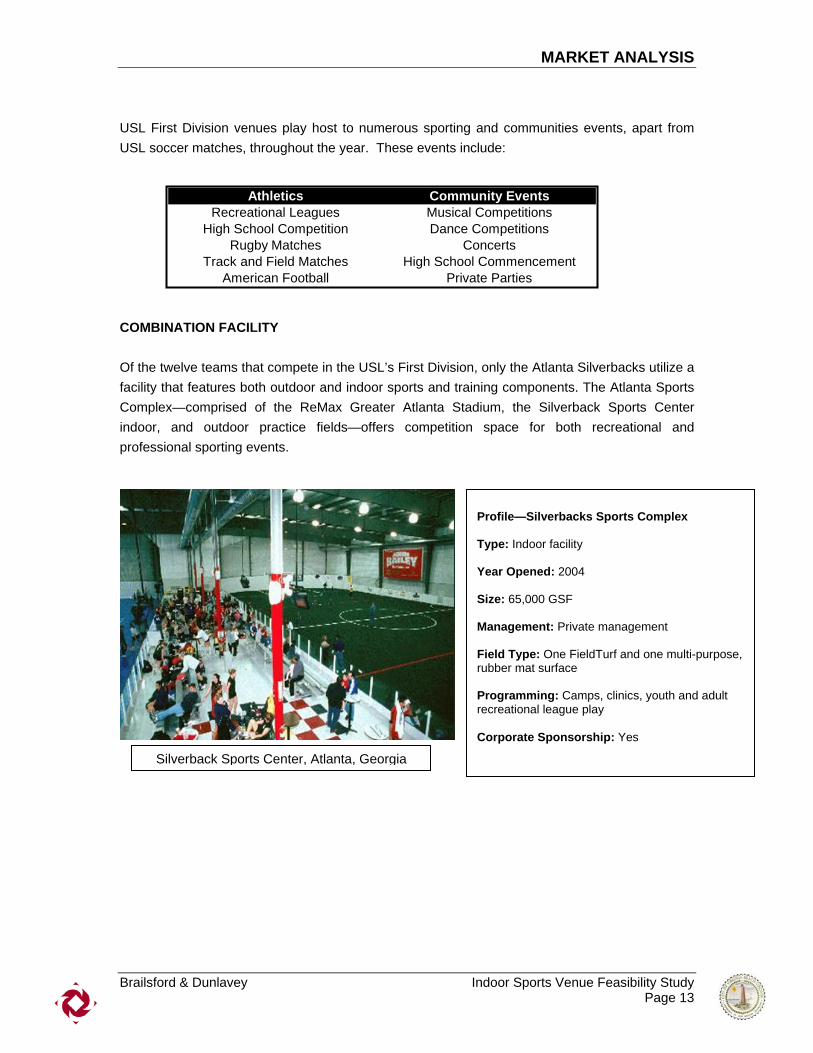
USL First Division venues play host to numerous sporting and communities events, apart from USL soccer matches, throughout the year. These events include: COMBINATION FACILITY Of the twelve teams that compete in the USL’s First Division, only the Atlanta Silverbacks utilize a facility that features both outdoor and indoor sports and training components. The Atlanta Sports Complex—comprised of the ReMax Greater Atlanta Stadium, the Silverback Sports Center indoor, and outdoor practice fields—offers competition space for both recreational and professional sporting events.
Athletics Community EventsRecreational Leagues Musical Competitions
High School Competition Dance CompetitionsRugby Matches Concerts
Track and Field Matches High School CommencementAmerican Football Private Parties
Silverback Sports Center, Atlanta, Georgia
Profile—Silverbacks Sports Complex Type: Indoor facility Year Opened: 2004 Size: 65,000 GSF Management: Private management Field Type: One FieldTurf and one multi-purpose, rubber mat surface Programming: Camps, clinics, youth and adult recreational league play Corporate Sponsorship: Yes
MARKET ANALYSIS
Brailsford & Dunlavey Indoor Sports Venue Feasibility Study Page 14
Summary Findings • Local governments typically operate the facilities, while the remaining facilities are operated
by the teams themselves. Operation of the facilities is closely correlated with the original funding source, e.g. publicly operated facilities were also funded by the city, as well.
• Although the Atlanta Silverbacks and the Rochester Raging Rhinos each opened new
facilities in 2006, the average age of the competition venues was 28.5 years. • Suites are available to soccer patrons at more than half of the venues. • The teams included in this analysis averaged 4,990 fans per game, while the average
capacity of the venues was 8,789. Two teams—the Atlanta Silverbacks and the Rochester Raging Rhinos—plan to expand their current capacities by 12,000 and 2,000 seats, respectively.
• The USL plans to expand the First Division to 16 teams, although the league does not intend
to set a timetable for expansion. • USL officials anticipate long-term viability of the league given previous years’ performance
and the USL’s approach to measured rather than rapid expansion.
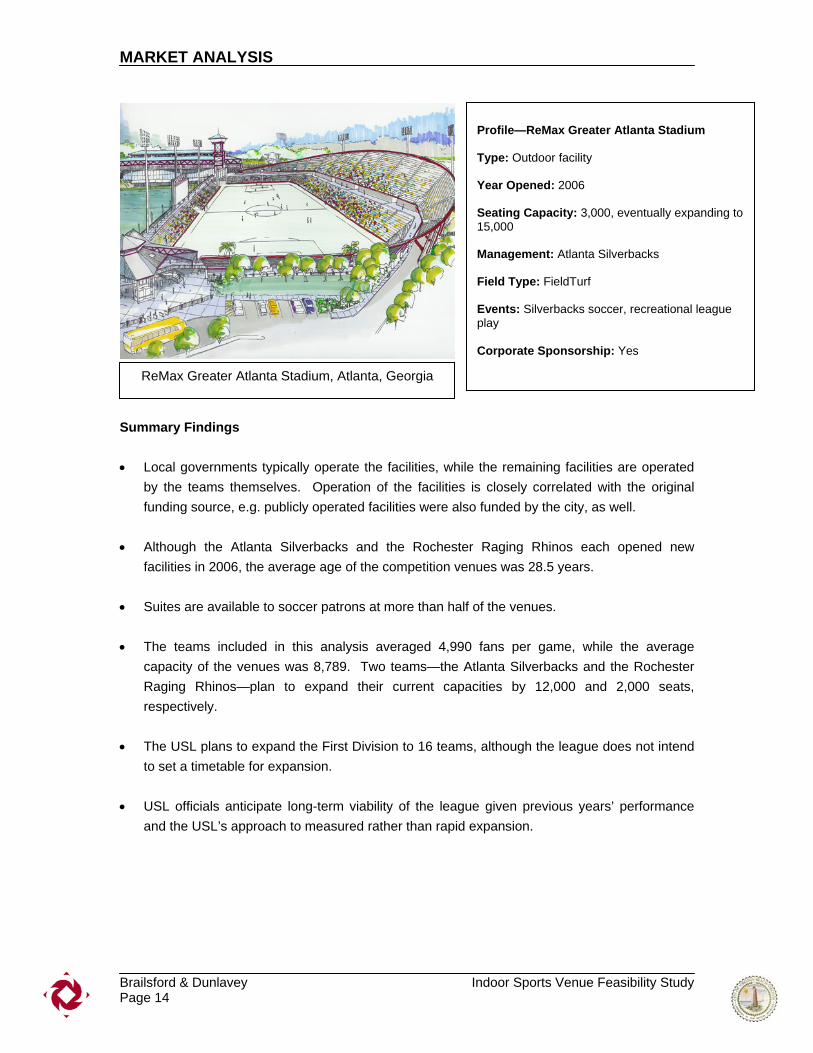
Profile—ReMax Greater Atlanta Stadium Type: Outdoor facility Year Opened: 2006 Seating Capacity: 3,000, eventually expanding to 15,000 Management: Atlanta Silverbacks Field Type: FieldTurf Events: Silverbacks soccer, recreational league play Corporate Sponsorship: Yes
ReMax Greater Atlanta Stadium, Atlanta, Georgia
MARKET ANALYSIS
Brailsford & Dunlavey Indoor Sports Venue Feasibility Study Page 15
MARKET OPPORTUNITIES The Virginia Beach area provides its citizens and visitors diverse outdoor recreation and cultural opportunities. In addition to its abundant natural resources, the area has a robust amount of cultural amenities, outstanding educational institutions, growing population, and one of the lowest crime rates in the nation. Princess Anne Commons is located in an area of Virginia Beach that is experiencing high rates of population growth and economic development. Its central location offers a number of recreational, educational, and entertainment opportunities. This analysis examined the following market strengths and opportunities which became the basis for developing a preliminary building program. MARKET STRENGTHS Desirable destination and strong market identity • Virginia Beach attracts over 2.6 million visitors per year. Virginia ranks within the top states
for total visits and spending according to the Travel Industry Association of America (TIA). • With over 28 miles of public beaches, 79 miles of scenic waterways, and 130 miles of biking
and walking trails, Virginia Beach has a reputation as one of the largest resort cities in the country.
• Visitors to Virginia Beach spent an estimated $828 million in 2005 and generated more than
10,600 jobs and $70.5 million in taxes and fees paid to Virginia Beach, according to the 2005 Virginia Beach Tourism Economic Impact Study.
• Virginia has a diverse set of attractions, including a number of family attractions (National
Wildlife Refuge, Aquarium, Mt. Trashmore), museums, historical sites, amusement parks, outdoor recreation, and many others. The area hosts a number of events each year that includes major amateur sporting events (Rock and Roll Half Marathon) and championship series, concerts, and other entertainment events.
• Virginia Beach attracts visitors from a number of different areas of the country. The Virginia
Beach Overnight Visitor Profile estimates that the highest percentage of visitors came from Virginia (31.2%) followed by Pennsylvania (13.6%), Ohio (8.9%), Maryland (6.9%), and New York (5.6%).
• Located a short distance from the Princess Anne Commons are two development projects
that will enhance the marketability of the Virginia Beach Area, the Convention Center and the Town Center. Phase II of the Convention Center, expected to open in 2007, will have over 500,000 gross square feet of conference and meeting spaces. The Town Center project is a mixed-use development comprised of retail, restaurant, banking, office, hotel, residential, and performing arts spaces. Both of these projects are intended to market Virginia Beach as a quality year-round destination.

MARKET ANALYSIS
Brailsford & Dunlavey Indoor Sports Venue Feasibility Study Page 16
Accessibility • The Virginia Beach area is accessible from major highways (I-264, I-64) and is served by
Norfolk International Airport located just north of the city. • Princess Anne Commons is accessible from multiple access points including Princess Anne
Road from the north and west, Dam Neck Road from the east, and Landstown Road from the south. These roads are heavily traveled; the stretch from Dam Neck Road to Ferrell Parkway has, on average, 51,000 vehicles per day. The stretch from North Landing Road to Dam Neck Road has an average of 21,000 vehicles per day. (Source – Virginia Department of
Transportation) • Within a 20-minute drive, Princess Anne Commons is accessible to nearly the entire city.
Expanding the radius to 30 minutes, the entire city of Virginia Beach, along with Norfolk International Airport, is accessible along with the beach area.
• Discussion with the City to develop the South Eastern Expressway would create another major access point to the Commons linking the areas to the south and east.
Figure 3 – 20-& 30-Minute Drive Time from Commons (Source – Map Point)
MARKET ANALYSIS
Brailsford & Dunlavey Indoor Sports Venue Feasibility Study Page 17
Area and Regional Demographics • As discussed earlier in the document, Virginia Beach has a growing population that is
expected to eclipse 500,000 by the year 2010. Within a five mile radius of the site the estimated population for 2006 totaled 183,261, which more than doubles when the radius is expanded to 8 miles.
• Virginia Beach falls within a Metropolitan Statistical Area (MSA) that includes the principal
cities of Norfolk, Newport News, Hampton, and Portsmouth. As defined by the federal government’s Office of Management and Budget, an MSA is a densely populated area having a high degree of social and economic integration. The US Census estimates that in July 2005 the population of this MSA totaled 1.6 million people, which ranks 33rd among 361 MSAs.
Princess Anne Commons and Virginia Beach Development • The Princess Anne Commons and Virginia Beach area are undergoing many changes that
will support the vision of a great place to live, work, play, and learn. • Sentara Health is developing a 72-acre comprehensive facility that will become a destination
for health services along the Princess Anne corridor of southern Virginia Beach. Phase 1 of the project, now open, includes two 70,000-square foot medical buildings.
• The Virginia Beach Higher Education Center along with Tidewater Community College has
established this area as an Education Corridor for the city and the region. Old Dominion University and Norfolk State University, both tenants of the Education Center, offer a variety of educational opportunities. There is an estimated 80,000 students in the Hampton Roads area.
• Tidewater Community College (“TCC”) itself has close to 12,000 students at its Virginia
Beach Campus and over 36,000 overall. TCC’s strategic plan calls for a number of enhancements to the campus that will have a positive impact on enrollment and retention. The Virginia Beach campus is in negotiations to acquire 28 acres of land for expansion and will offer new and enhanced educational programs.
• Landstown High School, Middle School, and Elementary School are also located in this
education corridor with an approximate population of 5,000 students. Overall the high school population in Virginia Beach is approximately 22,700, and the middle school population is 18,200.
• Princess Anne Commons is comprised of a number of outdoor venues that support several
sports and entertainment options. These venues include the Sportsplex, US Field Hockey Training Facility, Athletic Complex (multi-use athletic fields), Soccer Complex, Golf Course, Amphitheater, Farmers Market, and small park area. The area encompasses approximately
MARKET ANALYSIS
Brailsford & Dunlavey Indoor Sports Venue Feasibility Study Page 18
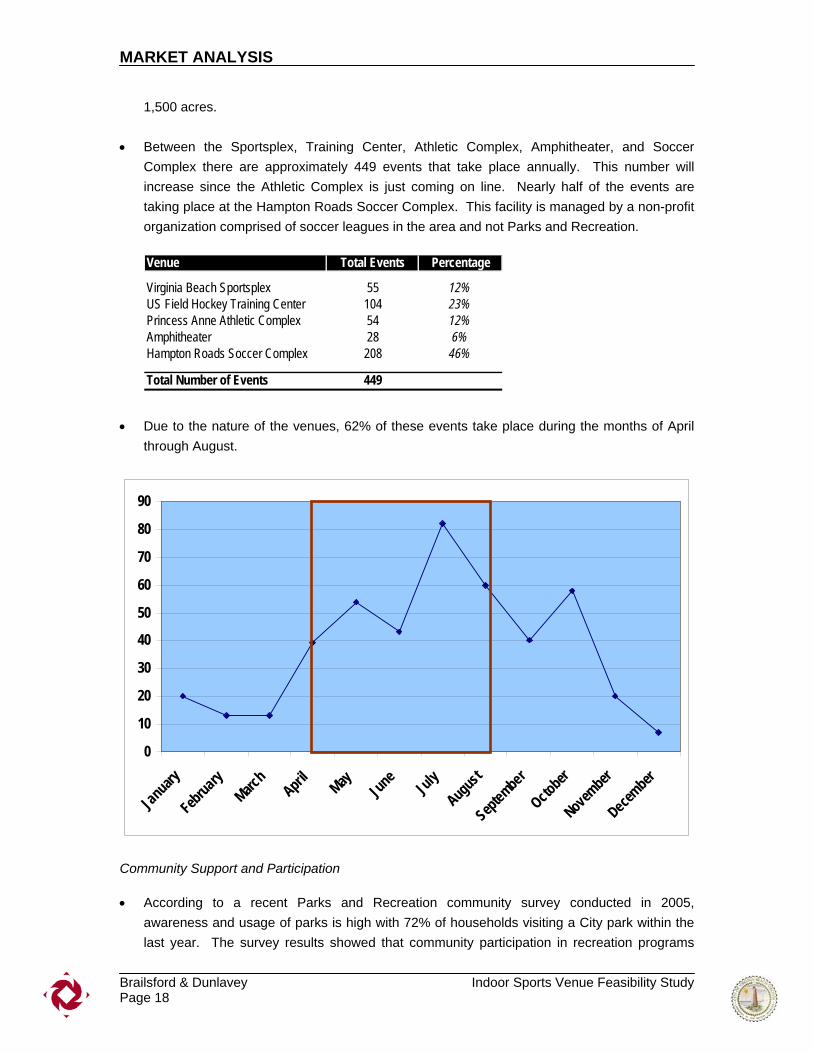
1,500 acres. • Between the Sportsplex, Training Center, Athletic Complex, Amphitheater, and Soccer
Complex there are approximately 449 events that take place annually. This number will increase since the Athletic Complex is just coming on line. Nearly half of the events are taking place at the Hampton Roads Soccer Complex. This facility is managed by a non-profit organization comprised of soccer leagues in the area and not Parks and Recreation.
• Due to the nature of the venues, 62% of these events take place during the months of April
through August.
Community Support and Participation • According to a recent Parks and Recreation community survey conducted in 2005,
awareness and usage of parks is high with 72% of households visiting a City park within the last year. The survey results showed that community participation in recreation programs
Venue Total Events Percentage
Virginia Beach Sportsplex 55 12%US Field Hockey Training Center 104 23%Princess Anne Athletic Complex 54 12%Amphitheater 28 6%Hampton Roads Soccer Complex 208 46%
Total Number of Events 449
0
10
20
30
40
50
60
70
80
90
January
FebruaryMarc
hApril May June
JulyAugust
September
October
November
December
MARKET ANALYSIS
Brailsford & Dunlavey Indoor Sports Venue Feasibility Study Page 19
(34%) is above the national average of 29%. • The survey also assessed facility needs of the community that were consistent throughout
different communities. The community indicated a need for the following facilities: walking and biking trails, recreation centers, parks, and indoor fitness and exercise facilities.
• The survey also indicated a strong desire for adult fitness and wellness programs, as well as
indoor walking and jogging tracks, weight room and cardiovascular equipment, and aerobics/fitness/dance class spaces.
• Survey respondents were very supportive of the City taking action to renovate and develop
walking and biking trails, purchase land and for passive use development, and develop new indoor recreation facilities.
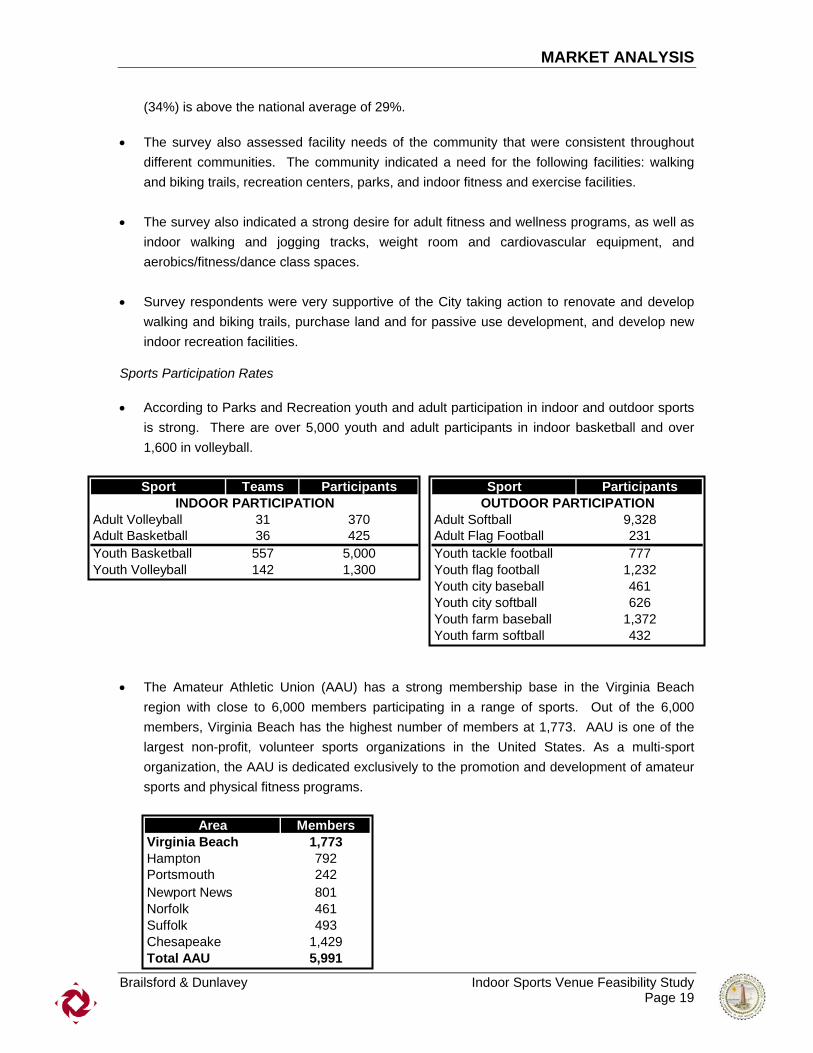
Sports Participation Rates • According to Parks and Recreation youth and adult participation in indoor and outdoor sports
is strong. There are over 5,000 youth and adult participants in indoor basketball and over 1,600 in volleyball.
• The Amateur Athletic Union (AAU) has a strong membership base in the Virginia Beach region with close to 6,000 members participating in a range of sports. Out of the 6,000 members, Virginia Beach has the highest number of members at 1,773. AAU is one of the largest non-profit, volunteer sports organizations in the United States. As a multi-sport organization, the AAU is dedicated exclusively to the promotion and development of amateur sports and physical fitness programs.
Sport Teams Participants
Adult Volleyball 31 370Adult Basketball 36 425Youth Basketball 557 5,000Youth Volleyball 142 1,300
INDOOR PARTICIPATIONSport Participants
Adult Softball 9,328Adult Flag Football 231Youth tackle football 777Youth flag football 1,232Youth city baseball 461Youth city softball 626Youth farm baseball 1,372Youth farm softball 432
OUTDOOR PARTICIPATION
Area MembersVirginia Beach 1,773Hampton 792Portsmouth 242Newport News 801Norfolk 461Suffolk 493Chesapeake 1,429Total AAU 5,991
MARKET ANALYSIS
Brailsford & Dunlavey Indoor Sports Venue Feasibility Study Page 20
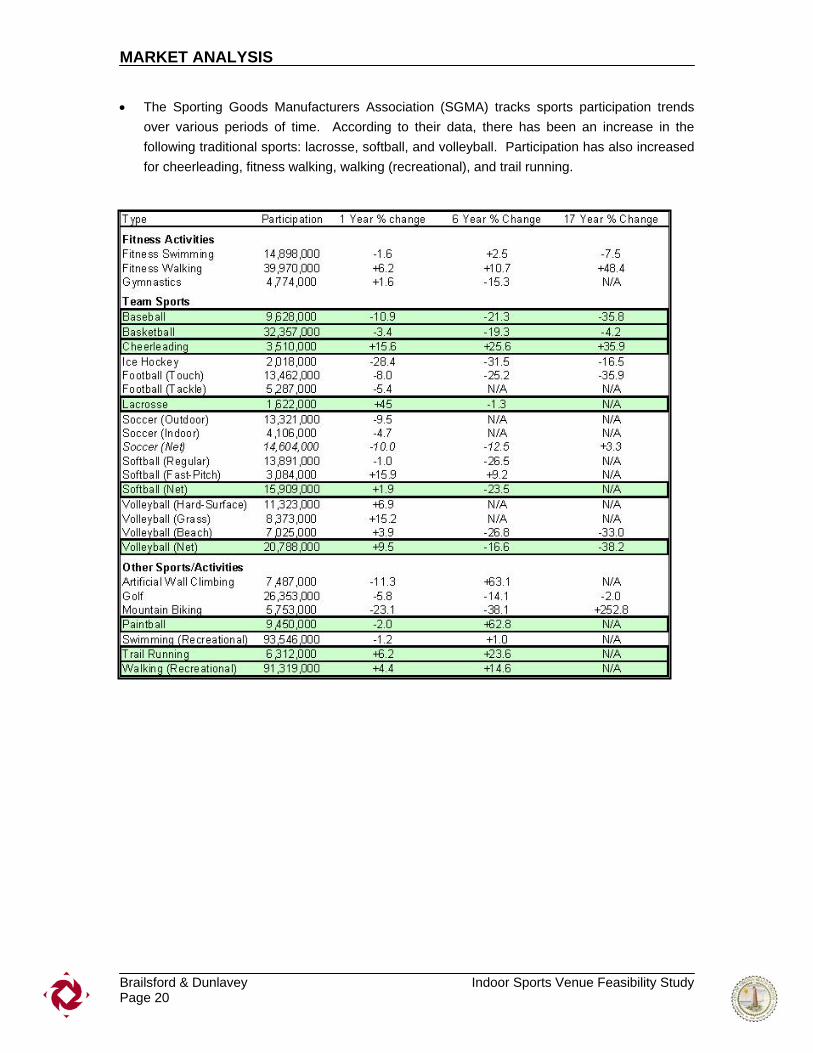
• The Sporting Goods Manufacturers Association (SGMA) tracks sports participation trends over various periods of time. According to their data, there has been an increase in the following traditional sports: lacrosse, softball, and volleyball. Participation has also increased for cheerleading, fitness walking, walking (recreational), and trail running.

MARKET ANALYSIS
Brailsford & Dunlavey Indoor Sports Venue Feasibility Study Page 21
OPPORTUNITIES The information above suggests opportunities to develop an indoor venue that address expressed demand from the community, is consistent with the vision and strategic objectives of the City, and complements the existing outdoor venues that currently exist in the Princess Anne Commons area. The following is a summary of each: • Princess Anne Commons has a number of outdoor athletic venues that supports a variety of
sports. Most of these activities take place during the spring and summer months and remain dormant during the winter months. An indoor venue creates the opportunity to complement the existing outdoor venues and helps to brand the Commons as a true year-round athletic campus.
• The indoor facility would be designed to host a variety of events and activities that meet
specific needs identified by the community, as well as address the opportunity to bring in revenue generating events. Residents of Virginia Beach are frequent users and participate in a number of recreation programs. These residents have expressed a specific need for additional indoor fitness and exercise facilities. A new indoor facility would serve this purpose by adding to the inventory of community spaces and producing additional economic impact through various marketing and outreach efforts.
• In terms of a community asset, the facility would include a number of indoor courts that would
alleviate pressure placed on existing facilities and middle school gyms that currently host basketball games. According to the Parks and Recreation Department, the City is lacking sufficient indoor space to support basketball and other indoor sports. The courts could also be used to host tournaments, leagues, and events that bring visitors to the area and support the goal of developing amateur sports in the region. In talks with AAU, there was expressed interest for more indoor spaces to host events, especially basketball, which is one of the most popular sports in the region.
• Princess Anne Commons’ proximity to the education corridor and new health care facility
create the possibility for partnership opportunities. For instance, discussion with Tidewater Community College revealed the college lacks dedicated recreation space for its student population. Similar to the situation with Parks and Recreation, TCC is forced to partner with schools and other facilities in the area to support its intramural and physical education programs. A new indoor athletic facility could serve the needs of the 12,000 students through a student fee-based partnership. This facility could also serve the student population at Old Dominion and Norfolk State. A new indoor athletic facility could be a win-win by meeting the growing recreational and athletic needs of the students, enhancing or creating additional sports management programs and internships, and benefiting from the availability of relatively cheap labor.
MARKET ANALYSIS
Brailsford & Dunlavey Indoor Sports Venue Feasibility Study Page 22
• Sentara Health is considering partnering with the YMCA to develop a recreation facility on its campus. Plans have not been finalized, and the opportunity to partner with Sentara to support a new facility in Princess Anne Commons should be explored. This partnership could include programming a training facility in the new facility that would be supported by Sentara. With the amount of existing recreation facilities in the area, there is an opportunity to dedicate part of the facility to handle wellness, training, and fitness testing.
• Other potential partnership opportunities can be explored with other sports organizations
such as AAU, Tidewater Volleyball Association, and private developers.

MARKET ANALYSIS
Brailsford & Dunlavey Indoor Sports Venue Feasibility Study Page 23
PRELIMINARY PROGRAM B&D developed a preliminary program based on the finding of the market analysis. The concept focuses on an approximate 100,000-square foot indoor recreation facility with areas dedicated to recreation, athletic development, and training. The size of the facility is consistent with other recreation facilities operated by Parks and Recreation in Virginia Beach. • The overall design of the facility supports a variety of activities to take place from community
events to large tournaments. The recreation component includes a six-court gymnasium and synthetic field that can be used for league games including basketball, volleyball, badminton, soccer, football, hockey, and other activities. With spectator seating this venue could also host AAU and local high school tournaments as well as other large events. An indoor
Unit TotalMajor Program Elements Quantity NASF NASF
RecreationSix Court Gymnasium 1 32,000 32,000Six Court Gymnasium Storage 1 1,000 1,000Gymnasium Spectator Seating 1 7 1,000Weight & Fitness Center 1 5,000 5,000Weight & Fitness Center Storage 1 250 250Large Group Exercise Room 1 1,250 1,250Large Group Exercise Room Storage 1 200 200Medium Group Exercise Room 1 750 750Medium Group Exercise Room Storage 1 200 200
Training FacilityState-of-the-Art Training Center 1 3,000 3,000Multi-Purpose Field 1 13,000 13,000Running/Jogging Track 1 7,000 7,000Therapy Pool 1 900 900
Support SpacesLobby Lounge 1 500 500Men's Locker Room 1 1,000 1,000Women's Locker Room 1 1,000 1,000Family Locker Room 1 750 750Equipment Issue/Maintenance/Storage 1 500 500Recreation Staff Offices 3 100 300Membership Services/Admission Control/Lobby 1 750 750
TOTAL 70,350
Total NASF 70,350Building Core & Circulation With Building Efficiency @ 70% 29,600
Total Building Envelope 99,929
NASF: Net Assignable Square Feet
MARKET ANALYSIS
Brailsford & Dunlavey Indoor Sports Venue Feasibility Study Page 24
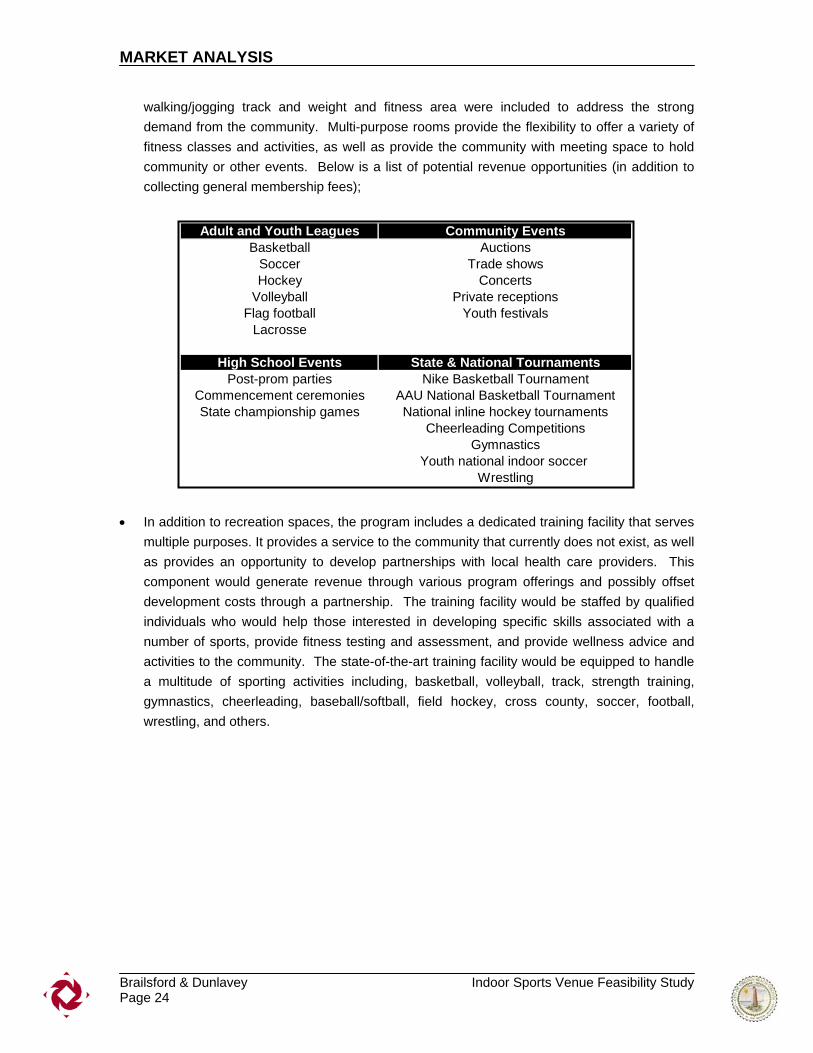
walking/jogging track and weight and fitness area were included to address the strong demand from the community. Multi-purpose rooms provide the flexibility to offer a variety of fitness classes and activities, as well as provide the community with meeting space to hold community or other events. Below is a list of potential revenue opportunities (in addition to collecting general membership fees);
• In addition to recreation spaces, the program includes a dedicated training facility that serves
multiple purposes. It provides a service to the community that currently does not exist, as well as provides an opportunity to develop partnerships with local health care providers. This component would generate revenue through various program offerings and possibly offset development costs through a partnership. The training facility would be staffed by qualified individuals who would help those interested in developing specific skills associated with a number of sports, provide fitness testing and assessment, and provide wellness advice and activities to the community. The state-of-the-art training facility would be equipped to handle a multitude of sporting activities including, basketball, volleyball, track, strength training, gymnastics, cheerleading, baseball/softball, field hockey, cross county, soccer, football, wrestling, and others.
Adult and Youth Leagues Community EventsBasketball Auctions
Soccer Trade showsHockey Concerts
Volleyball Private receptionsFlag football Youth festivals
Lacrosse
High School Events State & National TournamentsPost-prom parties Nike Basketball Tournament
Commencement ceremonies AAU National Basketball TournamentState championship games National inline hockey tournaments
Cheerleading CompetitionsGymnastics
Youth national indoor soccer Wrestling
MARKET ANALYSIS
Brailsford & Dunlavey Indoor Sports Venue Feasibility Study Page 25
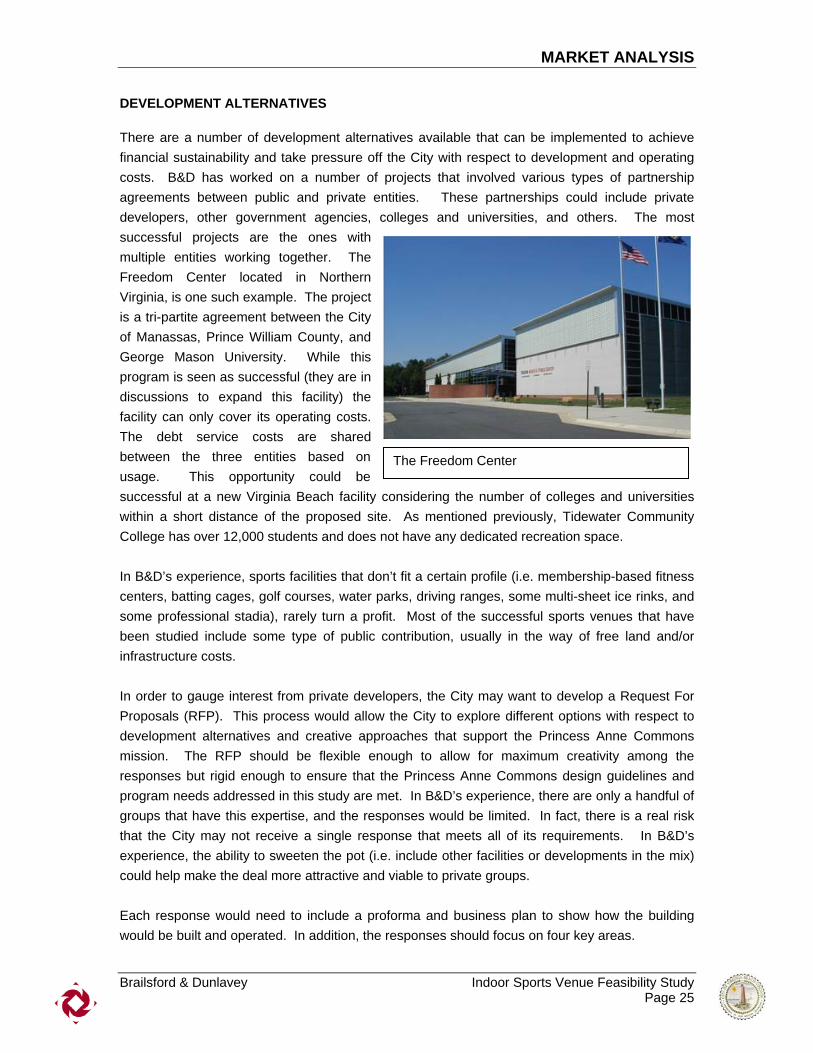
DEVELOPMENT ALTERNATIVES There are a number of development alternatives available that can be implemented to achieve financial sustainability and take pressure off the City with respect to development and operating costs. B&D has worked on a number of projects that involved various types of partnership agreements between public and private entities. These partnerships could include private developers, other government agencies, colleges and universities, and others. The most successful projects are the ones with multiple entities working together. The Freedom Center located in Northern Virginia, is one such example. The project is a tri-partite agreement between the City of Manassas, Prince William County, and George Mason University. While this program is seen as successful (they are in discussions to expand this facility) the facility can only cover its operating costs. The debt service costs are shared between the three entities based on usage. This opportunity could be successful at a new Virginia Beach facility considering the number of colleges and universities within a short distance of the proposed site. As mentioned previously, Tidewater Community College has over 12,000 students and does not have any dedicated recreation space. In B&D’s experience, sports facilities that don’t fit a certain profile (i.e. membership-based fitness centers, batting cages, golf courses, water parks, driving ranges, some multi-sheet ice rinks, and some professional stadia), rarely turn a profit. Most of the successful sports venues that have been studied include some type of public contribution, usually in the way of free land and/or infrastructure costs. In order to gauge interest from private developers, the City may want to develop a Request For Proposals (RFP). This process would allow the City to explore different options with respect to development alternatives and creative approaches that support the Princess Anne Commons mission. The RFP should be flexible enough to allow for maximum creativity among the responses but rigid enough to ensure that the Princess Anne Commons design guidelines and program needs addressed in this study are met. In B&D’s experience, there are only a handful of groups that have this expertise, and the responses would be limited. In fact, there is a real risk that the City may not receive a single response that meets all of its requirements. In B&D’s experience, the ability to sweeten the pot (i.e. include other facilities or developments in the mix) could help make the deal more attractive and viable to private groups. Each response would need to include a proforma and business plan to show how the building would be built and operated. In addition, the responses should focus on four key areas.
The Freedom Center
MARKET ANALYSIS
Brailsford & Dunlavey Indoor Sports Venue Feasibility Study Page 26
• The overall long-term viability of the project with a focus on minimizing the risk to the City; • Assumptions regarding the pricing for facilities, services, and programs; • Operating cost assumptions ensuring that they include realistic projections for staffing,
utilities, insurance, etc; and • Overall design and construction quality of the facility and how it fits within the overall context
of the Princess Anne Commons Master Plan.

Section C

This page intentionally blank
SITE ANALYSIS
Brailsford & Dunlavey Indoor Sports Venue Feasibility Study Page 1
INTRODUCTION A preliminary site analysis was undertaken to identify potential sites suitable for the development of a new indoor recreation facility. Several factors were considered in determining an optimal location for a facility of this type, including strategic objectives, accessibility, parking issues, visual identification, potential environmental impact, Air Installations Compatible Use Zones (AICUSZ), and project financing opportunities. This exercise is intended to gain an understanding of the site context and provide the City with information to help facilitate further discussion. METHODOLOGY The process included a review of existing and proposed master plans, a tour of Princess Anne Commons and surrounding areas, interviews with the city officials, examination of allowable uses (AICUZ), and review of other relevant materials. Based on these issues an analysis was conducted to assess the advantages and disadvantages of different sites. The information presented in this section includes:
• Identification of Area Characteristics • Site Recommendation • Site Opportunities • Site Challenges
SITE CHARACTERISTICS
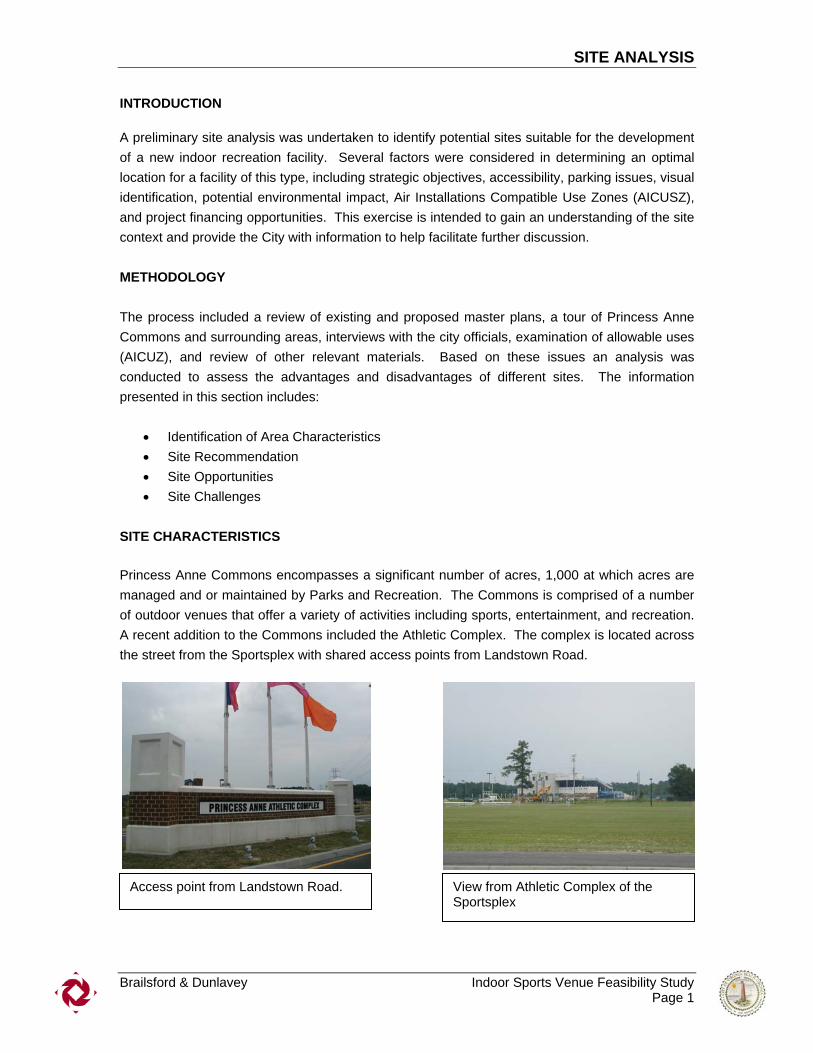
Princess Anne Commons encompasses a significant number of acres, 1,000 at which acres are managed and or maintained by Parks and Recreation. The Commons is comprised of a number of outdoor venues that offer a variety of activities including sports, entertainment, and recreation. A recent addition to the Commons included the Athletic Complex. The complex is located across the street from the Sportsplex with shared access points from Landstown Road.
Access point from Landstown Road. View from Athletic Complex of the Sportsplex
SITE ANALYSIS
Brailsford & Dunlavey Indoor Sports Venue Feasibility Study Page 2
The complex includes eight lighted tournament-quality softball fields and seven multi-purpose playing fields, two of which are lighted. Beginning in Spring 2007, the complex will also feature two full-service concession stands which will be open during league play and tournaments.
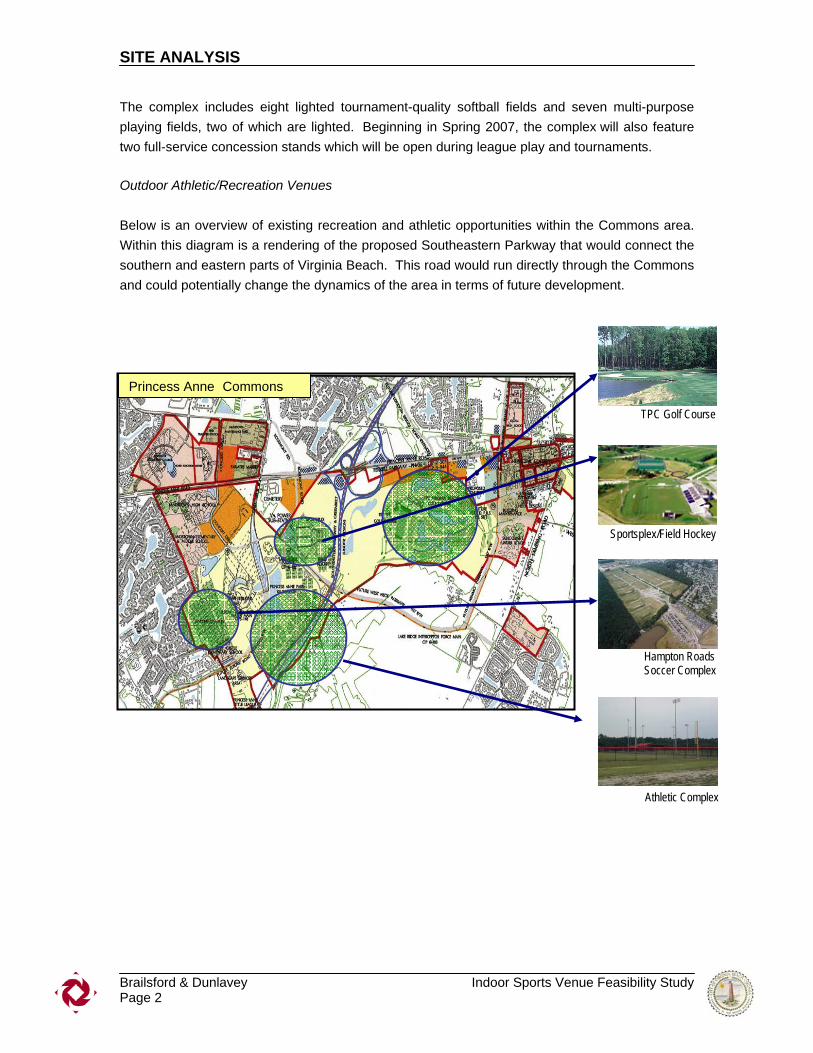
Outdoor Athletic/Recreation Venues Below is an overview of existing recreation and athletic opportunities within the Commons area. Within this diagram is a rendering of the proposed Southeastern Parkway that would connect the southern and eastern parts of Virginia Beach. This road would run directly through the Commons and could potentially change the dynamics of the area in terms of future development.
Princess Anne Commons
TPC Golf Course
Sportsplex/Field Hockey
Hampton Roads Soccer Complex
Athletic Complex
SITE ANALYSIS
Brailsford & Dunlavey Indoor Sports Venue Feasibility Study Page 3
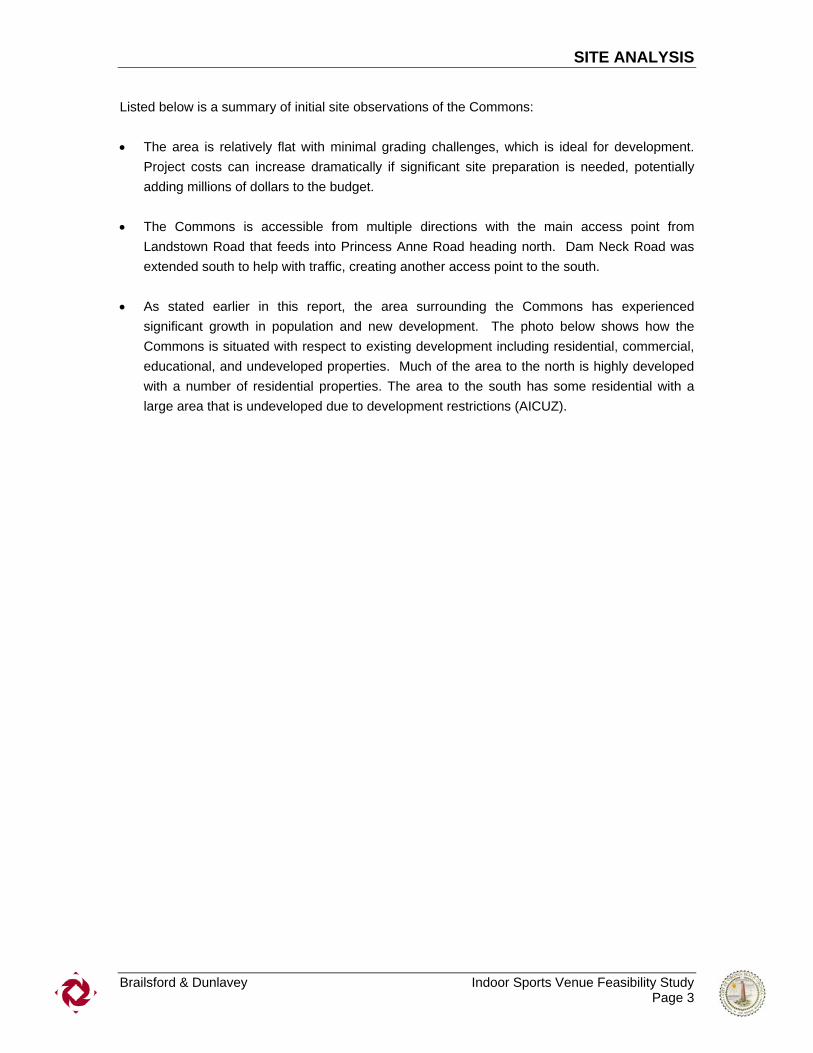
Listed below is a summary of initial site observations of the Commons: • The area is relatively flat with minimal grading challenges, which is ideal for development.
Project costs can increase dramatically if significant site preparation is needed, potentially adding millions of dollars to the budget.
• The Commons is accessible from multiple directions with the main access point from
Landstown Road that feeds into Princess Anne Road heading north. Dam Neck Road was extended south to help with traffic, creating another access point to the south.
• As stated earlier in this report, the area surrounding the Commons has experienced
significant growth in population and new development. The photo below shows how the Commons is situated with respect to existing development including residential, commercial, educational, and undeveloped properties. Much of the area to the north is highly developed with a number of residential properties. The area to the south has some residential with a large area that is undeveloped due to development restrictions (AICUZ).
SITE ANALYSIS
Brailsford & Dunlavey Indoor Sports Venue Feasibility Study Page 4
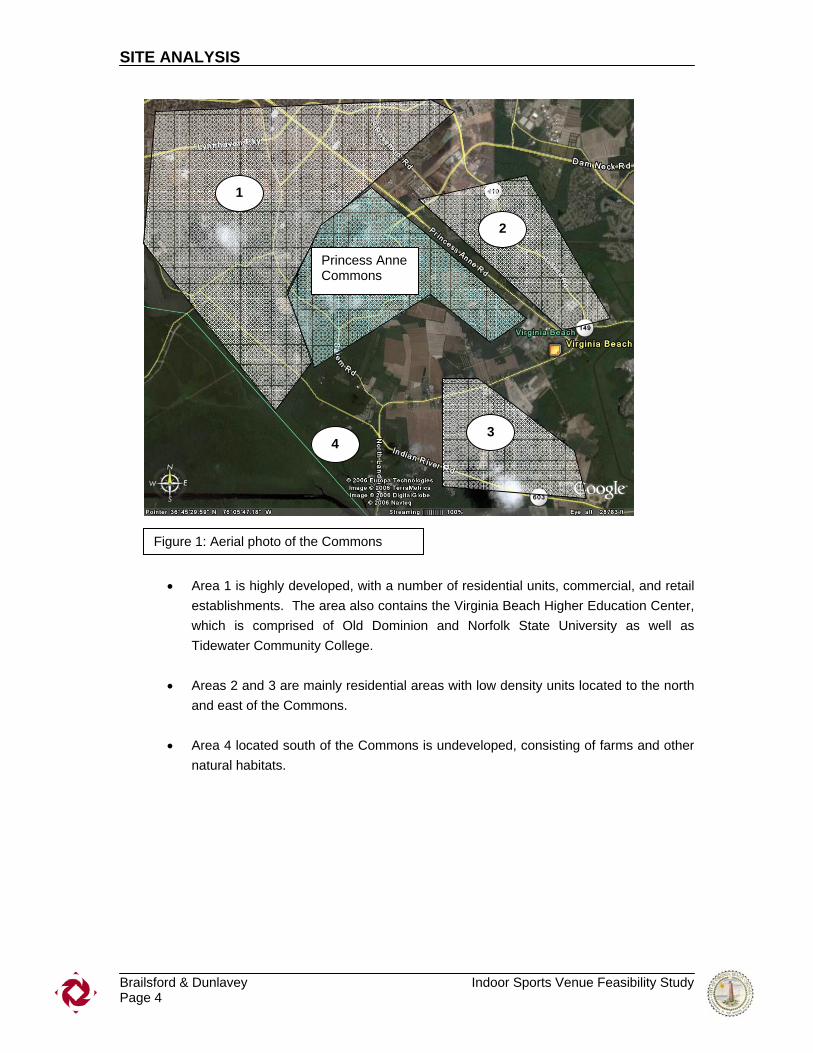
• Area 1 is highly developed, with a number of residential units, commercial, and retail establishments. The area also contains the Virginia Beach Higher Education Center, which is comprised of Old Dominion and Norfolk State University as well as Tidewater Community College.
• Areas 2 and 3 are mainly residential areas with low density units located to the north
and east of the Commons.
• Area 4 located south of the Commons is undeveloped, consisting of farms and other natural habitats.
Figure 1: Aerial photo of the Commons
Princess Anne Commons
1
2
3 4
SITE ANALYSIS
Brailsford & Dunlavey Indoor Sports Venue Feasibility Study Page 5
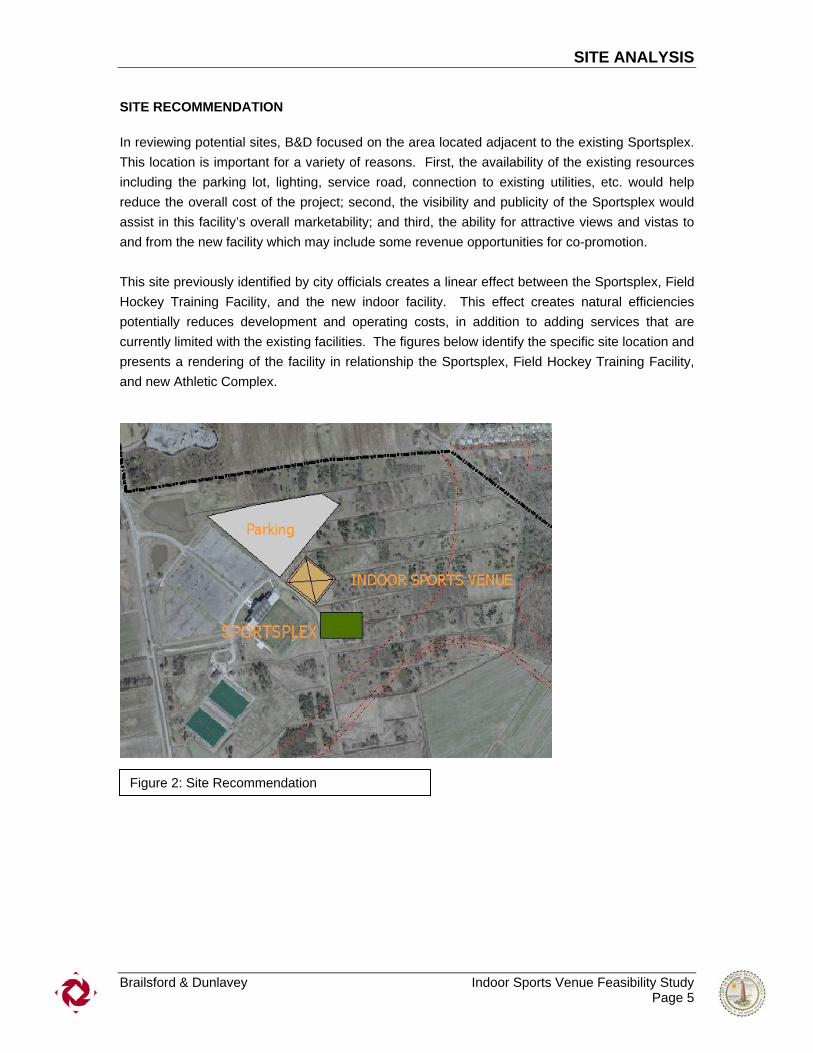
SITE RECOMMENDATION In reviewing potential sites, B&D focused on the area located adjacent to the existing Sportsplex. This location is important for a variety of reasons. First, the availability of the existing resources including the parking lot, lighting, service road, connection to existing utilities, etc. would help reduce the overall cost of the project; second, the visibility and publicity of the Sportsplex would assist in this facility’s overall marketability; and third, the ability for attractive views and vistas to and from the new facility which may include some revenue opportunities for co-promotion. This site previously identified by city officials creates a linear effect between the Sportsplex, Field Hockey Training Facility, and the new indoor facility. This effect creates natural efficiencies potentially reduces development and operating costs, in addition to adding services that are currently limited with the existing facilities. The figures below identify the specific site location and presents a rendering of the facility in relationship the Sportsplex, Field Hockey Training Facility, and new Athletic Complex.
Figure 2: Site Recommendation
SITE ANALYSIS
Brailsford & Dunlavey Indoor Sports Venue Feasibility Study Page 6
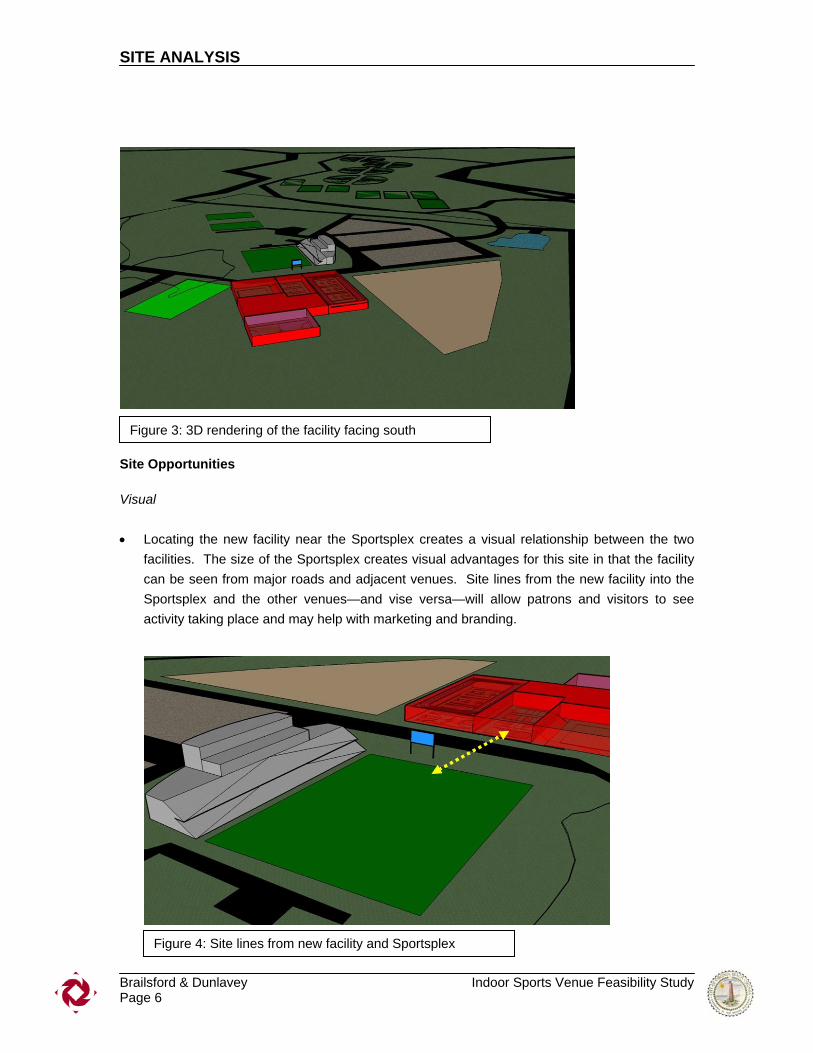
Site Opportunities Visual • Locating the new facility near the Sportsplex creates a visual relationship between the two
facilities. The size of the Sportsplex creates visual advantages for this site in that the facility can be seen from major roads and adjacent venues. Site lines from the new facility into the Sportsplex and the other venues—and vise versa—will allow patrons and visitors to see activity taking place and may help with marketing and branding.
Figure 3: 3D rendering of the facility facing south
Figure 4: Site lines from new facility and Sportsplex
SITE ANALYSIS
Brailsford & Dunlavey Indoor Sports Venue Feasibility Study Page 7
Efficiencies • Due to its proximity to an existing facility there may be an opportunity to reduce development
costs with respect to site preparation and infrastructure. With existing infrastructure such as roads and parking in place, cost savings can be significant, which ultimately may be critical to project financing. Cost for infrastructure necessary to run utilities is typically dependent on how far it is located from a major power source. The new facility may be able to tap into the same source that is currently running the Sportsplex. In addition the Sportsplex has a sizable parking lot that may require additional spaces.
• Potential additional savings can be realized with respect to operating costs. Creating a
physical link between the two facilities may reduce costs associated with certain operating activities such as ticketing, food and beverage, staffing, and maintenance for both entities. Currently the Sportsplex has limited locker room space and could benefit from having additional spaces from the new indoor venue and vice versa.
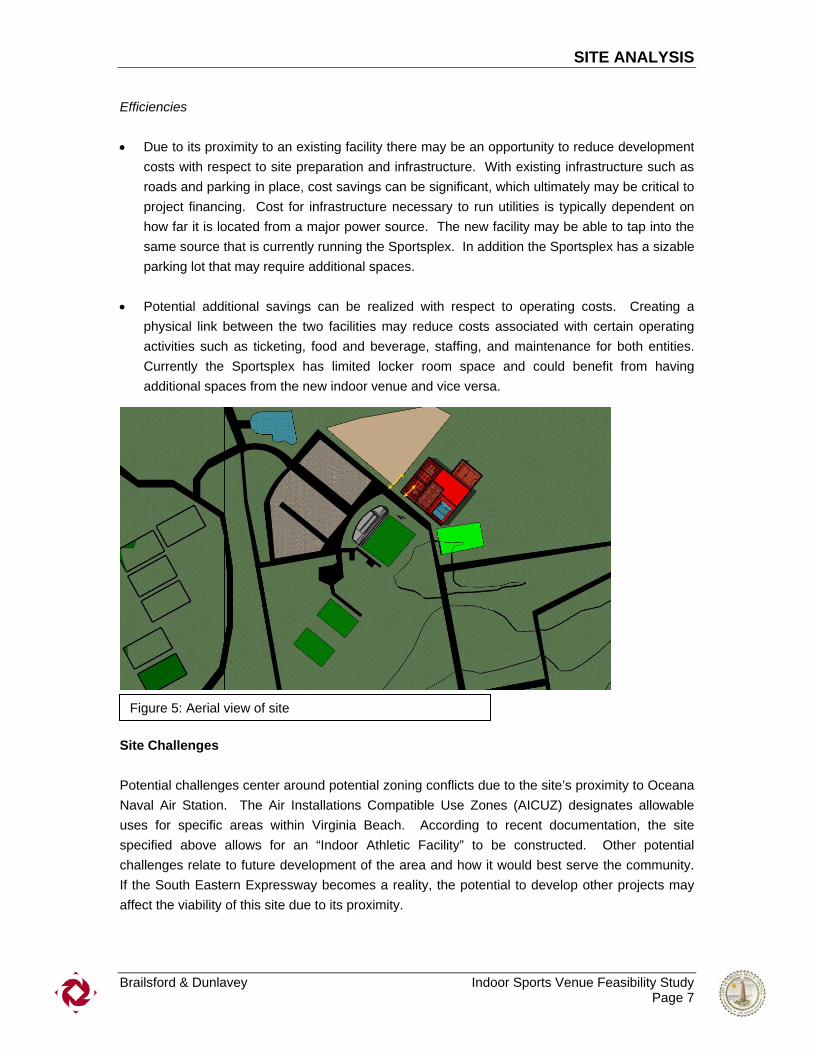
Site Challenges Potential challenges center around potential zoning conflicts due to the site’s proximity to Oceana Naval Air Station. The Air Installations Compatible Use Zones (AICUZ) designates allowable uses for specific areas within Virginia Beach. According to recent documentation, the site specified above allows for an “Indoor Athletic Facility” to be constructed. Other potential challenges relate to future development of the area and how it would best serve the community. If the South Eastern Expressway becomes a reality, the potential to develop other projects may affect the viability of this site due to its proximity.
Figure 5: Aerial view of site

SITE ANALYSIS
Brailsford & Dunlavey Indoor Sports Venue Feasibility Study Page 8

Exhibit 1

This page intentionally blank
©2006 ESRI On-demand reports and maps from Business Analyst Online. Order at www.esri.com/bao or call 800-292-2224 Page 1 of 1
Site Map2181 Landstown Rd Latitude: 36.768864
Longitude: -76.093469Virginia Beach, VA 23456 October 16, 2006
Market Profile
©2006 ESRI On-demand reports and maps from Business Analyst Online. Order at www.esri.com/bao or call 800-292-2224 10/16/2006 Page 1 of 8
2181 Landstown Rd 2181 Landstown Rd 2181 Landstown Rd
Latitude: 36.768864 Virginia Beach, VA 2345 Virginia Beach, VA 2345 Virginia Beach, VA 2345
Longitude: -76.093469 Drive Time: 10 minutes Drive Time: 15 minutes Drive Time: 20 minutes
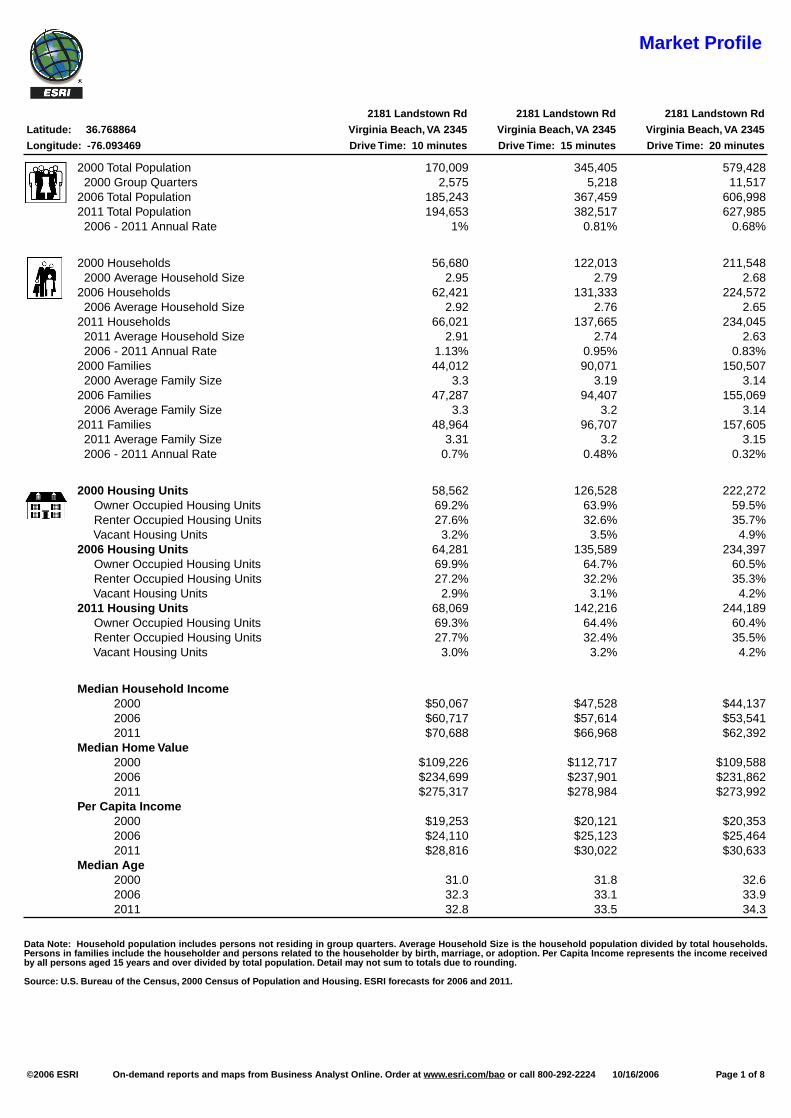
2000 Total Population 170,009 345,405 579,428 2000 Group Quarters 2,575 5,218 11,5172006 Total Population 185,243 367,459 606,9982011 Total Population 194,653 382,517 627,985 2006 - 2011 Annual Rate 1% 0.81% 0.68%
2000 Households 56,680 122,013 211,548 2000 Average Household Size 2.95 2.79 2.682006 Households 62,421 131,333 224,572 2006 Average Household Size 2.92 2.76 2.652011 Households 66,021 137,665 234,045 2011 Average Household Size 2.91 2.74 2.63 2006 - 2011 Annual Rate 1.13% 0.95% 0.83%2000 Families 44,012 90,071 150,507 2000 Average Family Size 3.3 3.19 3.142006 Families 47,287 94,407 155,069 2006 Average Family Size 3.3 3.2 3.142011 Families 48,964 96,707 157,605 2011 Average Family Size 3.31 3.2 3.15 2006 - 2011 Annual Rate 0.7% 0.48% 0.32%
2000 Housing Units 58,562 126,528 222,272 Owner Occupied Housing Units 69.2% 63.9% 59.5% Renter Occupied Housing Units 27.6% 32.6% 35.7% Vacant Housing Units 3.2% 3.5% 4.9%2006 Housing Units 64,281 135,589 234,397 Owner Occupied Housing Units 69.9% 64.7% 60.5% Renter Occupied Housing Units 27.2% 32.2% 35.3% Vacant Housing Units 2.9% 3.1% 4.2%2011 Housing Units 68,069 142,216 244,189 Owner Occupied Housing Units 69.3% 64.4% 60.4% Renter Occupied Housing Units 27.7% 32.4% 35.5% Vacant Housing Units 3.0% 3.2% 4.2%
Median Household Income 2000 $50,067 $47,528 $44,137 2006 $60,717 $57,614 $53,541 2011 $70,688 $66,968 $62,392 Median Home Value 2000 $109,226 $112,717 $109,588 2006 $234,699 $237,901 $231,862 2011 $275,317 $278,984 $273,992 Per Capita Income 2000 $19,253 $20,121 $20,353 2006 $24,110 $25,123 $25,464 2011 $28,816 $30,022 $30,633 Median Age 2000 31.0 31.8 32.6 2006 32.3 33.1 33.9 2011 32.8 33.5 34.3
Data Note: Household population includes persons not residing in group quarters. Average Household Size is the household population divided by total households. Persons in families include the householder and persons related to the householder by birth, marriage, or adoption. Per Capita Income represents the income received by all persons aged 15 years and over divided by total population. Detail may not sum to totals due to rounding.
Source: U.S. Bureau of the Census, 2000 Census of Population and Housing. ESRI forecasts for 2006 and 2011.
Market Profile
©2006 ESRI On-demand reports and maps from Business Analyst Online. Order at www.esri.com/bao or call 800-292-2224 10/16/2006 Page 2 of 8
2181 Landstown Rd 2181 Landstown Rd 2181 Landstown Rd
Latitude: 36.768864 Virginia Beach, VA 2345 Virginia Beach, VA 2345 Virginia Beach, VA 2345
Longitude: -76.093469 Drive Time: 10 minutes Drive Time: 15 minutes Drive Time: 20 minutes
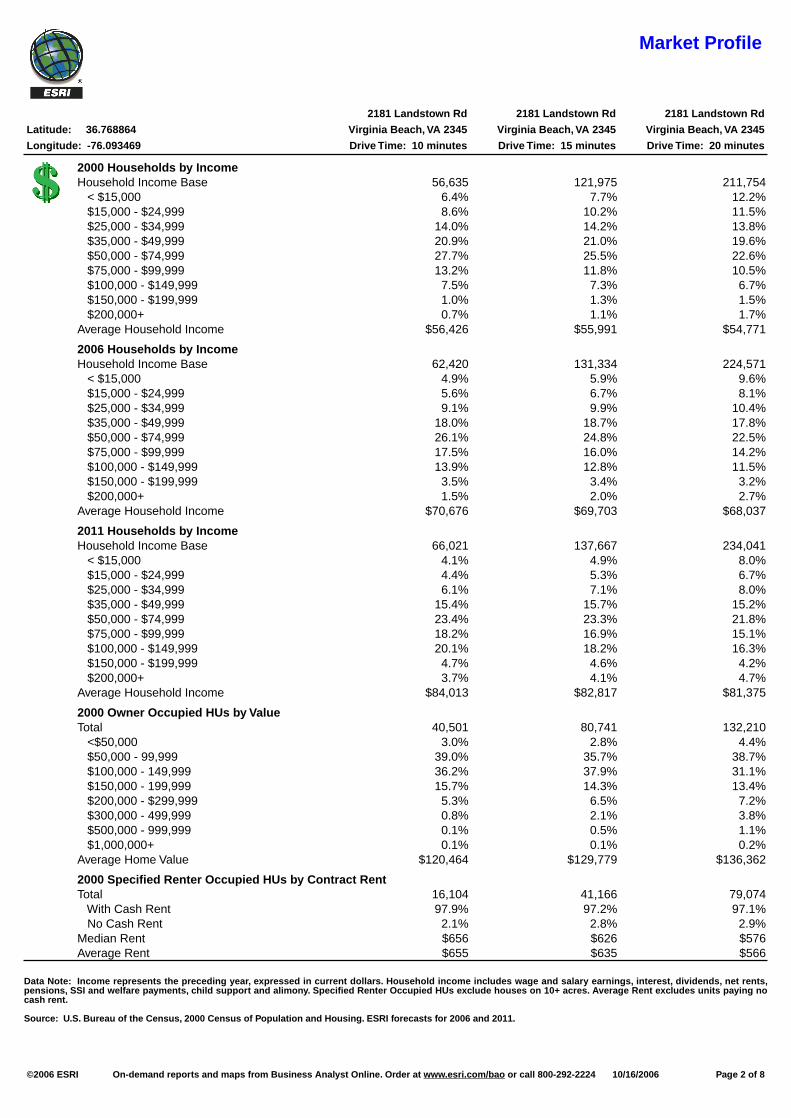
2000 Households by IncomeHousehold Income Base 56,635 121,975 211,754 < $15,000 6.4% 7.7% 12.2% $15,000 - $24,999 8.6% 10.2% 11.5% $25,000 - $34,999 14.0% 14.2% 13.8% $35,000 - $49,999 20.9% 21.0% 19.6% $50,000 - $74,999 27.7% 25.5% 22.6% $75,000 - $99,999 13.2% 11.8% 10.5% $100,000 - $149,999 7.5% 7.3% 6.7% $150,000 - $199,999 1.0% 1.3% 1.5%
$200,000+ 0.7% 1.1% 1.7% Average Household Income $56,426 $55,991 $54,771
2006 Households by Income Household Income Base 62,420 131,334 224,571 < $15,000 4.9% 5.9% 9.6% $15,000 - $24,999 5.6% 6.7% 8.1% $25,000 - $34,999 9.1% 9.9% 10.4% $35,000 - $49,999 18.0% 18.7% 17.8% $50,000 - $74,999 26.1% 24.8% 22.5% $75,000 - $99,999 17.5% 16.0% 14.2% $100,000 - $149,999 13.9% 12.8% 11.5% $150,000 - $199,999 3.5% 3.4% 3.2% $200,000+ 1.5% 2.0% 2.7% Average Household Income $70,676 $69,703 $68,037
2011 Households by Income Household Income Base 66,021 137,667 234,041 < $15,000 4.1% 4.9% 8.0% $15,000 - $24,999 4.4% 5.3% 6.7% $25,000 - $34,999 6.1% 7.1% 8.0% $35,000 - $49,999 15.4% 15.7% 15.2% $50,000 - $74,999 23.4% 23.3% 21.8% $75,000 - $99,999 18.2% 16.9% 15.1% $100,000 - $149,999 20.1% 18.2% 16.3% $150,000 - $199,999 4.7% 4.6% 4.2% $200,000+ 3.7% 4.1% 4.7% Average Household Income $84,013 $82,817 $81,375
2000 Owner Occupied HUs by Value Total 40,501 80,741 132,210 <$50,000 3.0% 2.8% 4.4% $50,000 - 99,999 39.0% 35.7% 38.7% $100,000 - 149,999 36.2% 37.9% 31.1% $150,000 - 199,999 15.7% 14.3% 13.4% $200,000 - $299,999 5.3% 6.5% 7.2% $300,000 - 499,999 0.8% 2.1% 3.8% $500,000 - 999,999 0.1% 0.5% 1.1% $1,000,000+ 0.1% 0.1% 0.2% Average Home Value $120,464 $129,779 $136,362
2000 Specified Renter Occupied HUs by Contract Rent Total 16,104 41,166 79,074 With Cash Rent 97.9% 97.2% 97.1% No Cash Rent 2.1% 2.8% 2.9% Median Rent $656 $626 $576 Average Rent $655 $635 $566
Data Note: Income represents the preceding year, expressed in current dollars. Household income includes wage and salary earnings, interest, dividends, net rents, pensions, SSI and welfare payments, child support and alimony. Specified Renter Occupied HUs exclude houses on 10+ acres. Average Rent excludes units paying no cash rent.
Source: U.S. Bureau of the Census, 2000 Census of Population and Housing. ESRI forecasts for 2006 and 2011.
Market Profile
©2006 ESRI On-demand reports and maps from Business Analyst Online. Order at www.esri.com/bao or call 800-292-2224 10/16/2006 Page 3 of 8
2181 Landstown Rd 2181 Landstown Rd 2181 Landstown Rd
Latitude: 36.768864 Virginia Beach, VA 2345 Virginia Beach, VA 2345 Virginia Beach, VA 2345
Longitude: -76.093469 Drive Time: 10 minutes Drive Time: 15 minutes Drive Time: 20 minutes
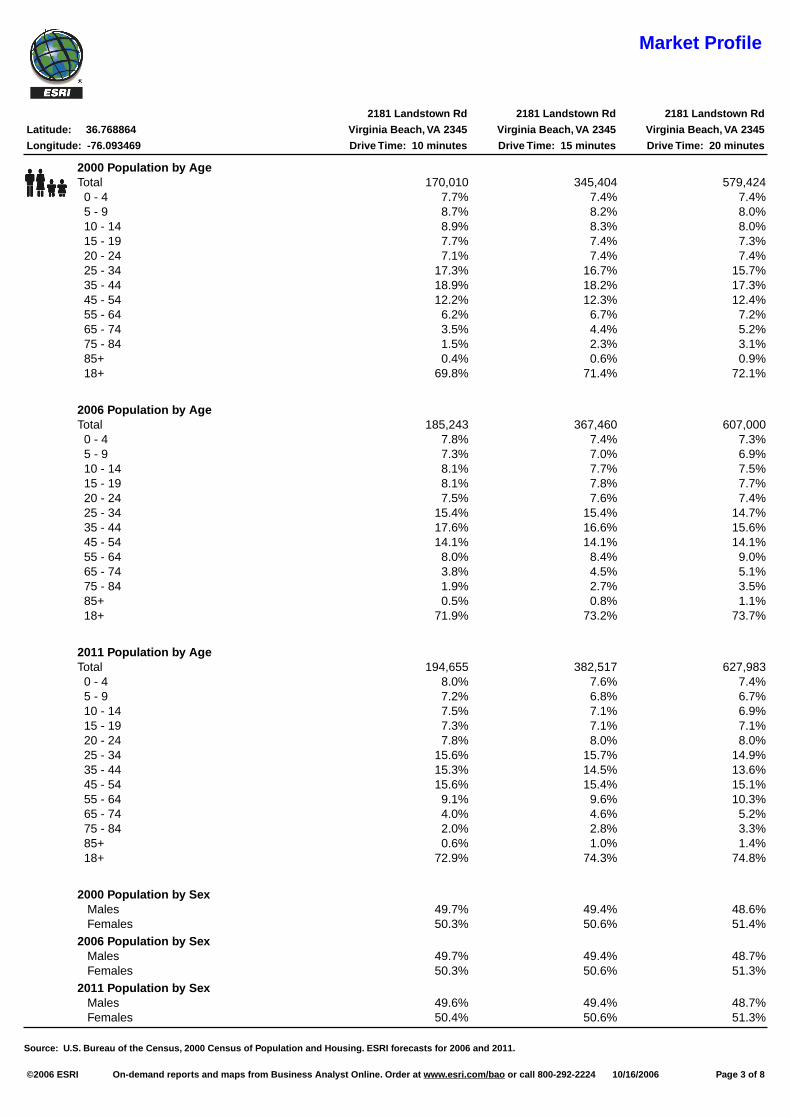
2000 Population by Age Total 170,010 345,404 579,424 0 - 4 7.7% 7.4% 7.4% 5 - 9 8.7% 8.2% 8.0% 10 - 14 8.9% 8.3% 8.0% 15 - 19 7.7% 7.4% 7.3% 20 - 24 7.1% 7.4% 7.4% 25 - 34 17.3% 16.7% 15.7% 35 - 44 18.9% 18.2% 17.3% 45 - 54 12.2% 12.3% 12.4% 55 - 64 6.2% 6.7% 7.2% 65 - 74 3.5% 4.4% 5.2% 75 - 84 1.5% 2.3% 3.1% 85+ 0.4% 0.6% 0.9%
18+ 69.8% 71.4% 72.1%
2006 Population by Age Total 185,243 367,460 607,000 0 - 4 7.8% 7.4% 7.3% 5 - 9 7.3% 7.0% 6.9% 10 - 14 8.1% 7.7% 7.5% 15 - 19 8.1% 7.8% 7.7% 20 - 24 7.5% 7.6% 7.4% 25 - 34 15.4% 15.4% 14.7% 35 - 44 17.6% 16.6% 15.6% 45 - 54 14.1% 14.1% 14.1% 55 - 64 8.0% 8.4% 9.0% 65 - 74 3.8% 4.5% 5.1% 75 - 84 1.9% 2.7% 3.5% 85+ 0.5% 0.8% 1.1% 18+ 71.9% 73.2% 73.7%
2011 Population by Age Total 194,655 382,517 627,983 0 - 4 8.0% 7.6% 7.4% 5 - 9 7.2% 6.8% 6.7% 10 - 14 7.5% 7.1% 6.9% 15 - 19 7.3% 7.1% 7.1% 20 - 24 7.8% 8.0% 8.0% 25 - 34 15.6% 15.7% 14.9% 35 - 44 15.3% 14.5% 13.6% 45 - 54 15.6% 15.4% 15.1% 55 - 64 9.1% 9.6% 10.3% 65 - 74 4.0% 4.6% 5.2% 75 - 84 2.0% 2.8% 3.3% 85+ 0.6% 1.0% 1.4% 18+ 72.9% 74.3% 74.8%
2000 Population by Sex Males 49.7% 49.4% 48.6% Females 50.3% 50.6% 51.4%
2006 Population by Sex Males 49.7% 49.4% 48.7% Females 50.3% 50.6% 51.3%
2011 Population by Sex Males 49.6% 49.4% 48.7% Females 50.4% 50.6% 51.3%
Source: U.S. Bureau of the Census, 2000 Census of Population and Housing. ESRI forecasts for 2006 and 2011.
Market Profile
©2006 ESRI On-demand reports and maps from Business Analyst Online. Order at www.esri.com/bao or call 800-292-2224 10/16/2006 Page 4 of 8
2181 Landstown Rd 2181 Landstown Rd 2181 Landstown Rd
Latitude: 36.768864 Virginia Beach, VA 2345 Virginia Beach, VA 2345 Virginia Beach, VA 2345
Longitude: -76.093469 Drive Time: 10 minutes Drive Time: 15 minutes Drive Time: 20 minutes
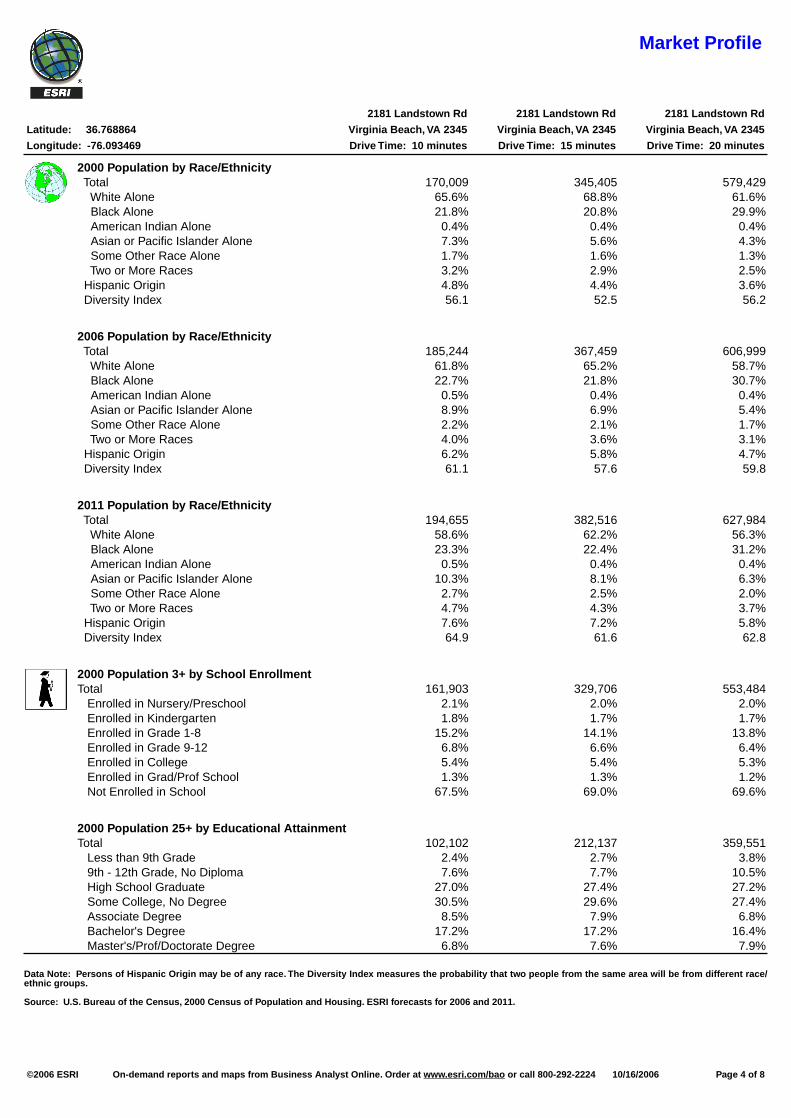
2000 Population by Race/Ethnicity Total 170,009 345,405 579,429 White Alone 65.6% 68.8% 61.6% Black Alone 21.8% 20.8% 29.9% American Indian Alone 0.4% 0.4% 0.4% Asian or Pacific Islander Alone 7.3% 5.6% 4.3% Some Other Race Alone 1.7% 1.6% 1.3% Two or More Races 3.2% 2.9% 2.5% Hispanic Origin 4.8% 4.4% 3.6% Diversity Index 56.1 52.5 56.2
2006 Population by Race/Ethnicity Total 185,244 367,459 606,999 White Alone 61.8% 65.2% 58.7% Black Alone 22.7% 21.8% 30.7% American Indian Alone 0.5% 0.4% 0.4% Asian or Pacific Islander Alone 8.9% 6.9% 5.4% Some Other Race Alone 2.2% 2.1% 1.7% Two or More Races 4.0% 3.6% 3.1% Hispanic Origin 6.2% 5.8% 4.7% Diversity Index 61.1 57.6 59.8
2011 Population by Race/Ethnicity Total 194,655 382,516 627,984 White Alone 58.6% 62.2% 56.3% Black Alone 23.3% 22.4% 31.2% American Indian Alone 0.5% 0.4% 0.4% Asian or Pacific Islander Alone 10.3% 8.1% 6.3% Some Other Race Alone 2.7% 2.5% 2.0% Two or More Races 4.7% 4.3% 3.7% Hispanic Origin 7.6% 7.2% 5.8% Diversity Index 64.9 61.6 62.8
2000 Population 3+ by School EnrollmentTotal 161,903 329,706 553,484 Enrolled in Nursery/Preschool 2.1% 2.0% 2.0% Enrolled in Kindergarten 1.8% 1.7% 1.7% Enrolled in Grade 1-8 15.2% 14.1% 13.8% Enrolled in Grade 9-12 6.8% 6.6% 6.4% Enrolled in College 5.4% 5.4% 5.3% Enrolled in Grad/Prof School 1.3% 1.3% 1.2% Not Enrolled in School 67.5% 69.0% 69.6%
2000 Population 25+ by Educational Attainment Total 102,102 212,137 359,551 Less than 9th Grade 2.4% 2.7% 3.8% 9th - 12th Grade, No Diploma 7.6% 7.7% 10.5% High School Graduate 27.0% 27.4% 27.2% Some College, No Degree 30.5% 29.6% 27.4% Associate Degree 8.5% 7.9% 6.8% Bachelor's Degree 17.2% 17.2% 16.4% Master's/Prof/Doctorate Degree 6.8% 7.6% 7.9%
Data Note: Persons of Hispanic Origin may be of any race. The Diversity Index measures the probability that two people from the same area will be from different race/ethnic groups.
Source: U.S. Bureau of the Census, 2000 Census of Population and Housing. ESRI forecasts for 2006 and 2011.
Market Profile
2181 Landstown Rd 2181 Landstown Rd 2181 Landstown Rd
Latitude: 36.768864 Virginia Beach, VA 2345 Virginia Beach, VA 2345 Virginia Beach, VA 2345
Longitude: -76.093469 Drive Time: 10 minutes Drive Time: 15 minutes Drive Time: 20 minutes
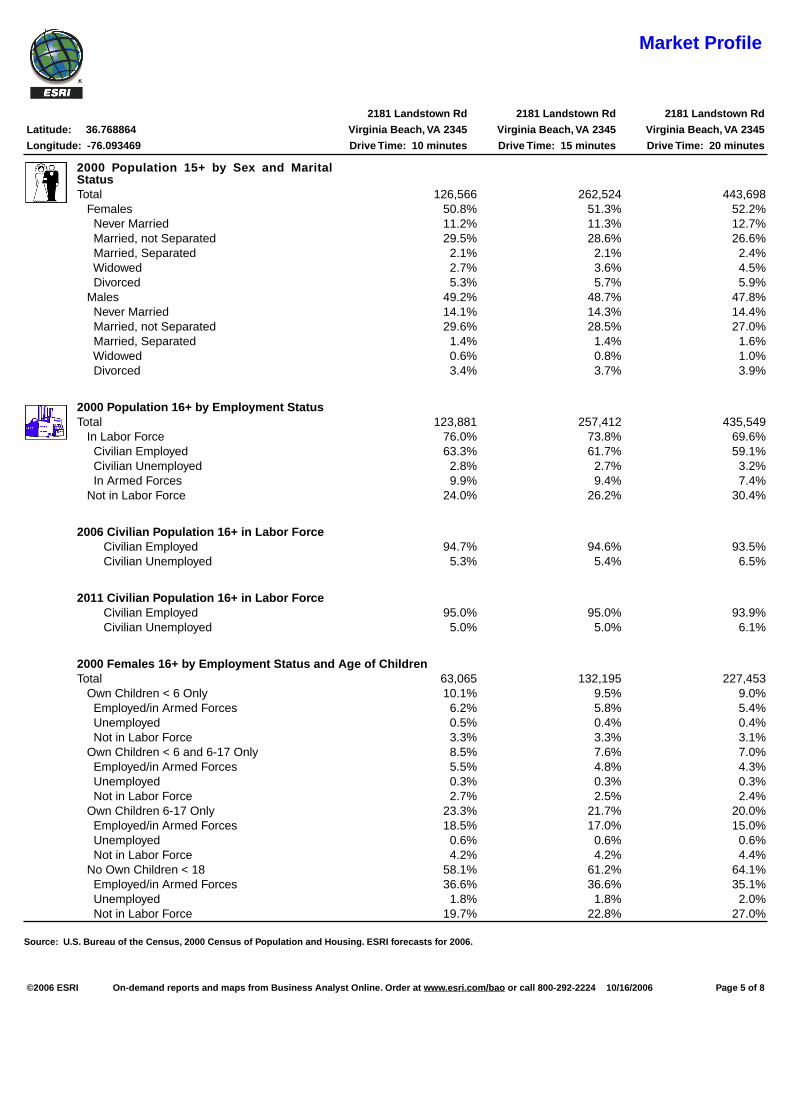
2000 Population 15+ by Sex and Marital StatusTotal 126,566 262,524 443,698 Females 50.8% 51.3% 52.2% Never Married 11.2% 11.3% 12.7% Married, not Separated 29.5% 28.6% 26.6% Married, Separated 2.1% 2.1% 2.4% Widowed 2.7% 3.6% 4.5% Divorced 5.3% 5.7% 5.9% Males 49.2% 48.7% 47.8% Never Married 14.1% 14.3% 14.4% Married, not Separated 29.6% 28.5% 27.0% Married, Separated 1.4% 1.4% 1.6% Widowed 0.6% 0.8% 1.0% Divorced 3.4% 3.7% 3.9%
2000 Population 16+ by Employment StatusTotal 123,881 257,412 435,549 In Labor Force 76.0% 73.8% 69.6% Civilian Employed 63.3% 61.7% 59.1% Civilian Unemployed 2.8% 2.7% 3.2% In Armed Forces 9.9% 9.4% 7.4% Not in Labor Force 24.0% 26.2% 30.4%
2006 Civilian Population 16+ in Labor Force Civilian Employed 94.7% 94.6% 93.5% Civilian Unemployed 5.3% 5.4% 6.5%
2011 Civilian Population 16+ in Labor Force Civilian Employed 95.0% 95.0% 93.9% Civilian Unemployed 5.0% 5.0% 6.1%
2000 Females 16+ by Employment Status and Age of Children Total 63,065 132,195 227,453 Own Children < 6 Only 10.1% 9.5% 9.0% Employed/in Armed Forces 6.2% 5.8% 5.4% Unemployed 0.5% 0.4% 0.4% Not in Labor Force 3.3% 3.3% 3.1% Own Children < 6 and 6-17 Only 8.5% 7.6% 7.0% Employed/in Armed Forces 5.5% 4.8% 4.3% Unemployed 0.3% 0.3% 0.3% Not in Labor Force 2.7% 2.5% 2.4% Own Children 6-17 Only 23.3% 21.7% 20.0% Employed/in Armed Forces 18.5% 17.0% 15.0% Unemployed 0.6% 0.6% 0.6% Not in Labor Force 4.2% 4.2% 4.4% No Own Children < 18 58.1% 61.2% 64.1% Employed/in Armed Forces 36.6% 36.6% 35.1% Unemployed 1.8% 1.8% 2.0% Not in Labor Force 19.7% 22.8% 27.0%
Source: U.S. Bureau of the Census, 2000 Census of Population and Housing. ESRI forecasts for 2006.
©2006 ESRI On-demand reports and maps from Business Analyst Online. Order at www.esri.com/bao or call 800-292-2224 10/16/2006 Page 5 of 8

Market Profile
2181 Landstown Rd 2181 Landstown Rd 2181 Landstown Rd
Latitude: 36.768864 Virginia Beach, VA 2345 Virginia Beach, VA 2345 Virginia Beach, VA 2345
Longitude: -76.093469 Drive Time: 10 minutes Drive Time: 15 minutes Drive Time: 20 minutes
2006 Employed Population 16+ by Industry Total 93,425 182,157 289,906 Agriculture/Mining 0.2% 0.2% 0.2% Construction 7.9% 8.4% 8.5% Manufacturing 5.0% 5.1% 5.6% Wholesale Trade 2.9% 2.9% 3.1% Retail Trade 14.9% 14.9% 14.1% Transportation/Utilities 3.9% 3.9% 4.2% Information 2.4% 2.4% 2.3% Finance/Insurance/Real Estate 8.4% 7.9% 7.6% Services 46.2% 46.7% 46.7% Public Administration 8.3% 7.6% 7.6%
2006 Employed Population 16+ by Occupation Total 93,425 182,155 289,903 White Collar 65.2% 65.0% 63.4% Management/Business/Financial 13.4% 13.3% 13.2% Professional 22.1% 22.1% 21.6% Sales 13.7% 13.5% 13.1% Administrative Support 16.0% 16.0% 15.6% Services 14.9% 15.1% 15.7% Blue Collar 19.9% 20.0% 20.9% Farming/Forestry/Fishing 0.1% 0.1% 0.1% Construction/Extraction 6.9% 7.4% 7.6% Installation/Maintenance/Repair 4.8% 4.7% 4.5% Production 3.9% 3.6% 3.9% Transportation/Material Moving 4.1% 4.1% 4.7%
2000 Workers 16+ by Means of Transportation to WorkTotal 89,279 180,123 284,606 Drove Alone - Car, Truck, or Van 82.4% 82.0% 80.6% Carpooled - Car, Truck, or Van 11.8% 11.5% 11.7% Public Transportation 0.7% 0.8% 1.7% Walked 1.6% 1.9% 2.1% Other Means 1.4% 1.6% 1.6% Worked at Home 2.2% 2.3% 2.3%
2000 Workers 16+ by Travel Time to Work Total 89,279 180,124 284,605 Did Not Work at Home 97.8% 97.7% 97.7% Less than 5 minutes 1.5% 1.9% 1.9% 5 to 9 minutes 6.3% 7.5% 7.9% 10 to 19 minutes 30.4% 31.2% 31.8% 20 to 24 minutes 20.2% 20.3% 20.1% 25 to 34 minutes 25.2% 23.3% 23.1% 35 to 44 minutes 5.5% 5.0% 4.6% 45 to 59 minutes 5.2% 4.9% 4.4% 60 to 89 minutes 1.9% 1.9% 2.0% 90 or more minutes 1.7% 1.8% 1.9% Worked at Home 2.2% 2.3% 2.3% Average Travel Time to Work (in min) 24.3 23.8 23.7
2000 Households by Vehicles Available Total 56,625 121,983 211,510 None 2.9% 4.5% 8.4% 1 28.0% 30.5% 32.8% 2 47.8% 45.7% 41.6% 3 16.1% 14.6% 12.9% 4 3.8% 3.6% 3.3% 5+ 1.4% 1.2% 1.0% Average Number of Vehicles Available 1.9 1.9 1.7
Source: U.S. Bureau of the Census, 2000 Census of Population and Housing. ESRI forecasts for 2006 and 2011.
©2006 ESRI On-demand reports and maps from Business Analyst Online. Order at www.esri.com/bao or call 800-292-2224 10/16/2006 Page 6 of 8
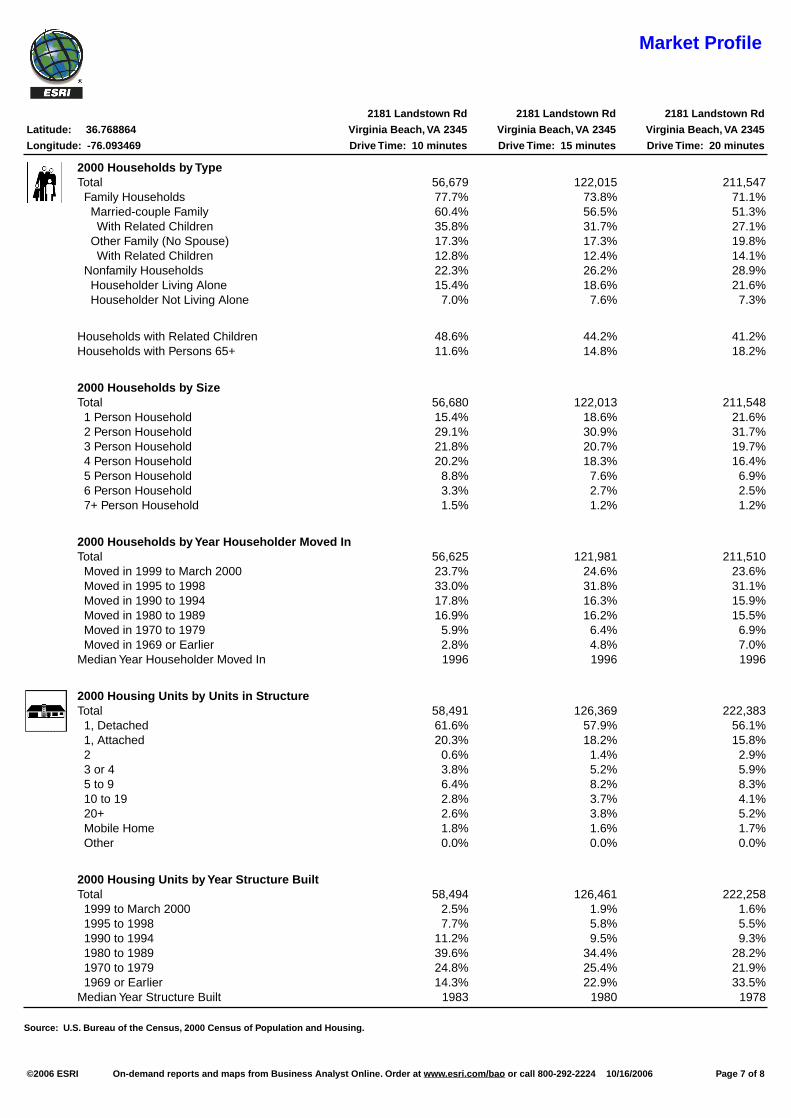
Market Profile
2181 Landstown Rd 2181 Landstown Rd 2181 Landstown Rd
Latitude: 36.768864 Virginia Beach, VA 2345 Virginia Beach, VA 2345 Virginia Beach, VA 2345
Longitude: -76.093469 Drive Time: 10 minutes Drive Time: 15 minutes Drive Time: 20 minutes
2000 Households by Type Total 56,679 122,015 211,547 Family Households 77.7% 73.8% 71.1% Married-couple Family 60.4% 56.5% 51.3% With Related Children 35.8% 31.7% 27.1% Other Family (No Spouse) 17.3% 17.3% 19.8% With Related Children 12.8% 12.4% 14.1% Nonfamily Households 22.3% 26.2% 28.9% Householder Living Alone 15.4% 18.6% 21.6% Householder Not Living Alone 7.0% 7.6% 7.3%
Households with Related Children 48.6% 44.2% 41.2% Households with Persons 65+ 11.6% 14.8% 18.2%
2000 Households by Size Total 56,680 122,013 211,548 1 Person Household 15.4% 18.6% 21.6% 2 Person Household 29.1% 30.9% 31.7% 3 Person Household 21.8% 20.7% 19.7% 4 Person Household 20.2% 18.3% 16.4% 5 Person Household 8.8% 7.6% 6.9% 6 Person Household 3.3% 2.7% 2.5% 7+ Person Household 1.5% 1.2% 1.2%
2000 Households by Year Householder Moved In Total 56,625 121,981 211,510 Moved in 1999 to March 2000 23.7% 24.6% 23.6% Moved in 1995 to 1998 33.0% 31.8% 31.1% Moved in 1990 to 1994 17.8% 16.3% 15.9% Moved in 1980 to 1989 16.9% 16.2% 15.5% Moved in 1970 to 1979 5.9% 6.4% 6.9% Moved in 1969 or Earlier 2.8% 4.8% 7.0% Median Year Householder Moved In 1996 1996 1996
2000 Housing Units by Units in StructureTotal 58,491 126,369 222,383 1, Detached 61.6% 57.9% 56.1% 1, Attached 20.3% 18.2% 15.8% 2 0.6% 1.4% 2.9% 3 or 4 3.8% 5.2% 5.9% 5 to 9 6.4% 8.2% 8.3% 10 to 19 2.8% 3.7% 4.1% 20+ 2.6% 3.8% 5.2% Mobile Home 1.8% 1.6% 1.7% Other 0.0% 0.0% 0.0%
2000 Housing Units by Year Structure Built Total 58,494 126,461 222,258 1999 to March 2000 2.5% 1.9% 1.6% 1995 to 1998 7.7% 5.8% 5.5% 1990 to 1994 11.2% 9.5% 9.3% 1980 to 1989 39.6% 34.4% 28.2% 1970 to 1979 24.8% 25.4% 21.9% 1969 or Earlier 14.3% 22.9% 33.5% Median Year Structure Built 1983 1980 1978
Source: U.S. Bureau of the Census, 2000 Census of Population and Housing.
©2006 ESRI On-demand reports and maps from Business Analyst Online. Order at www.esri.com/bao or call 800-292-2224 10/16/2006 Page 7 of 8

Market Profile
2181 Landstown Rd 2181 Landstown Rd 2181 Landstown Rd
Latitude: 36.768864 Virginia Beach, VA 2345 Virginia Beach, VA 2345 Virginia Beach, VA 2345
Longitude: -76.093469 Drive Time: 10 minutes Drive Time: 15 minutes Drive Time: 20 minutes
Top 3 Tapestry Segments
1. Aspiring Young Familie Aspiring Young Familie Aspiring Young Familie2. Milk and Cookies Sophisticated Squires Cozy and Comfortable3. Sophisticated Squires Cozy and Comfortable Young and Restless
2006 Consumer Spending shows the amount spent on a variety of goods and services by households that reside in the market area. Expenditures are shown by broad budget categories that are not mutually exclusive. Consumer spending does not equal business revenue.Apparel & Services: Total $ $127,230,322 $266,012,924 $445,787,290 Average Spent $2,038.26 $2,025.48 $1,985.05 Spending Potential Index 75 74 73Computers & Accessories: Total $ $16,818,302 $34,869,663 $57,648,851 Average Spent $269.43 $265.51 $256.71 Spending Potential Index 105 103 100Education: Total $ $72,301,751 $153,214,718 $254,966,225 Average Spent $1,158.29 $1,166.61 $1,135.34 Spending Potential Index 102 103 100
Entertainment/Recreation: Total $ $205,165,164 $425,165,700 $708,117,269 Average Spent $3,286.80 $3,237.31 $3,153.19 Spending Potential Index 99 98 95 Food at Home: Total $ $297,592,646 $623,198,750 $1,053,234,357 Average Spent $4,767.51 $4,745.18 $4,689.96 Spending Potential Index 97 96 95 Food Away from Home: Total $ $211,147,941 $440,908,546 $738,675,810 Average Spent $3,382.64 $3,357.18 $3,289.26 Spending Potential Index 101 101 99 Health Care: Total $ $209,083,611 $437,838,623 $747,181,247 Average Spent $3,349.57 $3,333.81 $3,327.13 Spending Potential Index 91 91 91 HH Furnishings & Equipment: Total $ $123,968,489 $255,163,047 $421,856,495 Average Spent $1,986.01 $1,942.87 $1,878.49 Spending Potential Index 90 88 85 Investments: Total $ $304,011,823 $629,983,891 $1,049,493,393 Average Spent $4,870.35 $4,796.84 $4,673.30 Spending Potential Index 104 103 100 Retail Goods: Total $ $1,533,104,474 $3,186,203,478 $5,330,588,825 Average Spent $24,560.72 $24,260.49 $23,736.66 Spending Potential Index 94 93 91 Shelter: Total $ $919,817,951 $1,908,430,397 $3,176,425,713 Average Spent $14,735.71 $14,531.23 $14,144.35 Spending Potential Index 103 102 99 TV/Video/Sound Equipment: Total $ $67,770,438 $141,796,376 $238,627,295 Average Spent $1,085.70 $1,079.67 $1,062.59 Spending Potential Index 99 99 97 Travel: Total $ $111,302,270 $231,209,041 $385,757,867 Average Spent $1,783.09 $1,760.48 $1,717.75 Spending Potential Index 100 98 96 Vehicle Maintenance & Repairs: Total $ $67,704,738 $140,629,506 $234,228,935 Average Spent $1,084.65 $1,070.79 $1,043.00 Spending Potential Index 101 100 97
Data Note: The Spending Potential Index represents the amount spent in the area relative to a national average of 100.
Source: Expenditure data are derived from the 2001, 2002 and 2003 Consumer Expenditure Surveys, Bureau of Labor Statistics. ESRI forecasts for 2006 and 2011.
©2006 ESRI On-demand reports and maps from Business Analyst Online. Order at www.esri.com/bao or call 800-292-2224 10/16/2006 Page 8 of 8
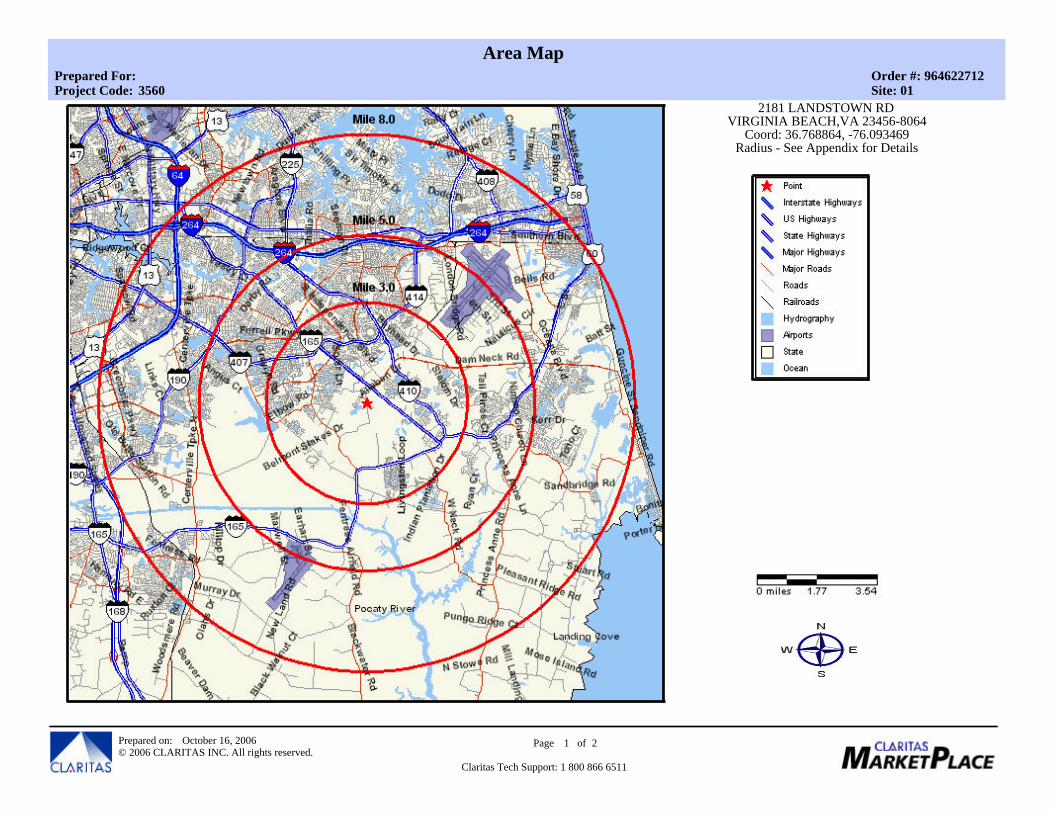
Area Map
Site: 013560Project Code:Prepared For: Order #: 964622712
2181 LANDSTOWN RDVIRGINIA BEACH,VA 23456-8064
Coord: 36.768864, -76.093469Radius - See Appendix for Details
2of1PageOctober 16, 2006Prepared on:
Claritas Tech Support: 1 800 866 6511© 2006 CLARITAS INC. All rights reserved.
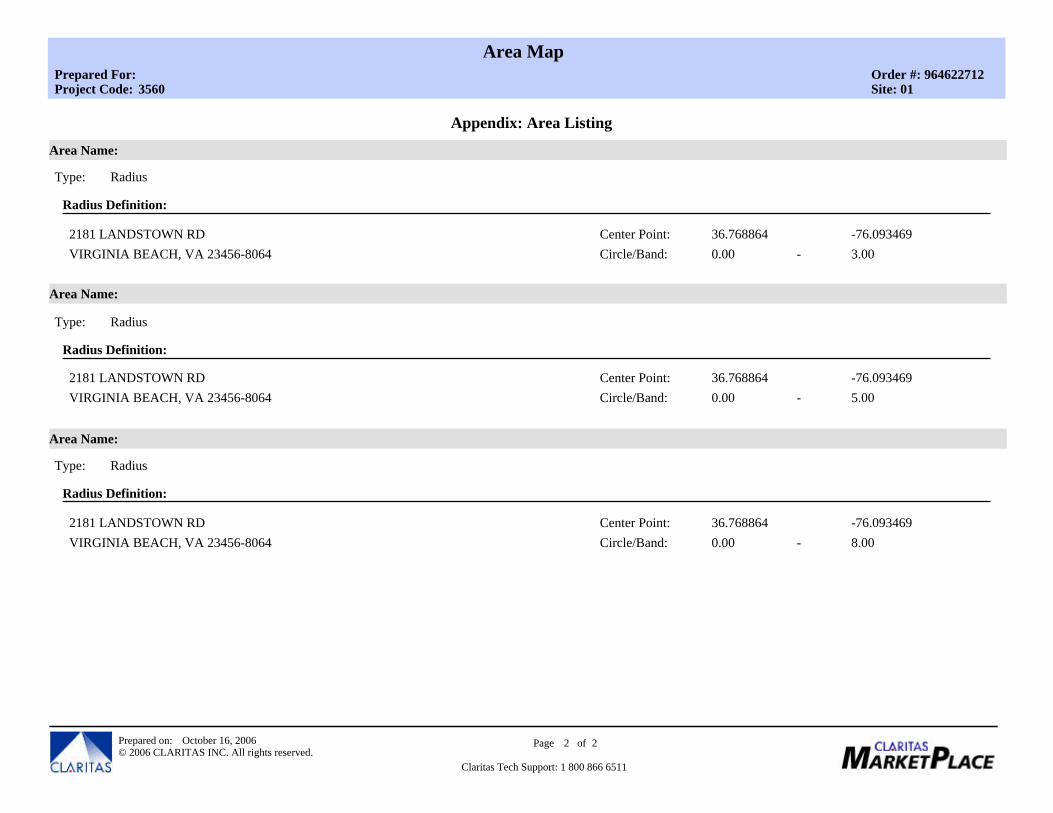
Area Map
Site: 013560Project Code:Prepared For: Order #: 964622712
Appendix: Area Listing
RadiusType:
Area Name:
Radius Definition:
VIRGINIA BEACH, VA 23456-8064 0.00 3.0036.768864 -76.0934692181 LANDSTOWN RD
Circle/Band:Center Point:
-
RadiusType:
Area Name:
Radius Definition:
VIRGINIA BEACH, VA 23456-8064 0.00 5.0036.768864 -76.0934692181 LANDSTOWN RD
Circle/Band:Center Point:
-
RadiusType:
Area Name:
Radius Definition:
VIRGINIA BEACH, VA 23456-8064 0.00 8.0036.768864 -76.0934692181 LANDSTOWN RD
Circle/Band:Center Point:
-
2of2PageOctober 16, 2006Prepared on:
Claritas Tech Support: 1 800 866 6511© 2006 CLARITAS INC. All rights reserved.
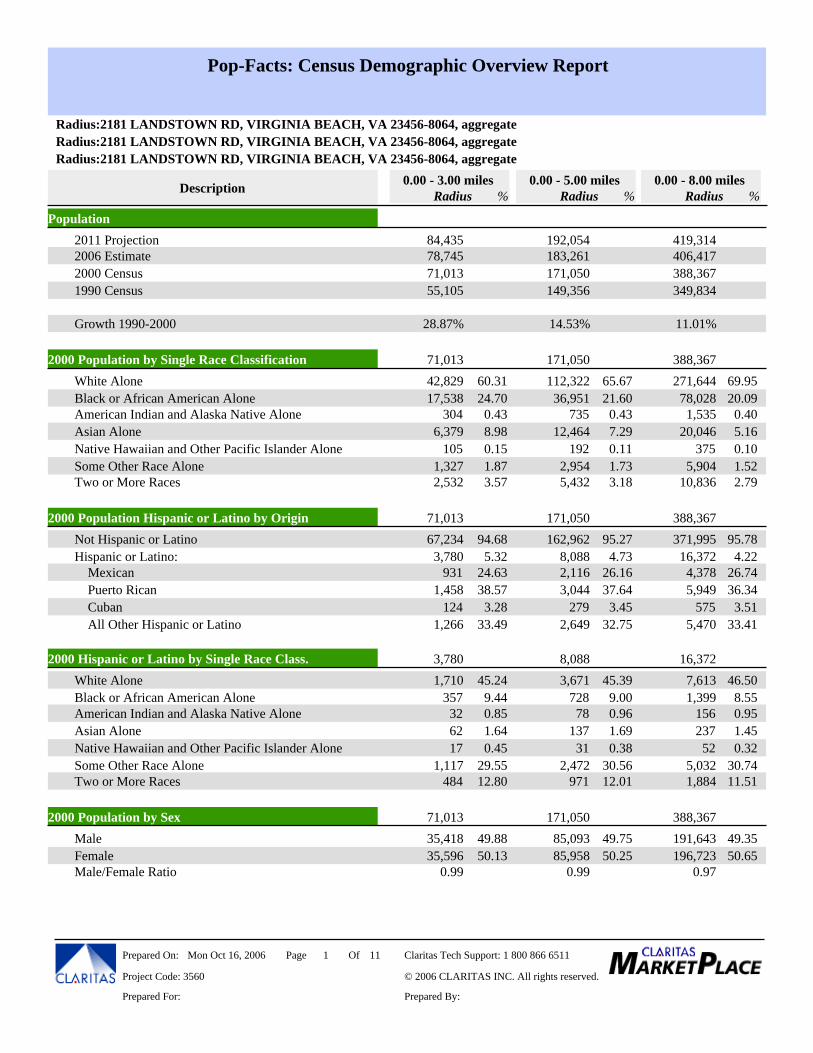
Pop-Facts: Census Demographic Overview Report
Radius:2181 LANDSTOWN RD, VIRGINIA BEACH, VA 23456-8064, aggregateRadius:2181 LANDSTOWN RD, VIRGINIA BEACH, VA 23456-8064, aggregateRadius:2181 LANDSTOWN RD, VIRGINIA BEACH, VA 23456-8064, aggregate
RadiusRadius0.00 - 8.00 miles0.00 - 5.00 miles0.00 - 3.00 miles
% % %RadiusDescription
Population84,435 419,314192,054 2011 Projection78,745 406,417183,261 2006 Estimate71,013 388,367171,050 2000 Census55,105 349,834149,356 1990 Census
28.87% 11.01%14.53% Growth 1990-2000
2000 Population by Single Race Classification 171,050 388,36771,013
42,829 271,644112,322 White Alone 69.9565.6760.3117,538 78,02836,951 Black or African American Alone 20.0921.6024.70
304 1,535735 American Indian and Alaska Native Alone 0.400.430.436,379 20,04612,464 Asian Alone 5.167.298.98
105 375192 Native Hawaiian and Other Pacific Islander Alone 0.100.110.151,327 5,9042,954 Some Other Race Alone 1.521.731.872,532 10,8365,432 Two or More Races 2.793.183.57
2000 Population Hispanic or Latino by Origin 171,050 388,36771,013
67,234 371,995162,962 Not Hispanic or Latino 95.7895.2794.683,780 16,3728,088 Hispanic or Latino: 4.224.735.32
931 4,3782,116 Mexican 26.7426.1624.631,458 5,9493,044 Puerto Rican 36.3437.6438.57
124 575279 Cuban 3.513.453.281,266 5,4702,649 All Other Hispanic or Latino 33.4132.7533.49
2000 Hispanic or Latino by Single Race Class. 8,088 16,3723,780
1,710 7,6133,671 White Alone 46.5045.3945.24357 1,399728 Black or African American Alone 8.559.009.4432 15678 American Indian and Alaska Native Alone 0.950.960.8562 237137 Asian Alone 1.451.691.6417 5231 Native Hawaiian and Other Pacific Islander Alone 0.320.380.45
1,117 5,0322,472 Some Other Race Alone 30.7430.5629.55484 1,884971 Two or More Races 11.5112.0112.80
2000 Population by Sex 171,050 388,36771,013
35,418 191,64385,093 Male 49.3549.7549.8835,596 196,72385,958 Female 50.6550.2550.13
0.99 0.970.99 Male/Female Ratio
Prepared By: Prepared For:
Project Code: 3560
111 OfPage Claritas Tech Support: 1 800 866 6511
© 2006 CLARITAS INC. All rights reserved.
Mon Oct 16, 2006Prepared On:

Pop-Facts: Census Demographic Overview Report
Radius:2181 LANDSTOWN RD, VIRGINIA BEACH, VA 23456-8064, aggregateRadius:2181 LANDSTOWN RD, VIRGINIA BEACH, VA 23456-8064, aggregateRadius:2181 LANDSTOWN RD, VIRGINIA BEACH, VA 23456-8064, aggregate
RadiusRadius0.00 - 8.00 miles0.00 - 5.00 miles0.00 - 3.00 miles
% % %RadiusDescription
2000 Population by Age 171,050 388,36771,0136,095 28,62013,173 Age 0 - 4 7.377.708.586,631 31,64014,760 Age 5 - 9 8.158.639.346,563 32,21415,245 Age 10 - 14 8.298.919.243,583 18,0848,491 Age 15 - 17 4.664.965.052,791 15,7937,018 Age 18 - 20 4.074.103.933,880 22,7489,689 Age 21 - 24 5.865.665.46
13,161 63,63829,451 Age 25 - 34 16.3917.2218.5314,227 71,08932,443 Age 35 - 44 18.3018.9720.034,808 27,14811,960 Age 45 - 49 6.996.996.773,381 21,8549,319 Age 50 - 54 5.635.454.762,101 15,5216,328 Age 55 - 59 4.003.702.961,334 11,1784,295 Age 60 - 64 2.882.511.881,596 17,3995,823 Age 65 - 74 4.483.402.25
697 8,9812,471 Age 75 - 84 2.311.440.98163 2,459584 Age 85 and over 0.630.340.23
50,496 289,747124,952 Age 16 and over 74.6173.0571.1148,141 277,808119,381 Age 18 and over 71.5369.7967.7945,350 262,015112,363 Age 21 and over 67.4765.6963.862,456 28,8398,877 Age 65 and over 7.435.193.46
2000 Median Age 30.82 32.0829.53 2000 Average Age 31.30 32.8629.62
Prepared By: Prepared For:
Project Code: 3560
112 OfPage Claritas Tech Support: 1 800 866 6511
© 2006 CLARITAS INC. All rights reserved.
Mon Oct 16, 2006Prepared On:
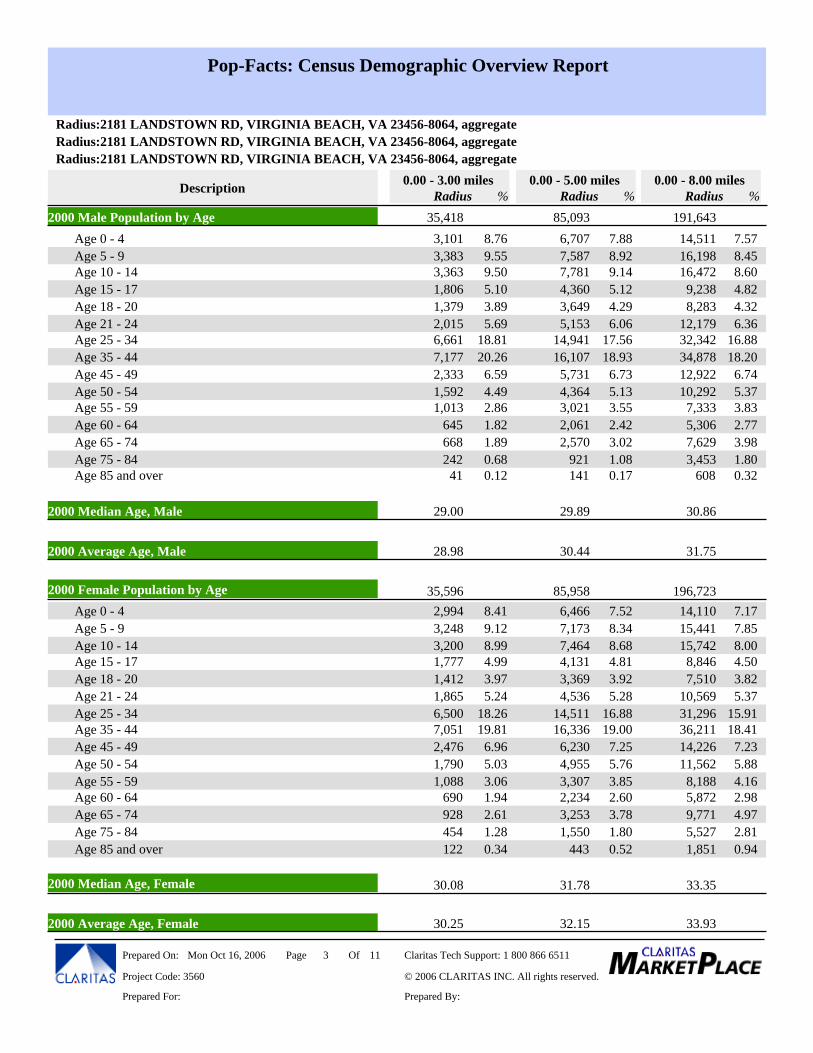
Pop-Facts: Census Demographic Overview Report
Radius:2181 LANDSTOWN RD, VIRGINIA BEACH, VA 23456-8064, aggregateRadius:2181 LANDSTOWN RD, VIRGINIA BEACH, VA 23456-8064, aggregateRadius:2181 LANDSTOWN RD, VIRGINIA BEACH, VA 23456-8064, aggregate
RadiusRadius0.00 - 8.00 miles0.00 - 5.00 miles0.00 - 3.00 miles
% % %RadiusDescription
2000 Male Population by Age 85,093 191,64335,4183,101 14,5116,707 Age 0 - 4 7.577.888.763,383 16,1987,587 Age 5 - 9 8.458.929.553,363 16,4727,781 Age 10 - 14 8.609.149.501,806 9,2384,360 Age 15 - 17 4.825.125.101,379 8,2833,649 Age 18 - 20 4.324.293.892,015 12,1795,153 Age 21 - 24 6.366.065.696,661 32,34214,941 Age 25 - 34 16.8817.5618.817,177 34,87816,107 Age 35 - 44 18.2018.9320.262,333 12,9225,731 Age 45 - 49 6.746.736.591,592 10,2924,364 Age 50 - 54 5.375.134.491,013 7,3333,021 Age 55 - 59 3.833.552.86
645 5,3062,061 Age 60 - 64 2.772.421.82668 7,6292,570 Age 65 - 74 3.983.021.89242 3,453921 Age 75 - 84 1.801.080.6841 608141 Age 85 and over 0.320.170.12
2000 Median Age, Male 29.89 30.8629.00 2000 Average Age, Male 30.44 31.7528.98 2000 Female Population by Age 85,958 196,72335,596
2,994 14,1106,466 Age 0 - 4 7.177.528.413,248 15,4417,173 Age 5 - 9 7.858.349.123,200 15,7427,464 Age 10 - 14 8.008.688.991,777 8,8464,131 Age 15 - 17 4.504.814.991,412 7,5103,369 Age 18 - 20 3.823.923.971,865 10,5694,536 Age 21 - 24 5.375.285.246,500 31,29614,511 Age 25 - 34 15.9116.8818.267,051 36,21116,336 Age 35 - 44 18.4119.0019.812,476 14,2266,230 Age 45 - 49 7.237.256.961,790 11,5624,955 Age 50 - 54 5.885.765.031,088 8,1883,307 Age 55 - 59 4.163.853.06
690 5,8722,234 Age 60 - 64 2.982.601.94928 9,7713,253 Age 65 - 74 4.973.782.61454 5,5271,550 Age 75 - 84 2.811.801.28122 1,851443 Age 85 and over 0.940.520.34
2000 Median Age, Female 31.78 33.3530.08 2000 Average Age, Female 32.15 33.9330.25
Prepared By: Prepared For:
Project Code: 3560
113 OfPage Claritas Tech Support: 1 800 866 6511
© 2006 CLARITAS INC. All rights reserved.
Mon Oct 16, 2006Prepared On:
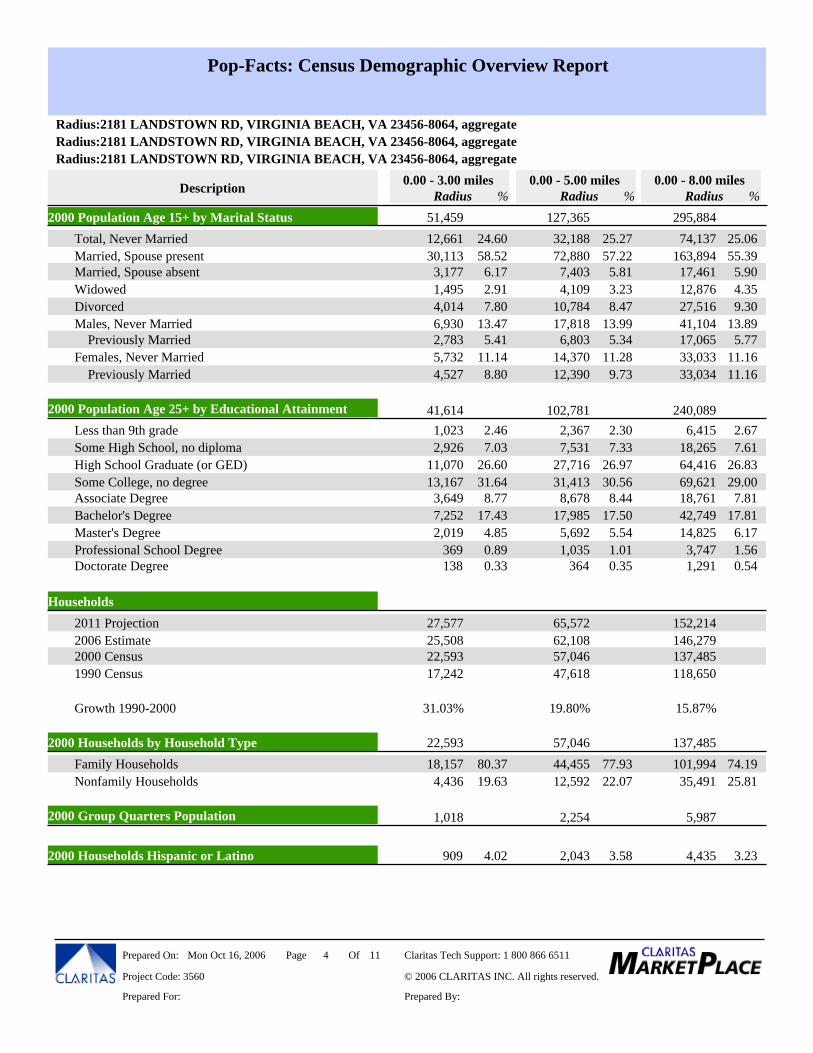
Pop-Facts: Census Demographic Overview Report
Radius:2181 LANDSTOWN RD, VIRGINIA BEACH, VA 23456-8064, aggregateRadius:2181 LANDSTOWN RD, VIRGINIA BEACH, VA 23456-8064, aggregateRadius:2181 LANDSTOWN RD, VIRGINIA BEACH, VA 23456-8064, aggregate
RadiusRadius0.00 - 8.00 miles0.00 - 5.00 miles0.00 - 3.00 miles
% % %RadiusDescription
2000 Population Age 15+ by Marital Status 127,365 295,88451,45912,661 74,13732,188 Total, Never Married 25.0625.2724.6030,113 163,89472,880 Married, Spouse present 55.3957.2258.523,177 17,4617,403 Married, Spouse absent 5.905.816.171,495 12,8764,109 Widowed 4.353.232.914,014 27,51610,784 Divorced 9.308.477.806,930 41,10417,818 Males, Never Married 13.8913.9913.472,783 17,0656,803 Previously Married 5.775.345.415,732 33,03314,370 Females, Never Married 11.1611.2811.144,527 33,03412,390 Previously Married 11.169.738.80
2000 Population Age 25+ by Educational Attainment 102,781 240,08941,614
1,023 6,4152,367 Less than 9th grade 2.672.302.462,926 18,2657,531 Some High School, no diploma 7.617.337.03
11,070 64,41627,716 High School Graduate (or GED) 26.8326.9726.6013,167 69,62131,413 Some College, no degree 29.0030.5631.643,649 18,7618,678 Associate Degree 7.818.448.777,252 42,74917,985 Bachelor's Degree 17.8117.5017.432,019 14,8255,692 Master's Degree 6.175.544.85
369 3,7471,035 Professional School Degree 1.561.010.89138 1,291364 Doctorate Degree 0.540.350.33
Households
27,577 152,21465,572 2011 Projection25,508 146,27962,108 2006 Estimate22,593 137,48557,046 2000 Census17,242 118,65047,618 1990 Census
31.03% 15.87%19.80% Growth 1990-2000
2000 Households by Household Type 57,046 137,48522,593
18,157 101,99444,455 Family Households 74.1977.9380.374,436 35,49112,592 Nonfamily Households 25.8122.0719.63
2000 Group Quarters Population 2,254 5,9871,018 2000 Households Hispanic or Latino 4.02 3.58 3.232,043 4,435909
Prepared By: Prepared For:
Project Code: 3560
114 OfPage Claritas Tech Support: 1 800 866 6511
© 2006 CLARITAS INC. All rights reserved.
Mon Oct 16, 2006Prepared On:
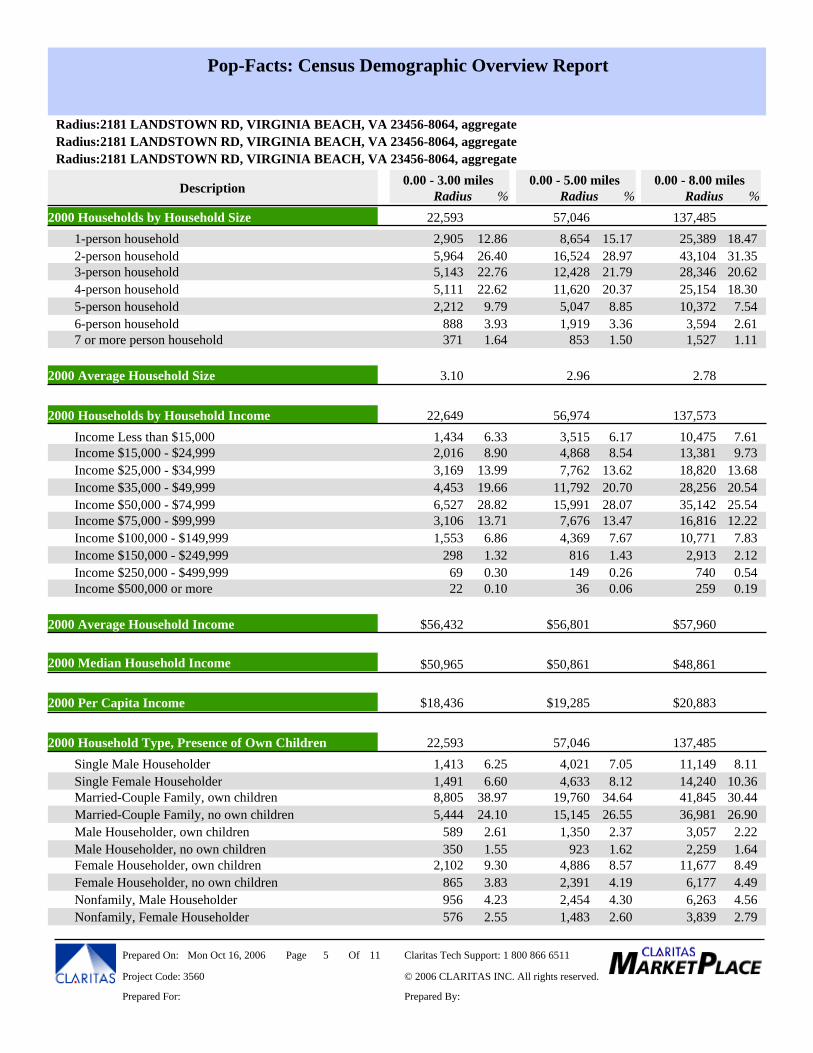
Pop-Facts: Census Demographic Overview Report
Radius:2181 LANDSTOWN RD, VIRGINIA BEACH, VA 23456-8064, aggregateRadius:2181 LANDSTOWN RD, VIRGINIA BEACH, VA 23456-8064, aggregateRadius:2181 LANDSTOWN RD, VIRGINIA BEACH, VA 23456-8064, aggregate
RadiusRadius0.00 - 8.00 miles0.00 - 5.00 miles0.00 - 3.00 miles
% % %RadiusDescription
2000 Households by Household Size 57,046 137,48522,5932,905 25,3898,654 1-person household 18.4715.1712.865,964 43,10416,524 2-person household 31.3528.9726.405,143 28,34612,428 3-person household 20.6221.7922.765,111 25,15411,620 4-person household 18.3020.3722.622,212 10,3725,047 5-person household 7.548.859.79
888 3,5941,919 6-person household 2.613.363.93371 1,527853 7 or more person household 1.111.501.64
2000 Average Household Size 2.96 2.783.10 2000 Households by Household Income 56,974 137,57322,649
1,434 10,4753,515 Income Less than $15,000 7.616.176.332,016 13,3814,868 Income $15,000 - $24,999 9.738.548.903,169 18,8207,762 Income $25,000 - $34,999 13.6813.6213.994,453 28,25611,792 Income $35,000 - $49,999 20.5420.7019.666,527 35,14215,991 Income $50,000 - $74,999 25.5428.0728.823,106 16,8167,676 Income $75,000 - $99,999 12.2213.4713.711,553 10,7714,369 Income $100,000 - $149,999 7.837.676.86
298 2,913816 Income $150,000 - $249,999 2.121.431.3269 740149 Income $250,000 - $499,999 0.540.260.3022 25936 Income $500,000 or more 0.190.060.10
2000 Average Household Income $56,801 $57,960$56,432 2000 Median Household Income $50,861 $48,861$50,965 2000 Per Capita Income $19,285 $20,883$18,436 2000 Household Type, Presence of Own Children 57,046 137,48522,593
1,413 11,1494,021 Single Male Householder 8.117.056.251,491 14,2404,633 Single Female Householder 10.368.126.608,805 41,84519,760 Married-Couple Family, own children 30.4434.6438.975,444 36,98115,145 Married-Couple Family, no own children 26.9026.5524.10
589 3,0571,350 Male Householder, own children 2.222.372.61350 2,259923 Male Householder, no own children 1.641.621.55
2,102 11,6774,886 Female Householder, own children 8.498.579.30865 6,1772,391 Female Householder, no own children 4.494.193.83956 6,2632,454 Nonfamily, Male Householder 4.564.304.23576 3,8391,483 Nonfamily, Female Householder 2.792.602.55
Prepared By: Prepared For:
Project Code: 3560
115 OfPage Claritas Tech Support: 1 800 866 6511
© 2006 CLARITAS INC. All rights reserved.
Mon Oct 16, 2006Prepared On:
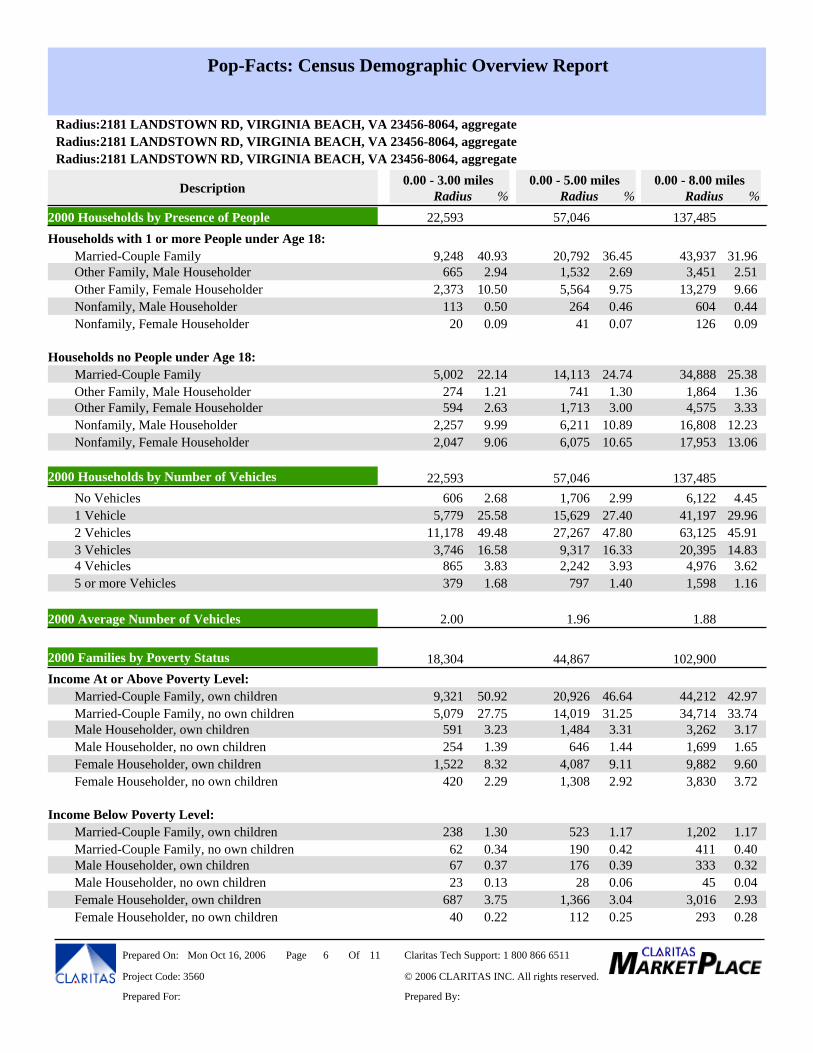
Pop-Facts: Census Demographic Overview Report
Radius:2181 LANDSTOWN RD, VIRGINIA BEACH, VA 23456-8064, aggregateRadius:2181 LANDSTOWN RD, VIRGINIA BEACH, VA 23456-8064, aggregateRadius:2181 LANDSTOWN RD, VIRGINIA BEACH, VA 23456-8064, aggregate
RadiusRadius0.00 - 8.00 miles0.00 - 5.00 miles0.00 - 3.00 miles
% % %RadiusDescription
2000 Households by Presence of People 57,046 137,48522,593Households with 1 or more People under Age 18:
9,248 43,93720,792 Married-Couple Family 31.9636.4540.93665 3,4511,532 Other Family, Male Householder 2.512.692.94
2,373 13,2795,564 Other Family, Female Householder 9.669.7510.50113 604264 Nonfamily, Male Householder 0.440.460.5020 12641 Nonfamily, Female Householder 0.090.070.09
Households no People under Age 18:
5,002 34,88814,113 Married-Couple Family 25.3824.7422.14274 1,864741 Other Family, Male Householder 1.361.301.21594 4,5751,713 Other Family, Female Householder 3.333.002.63
2,257 16,8086,211 Nonfamily, Male Householder 12.2310.899.992,047 17,9536,075 Nonfamily, Female Householder 13.0610.659.06
2000 Households by Number of Vehicles 57,046 137,48522,593
606 6,1221,706 No Vehicles 4.452.992.685,779 41,19715,629 1 Vehicle 29.9627.4025.58
11,178 63,12527,267 2 Vehicles 45.9147.8049.483,746 20,3959,317 3 Vehicles 14.8316.3316.58
865 4,9762,242 4 Vehicles 3.623.933.83379 1,598797 5 or more Vehicles 1.161.401.68
2000 Average Number of Vehicles 1.96 1.882.00 2000 Families by Poverty Status 44,867 102,90018,304Income At or Above Poverty Level:
9,321 44,21220,926 Married-Couple Family, own children 42.9746.6450.925,079 34,71414,019 Married-Couple Family, no own children 33.7431.2527.75
591 3,2621,484 Male Householder, own children 3.173.313.23254 1,699646 Male Householder, no own children 1.651.441.39
1,522 9,8824,087 Female Householder, own children 9.609.118.32420 3,8301,308 Female Householder, no own children 3.722.922.29
Income Below Poverty Level:
238 1,202523 Married-Couple Family, own children 1.171.171.3062 411190 Married-Couple Family, no own children 0.400.420.3467 333176 Male Householder, own children 0.320.390.3723 4528 Male Householder, no own children 0.040.060.13
687 3,0161,366 Female Householder, own children 2.933.043.7540 293112 Female Householder, no own children 0.280.250.22
Prepared By: Prepared For:
Project Code: 3560
116 OfPage Claritas Tech Support: 1 800 866 6511
© 2006 CLARITAS INC. All rights reserved.
Mon Oct 16, 2006Prepared On:
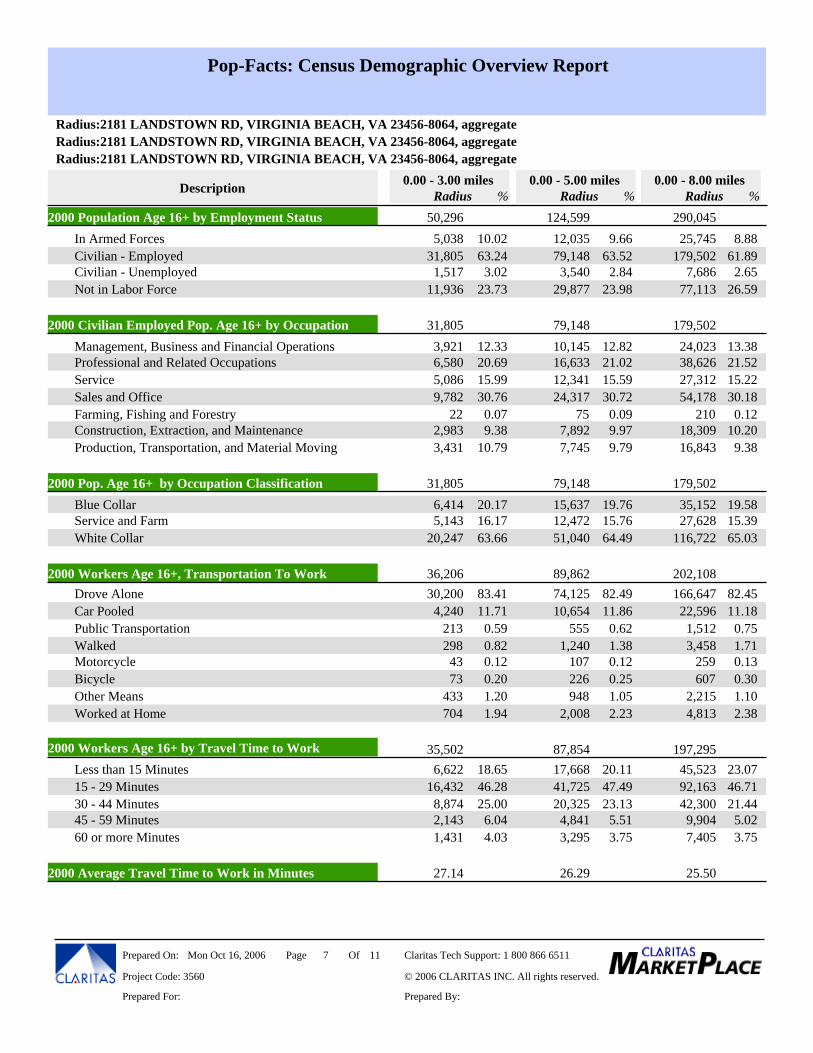
Pop-Facts: Census Demographic Overview Report
Radius:2181 LANDSTOWN RD, VIRGINIA BEACH, VA 23456-8064, aggregateRadius:2181 LANDSTOWN RD, VIRGINIA BEACH, VA 23456-8064, aggregateRadius:2181 LANDSTOWN RD, VIRGINIA BEACH, VA 23456-8064, aggregate
RadiusRadius0.00 - 8.00 miles0.00 - 5.00 miles0.00 - 3.00 miles
% % %RadiusDescription
2000 Population Age 16+ by Employment Status 124,599 290,04550,2965,038 25,74512,035 In Armed Forces 8.889.6610.02
31,805 179,50279,148 Civilian - Employed 61.8963.5263.241,517 7,6863,540 Civilian - Unemployed 2.652.843.02
11,936 77,11329,877 Not in Labor Force 26.5923.9823.73 2000 Civilian Employed Pop. Age 16+ by Occupation 79,148 179,50231,805
3,921 24,02310,145 Management, Business and Financial Operations 13.3812.8212.336,580 38,62616,633 Professional and Related Occupations 21.5221.0220.695,086 27,31212,341 Service 15.2215.5915.999,782 54,17824,317 Sales and Office 30.1830.7230.76
22 21075 Farming, Fishing and Forestry 0.120.090.072,983 18,3097,892 Construction, Extraction, and Maintenance 10.209.979.383,431 16,8437,745 Production, Transportation, and Material Moving 9.389.7910.79
2000 Pop. Age 16+ by Occupation Classification 79,148 179,50231,805
6,414 35,15215,637 Blue Collar 19.5819.7620.175,143 27,62812,472 Service and Farm 15.3915.7616.17
20,247 116,72251,040 White Collar 65.0364.4963.66 2000 Workers Age 16+, Transportation To Work 89,862 202,10836,206
30,200 166,64774,125 Drove Alone 82.4582.4983.414,240 22,59610,654 Car Pooled 11.1811.8611.71
213 1,512555 Public Transportation 0.750.620.59298 3,4581,240 Walked 1.711.380.8243 259107 Motorcycle 0.130.120.1273 607226 Bicycle 0.300.250.20
433 2,215948 Other Means 1.101.051.20704 4,8132,008 Worked at Home 2.382.231.94
2000 Workers Age 16+ by Travel Time to Work 87,854 197,29535,502
6,622 45,52317,668 Less than 15 Minutes 23.0720.1118.6516,432 92,16341,725 15 - 29 Minutes 46.7147.4946.288,874 42,30020,325 30 - 44 Minutes 21.4423.1325.002,143 9,9044,841 45 - 59 Minutes 5.025.516.041,431 7,4053,295 60 or more Minutes 3.753.754.03
2000 Average Travel Time to Work in Minutes 26.29 25.5027.14
Prepared By: Prepared For:
Project Code: 3560
117 OfPage Claritas Tech Support: 1 800 866 6511
© 2006 CLARITAS INC. All rights reserved.
Mon Oct 16, 2006Prepared On:
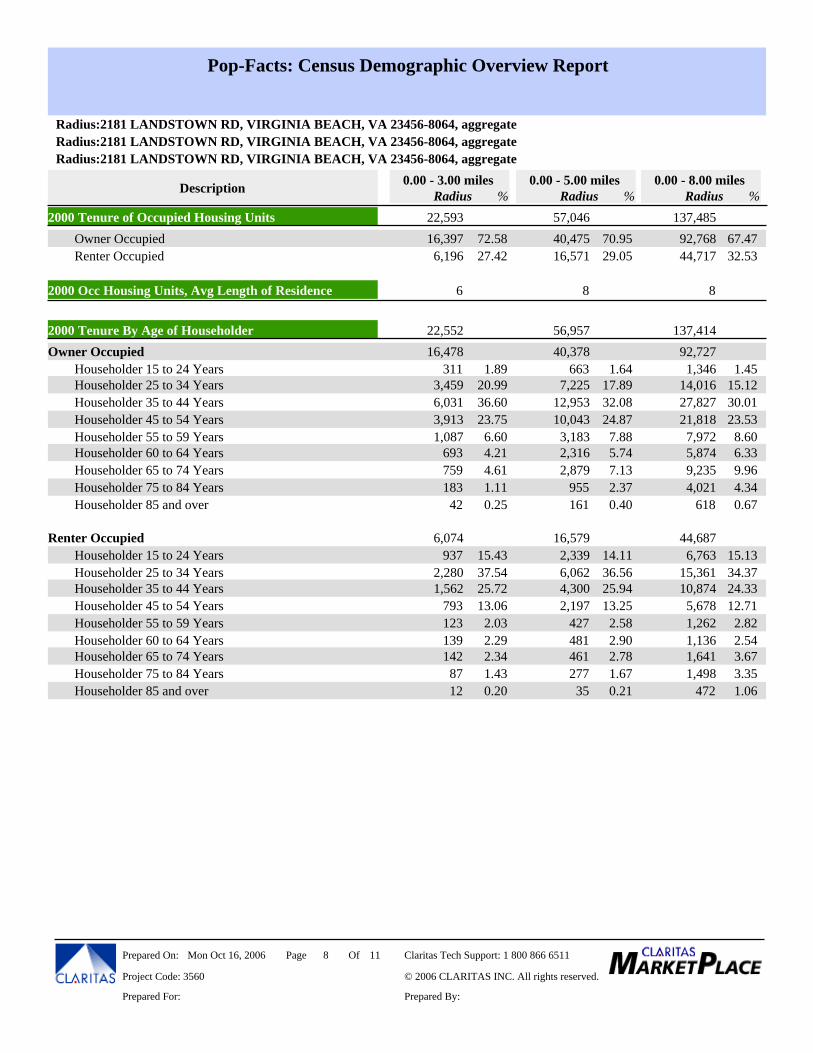
Pop-Facts: Census Demographic Overview Report
Radius:2181 LANDSTOWN RD, VIRGINIA BEACH, VA 23456-8064, aggregateRadius:2181 LANDSTOWN RD, VIRGINIA BEACH, VA 23456-8064, aggregateRadius:2181 LANDSTOWN RD, VIRGINIA BEACH, VA 23456-8064, aggregate
RadiusRadius0.00 - 8.00 miles0.00 - 5.00 miles0.00 - 3.00 miles
% % %RadiusDescription
2000 Tenure of Occupied Housing Units 57,046 137,48522,59316,397 92,76840,475 Owner Occupied 67.4770.9572.586,196 44,71716,571 Renter Occupied 32.5329.0527.42
2000 Occ Housing Units, Avg Length of Residence 8 86 2000 Tenure By Age of Householder 56,957 137,41422,552
16,478 92,72740,378Owner Occupied311 1,346663 Householder 15 to 24 Years 1.451.641.89
3,459 14,0167,225 Householder 25 to 34 Years 15.1217.8920.996,031 27,82712,953 Householder 35 to 44 Years 30.0132.0836.603,913 21,81810,043 Householder 45 to 54 Years 23.5324.8723.751,087 7,9723,183 Householder 55 to 59 Years 8.607.886.60
693 5,8742,316 Householder 60 to 64 Years 6.335.744.21759 9,2352,879 Householder 65 to 74 Years 9.967.134.61183 4,021955 Householder 75 to 84 Years 4.342.371.1142 618161 Householder 85 and over 0.670.400.25
6,074 44,68716,579Renter Occupied
937 6,7632,339 Householder 15 to 24 Years 15.1314.1115.432,280 15,3616,062 Householder 25 to 34 Years 34.3736.5637.541,562 10,8744,300 Householder 35 to 44 Years 24.3325.9425.72
793 5,6782,197 Householder 45 to 54 Years 12.7113.2513.06123 1,262427 Householder 55 to 59 Years 2.822.582.03139 1,136481 Householder 60 to 64 Years 2.542.902.29142 1,641461 Householder 65 to 74 Years 3.672.782.3487 1,498277 Householder 75 to 84 Years 3.351.671.4312 47235 Householder 85 and over 1.060.210.20
Prepared By: Prepared For:
Project Code: 3560
118 OfPage Claritas Tech Support: 1 800 866 6511
© 2006 CLARITAS INC. All rights reserved.
Mon Oct 16, 2006Prepared On:

Pop-Facts: Census Demographic Overview Report
Radius:2181 LANDSTOWN RD, VIRGINIA BEACH, VA 23456-8064, aggregateRadius:2181 LANDSTOWN RD, VIRGINIA BEACH, VA 23456-8064, aggregateRadius:2181 LANDSTOWN RD, VIRGINIA BEACH, VA 23456-8064, aggregate
RadiusRadius0.00 - 8.00 miles0.00 - 5.00 miles0.00 - 3.00 miles
% % %RadiusDescription
2000 Pop 65 and over by HH Type and Relationship2,387 28,5808,592Total for Pop 65 and over2,325 27,2418,317In Households:1,874 20,1416,781 In Family Households: 70.4778.9278.51
783 10,1033,111 Householder 35.3536.2132.80627 8,2312,542 Male 28.8029.5926.27156 1,872569 Female 6.556.626.54514 6,8082,165 Spouse 23.8225.2021.53319 1,734812 Parent 6.079.4513.36243 1,386638 Other Relatives 4.857.4310.1815 11155 Nonrelatives 0.390.640.63
450 7,1001,536 In Non-Family Households: 24.8417.8818.8597 1,609393 Male householder 5.634.574.0679 1,413353 Living Alone 4.944.113.3119 19741 Not Living Alone 0.690.480.80
280 5,2091,042 Female Householder 18.2312.1311.73254 5,079990 Living Alone 17.7711.5210.6426 13052 Not Living Alone 0.450.611.0973 282100 Nonrelatives 0.991.163.06
In Group Quarters: 276 1,33963
63 1,168264 Institutionalized population 4.093.072.640 17112 Noninstitutionalized population 0.600.140.00
2000 All Owner-Occupied Housing Values 40,378 92,72716,478
36 1,401226 Value Less than $20,000 1.510.560.2287 386185 Value $20,000 - $39,999 0.420.460.53
881 3,1321,725 Value $40,000 - $59,999 3.384.275.351,883 9,9274,435 Value $60,000 - $79,999 10.7110.9811.433,396 18,5649,020 Value $80,000 - $99,999 20.0222.3420.616,419 34,28715,837 Value $100,000 - $149,999 36.9839.2238.952,678 14,5446,406 Value $150,000 - $199,999 15.6815.8716.25
899 7,0072,175 Value $200,000 - $299,999 7.565.395.46157 1,874292 Value $300,000 - $399,999 2.020.720.9510 80724 Value $400,000 - $499,999 0.870.060.069 3979 Value $500,000 - $749,999 0.430.020.05
12 22712 Value $750,000 - $999,999 0.240.030.0710 17532 Value $1,000,000 or more 0.190.080.06
2000 Median All Owner-Occupied Housing Value $114,517 $118,891$115,234
Prepared By: Prepared For:
Project Code: 3560
119 OfPage Claritas Tech Support: 1 800 866 6511
© 2006 CLARITAS INC. All rights reserved.
Mon Oct 16, 2006Prepared On:
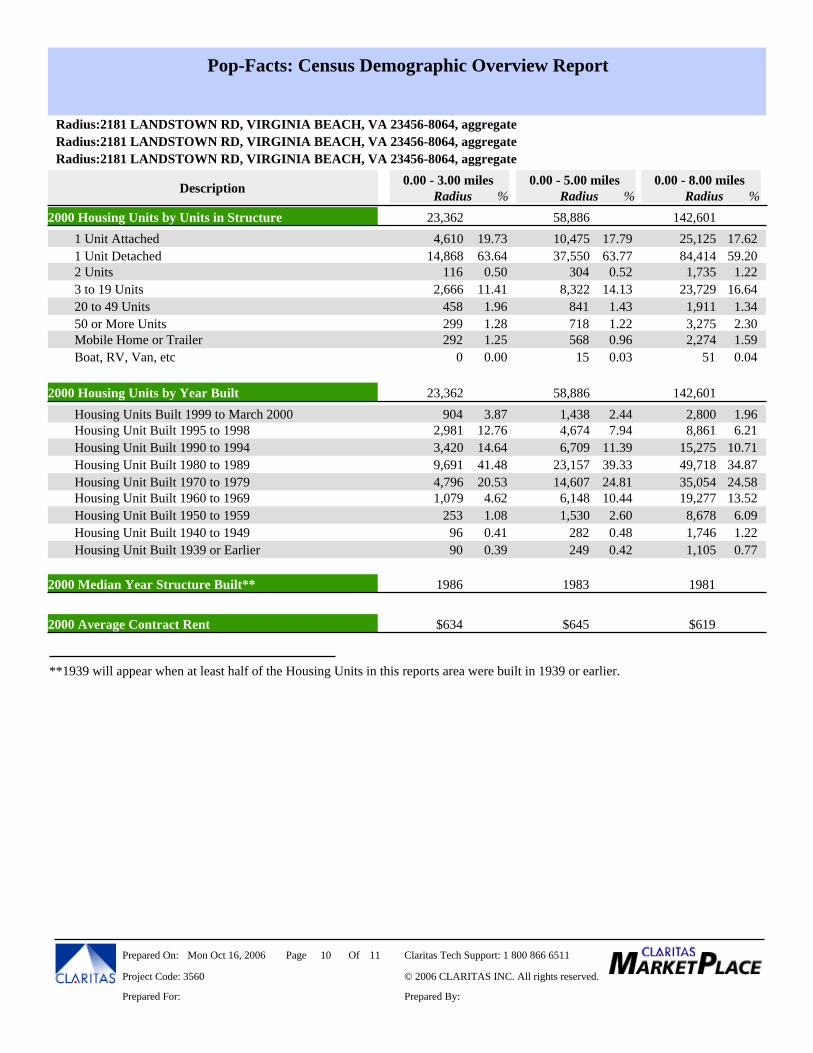
Pop-Facts: Census Demographic Overview Report
Radius:2181 LANDSTOWN RD, VIRGINIA BEACH, VA 23456-8064, aggregateRadius:2181 LANDSTOWN RD, VIRGINIA BEACH, VA 23456-8064, aggregateRadius:2181 LANDSTOWN RD, VIRGINIA BEACH, VA 23456-8064, aggregate
RadiusRadius0.00 - 8.00 miles0.00 - 5.00 miles0.00 - 3.00 miles
% % %RadiusDescription
2000 Housing Units by Units in Structure 58,886 142,60123,3624,610 25,12510,475 1 Unit Attached 17.6217.7919.73
14,868 84,41437,550 1 Unit Detached 59.2063.7763.64116 1,735304 2 Units 1.220.520.50
2,666 23,7298,322 3 to 19 Units 16.6414.1311.41458 1,911841 20 to 49 Units 1.341.431.96299 3,275718 50 or More Units 2.301.221.28292 2,274568 Mobile Home or Trailer 1.590.961.25
0 5115 Boat, RV, Van, etc 0.040.030.00 2000 Housing Units by Year Built 58,886 142,60123,362
904 2,8001,438 Housing Units Built 1999 to March 2000 1.962.443.872,981 8,8614,674 Housing Unit Built 1995 to 1998 6.217.9412.763,420 15,2756,709 Housing Unit Built 1990 to 1994 10.7111.3914.649,691 49,71823,157 Housing Unit Built 1980 to 1989 34.8739.3341.484,796 35,05414,607 Housing Unit Built 1970 to 1979 24.5824.8120.531,079 19,2776,148 Housing Unit Built 1960 to 1969 13.5210.444.62
253 8,6781,530 Housing Unit Built 1950 to 1959 6.092.601.0896 1,746282 Housing Unit Built 1940 to 1949 1.220.480.4190 1,105249 Housing Unit Built 1939 or Earlier 0.770.420.39
2000 Median Year Structure Built** 1983 19811986 2000 Average Contract Rent $645 $619$634
**1939 will appear when at least half of the Housing Units in this reports area were built in 1939 or earlier.
Prepared By: Prepared For:
Project Code: 3560
1110 OfPage Claritas Tech Support: 1 800 866 6511
© 2006 CLARITAS INC. All rights reserved.
Mon Oct 16, 2006Prepared On:
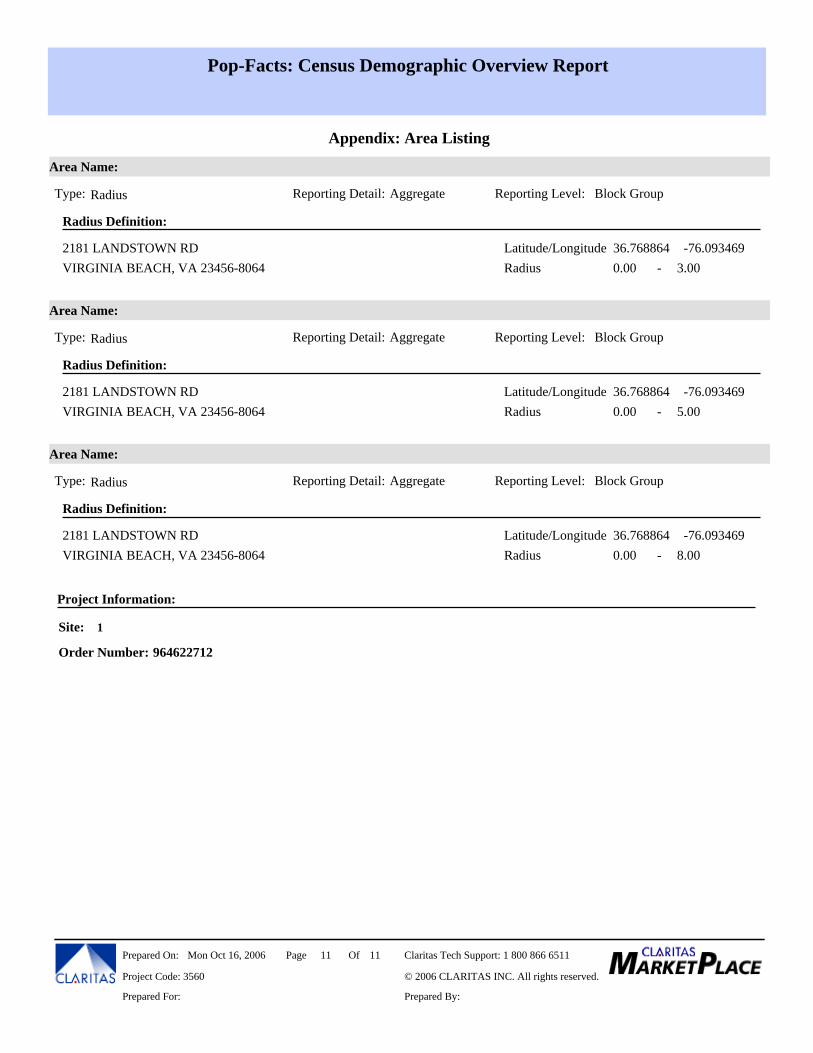
Pop-Facts: Census Demographic Overview Report
Appendix: Area Listing
Radius Definition:
Block GroupType: Radius Reporting Detail: Aggregate Reporting Level:
Area Name:
VIRGINIA BEACH, VA 23456-8064 -RadiusLatitude/Longitude2181 LANDSTOWN RD
0.00 3.00-76.09346936.768864
Radius Definition:
Block GroupType: Radius Reporting Detail: Aggregate Reporting Level:
Area Name:
VIRGINIA BEACH, VA 23456-8064 -RadiusLatitude/Longitude2181 LANDSTOWN RD
0.00 5.00-76.09346936.768864
Radius Definition:
Block GroupType: Radius Reporting Detail: Aggregate Reporting Level:
Area Name:
VIRGINIA BEACH, VA 23456-8064 -RadiusLatitude/Longitude2181 LANDSTOWN RD
0.00 8.00-76.09346936.768864
1
964622712
Project Information:
Order Number:
Site:
Prepared By: Prepared For:
Project Code: 3560
1111 OfPage Claritas Tech Support: 1 800 866 6511
© 2006 CLARITAS INC. All rights reserved.
Mon Oct 16, 2006Prepared On:

Exhibit 2

This page intentionally blank
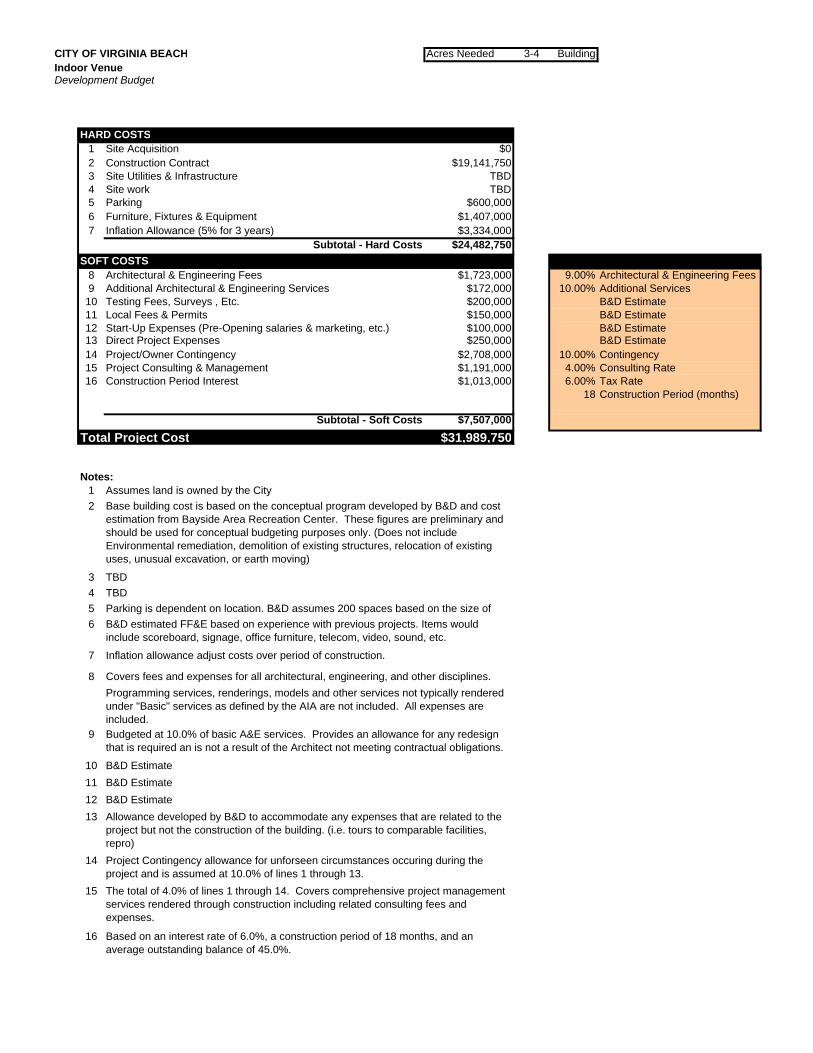
CITY OF VIRGINIA BEACH Acres Needed 3-4 BuildingIndoor VenueDevelopment Budget
HARD COSTS1 Site Acquisition $02 Construction Contract $19,141,7503 Site Utilities & Infrastructure TBD4 Site work TBD5 Parking $600,0006 Furniture, Fixtures & Equipment $1,407,0007 Inflation Allowance (5% for 3 years) $3,334,000
Subtotal - Hard Costs $24,482,750SOFT COSTS 77%
8 Architectural & Engineering Fees $1,723,000 9.00% Architectural & Engineering Fees9 Additional Architectural & Engineering Services $172,000 10.00% Additional Services
10 Testing Fees, Surveys , Etc. $200,000 B&D Estimate11 Local Fees & Permits $150,000 B&D Estimate12 Start-Up Expenses (Pre-Opening salaries & marketing, etc.) $100,000 B&D Estimate13 Direct Project Expenses $250,000 B&D Estimate14 Project/Owner Contingency $2,708,000 10.00% Contingency15 Project Consulting & Management $1,191,000 4.00% Consulting Rate16 Construction Period Interest $1,013,000 6.00% Tax Rate
18 Construction Period (months)
Subtotal - Soft Costs $7,507,000Total Project Cost $31,989,750
23%Notes:
12
3456
7
8
9
10111213
14
15
16
Project Contingency allowance for unforseen circumstances occuring during the project and is assumed at 10.0% of lines 1 through 13.The total of 4.0% of lines 1 through 14. Covers comprehensive project management services rendered through construction including related consulting fees and expenses.
Based on an interest rate of 6.0%, a construction period of 18 months, and an average outstanding balance of 45.0%.
B&D EstimateB&D EstimateB&D EstimateAllowance developed by B&D to accommodate any expenses that are related to the project but not the construction of the building. (i.e. tours to comparable facilities, repro)
Inflation allowance adjust costs over period of construction.
Covers fees and expenses for all architectural, engineering, and other disciplines.Programming services, renderings, models and other services not typically rendered under "Basic" services as defined by the AIA are not included. All expenses are included.Budgeted at 10.0% of basic A&E services. Provides an allowance for any redesign that is required an is not a result of the Architect not meeting contractual obligations.
TBDParking is dependent on location. B&D assumes 200 spaces based on the size of B&D estimated FF&E based on experience with previous projects. Items would include scoreboard, signage, office furniture, telecom, video, sound, etc.
Assumes land is owned by the CityBase building cost is based on the conceptual program developed by B&D and cost estimation from Bayside Area Recreation Center. These figures are preliminary and should be used for conceptual budgeting purposes only. (Does not include Environmental remediation, demolition of existing structures, relocation of existing uses, unusual excavation, or earth moving)
TBD

City of Virginia Beach
Indoor Sports Venue Financial Addendum
Final Report
October 2006
BRAILSFORD & DUNLAVEY
© Brailsford & Dunlavey 2006
TABLE OF CONTENTS
Brailsford & Dunlavey Indoor Sports Venue Feasibility Study Page i
SECTION A ......... Financial Analysis
EXHIBITS
1 ..........Financial Model

TABLE OF CONTENTS
Brailsford & Dunlavey Indoor Sports Venue Feasibility Study Page ii
FINANCIAL ANALYSIS
Brailsford & Dunlavey Indoor Sports Venue Feasibility Study Page 1
INTRODUCTION The financial analysis portion of the feasibility study is intended to quantify the revenue generated by a new indoor athletic venue, to measure the capacity of these revenue streams to meet the facility’s operating requirements, and to develop an estimate of total project costs. With these purposes in mind, the analysis applies the findings of the market analysis to estimate the likely revenue and associated operating expenses. Key to this analysis is the comprehensive financial model. The tool allows for the thorough understanding of all of the financial implications associated with a facility investment by integrating the building program, revenue calculations, and operating expense calculations into an all-inclusive model. All of these assumptions are linked such that any change in assumptions automatically triggers an adjustment to all of the affected financial elements. The model enables any and all changes to the project to be quickly analyzed on a specific and project-wide basis while maintaining the internal balance of the model. Due to the volatility of the construction market, projected results and costs may vary significantly from the project’s actual performance. Therefore, B&D cannot ensure that the results highlighted in this report will portray the actual performance of the proposed development project; however, to identify the range of risks inherent in the proposed project, the model allows for testing of multiple scenarios to evaluate the project concept under a variety of economic conditions. METHODOLOGY This exercise was intended to examine the financial feasibility of constructing and operating a new indoor athletic venue to complement the existing facilities in Prince Anne Commons. Since the goal of the exercise was to determine the financial feasibility of a private entity developing the facility, the scenario presented shows a facility built and operated by a private entity. The financial model includes testing multiple scenarios with respect to operating revenue and operating cost assumptions. The ultimate goal of this exercise is to understand if a private investor can achieve a viable operation without any subsidy from the City. The building program and operating assumptions utilized in the models are based, where appropriate, on the market analysis, comparisons to similar projects, the use of industry standards, City projections and operating data, and B&D’s industry expertise. A more detailed description of the specific assumptions is included in the following text. Versions of the respective model are included in Exhibit 1.
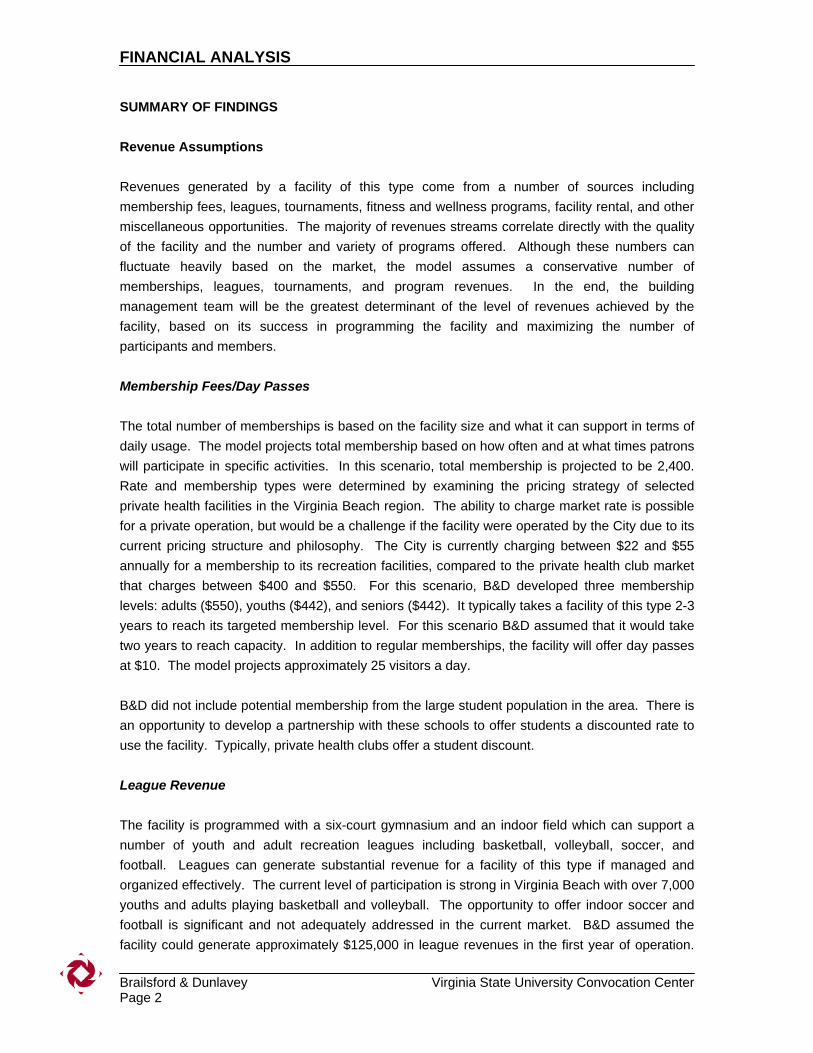
FINANCIAL ANALYSIS
Brailsford & Dunlavey Virginia State University Convocation Center Page 2
SUMMARY OF FINDINGS Revenue Assumptions Revenues generated by a facility of this type come from a number of sources including membership fees, leagues, tournaments, fitness and wellness programs, facility rental, and other miscellaneous opportunities. The majority of revenues streams correlate directly with the quality of the facility and the number and variety of programs offered. Although these numbers can fluctuate heavily based on the market, the model assumes a conservative number of memberships, leagues, tournaments, and program revenues. In the end, the building management team will be the greatest determinant of the level of revenues achieved by the facility, based on its success in programming the facility and maximizing the number of participants and members. Membership Fees/Day Passes The total number of memberships is based on the facility size and what it can support in terms of daily usage. The model projects total membership based on how often and at what times patrons will participate in specific activities. In this scenario, total membership is projected to be 2,400. Rate and membership types were determined by examining the pricing strategy of selected private health facilities in the Virginia Beach region. The ability to charge market rate is possible for a private operation, but would be a challenge if the facility were operated by the City due to its current pricing structure and philosophy. The City is currently charging between $22 and $55 annually for a membership to its recreation facilities, compared to the private health club market that charges between $400 and $550. For this scenario, B&D developed three membership levels: adults ($550), youths ($442), and seniors ($442). It typically takes a facility of this type 2-3 years to reach its targeted membership level. For this scenario B&D assumed that it would take two years to reach capacity. In addition to regular memberships, the facility will offer day passes at $10. The model projects approximately 25 visitors a day. B&D did not include potential membership from the large student population in the area. There is an opportunity to develop a partnership with these schools to offer students a discounted rate to use the facility. Typically, private health clubs offer a student discount. League Revenue The facility is programmed with a six-court gymnasium and an indoor field which can support a number of youth and adult recreation leagues including basketball, volleyball, soccer, and football. Leagues can generate substantial revenue for a facility of this type if managed and organized effectively. The current level of participation is strong in Virginia Beach with over 7,000 youths and adults playing basketball and volleyball. The opportunity to offer indoor soccer and football is significant and not adequately addressed in the current market. B&D assumed the facility could generate approximately $125,000 in league revenues in the first year of operation.
FINANCIAL ANALYSIS
Brailsford & Dunlavey Indoor Sports Venue Feasibility Study Page 3
With each year the facility should be able to attract greater levels of participation until it reaches capacity, usually within 3-4 years. Tournament Revenues Tournaments are difficult to predict and are extremely speculative. Tournaments are typically organized by an outside association that will rent a facility and pay either a flat rate or a fee per participant. B&D approached the Amateur Athletic Union (AAU) to gauge interest in hosting tournaments at a new facility in the area. AAU has a strong base in Virginia Beach and hosts a variety of events in the region. Based on the initial program, AAU indicated interest in hosting tournaments at a new facility. For this scenario, B&D estimated a conservative amount for tournaments, and assumes that it would serve as a host versus the organizer. Program Revenue Program revenue encompasses a number of activities where individuals are charged a fee to participate. These activities include aquatics classes and programs, fitness and training, and camps. Aquatics Classes & Programs
• Aqua Therapy • Water Aerobics • Drop in Water Aerobics
Fitness/Sports Training • Youth Fitness • Adult Fitness (Yoga, Pilates, etc.) • Senior Fitness • Personal Training • Athletic Training • Health & Wellness
Camps • Summer Sports Camps • Weekly Recreational • Weekly Sports
Rental Revenue The proposed facility will have a number of spaces that can be rented for various functions, parties, high school events, community events, parties, etc. Availability will be based on existing leagues, tournaments, free play, and other membership-based programs so as not to interfere with patrons’ daily routines.
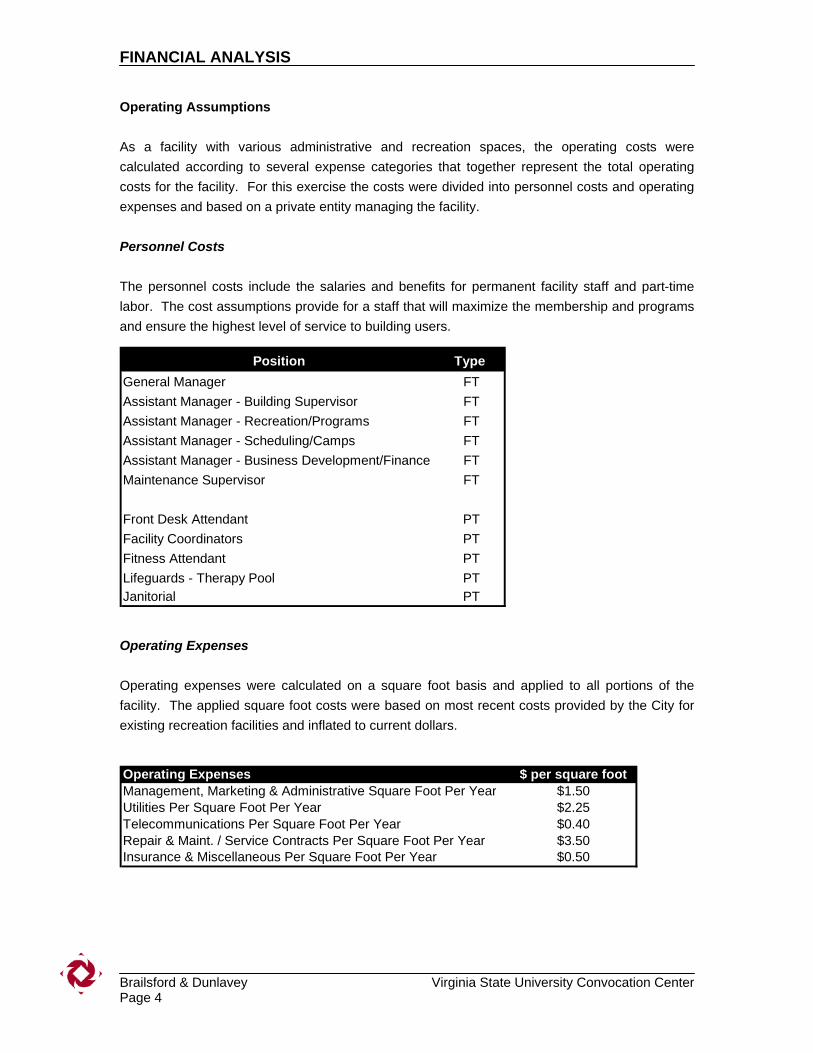
FINANCIAL ANALYSIS
Brailsford & Dunlavey Virginia State University Convocation Center Page 4
Operating Assumptions As a facility with various administrative and recreation spaces, the operating costs were calculated according to several expense categories that together represent the total operating costs for the facility. For this exercise the costs were divided into personnel costs and operating expenses and based on a private entity managing the facility. Personnel Costs The personnel costs include the salaries and benefits for permanent facility staff and part-time labor. The cost assumptions provide for a staff that will maximize the membership and programs and ensure the highest level of service to building users.
Operating Expenses Operating expenses were calculated on a square foot basis and applied to all portions of the facility. The applied square foot costs were based on most recent costs provided by the City for existing recreation facilities and inflated to current dollars.
Position Type General Manager FTAssistant Manager - Building Supervisor FTAssistant Manager - Recreation/Programs FTAssistant Manager - Scheduling/Camps FTAssistant Manager - Business Development/Finance FTMaintenance Supervisor FT
Front Desk Attendant PTFacility Coordinators PTFitness Attendant PTLifeguards - Therapy Pool PTJanitorial PT
Operating Expenses $ per square footManagement, Marketing & Administrative Square Foot Per Year $1.50Utilities Per Square Foot Per Year $2.25Telecommunications Per Square Foot Per Year $0.40Repair & Maint. / Service Contracts Per Square Foot Per Year $3.50Insurance & Miscellaneous Per Square Foot Per Year $0.50
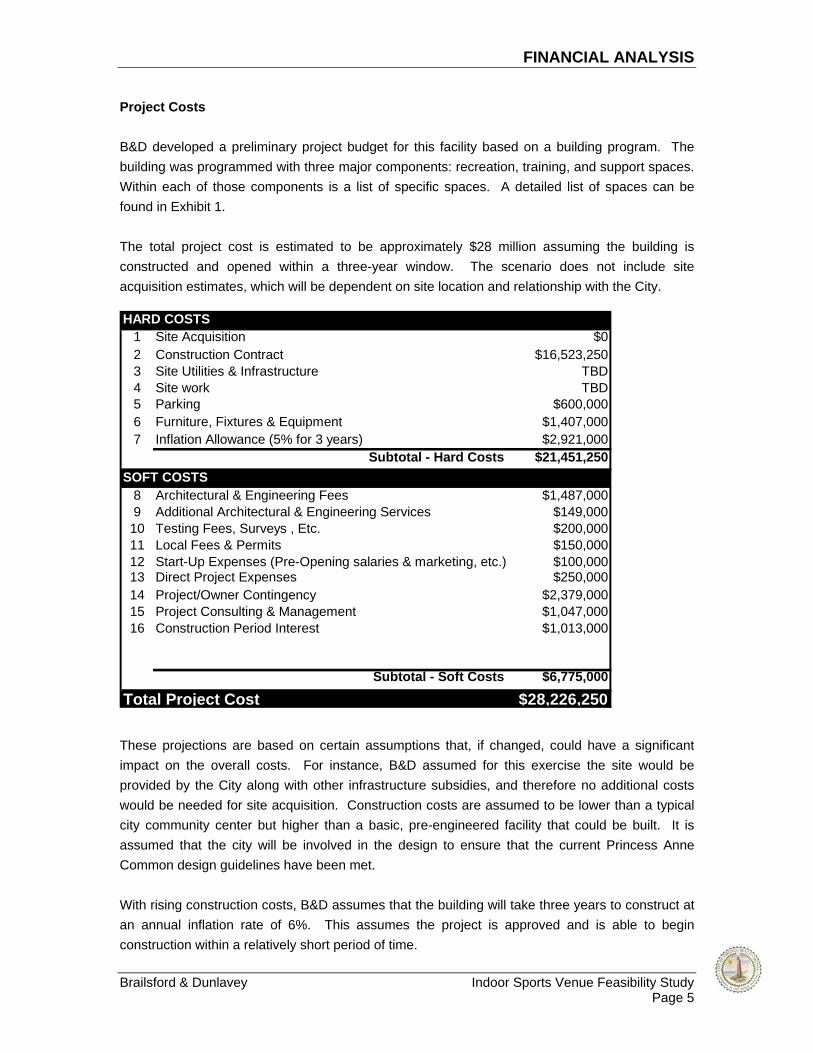
FINANCIAL ANALYSIS
Brailsford & Dunlavey Indoor Sports Venue Feasibility Study Page 5
Project Costs B&D developed a preliminary project budget for this facility based on a building program. The building was programmed with three major components: recreation, training, and support spaces. Within each of those components is a list of specific spaces. A detailed list of spaces can be found in Exhibit 1. The total project cost is estimated to be approximately $28 million assuming the building is constructed and opened within a three-year window. The scenario does not include site acquisition estimates, which will be dependent on site location and relationship with the City.
These projections are based on certain assumptions that, if changed, could have a significant impact on the overall costs. For instance, B&D assumed for this exercise the site would be provided by the City along with other infrastructure subsidies, and therefore no additional costs would be needed for site acquisition. Construction costs are assumed to be lower than a typical city community center but higher than a basic, pre-engineered facility that could be built. It is assumed that the city will be involved in the design to ensure that the current Princess Anne Common design guidelines have been met. With rising construction costs, B&D assumes that the building will take three years to construct at an annual inflation rate of 6%. This assumes the project is approved and is able to begin construction within a relatively short period of time.
HARD COSTS1 Site Acquisition $02 Construction Contract $16,523,2503 Site Utilities & Infrastructure TBD4 Site work TBD5 Parking $600,0006 Furniture, Fixtures & Equipment $1,407,0007 Inflation Allowance (5% for 3 years) $2,921,000
Subtotal - Hard Costs $21,451,250SOFT COSTS
8 Architectural & Engineering Fees $1,487,0009 Additional Architectural & Engineering Services $149,00010 Testing Fees, Surveys , Etc. $200,00011 Local Fees & Permits $150,00012 Start-Up Expenses (Pre-Opening salaries & marketing, etc.) $100,00013 Direct Project Expenses $250,00014 Project/Owner Contingency $2,379,00015 Project Consulting & Management $1,047,00016 Construction Period Interest $1,013,000
Subtotal - Soft Costs $6,775,000
Total Project Cost $28,226,250
FINANCIAL ANALYSIS
Brailsford & Dunlavey Virginia State University Convocation Center Page 6
Project Economics In B&D’s experience, sports facilities that don’t fit a certain profile (i.e. membership-based fitness centers, batting cages, golf courses, water parks, driving ranges, some multi-sheet ice rinks, and some professional stadia) rarely turn a profit. In this case the facility is able to cover operating expenses in the second year but is unable to cover debt service. Most of the successful sports venues include some type of public contribution, usually in the way of free land and/or infrastructure costs. In order to gauge interest from private developers, the City may want to develop a Request For Proposals (RFP). This process would allow the City to explore different options with respect to development alternatives and creative approaches that support the Princess Anne Commons mission. The RFP should be flexible enough to allow for maximum creativity among the responses but rigid enough to ensure that the Princess Anne Commons design guidelines and program needs addressed in this study are met. In B&D’s experience, the ability to sweeten the pot (i.e. include other facilities or developments in the mix) could help make the deal more attractive and viable to private groups. The ability to develop ancillary features around the site is important, as revenue from these projects helps support the development and operations of recreation facilities. Each response would need to include a pro forma and business plan to show how the building would be built and operated. In addition, the responses should focus on four key areas. • The overall long-term viability of the project with a focus on minimizing the risk to the City; • Assumptions regarding the pricing for facilities, services, and programs; • Operating cost assumptions ensuring that they include realistic projections for staffing,
utilities, insurance, etc.; and • Overall design and construction quality of the facility and how it fits within the overall context
of the Princess Anne Commons Master Plan.
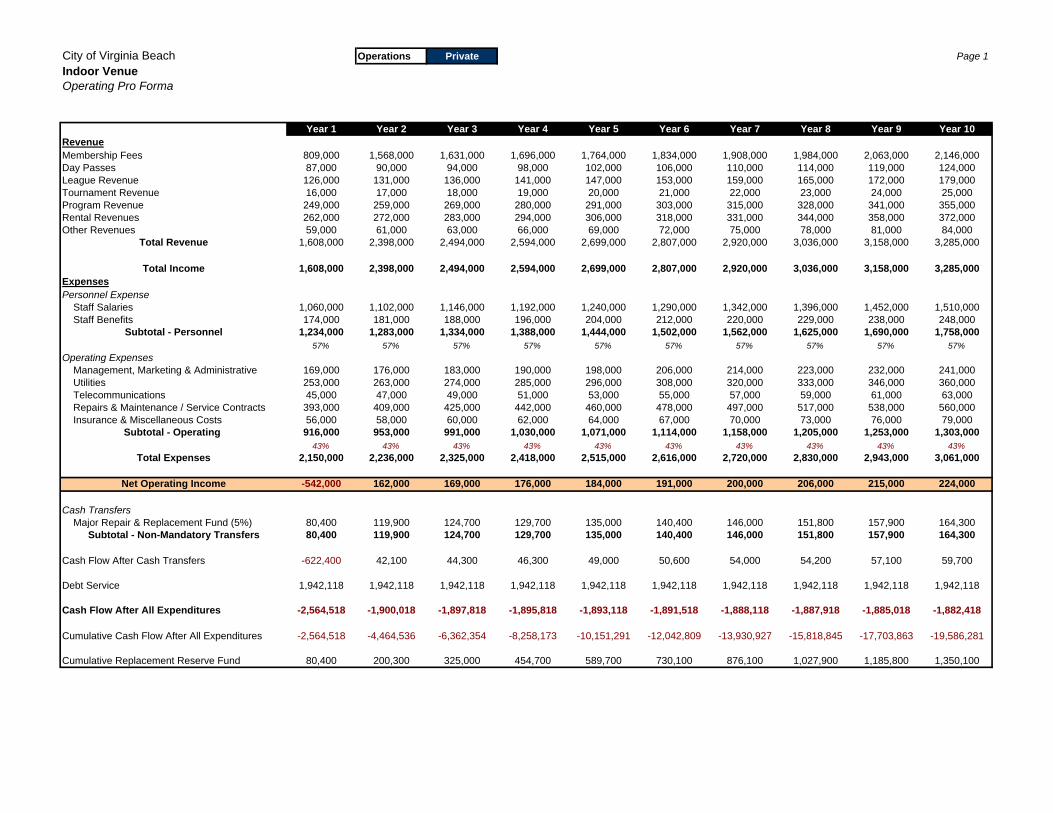
City of Virginia Beach Operations Private City Page 1Indoor Venue PrivateOperating Pro Forma
Year 1 Year 2 Year 3 Year 4 Year 5 Year 6 Year 7 Year 8 Year 9 Year 10RevenueMembership Fees 809,000 1,568,000 1,631,000 1,696,000 1,764,000 1,834,000 1,908,000 1,984,000 2,063,000 2,146,000Day Passes 87,000 90,000 94,000 98,000 102,000 106,000 110,000 114,000 119,000 124,000League Revenue 126,000 131,000 136,000 141,000 147,000 153,000 159,000 165,000 172,000 179,000Tournament Revenue 16,000 17,000 18,000 19,000 20,000 21,000 22,000 23,000 24,000 25,000Program Revenue 249,000 259,000 269,000 280,000 291,000 303,000 315,000 328,000 341,000 355,000Rental Revenues 262,000 272,000 283,000 294,000 306,000 318,000 331,000 344,000 358,000 372,000Other Revenues 59,000 61,000 63,000 66,000 69,000 72,000 75,000 78,000 81,000 84,000
Total Revenue 1,608,000 2,398,000 2,494,000 2,594,000 2,699,000 2,807,000 2,920,000 3,036,000 3,158,000 3,285,000
Total Income 1,608,000 2,398,000 2,494,000 2,594,000 2,699,000 2,807,000 2,920,000 3,036,000 3,158,000 3,285,000ExpensesPersonnel Expense Staff Salaries 1,060,000 1,102,000 1,146,000 1,192,000 1,240,000 1,290,000 1,342,000 1,396,000 1,452,000 1,510,000 Staff Benefits 174,000 181,000 188,000 196,000 204,000 212,000 220,000 229,000 238,000 248,000
Subtotal - Personnel 1,234,000 1,283,000 1,334,000 1,388,000 1,444,000 1,502,000 1,562,000 1,625,000 1,690,000 1,758,00057% 57% 57% 57% 57% 57% 57% 57% 57% 57%
Operating Expenses Management, Marketing & Administrative 169,000 176,000 183,000 190,000 198,000 206,000 214,000 223,000 232,000 241,000 Utilities 253,000 263,000 274,000 285,000 296,000 308,000 320,000 333,000 346,000 360,000 Telecommunications 45,000 47,000 49,000 51,000 53,000 55,000 57,000 59,000 61,000 63,000 Repairs & Maintenance / Service Contracts 393,000 409,000 425,000 442,000 460,000 478,000 497,000 517,000 538,000 560,000 Insurance & Miscellaneous Costs 56,000 58,000 60,000 62,000 64,000 67,000 70,000 73,000 76,000 79,000
Subtotal - Operating 916,000 953,000 991,000 1,030,000 1,071,000 1,114,000 1,158,000 1,205,000 1,253,000 1,303,00043% 43% 43% 43% 43% 43% 43% 43% 43% 43%
Total Expenses 2,150,000 2,236,000 2,325,000 2,418,000 2,515,000 2,616,000 2,720,000 2,830,000 2,943,000 3,061,000
Net Operating Income -542,000 162,000 169,000 176,000 184,000 191,000 200,000 206,000 215,000 224,000
Cash Transfers Major Repair & Replacement Fund (5%) 80,400 119,900 124,700 129,700 135,000 140,400 146,000 151,800 157,900 164,300
Subtotal - Non-Mandatory Transfers 80,400 119,900 124,700 129,700 135,000 140,400 146,000 151,800 157,900 164,300
Cash Flow After Cash Transfers -622,400 42,100 44,300 46,300 49,000 50,600 54,000 54,200 57,100 59,700
Debt Service 1,942,118 1,942,118 1,942,118 1,942,118 1,942,118 1,942,118 1,942,118 1,942,118 1,942,118 1,942,118
Cash Flow After All Expenditures -2,564,518 -1,900,018 -1,897,818 -1,895,818 -1,893,118 -1,891,518 -1,888,118 -1,887,918 -1,885,018 -1,882,418
Cumulative Cash Flow After All Expenditures -2,564,518 -4,464,536 -6,362,354 -8,258,173 -10,151,291 -12,042,809 -13,930,927 -15,818,845 -17,703,863 -19,586,281
Cumulative Replacement Reserve Fund 80,400 200,300 325,000 454,700 589,700 730,100 876,100 1,027,900 1,185,800 1,350,100
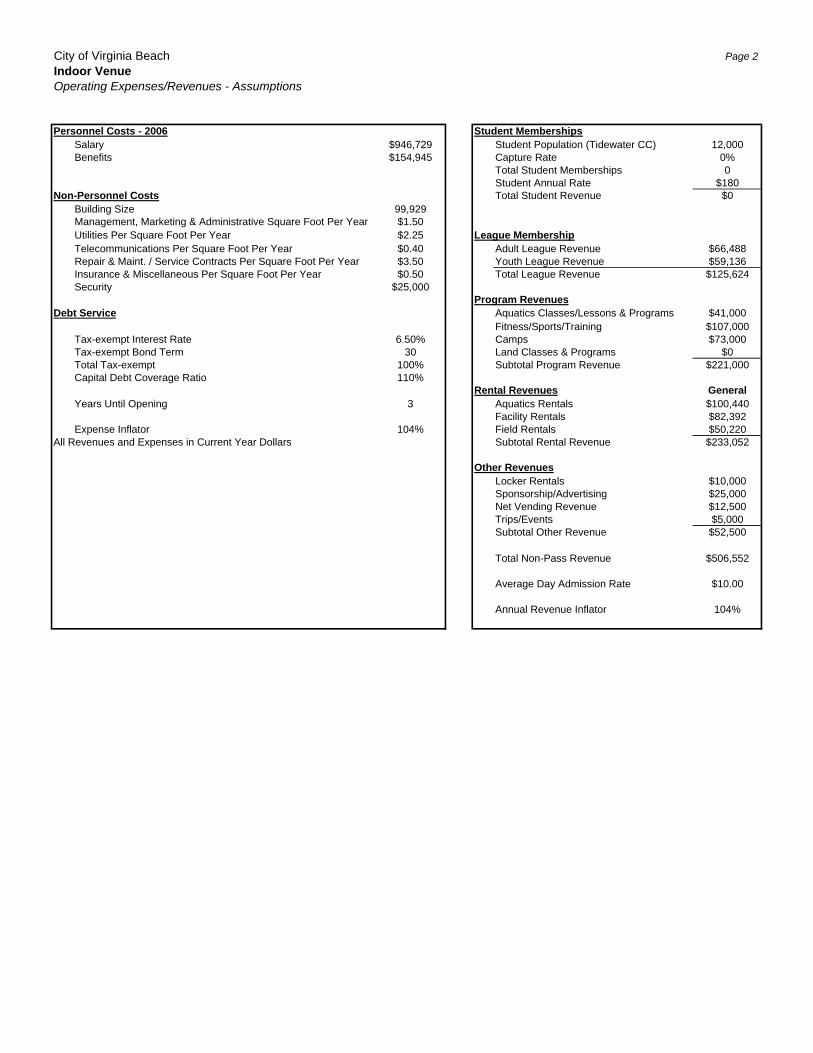
City of Virginia Beach Page 2Indoor VenueOperating Expenses/Revenues - Assumptions
Personnel Costs - 2006 Student MembershipsSalary $946,729 Student Population (Tidewater CC) 12,000Benefits $154,945 Capture Rate 0%
Total Student Memberships 0Student Annual Rate $180
Non-Personnel Costs Total Student Revenue $0Building Size 99,929Management, Marketing & Administrative Square Foot Per Year $1.50Utilities Per Square Foot Per Year $2.25 League MembershipTelecommunications Per Square Foot Per Year $0.40 Adult League Revenue $66,488Repair & Maint. / Service Contracts Per Square Foot Per Year $3.50 Youth League Revenue $59,136Insurance & Miscellaneous Per Square Foot Per Year $0.50 Total League Revenue $125,624Security $25,000
Program RevenuesDebt Service Aquatics Classes/Lessons & Programs $41,000
Fitness/Sports/Training $107,000Tax-exempt Interest Rate 6.50% Camps $73,000Tax-exempt Bond Term 30 Land Classes & Programs $0Total Tax-exempt 100% Subtotal Program Revenue $221,000Capital Debt Coverage Ratio 110%
Rental Revenues GeneralYears Until Opening 3 Aquatics Rentals $100,440
Facility Rentals $82,392Expense Inflator 104% Field Rentals $50,220
All Revenues and Expenses in Current Year Dollars Subtotal Rental Revenue $233,052
Other RevenuesLocker Rentals $10,000Sponsorship/Advertising $25,000Net Vending Revenue $12,500Trips/Events $5,000Subtotal Other Revenue $52,500
Total Non-Pass Revenue $506,552
Average Day Admission Rate $10.00
Annual Revenue Inflator 104%
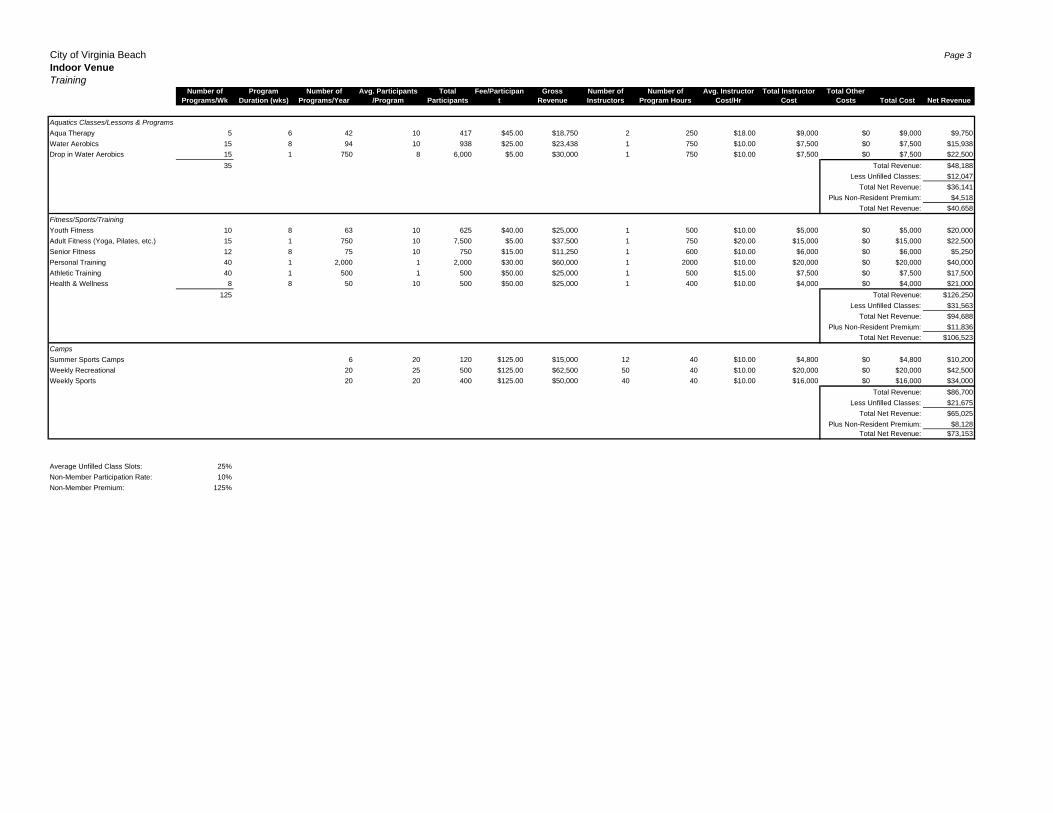
City of Virginia Beach Page 3Indoor VenueTraining
Number of Programs/Wk
Program Duration (wks)
Number of Programs/Year
Avg. Participants /Program
Total Participants
Fee/Participant
Gross Revenue
Number of Instructors
Number of Program Hours
Avg. Instructor Cost/Hr
Total Instructor Cost
Total Other Costs Total Cost Net Revenue
Aquatics Classes/Lessons & ProgramsAqua Therapy 5 6 42 10 417 $45.00 $18,750 2 250 $18.00 $9,000 $0 $9,000 $9,750Water Aerobics 15 8 94 10 938 $25.00 $23,438 1 750 $10.00 $7,500 $0 $7,500 $15,938Drop in Water Aerobics 15 1 750 8 6,000 $5.00 $30,000 1 750 $10.00 $7,500 $0 $7,500 $22,500
35 Total Revenue: $48,188Less Unfilled Classes: $12,047
Total Net Revenue: $36,141Plus Non-Resident Premium: $4,518
Total Net Revenue: $40,658Fitness/Sports/TrainingYouth Fitness 10 8 63 10 625 $40.00 $25,000 1 500 $10.00 $5,000 $0 $5,000 $20,000Adult Fitness (Yoga, Pilates, etc.) 15 1 750 10 7,500 $5.00 $37,500 1 750 $20.00 $15,000 $0 $15,000 $22,500Senior Fitness 12 8 75 10 750 $15.00 $11,250 1 600 $10.00 $6,000 $0 $6,000 $5,250Personal Training 40 1 2,000 1 2,000 $30.00 $60,000 1 2000 $10.00 $20,000 $0 $20,000 $40,000Athletic Training 40 1 500 1 500 $50.00 $25,000 1 500 $15.00 $7,500 $0 $7,500 $17,500Health & Wellness 8 8 50 10 500 $50.00 $25,000 1 400 $10.00 $4,000 $0 $4,000 $21,000
125 Total Revenue: $126,250Less Unfilled Classes: $31,563
Total Net Revenue: $94,688Plus Non-Resident Premium: $11,836
Total Net Revenue: $106,523CampsSummer Sports Camps 6 20 120 $125.00 $15,000 12 40 $10.00 $4,800 $0 $4,800 $10,200Weekly Recreational 20 25 500 $125.00 $62,500 50 40 $10.00 $20,000 $0 $20,000 $42,500Weekly Sports 20 20 400 $125.00 $50,000 40 40 $10.00 $16,000 $0 $16,000 $34,000
Total Revenue: $86,700Less Unfilled Classes: $21,675
Total Net Revenue: $65,025Plus Non-Resident Premium: $8,128
Total Net Revenue: $73,153
Average Unfilled Class Slots: 25%Non-Member Participation Rate: 10%Non-Member Premium: 125%
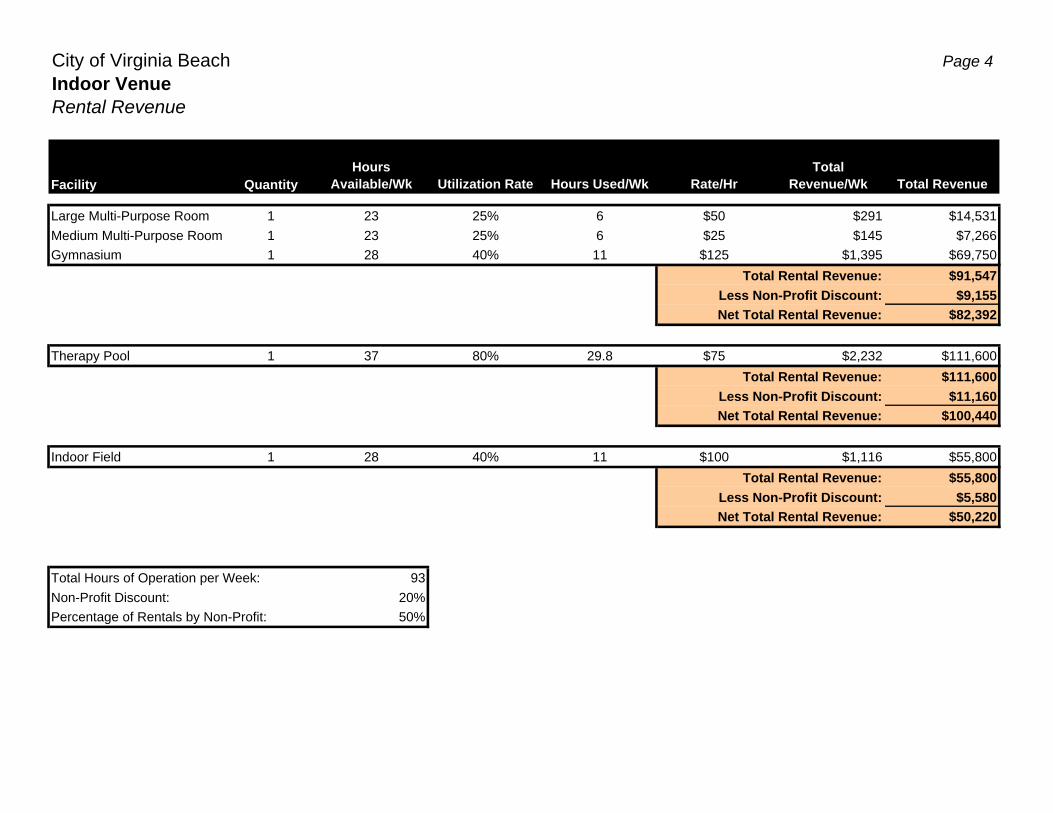
City of Virginia Beach Page 4Indoor VenueRental Revenue
Facility QuantityHours
Available/Wk Utilization Rate Hours Used/Wk Rate/HrTotal
Revenue/Wk Total Revenue
Large Multi-Purpose Room 1 23 25% 6 $50 $291 $14,531Medium Multi-Purpose Room 1 23 25% 6 $25 $145 $7,266Gymnasium 1 28 40% 11 $125 $1,395 $69,750
Total Rental Revenue: $91,547Less Non-Profit Discount: $9,155Net Total Rental Revenue: $82,392
Therapy Pool 1 37 80% 29.8 $75 $2,232 $111,600Total Rental Revenue: $111,600
Less Non-Profit Discount: $11,160Net Total Rental Revenue: $100,440
Indoor Field 1 28 40% 11 $100 $1,116 $55,800Total Rental Revenue: $55,800
Less Non-Profit Discount: $5,580Net Total Rental Revenue: $50,220
Total Hours of Operation per Week: 93Non-Profit Discount: 20%Percentage of Rentals by Non-Profit: 50%
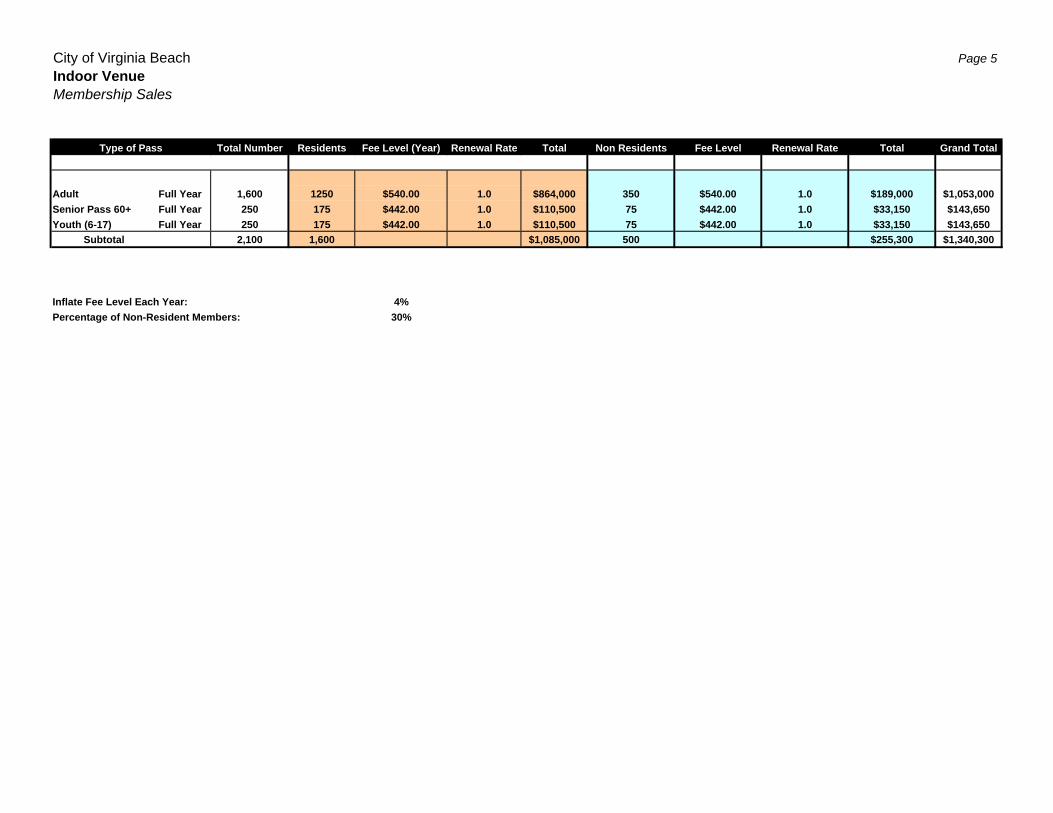
City of Virginia Beach Page 5Indoor VenueMembership Sales
Type of Pass Total Number Residents Fee Level (Year) Renewal Rate Total Non Residents Fee Level Renewal Rate Total Grand Total
Adult Full Year 1,600 1250 $540.00 1.0 $864,000 350 $540.00 1.0 $189,000 $1,053,000Senior Pass 60+ Full Year 250 175 $442.00 1.0 $110,500 75 $442.00 1.0 $33,150 $143,650Youth (6-17) Full Year 250 175 $442.00 1.0 $110,500 75 $442.00 1.0 $33,150 $143,650
Subtotal 2,100 1,600 $1,085,000 500 $255,300 $1,340,300
Inflate Fee Level Each Year: 4%Percentage of Non-Resident Members: 30%
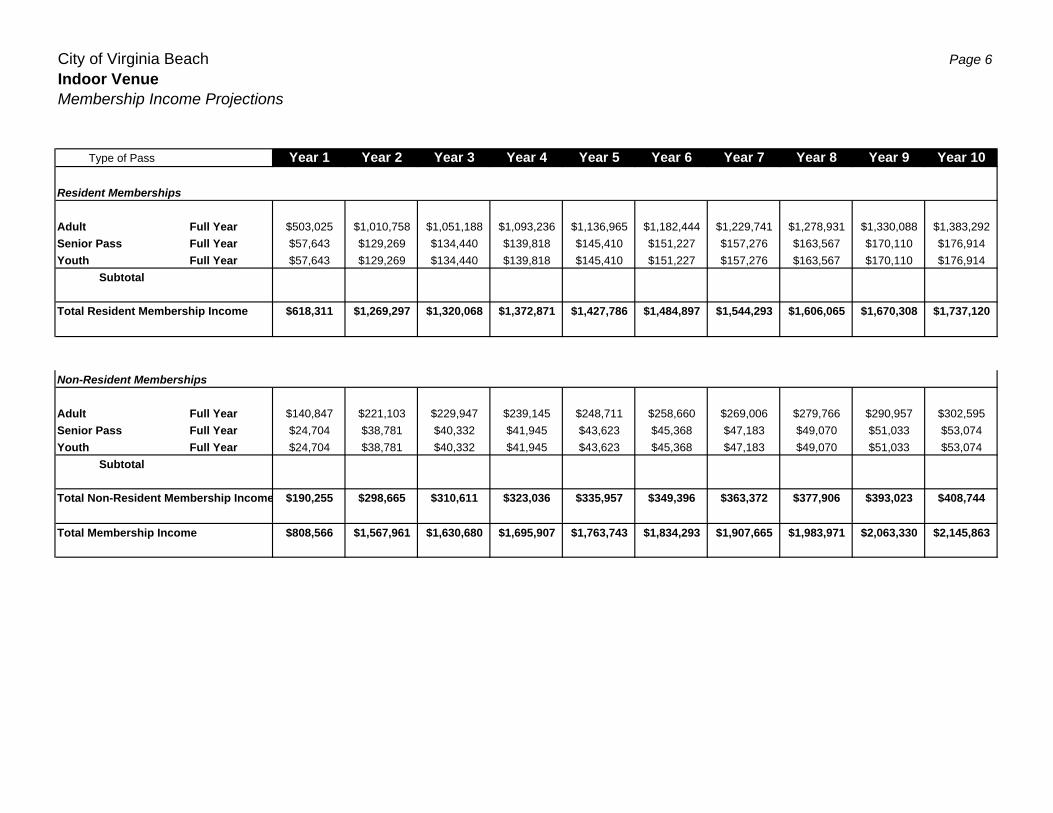
City of Virginia Beach Page 6Indoor VenueMembership Income Projections
Type of Pass Year 1 Year 2 Year 3 Year 4 Year 5 Year 6 Year 7 Year 8 Year 9 Year 10
Resident Memberships
Adult Full Year $503,025 $1,010,758 $1,051,188 $1,093,236 $1,136,965 $1,182,444 $1,229,741 $1,278,931 $1,330,088 $1,383,292Senior Pass Full Year $57,643 $129,269 $134,440 $139,818 $145,410 $151,227 $157,276 $163,567 $170,110 $176,914Youth Full Year $57,643 $129,269 $134,440 $139,818 $145,410 $151,227 $157,276 $163,567 $170,110 $176,914
Subtotal
Total Resident Membership Income $618,311 $1,269,297 $1,320,068 $1,372,871 $1,427,786 $1,484,897 $1,544,293 $1,606,065 $1,670,308 $1,737,120
Non-Resident Memberships
Adult Full Year $140,847 $221,103 $229,947 $239,145 $248,711 $258,660 $269,006 $279,766 $290,957 $302,595Senior Pass Full Year $24,704 $38,781 $40,332 $41,945 $43,623 $45,368 $47,183 $49,070 $51,033 $53,074Youth Full Year $24,704 $38,781 $40,332 $41,945 $43,623 $45,368 $47,183 $49,070 $51,033 $53,074
Subtotal
Total Non-Resident Membership Income $190,255 $298,665 $310,611 $323,036 $335,957 $349,396 $363,372 $377,906 $393,023 $408,744
Total Membership Income $808,566 $1,567,961 $1,630,680 $1,695,907 $1,763,743 $1,834,293 $1,907,665 $1,983,971 $2,063,330 $2,145,863

City of Virginia Beach Page 7Indoor VenuePersonnel Assumptions
Position Type FTE Hours Wage Rate Salary Benefits TotalGeneral Manager FT 1.00 $70,000 $70,000 $18,900 $88,900Assistant Manager - Building Supervisor FT 2.33 $45,000 $104,625 $28,249 $132,874Assistant Manager - Recreation/Programs FT 1.00 $42,000 $42,000 $11,340 $53,340Assistant Manager - Scheduling/Camps FT 1.00 $42,000 $42,000 $11,340 $53,340Assistant Manager - Business Development/Finance FT 1.00 $42,000 $42,000 $11,340 $53,340Maintenance Supervisor FT 2.33 $50,000 $116,250 $31,388 $147,638
Front Desk Attendant PT 9,672 $10.25 $99,138 $7,931 $107,069Facility Coordinators PT 10,920 $10.25 $111,930 $8,954 $120,884Fitness Attendant PT 12,012 $10.25 $123,123 $9,850 $132,973Lifeguards - Therapy Pool PT 12,012 $10.25 $123,123 $9,850 $132,973Janitorial PT 7,254 $10.00 $72,540 $5,803 $78,343
8.65 51,870 $946,729 $154,945 $1,101,674
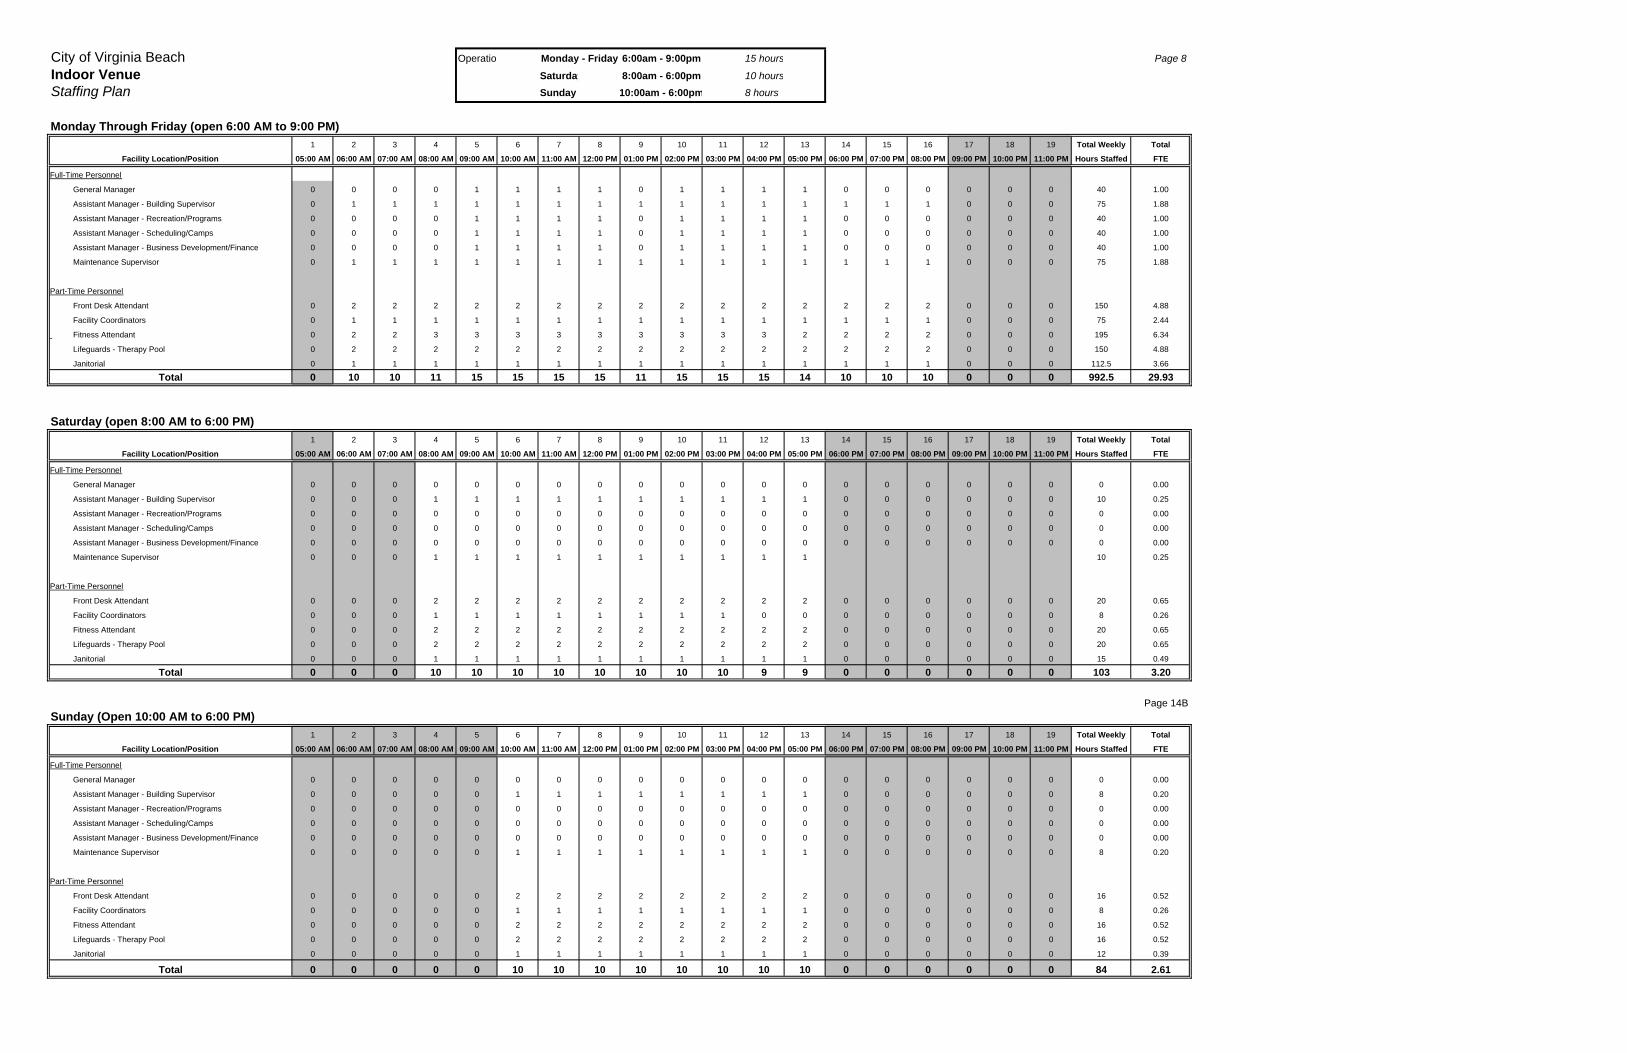
City of Virginia Beach Operatio 15 hours Page 8
Indoor Venue Saturday 10 hours
Staffing Plan Sunday 8 hours
Monday Through Friday (open 6:00 AM to 9:00 PM)1 2 3 4 5 6 7 8 9 10 11 12 13 14 15 16 17 18 19 Total Weekly Total
Facility Location/Position 05:00 AM 06:00 AM 07:00 AM 08:00 AM 09:00 AM 10:00 AM 11:00 AM 12:00 PM 01:00 PM 02:00 PM 03:00 PM 04:00 PM 05:00 PM 06:00 PM 07:00 PM 08:00 PM 09:00 PM 10:00 PM 11:00 PM Hours Staffed FTE
Full-Time Personnel
General Manager 0 0 0 0 1 1 1 1 0 1 1 1 1 0 0 0 0 0 0 40 1.00
Assistant Manager - Building Supervisor 0 1 1 1 1 1 1 1 1 1 1 1 1 1 1 1 0 0 0 75 1.88
Assistant Manager - Recreation/Programs 0 0 0 0 1 1 1 1 0 1 1 1 1 0 0 0 0 0 0 40 1.00
Assistant Manager - Scheduling/Camps 0 0 0 0 1 1 1 1 0 1 1 1 1 0 0 0 0 0 0 40 1.00
Assistant Manager - Business Development/Finance 0 0 0 0 1 1 1 1 0 1 1 1 1 0 0 0 0 0 0 40 1.00
Maintenance Supervisor 0 1 1 1 1 1 1 1 1 1 1 1 1 1 1 1 0 0 0 75 1.88
Front Desk Attendant 0 2 2 2 2 2 2 2 2 2 2 2 2 2 2 2 0 0 0 150 4.88
Facility Coordinators 0 1 1 1 1 1 1 1 1 1 1 1 1 1 1 1 0 0 0 75 2.44
Fitness Attendant 0 2 2 3 3 3 3 3 3 3 3 3 2 2 2 2 0 0 0 195 6.34
Lifeguards - Therapy Pool 0 2 2 2 2 2 2 2 2 2 2 2 2 2 2 2 0 0 0 150 4.88
Janitorial 0 1 1 1 1 1 1 1 1 1 1 1 1 1 1 1 0 0 0 112.5 3.66
Total 0 10 10 11 15 15 15 15 11 15 15 15 14 10 10 10 0 0 0 992.5 29.93
Saturday (open 8:00 AM to 6:00 PM)1 2 3 4 5 6 7 8 9 10 11 12 13 14 15 16 17 18 19 Total Weekly Total
Facility Location/Position 05:00 AM 06:00 AM 07:00 AM 08:00 AM 09:00 AM 10:00 AM 11:00 AM 12:00 PM 01:00 PM 02:00 PM 03:00 PM 04:00 PM 05:00 PM 06:00 PM 07:00 PM 08:00 PM 09:00 PM 10:00 PM 11:00 PM Hours Staffed FTE
Full-Time Personnel
General Manager 0 0 0 0 0 0 0 0 0 0 0 0 0 0 0 0 0 0 0 0 0.00
Assistant Manager - Building Supervisor 0 0 0 1 1 1 1 1 1 1 1 1 1 0 0 0 0 0 0 10 0.25
Assistant Manager - Recreation/Programs 0 0 0 0 0 0 0 0 0 0 0 0 0 0 0 0 0 0 0 0 0.00
Assistant Manager - Scheduling/Camps 0 0 0 0 0 0 0 0 0 0 0 0 0 0 0 0 0 0 0 0 0.00
Assistant Manager - Business Development/Finance 0 0 0 0 0 0 0 0 0 0 0 0 0 0 0 0 0 0 0 0 0.00
Maintenance Supervisor 0 0 0 1 1 1 1 1 1 1 1 1 1 10 0.25
Front Desk Attendant 0 0 0 2 2 2 2 2 2 2 2 2 2 0 0 0 0 0 0 20 0.65
Facility Coordinators 0 0 0 1 1 1 1 1 1 1 1 0 0 0 0 0 0 0 0 8 0.26
Fitness Attendant 0 0 0 2 2 2 2 2 2 2 2 2 2 0 0 0 0 0 0 20 0.65
Lifeguards - Therapy Pool 0 0 0 2 2 2 2 2 2 2 2 2 2 0 0 0 0 0 0 20 0.65
Janitorial 0 0 0 1 1 1 1 1 1 1 1 1 1 0 0 0 0 0 0 15 0.49
Total 0 0 0 10 10 10 10 10 10 10 10 9 9 0 0 0 0 0 0 103 3.20
Page 14BSunday (Open 10:00 AM to 6:00 PM)
1 2 3 4 5 6 7 8 9 10 11 12 13 14 15 16 17 18 19 Total Weekly Total
Facility Location/Position 05:00 AM 06:00 AM 07:00 AM 08:00 AM 09:00 AM 10:00 AM 11:00 AM 12:00 PM 01:00 PM 02:00 PM 03:00 PM 04:00 PM 05:00 PM 06:00 PM 07:00 PM 08:00 PM 09:00 PM 10:00 PM 11:00 PM Hours Staffed FTE
Full-Time Personnel
General Manager 0 0 0 0 0 0 0 0 0 0 0 0 0 0 0 0 0 0 0 0 0.00
Assistant Manager - Building Supervisor 0 0 0 0 0 1 1 1 1 1 1 1 1 0 0 0 0 0 0 8 0.20
Assistant Manager - Recreation/Programs 0 0 0 0 0 0 0 0 0 0 0 0 0 0 0 0 0 0 0 0 0.00
Assistant Manager - Scheduling/Camps 0 0 0 0 0 0 0 0 0 0 0 0 0 0 0 0 0 0 0 0 0.00
Assistant Manager - Business Development/Finance 0 0 0 0 0 0 0 0 0 0 0 0 0 0 0 0 0 0 0 0 0.00
Maintenance Supervisor 0 0 0 0 0 1 1 1 1 1 1 1 1 0 0 0 0 0 0 8 0.20
Front Desk Attendant 0 0 0 0 0 2 2 2 2 2 2 2 2 0 0 0 0 0 0 16 0.52
Facility Coordinators 0 0 0 0 0 1 1 1 1 1 1 1 1 0 0 0 0 0 0 8 0.26
Fitness Attendant 0 0 0 0 0 2 2 2 2 2 2 2 2 0 0 0 0 0 0 16 0.52
Lifeguards - Therapy Pool 0 0 0 0 0 2 2 2 2 2 2 2 2 0 0 0 0 0 0 16 0.52
Janitorial 0 0 0 0 0 1 1 1 1 1 1 1 1 0 0 0 0 0 0 12 0.39
Total 0 0 0 0 0 10 10 10 10 10 10 10 10 0 0 0 0 0 0 84 2.61
Part-Time Personnel
Part-Time Personnel
Part-Time Personnel
6:00am - 9:00pm8:00am - 6:00pm
10:00am - 6:00pm
Monday - Friday
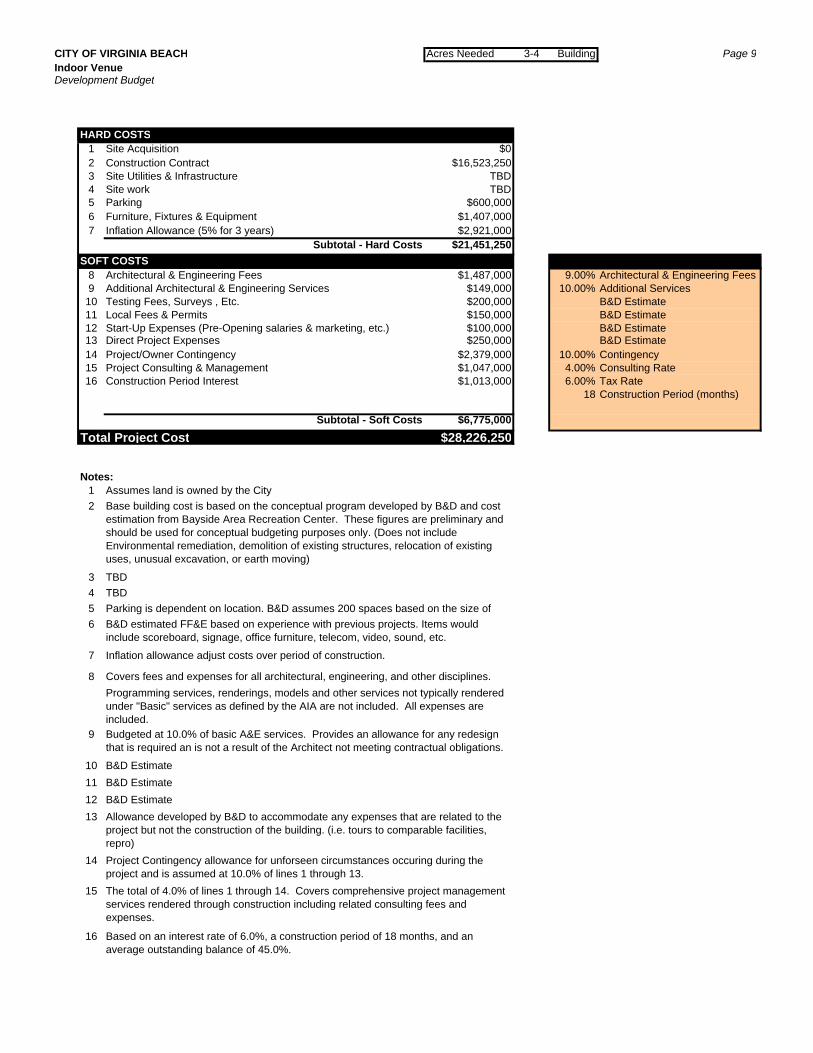
CITY OF VIRGINIA BEACH Acres Needed 3-4 Building Page 9Indoor VenueDevelopment Budget
HARD COSTS1 Site Acquisition $02 Construction Contract $16,523,2503 Site Utilities & Infrastructure TBD4 Site work TBD5 Parking $600,0006 Furniture, Fixtures & Equipment $1,407,0007 Inflation Allowance (5% for 3 years) $2,921,000
Subtotal - Hard Costs $21,451,250SOFT COSTS 76%
8 Architectural & Engineering Fees $1,487,000 9.00% Architectural & Engineering Fees9 Additional Architectural & Engineering Services $149,000 10.00% Additional Services
10 Testing Fees, Surveys , Etc. $200,000 B&D Estimate11 Local Fees & Permits $150,000 B&D Estimate12 Start-Up Expenses (Pre-Opening salaries & marketing, etc.) $100,000 B&D Estimate13 Direct Project Expenses $250,000 B&D Estimate14 Project/Owner Contingency $2,379,000 10.00% Contingency15 Project Consulting & Management $1,047,000 4.00% Consulting Rate16 Construction Period Interest $1,013,000 6.00% Tax Rate
18 Construction Period (months)
Subtotal - Soft Costs $6,775,000Total Project Cost $28,226,250
24%Notes:
12
3456
7
8
9
10111213
14
15
16
Project Contingency allowance for unforseen circumstances occuring during the project and is assumed at 10.0% of lines 1 through 13.The total of 4.0% of lines 1 through 14. Covers comprehensive project management services rendered through construction including related consulting fees and expenses.
Based on an interest rate of 6.0%, a construction period of 18 months, and an average outstanding balance of 45.0%.
B&D EstimateB&D EstimateB&D EstimateAllowance developed by B&D to accommodate any expenses that are related to the project but not the construction of the building. (i.e. tours to comparable facilities, repro)
Inflation allowance adjust costs over period of construction.
Covers fees and expenses for all architectural, engineering, and other disciplines.Programming services, renderings, models and other services not typically rendered under "Basic" services as defined by the AIA are not included. All expenses are included.Budgeted at 10.0% of basic A&E services. Provides an allowance for any redesign that is required an is not a result of the Architect not meeting contractual obligations.
TBDParking is dependent on location. B&D assumes 200 spaces based on the size of B&D estimated FF&E based on experience with previous projects. Items would include scoreboard, signage, office furniture, telecom, video, sound, etc.
Assumes land is owned by the CityBase building cost is based on the conceptual program developed by B&D and cost estimation from Bayside Area Recreation Center. These figures are preliminary and should be used for conceptual budgeting purposes only. (Does not include Environmental remediation, demolition of existing structures, relocation of existing uses, unusual excavation, or earth moving)
TBD
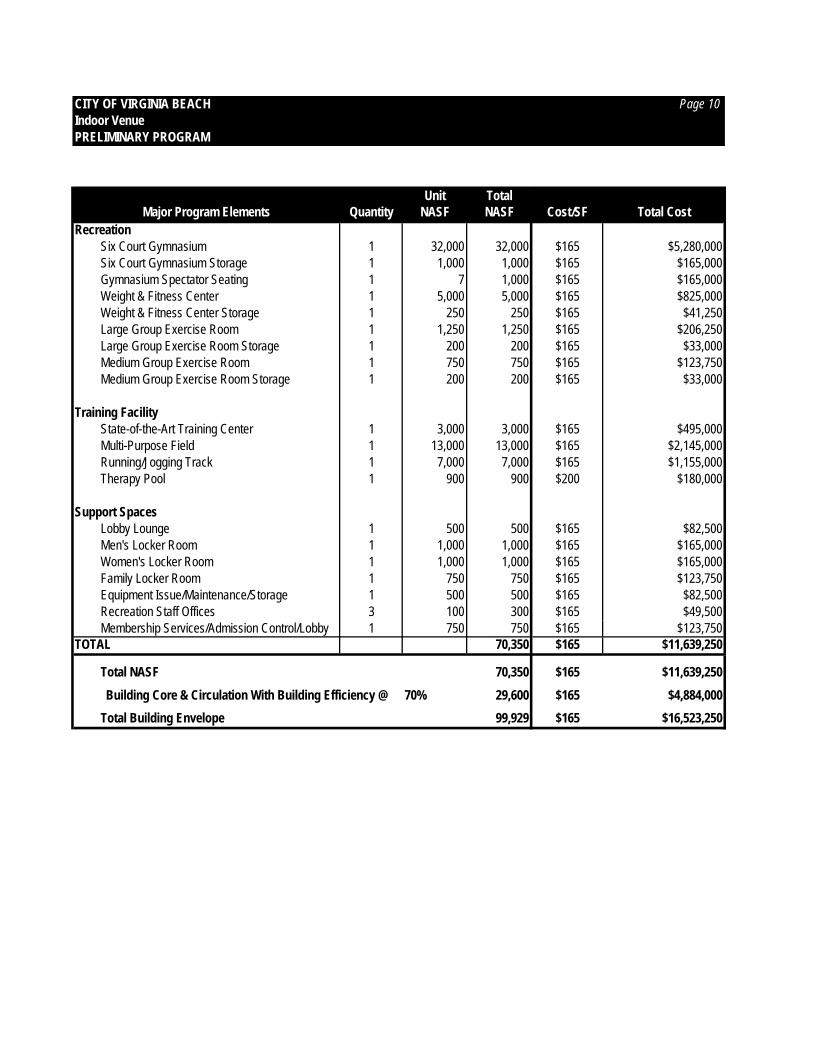
CITY OF VIRGINIA BEACH Page 10Indoor Venue
PRELIMINARY TOTAL PROJECT COST = $21,480,225
Unit TotalMajor Program Elements Quantity NASF NASF Cost/SF Total Cost
RecreationSix Court Gymnasium 1 32,000 32,000 $165 $5,280,000Six Court Gymnasium Storage 1 1,000 1,000 $165 $165,000Gymnasium Spectator Seating 1 7 1,000 $165 $165,000Weight & Fitness Center 1 5,000 5,000 $165 $825,000Weight & Fitness Center Storage 1 250 250 $165 $41,250Large Group Exercise Room 1 1,250 1,250 $165 $206,250Large Group Exercise Room Storage 1 200 200 $165 $33,000Medium Group Exercise Room 1 750 750 $165 $123,750Medium Group Exercise Room Storage 1 200 200 $165 $33,000
Training FacilityState-of-the-Art Training Center 1 3,000 3,000 $165 $495,000Multi-Purpose Field 1 13,000 13,000 $165 $2,145,000Running/Jogging Track 1 7,000 7,000 $165 $1,155,000Therapy Pool 1 900 900 $200 $180,000
Support SpacesLobby Lounge 1 500 500 $165 $82,500Men's Locker Room 1 1,000 1,000 $165 $165,000Women's Locker Room 1 1,000 1,000 $165 $165,000Family Locker Room 1 750 750 $165 $123,750Equipment Issue/Maintenance/Storage 1 500 500 $165 $82,500Recreation Staff Offices 3 100 300 $165 $49,500Membership Services/Admission Control/Lobby 1 750 750 $165 $123,750
TOTAL 70,350 $165 $11,639,250
Total NASF 70,350 $165 $11,639,250Building Core & Circulation With Building Efficiency @ 70% 29,600 $165 $4,884,000
Total Building Envelope 99,929 $165 $16,523,250
PRELIMINARY PROGRAM