Embed Size (px)
Citation preview
Induction Cooktop Performance:How Pan Sizes Impact Energy Input
FSTC Report 5011.99.68
Food Service Technology Center Manager: Don FisherFinal Report, March 1999
Prepared by:
Charles Bohlig
Contributors:
David Zabrowski
Prepared for:
Pacific Gas and Electric CompanyConsumer Energy Management
123 Mission Street, P.O. Box 770000San Francisco, California 94177
1999 by Pacific Gas and Electric Company. All rights reserved.
The information in this report is based on data generated at PG&E’s Food Service Technology Center.
Legal Notice
This report was prepared by Pacific Gas and Electric Company for exclusive use by its employees and agents. Neither Pacific Gas and ElectricCompany nor any of its employees:(1) makes any written or oral warranty, expressed or implied, including, but not limited to those concerning merchantability or fitness for
a particular purpose;(2) assumes any legal liability or responsibility for the accuracy, completeness, or usefulness of any information, apparatus, product,
process, method, or policy contained herein; or(3) represents that its use would not infringe any privately owned rights, including, but not limited to, patents, trademarks, or copyrights.
Acknowledgments
PG&E’s Food Service Technology Center is supported by the NationalAdvisory Group, which includes
Electric Power Research Institute (EPRI)
Gas Research Institute (GRI)
National Restaurant Association
California Restaurant Association (CRA)
International Facility Management Association (IFMA)
California Energy Commission (CEC)
Underwriters Laboratories (UL)
Gas Appliance Manufacturers Association (GAMA)
California Café Restaurant Corp.
Safeway, Inc.
Round Table Pizza
McDonald’s Corp.
Darden Restaurants, Inc.
The Southern California Gas Company
University of California at Riverside
University of California at Berkley
Specific appreciation is extended to the various manufacturers whosupplied the Food Service Technology Center with induction cooktopsfor controlled testing in the appliance laboratory.
Policy on the Use of Food Service TechnologyCenter Test Results and Other Related Information
• The Food Service Technology Center (FSTC) is strongly committedto testing food service equipment using the best available scientifictechniques and instrumentation.
• The FSTC is neutral as to fuel and energy source. It does not, inany way, encourage or promote the use of any fuel or energy sourcenor does it endorse any of the equipment tested at the FSTC.
• FSTC test results are made available to the general public throughboth PG&E technical research reports and publications and areprotected under U.S. and international copyright laws.
• In the event that FSTC data are to be reported, quoted, or referred toin any way in publications, papers, brochures, advertising, or anyother publicly available documents, the rules of copyright must bestrictly followed, including written permission from PG&E in advanceand proper attribution to PG&E and the Food Service TechnologyCenter. In any such publication, sufficient text must be excerpted orquoted so as to give full and fair representation of findings as re-ported in the original documentation from FSTC.
Contents
5011.99.68 i
PageExecutive Summary................................................................................ iii1 Introduction ..................................................................................... 1-1
Background ................................................................................. 1-1Objectives ................................................................................... 1-2Appliance Description ................................................................. 1-2Pan / Descriptions ....................................................................... 1-3
2 Methods ........................................................................................... 2-1Setup and Instrumentation ......................................................... 2-1Sensitivity Pan ............................................................................ 2-1Pan Testing ................................................................................ 2-3
3 Results ............................................................................................. 3-1Introduction ................................................................................. 3-1Results ........................................................................................ 3-1
4 Conclusions ..................................................................................... 4-1Appendix A: GlossaryAppendix B: Pan Sensitivity Testing Data
List of Figures and Tables
5011.99.68 ii
Page1-1 Pans tested - A through H ........................................................... 1-61-2 Pans tested - I through N ............................................................ 1-72-1 Preheat test - Unit # 2 ................................................................. 2-22-2 Preheat test - Unit # 3 ................................................................. 2-22-3 Preheat test - Unit # 1 ................................................................. 2-33-1 Induction cooktop # 1 ................................................................. 3-23-2 Induction cooktop # 2 ................................................................. 3-33-3 Induction cooktop # 3 ................................................................. 3-43-4 Percent of rated input ................................................................. 3-6
PageES-1 Summary of Induction Range Tops Performance ....................... iv1-1 Appliance 1 Specifications .......................................................... 1-21-2 Appliance 2 Specifications .......................................................... 1-31-3 Appliance 3 Specifications .......................................................... 1-31-4 Pan Specifications ....................................................................... 1-5B-1 Induction Range Top #1 Test Data.............................................. B-1B-2 Induction Range Top #2 Test Data.............................................. B-2B-3 Induction Range Top #3 Test Data.............................................. B-3
Figures
Tables
Executive Summary
5011.99.68 iii
Induction technology cooktops have come a long way from when they firstappeared on the markets in the 1940’s. Today’s induction technology hasevolved into a viable option for operators with enhanced cooking features,safety functions and wider availability. However there has always been onedraw back to this technology, which is the long held belief that inductiontechnology needs to have high quality, expensive pans to function properly.
With this assumption, the Food Service Technology Center (FSTC) decidedto “test” this belief and see if there were actually differences between induc-tion technologies and how individual induction units reacted (power draw) tothe pan size and type.
To test the notion, the FSTC engineers tested induction cooktops from 3 dif-ferent manufacturers with 14 very different pans. Induction cooktop per-formance was characterized by determining how much of the rated energyinput was utilized (drawn) with a given pan. During the testing each unitwas set to its maximum setting.
The induction cooktop performance test was conducted by placing each panon the induction unit and measuring the appliance power draw. Each induc-tion cooktop was tested a minimum of three times with each pan to ensureprecise results.
Executive Summary
5011.99.68 iv
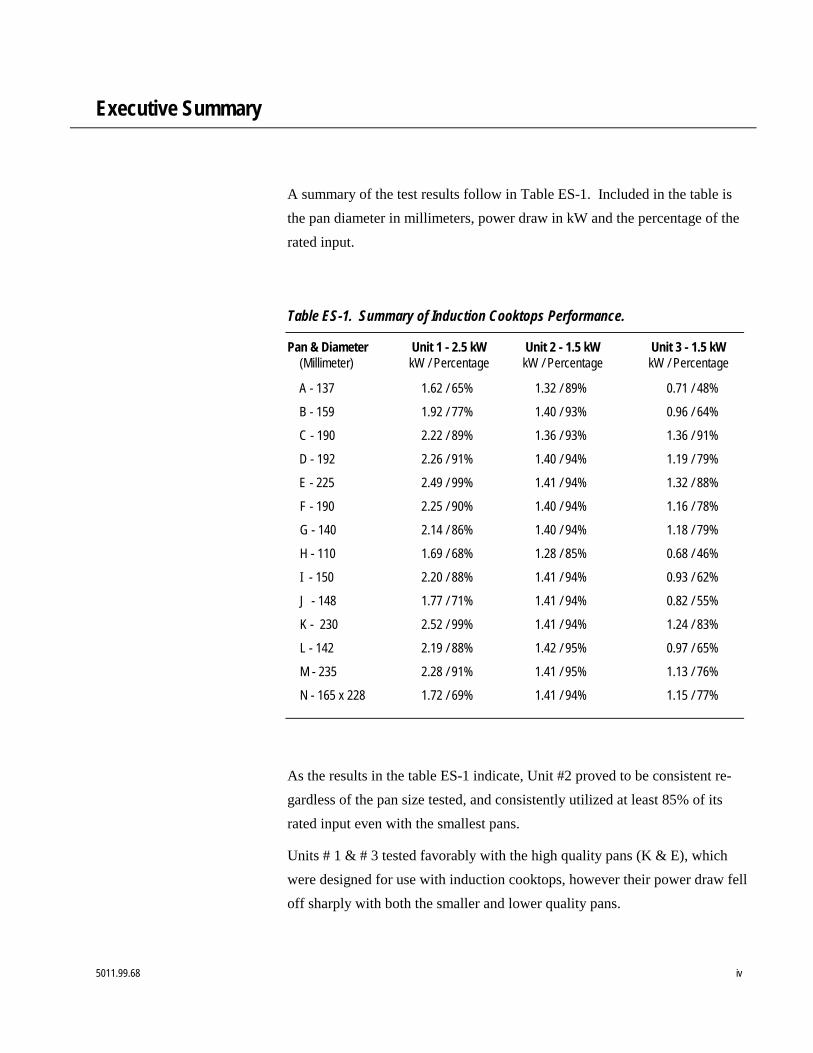
A summary of the test results follow in Table ES-1. Included in the table isthe pan diameter in millimeters, power draw in kW and the percentage of therated input.
Table ES-1. Summary of Induction Cooktops Performance.
Pan & Diameter Unit 1 - 2.5 kW Unit 2 - 1.5 kW Unit 3 - 1.5 kW (Millimeter) kW / Percentage kW / Percentage kW / Percentage
A - 137 1.62 / 65% 1.32 / 89% 0.71 / 48%
B - 159 1.92 / 77% 1.40 / 93% 0.96 / 64%
C - 190 2.22 / 89% 1.36 / 93% 1.36 / 91%
D - 192 2.26 / 91% 1.40 / 94% 1.19 / 79%
E - 225 2.49 / 99% 1.41 / 94% 1.32 / 88%
F - 190 2.25 / 90% 1.40 / 94% 1.16 / 78%
G - 140 2.14 / 86% 1.40 / 94% 1.18 / 79%
H - 110 1.69 / 68% 1.28 / 85% 0.68 / 46%
I - 150 2.20 / 88% 1.41 / 94% 0.93 / 62%
J - 148 1.77 / 71% 1.41 / 94% 0.82 / 55%
K - 230 2.52 / 99% 1.41 / 94% 1.24 / 83%
L - 142 2.19 / 88% 1.42 / 95% 0.97 / 65%
M - 235 2.28 / 91% 1.41 / 95% 1.13 / 76%
N - 165 x 228 1.72 / 69% 1.41 / 94% 1.15 / 77%
As the results in the table ES-1 indicate, Unit #2 proved to be consistent re-gardless of the pan size tested, and consistently utilized at least 85% of itsrated input even with the smallest pans.
Units # 1 & # 3 tested favorably with the high quality pans (K & E), whichwere designed for use with induction cooktops, however their power draw felloff sharply with both the smaller and lower quality pans.
Executive Summary
5011.99.68 v
Induction Unit #2 operated remarkably well regardless of the pan size or ma-terial, proving that high quality, expensive pans are not necessarily requiredfor well-designed induction cook tops. However, small pans will draw full-power on Unit # 2, which could pose an issue on higher powered units.Overall, the performance of Unit # 2 demonstrated the engineering efforts ofits design.
FSTC Manager
Senior Program Manager
1 Introduction
5011.99.68 1-1
The Range top is one of the most widely used pieces of equipment in acommercial kitchen and continues to evolve as end users demand more pow-erful and energy efficient equipment. An interesting development is the ap-plication of induction technology to electric range tops and table-side cook-ing units. One of the potential benefits of induction cooking is that the heatcan be evenly distributed into a large cooking surface, similar to a gasburner, without sacrificing the efficiency of electric resistance cooking. In-duction range top technology has been available to residential users for sev-eral years, but has only recently started to make its way into the commercialsector.
Operators interested in induction cooktops consider energy efficiency, easeof use and compatible pan performance when making their purchasing deci-sions. To assist the consumers in their selection process, this report exam-ines induction cooktop technology and whether there is a difference betweenhow the cooktops perform with varying sizes and quality of pans.
With support from the Electric Power Research Institute (EPRI), the GasResearch Institute (GRI), and the National Restaurant Association, PG&E’sFood Service Technology Center (FSTC) has developed numerous standardtest methods (STMs) for commercial cooking equipment. These STMs havebeen carefully reviewed and subsequently ratified by the American Societyfor Testing and Materials (ASTM) committee F 26 on commercial foodservice equipment.
In 1994, the FSTC completed a draft STM for range tops which was laterratified by ASTM (designation F 1521-96).1,2 This method served as a framework for conducting pan sensitivity tests on three different induction cook-tops.
Background
Introduction
5011.99.68 1-2
The glossary in Appendix A is provided so that the reader has a quick refer-ence to the terms used in this report.
The objective of this report is to examine the performance of three differentinduction cooktops using fourteen different pans of diverse size and con-structions. The results are a measure of how much of the cooktops rated in-put (kW) was drawn with each pan and what percentage of the inductionunit’s rated input was utilized.
The three cooktops utilized a single induction hob that caused heat to begenerated directly into the magnetic material comprising the cooking con-tainer (pan) by means of an induced electromagnetic field. The amount ofheat generated in the cooking container was controlled by varying thestrength of the magnetic field. Each unit had a smooth and continuous ce-ramic glass plate. Because the surface was not directly heated during opera-tion, it remained relatively cool, gaining only residual heat from the cookingcontainer.
The three induction units are referred to as units # 1, # 2 and # 3. The pansare lettered A through N. Appliance specifications are listed in Table 1-1through 1-3.
Table 1-1. Unit #1 Specifications.
Generic Appliance Type Electric induction cooktop
Rated Input 2.50 kW
Dimensions 15” x 20¾” x 5½”
Construction Ceramic cooktop with Stainless Steel sides panels
Controls Touch pad cooking controls adjustable for ”Fry” and“Warm” modes using a scale of 1 to 5 for each style with ansensor alarm
Notes Overall this unit seemed to be very well constructed, com-plimented with its user friendly control touch pad
Objectives
ApplianceDescriptions
Introduction
5011.99.68 1-3
Table 1-2. Unit # 2 Specifications.
Generic Appliance Type Electric induction cooktop
Rated Input 1.50 kW
Dimensions 15” x 17½ x 4¼”
Construction Ceramic cooktop with Stainless Steel side panels
Controls Touch pad cooking controls adjustable for “Heat” modeusing “High, Medium and Low” settings and “Temp” modewith 5 temperature settings ranging from 180°F to 390°Fand a cooking timer
Notes Of the three units tested, this unit had the best control fea-tures, design, and overall quality construction
Table 1-3. Unit # 3 Specifications.
Generic Appliance Type Electric induction cooktop
Rated Input 1.50 kW
Dimensions 13½” x 12½” x 3½”
Construction Ceramic cooktop with Stainless Steel side panels
Controls Two cooking control adjust between “Cook” and “Temp”modes using a single dial for both power (360w to 1450w)or temperature (120°F to 410°F) settings
Notes Construction / controls attributes reflect manufacture em-phasis in low first cost induction cooktop.
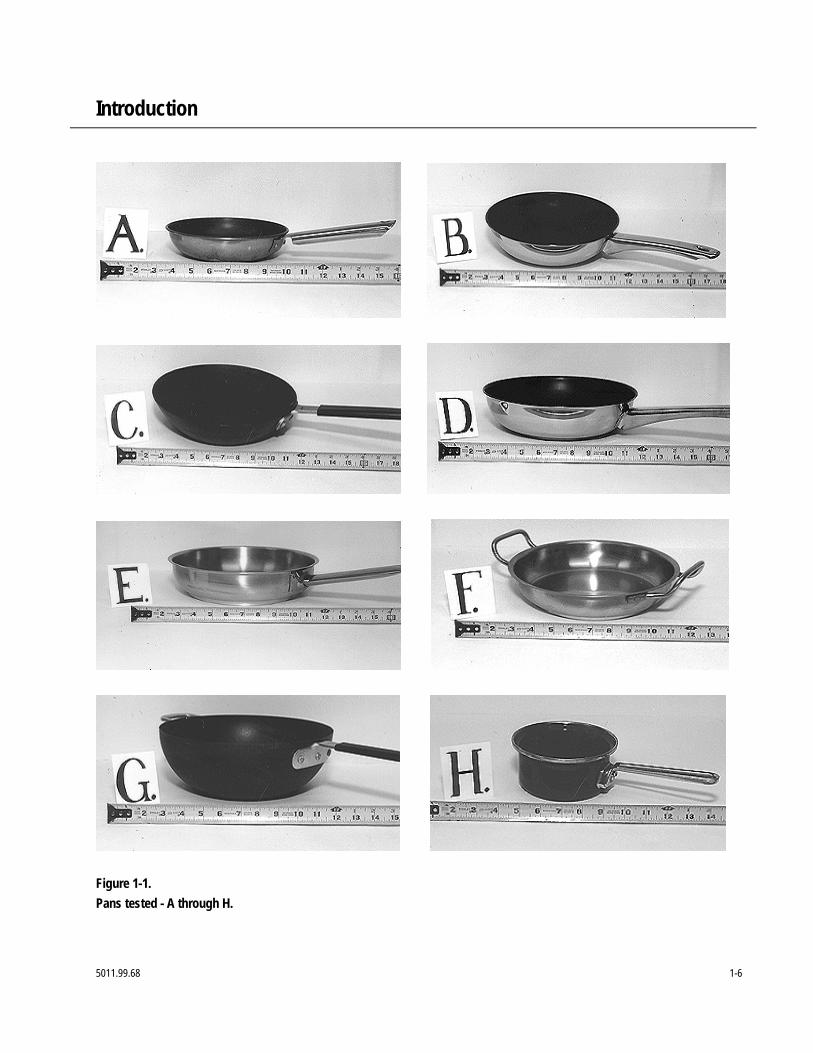
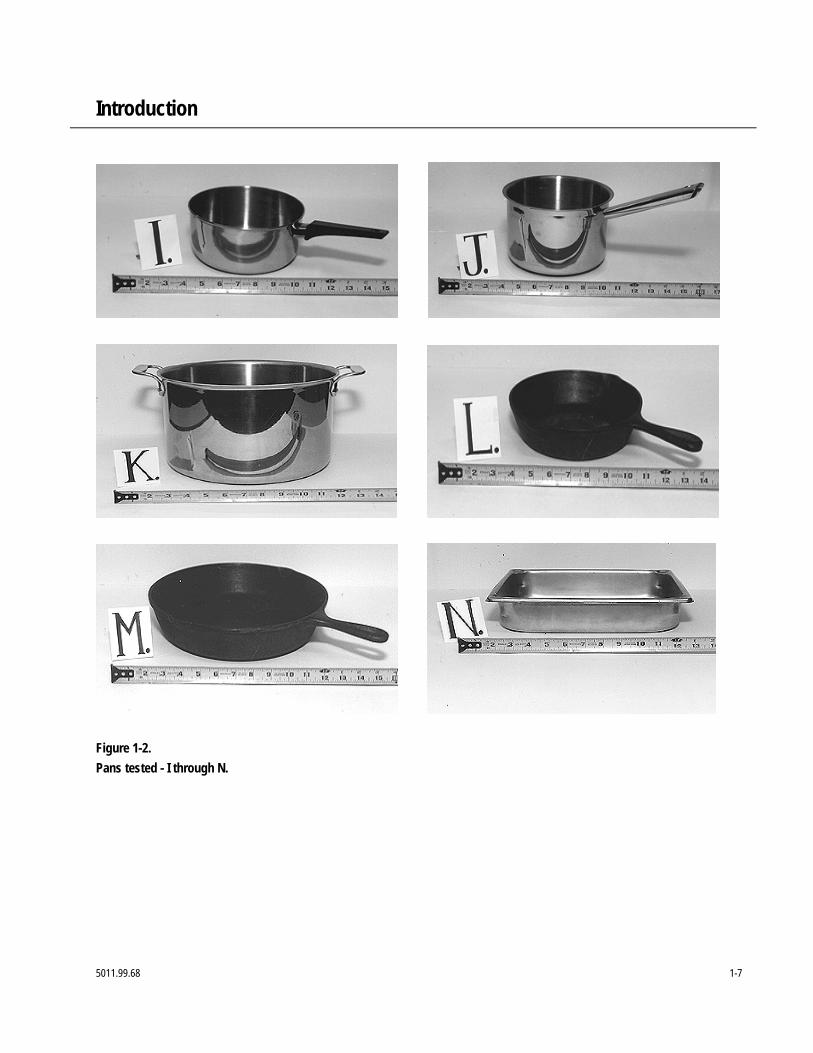
The testing of the induction units involved the use of fourteen pans, allvarying to some degree. Of these fourteen pans tested, the majority of thepans were either sauté or sauce pans, reflecting typical, real-world usage ofrange tops. However, to obtain a variation in pan types, also tested was astock pot, a wok, and a ½ size chaffing dish.
For the purpose of the testing, pan diameter was determined by the bottomcontact surface. This was assumed to have the greatest impact on cooktop
Pan / Descriptions
Introduction
5011.99.68 1-4
performance. While some pans were of the same (or similar) diameter, eachpan’s attributes contrasted.
Pan diameters ranged from 110 millimeters to 235 millimeters. Some panswere from well known manufacturers, while others had no markings. Thepans were constructed from materials such as cast iron, stainless steel orlaminated alloys. A majority of the bottoms of the pans were level (uniform)and some pans had a machined plate attached to the bottom. Two of thepans were noticeably warped and the two cast iron pans had a raised outerring on the bottom.
The machined raised flat bottom (MRFB) pans are described as pans thathave a flat, machined disk shaped plate attached to the bottom of the panwhich allows for even, continuous contact with the induction surface andprevents warping.
A raised ring flat bottom (RRFB) pan is described as a pan that has a thin,narrow ring on the bottom that circles the outer edge of the pan. This designprevents a majority of the pan from coming in direct contact with an induc-tion surface.
Though often difficult and expensive to have the bottom of the pan perfectlylevel without machining the bottom. Only two of the pans showed notice-able signs of warping. Of these two pans, one was concave (CC) and theother convex (CV) in shape.
Since many of the pans did not have any markings or did not indicate mate-rial properties, the researchers wanted to add a “consumer subjectivity” tothe pan in the description table/list. This listing in Table 1-4 is only subjec-tive to the point that it gives the reader another perception about the pans.The quality of the pans were broken down into low, average and high. Theseratings were based on what a consumer might perceive a pan to be. A “low”quality pan would be thin, very light weight and easily dented or warped.An “average” rating for pans that were well constructed, relatively thick andcould with-stand everyday use. A “high” quality pan was very heavy, thick,and had the appearance of lasting a lifetime. See Table 1-4.
Introduction
5011.99.68 1-5
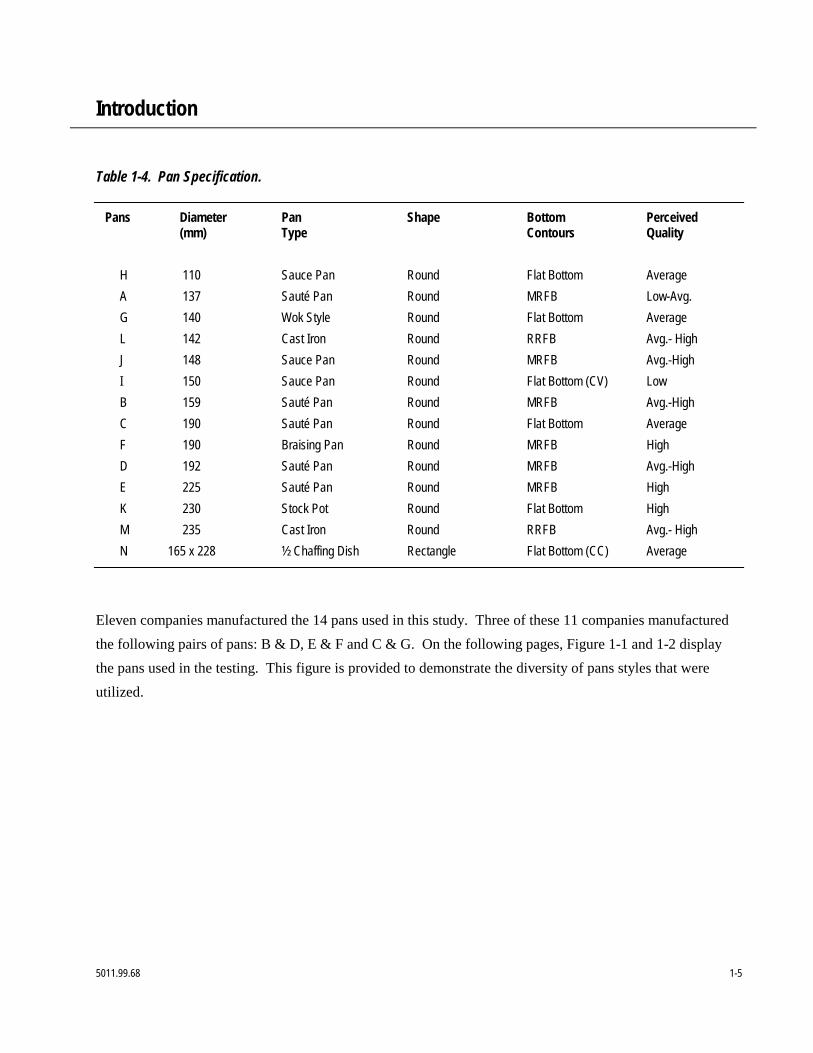
Table 1-4. Pan Specification.
Pans Diameter Pan Shape Bottom Perceived(mm) Type Contours Quality
H 110 Sauce Pan Round Flat Bottom AverageA 137 Sauté Pan Round MRFB Low-Avg.G 140 Wok Style Round Flat Bottom AverageL 142 Cast Iron Round RRFB Avg.- HighJ 148 Sauce Pan Round MRFB Avg.-HighI 150 Sauce Pan Round Flat Bottom (CV) LowB 159 Sauté Pan Round MRFB Avg.-HighC 190 Sauté Pan Round Flat Bottom AverageF 190 Braising Pan Round MRFB HighD 192 Sauté Pan Round MRFB Avg.-HighE 225 Sauté Pan Round MRFB HighK 230 Stock Pot Round Flat Bottom HighM 235 Cast Iron Round RRFB Avg.- HighN 165 x 228 ½ Chaffing Dish Rectangle Flat Bottom (CC) Average
Eleven companies manufactured the 14 pans used in this study. Three of these 11 companies manufacturedthe following pairs of pans: B & D, E & F and C & G. On the following pages, Figure 1-1 and 1-2 displaythe pans used in the testing. This figure is provided to demonstrate the diversity of pans styles that wereutilized.
Introduction
5011.99.68 1-6
Figure 1-1.Pans tested - A through H.
Introduction
5011.99.68 1-7
Figure 1-2.Pans tested - I through N.
2 Methods
5011.99.68 2-1
FSTC researchers placed the induction cooktops on a table under a 4-foot-deep canopy hood that was 6 feet, 6 inches above the floor. The hood oper-ated at a nominal exhaust rate of 300 cfm per linear foot of hood. There wasat least 6 inches of clearance between the vertical plane of the inductioncooktop and the edge of the hood.
Power and energy were measured with a watt/watt-hour transducer that gen-erated an analog signal for instantaneous power and a pulse for every10 Wh. The transducer was connected to an automated data acquisition unitthat recorded data every 5 seconds. A voltage regulator was connected to theinduction cooktops to maintain a constant voltage for all tests.
Prior to the pan performance tests, each induction unit was preheated for 45minutes using pan (K) filled with 20 pounds of water. Filling the pan withwater assured that each unit would draw its full power consumption duringthe preheat and prevent the pan from heating up to quickly, thereby activat-ing the high-temperature safety cut-off. This preheating stabilized the in-duction units, allowing for a consistent power draw during the remainder ofthe testing. This stabilization period accounted for a somewhat higher input(4%) on the Units # 2 & # 3 during the first 30 minutes. Unit # 1 had only a1% input decrease during this same 30 minutes preheat after the electronicsheated up inside the unit.
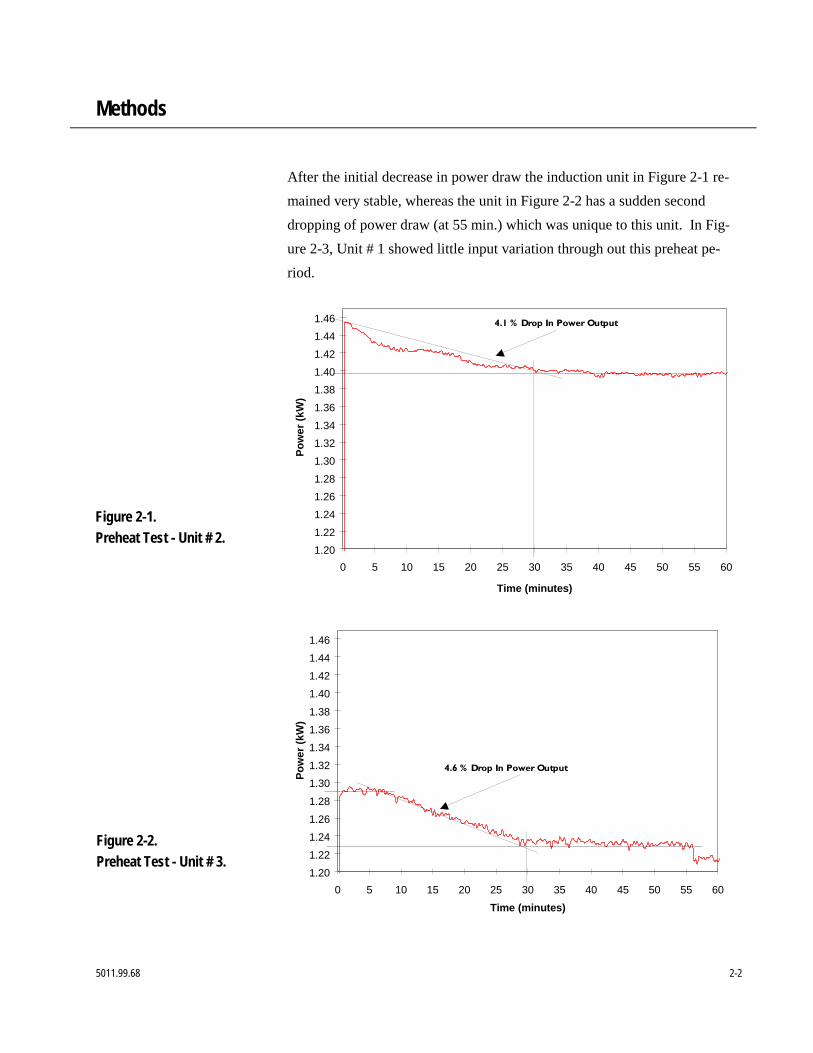
The cooktop in Figure 2-1 exhibited a decline in power from the moment itwas turned on, whereas the unit in Figure 2-2 remained steady for the firstseven minutes then began to decrease its power draw. See Figures 2-1through 2-3.
Setup andInstrumentation
Sensitivity
Methods
5011.99.68 2-2
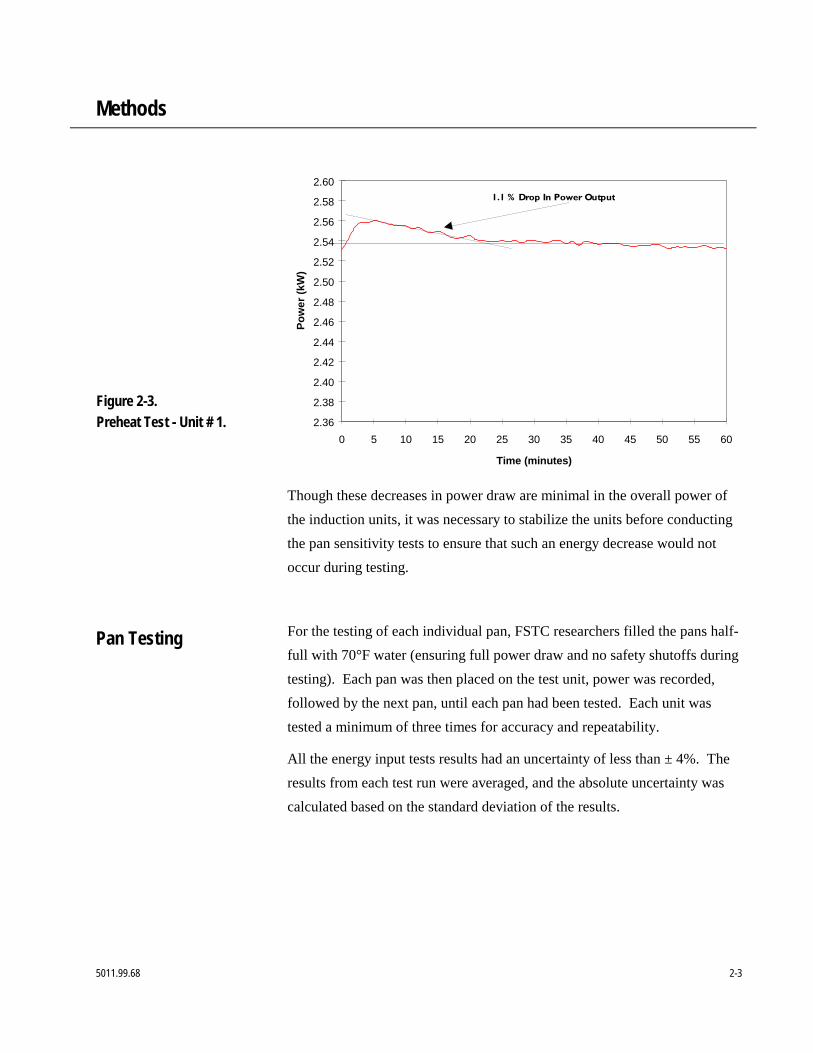
After the initial decrease in power draw the induction unit in Figure 2-1 re-mained very stable, whereas the unit in Figure 2-2 has a sudden seconddropping of power draw (at 55 min.) which was unique to this unit. In Fig-ure 2-3, Unit # 1 showed little input variation through out this preheat pe-riod.
1.20
1.22
1.24
1.26
1.28
1.30
1.32
1.34
1.36
1.38
1.40
1.42
1.44
1.46
0 5 10 15 20 25 30 35 40 45 50 55 60
Time (minutes)
Po
we
r (k
W)
4.1 % Drop In Power Output
1.20
1.22
1.24
1.26
1.28
1.30
1.32
1.34
1.36
1.38
1.40
1.42
1.44
1.46
0 5 10 15 20 25 30 35 40 45 50 55 60
Time (minutes)
Po
we
r (k
W)
4.6 % Drop In Power Output
Figure 2-1.Preheat Test - Unit # 2.
Figure 2-2.Preheat Test - Unit # 3.
Methods
5011.99.68 2-3
2.36
2.38
2.40
2.42
2.44
2.46
2.48
2.50
2.52
2.54
2.56
2.58
2.60
0 5 10 15 20 25 30 35 40 45 50 55 60
Time (minutes)
Po
we
r (k
W)
1.1 % Drop In Power Output
Though these decreases in power draw are minimal in the overall power ofthe induction units, it was necessary to stabilize the units before conductingthe pan sensitivity tests to ensure that such an energy decrease would notoccur during testing.
For the testing of each individual pan, FSTC researchers filled the pans half-full with 70°F water (ensuring full power draw and no safety shutoffs duringtesting). Each pan was then placed on the test unit, power was recorded,followed by the next pan, until each pan had been tested. Each unit wastested a minimum of three times for accuracy and repeatability.
All the energy input tests results had an uncertainty of less than ± 4%. Theresults from each test run were averaged, and the absolute uncertainty wascalculated based on the standard deviation of the results.
Figure 2-3.Preheat Test - Unit # 1.
Pan Testing
3 Results
5011.99.68 3-1
Prior to testing, there was a wide-held belief that premium pans were bestused with induction technology and that using a small, or inexpensive panwould result in poor performance of the induction unit. The price of thesepremium pans alone made an induction cooktop too expensive for manycommercial kitchens. However, as the following results reveal, expensivepans are not necessary when used in combination with a quality inductioncooktop.
The three induction units were tested a minimum of three times with four-teen pans under identical testing conditions. Each pan was filled half-fullwith 70°F water at the beginning of the tests to ensure that each unit woulddraw the maximum amount of power. This also prevented the pans fromheating up to quickly and reaching the high temperature safety cut-off limitof these induction units. The tests were performed with the units set to theirmaximum setting input rates after a 30-minute stabilization period. The re-sults for each of the induction units were very consistent through out thethree tests. In the following graphs, the pans were arranged with the smallestpans on the left-hand side, increasing in size to the right.
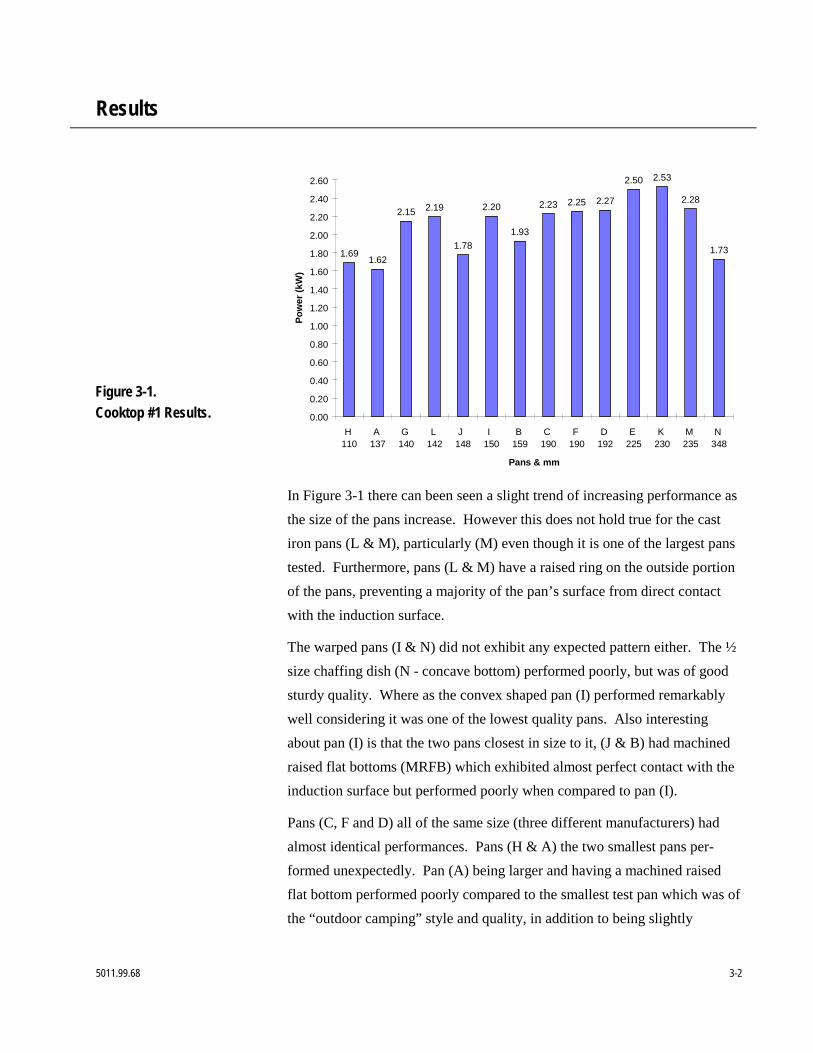
Unit # 1 in Figure 3-1 had a nameplate rating of 2.5 kW. The energy thatwas drawn by the pans was neither consistent with size nor characteristics.
Introduction
Results
Results
5011.99.68 3-2
1.691.62
2.15 2.19
1.78
2.20
1.93
2.23 2.25 2.27
2.50 2.53
2.28
1.73
0.00
0.20
0.40
0.60
0.80
1.00
1.20
1.40
1.60
1.80
2.00
2.20
2.40
2.60
H 110
A 137
G 140
L 142
J 148
I 150
B 159
C 190
F 190
D 192
E 225
K 230
M 235
N 348
Pans & mm
Po
wer
(kW
)
In Figure 3-1 there can been seen a slight trend of increasing performance asthe size of the pans increase. However this does not hold true for the castiron pans (L & M), particularly (M) even though it is one of the largest panstested. Furthermore, pans (L & M) have a raised ring on the outside portionof the pans, preventing a majority of the pan’s surface from direct contactwith the induction surface.
The warped pans (I & N) did not exhibit any expected pattern either. The ½size chaffing dish (N - concave bottom) performed poorly, but was of goodsturdy quality. Where as the convex shaped pan (I) performed remarkablywell considering it was one of the lowest quality pans. Also interestingabout pan (I) is that the two pans closest in size to it, (J & B) had machinedraised flat bottoms (MRFB) which exhibited almost perfect contact with theinduction surface but performed poorly when compared to pan (I).
Pans (C, F and D) all of the same size (three different manufacturers) hadalmost identical performances. Pans (H & A) the two smallest pans per-formed unexpectedly. Pan (A) being larger and having a machined raisedflat bottom performed poorly compared to the smallest test pan which was ofthe “outdoor camping” style and quality, in addition to being slightly
Figure 3-1.Cooktop #1 Results.
Results
5011.99.68 3-3
warped. Overall, Unit #1 reacted differently to both pan size and construc-tion, forcing the consumer use a pan specially suited for this induction unit.
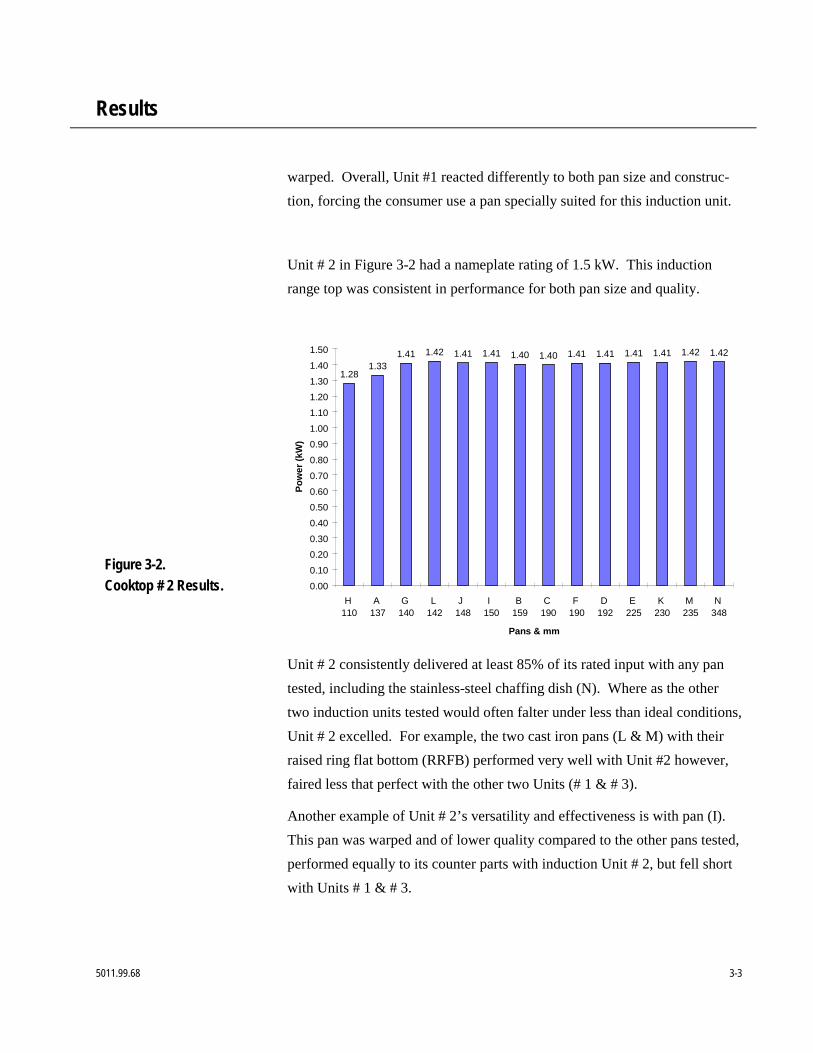
Unit # 2 in Figure 3-2 had a nameplate rating of 1.5 kW. This inductionrange top was consistent in performance for both pan size and quality.
1.281.33
1.41 1.42 1.41 1.41 1.40 1.40 1.41 1.41 1.41 1.41 1.42 1.42
0.00
0.10
0.20
0.30
0.40
0.50
0.60
0.70
0.80
0.90
1.00
1.10
1.20
1.30
1.40
1.50
H 110
A 137
G 140
L 142
J 148
I 150
B 159
C 190
F 190
D 192
E 225
K 230
M 235
N 348
Pans & mm
Po
wer
(kW
)
Unit # 2 consistently delivered at least 85% of its rated input with any pantested, including the stainless-steel chaffing dish (N). Where as the othertwo induction units tested would often falter under less than ideal conditions,Unit # 2 excelled. For example, the two cast iron pans (L & M) with theirraised ring flat bottom (RRFB) performed very well with Unit #2 however,faired less that perfect with the other two Units (# 1 & # 3).
Another example of Unit # 2’s versatility and effectiveness is with pan (I).This pan was warped and of lower quality compared to the other pans tested,performed equally to its counter parts with induction Unit # 2, but fell shortwith Units # 1 & # 3.
Figure 3-2.Cooktop # 2 Results.
Results
5011.99.68 3-4
Because of the ability of Unit # 2 to deliver full-input power to the pans re-gardless of size, shape defects or pan materials (provided its was a ferrousmaterial) it out performs its gas and electric (coil and plate) range top coun-ter parts. As for warped pans, a gas unit will be able to compensate for thisimperfection, but will still have a low energy efficiency. In addition theelectric coil will also drop in energy efficiency because of the less than per-fect contact with the coils. All in all, Unit # 2 is an exceptional unit demon-strating its adaptability with all sizes and types of pans.
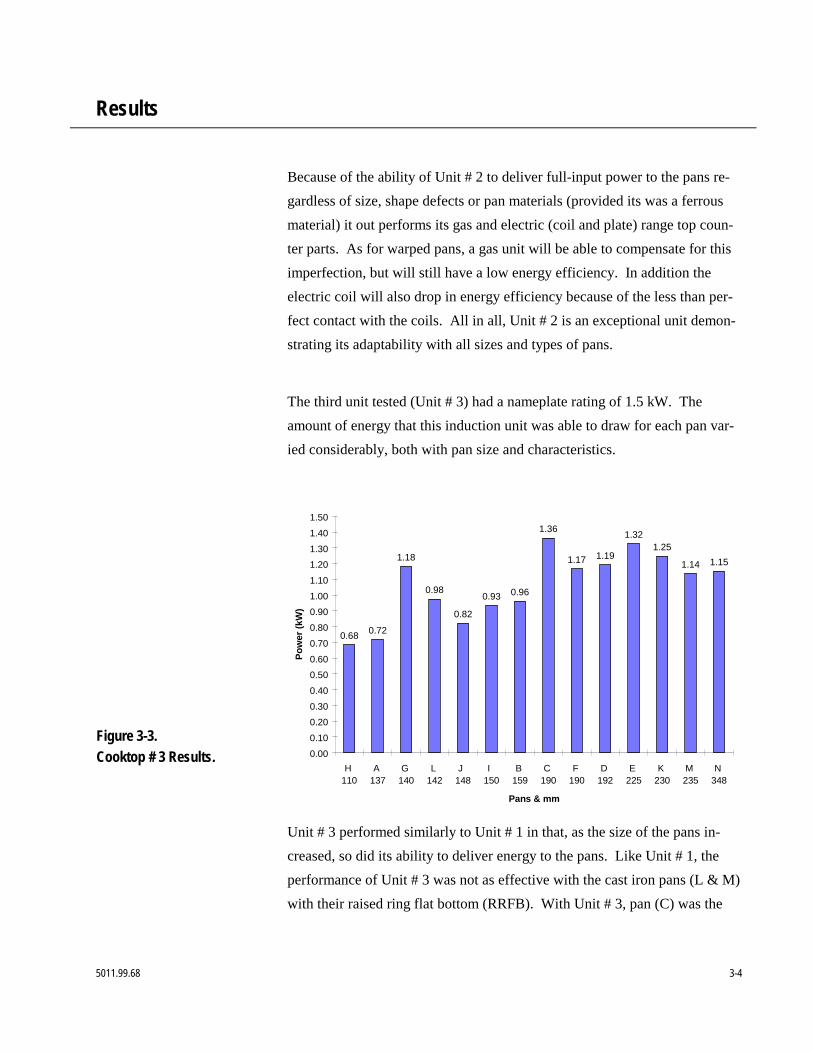
The third unit tested (Unit # 3) had a nameplate rating of 1.5 kW. Theamount of energy that this induction unit was able to draw for each pan var-ied considerably, both with pan size and characteristics.
0.680.72
1.18
0.98
0.82
0.93 0.96
1.36
1.17 1.19
1.321.25
1.14 1.15
0.00
0.10
0.20
0.30
0.40
0.50
0.60
0.70
0.80
0.90
1.00
1.10
1.20
1.30
1.40
1.50
H 110
A 137
G 140
L 142
J 148
I 150
B 159
C 190
F 190
D 192
E 225
K 230
M 235
N 348
Pans & mm
Po
wer
(kW
)
Unit # 3 performed similarly to Unit # 1 in that, as the size of the pans in-creased, so did its ability to deliver energy to the pans. Like Unit # 1, theperformance of Unit # 3 was not as effective with the cast iron pans (L & M)with their raised ring flat bottom (RRFB). With Unit # 3, pan (C) was the
Figure 3-3.Cooktop # 3 Results.
Results
5011.99.68 3-5
best performer, whereas pan (K) was the best performer on Unit # 1 and Unit# 2 performed well with all its pans.
In addition, Unit # 3 was also unique in that it did not recognize (that is,draw power) pan (H) until the induction unit had been preheated, which wasnot observed on either of the other induction units (# 1 & # 2). Even whentested with similar sized pans (C, F & D), the effectiveness of Unit # 3 var-ied noticeably. However, Unit # 3 did perform acceptably with higher qual-ity pans. With lower quality pans, or pans not specifically designed for usewith induction cooktops, one could expect up to a 40% drop in rated per-formance.
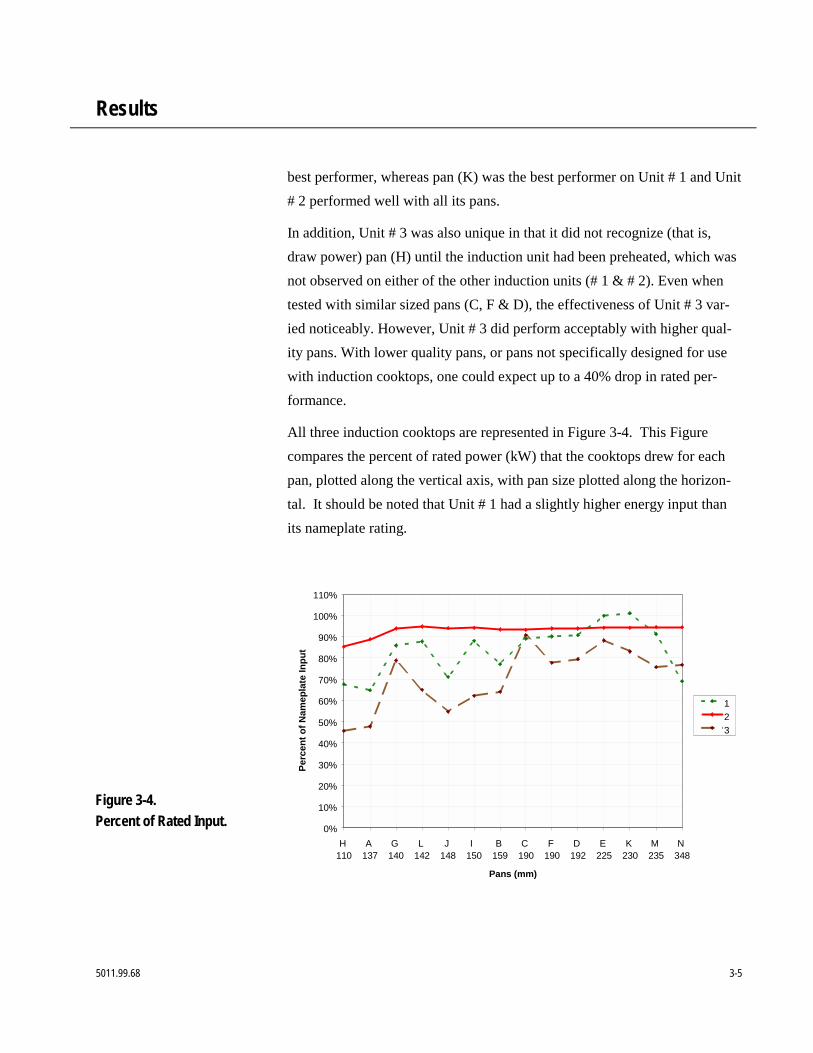
All three induction cooktops are represented in Figure 3-4. This Figurecompares the percent of rated power (kW) that the cooktops drew for eachpan, plotted along the vertical axis, with pan size plotted along the horizon-tal. It should be noted that Unit # 1 had a slightly higher energy input thanits nameplate rating.
0%
10%
20%
30%
40%
50%
60%
70%
80%
90%
100%
110%
H 110
A 137
G 140
L 142
J 148
I 150
B 159
C 190
F 190
D 192
E 225
K 230
M 235
N 348
Pans (mm)
Per
cen
t o
f N
amep
late
Inp
ut
1
2
3
Figure 3-4.Percent of Rated Input.

Results
5011.99.68 3-6
The differences between these induction units were many. For example Unit# 1 and Unit # 2 showed little change in the amount of power drawn by thethree pans near 190 mm, whereas Unit # 3 showed a drop of 11 % in itspower draw between the pans. Another example is the ½ size chaffing dishpan (N) which showed no changes in Unit # 2 and Unit # 3 where as Unit # 1responded poorly.
Though all three cooktops performed effectively at times, it was clear that itis not the pans that make the induction unit but the induction technology it-self that sets manufactures apart.
4 Conclusions
5011.99.68 4-1
The results of the testing clearly demonstrated that there is a difference be-tween induction cooktop technologies. The belief that an expensive highquality pan is needed to utilize the full rated input of an induction range top isno longer indisputable.
Though each of these induction cooktops performed effectively at times, itwas Unit # 2 that stood apart from the others with its consistent full powerdelivery to all fourteen pans which is very desirable in smaller (kW) table topinduction cooktops.
Though Unit #2 had this unique ability to deliver its full rated input to thesmaller diameter pans, it must be recognized that with larger (kW) units, de-livering 3 kW to a small pan could present safety issues. On the other side ofthe coin, a 3 kW cooktop can afford to be less effective with different panstypes, whereas a small unit exhibiting a decrease of 15% in its input could beconsidered a poor performing induction cooktop.
The designers of Unit # 2 have engineered an induction cooktop that is able todeliver full power to the pan, regardless of the pan’s size, shape or quality.
Future testing of induction cooktops should include a wide range of pan sizesand materials in the evaluation of the technology. This will provide a morecomplete picture of induction cooktop performance for discerning consumers.
The designers of
Unit # 2 have
engineered an
induction cook-
top that is able to
deliver full power
to the pan, re-
gardless of the
pan’s size, shape
or quality.
5 References
5011.99.68 5-1
1. American Society for Testing and Material. ASTM F 1521-94. Stan-dard Test Method for the Performance of Range Tops. In Annual Bookof ASTM Standards. Philadelphia: American Society for Testing andMaterials. This test method can be purchased from the American Soci-ety for Testing and Materials, 100 Bar Harbor Drive, West Consho-hocken, PA 19428-2959
2. Food Service Technology Center. 1995. Development and Validation ofa Uniform Testing Procedure for Range Tops. Report 1022.95.20 pre-pared for PG&E Products and Services Department. San Francisco: Pa-cific Gas and Electric Company.
3. Food Service Technology Center. Vulcan-Hart Induction Range Top:Application of ASTM Standard Test Method. Report 5011.95.29 pre-pared for PG&E Products and Services Department. San Francisco: Pa-cific Gas and Electric Company.
4. Food Service Technology Center. Garland 2.5 kW Induction RangeTop: Application of ASTM Standard Test Method. Report 5011.95.30prepared for PG&E Products and Services Department. San Francisco:Pacific Gas and Electric Company.
5. Food Service Technology Center. Glowmaster 5.0 kW Induction Wok .Report 5011.98.52 prepared for PG&E Products and Services Depart-ment. San Francisco: Pacific Gas and Electric Company.

Appendixes
5011.99.68
A Glossary
5011.99.68 A-1
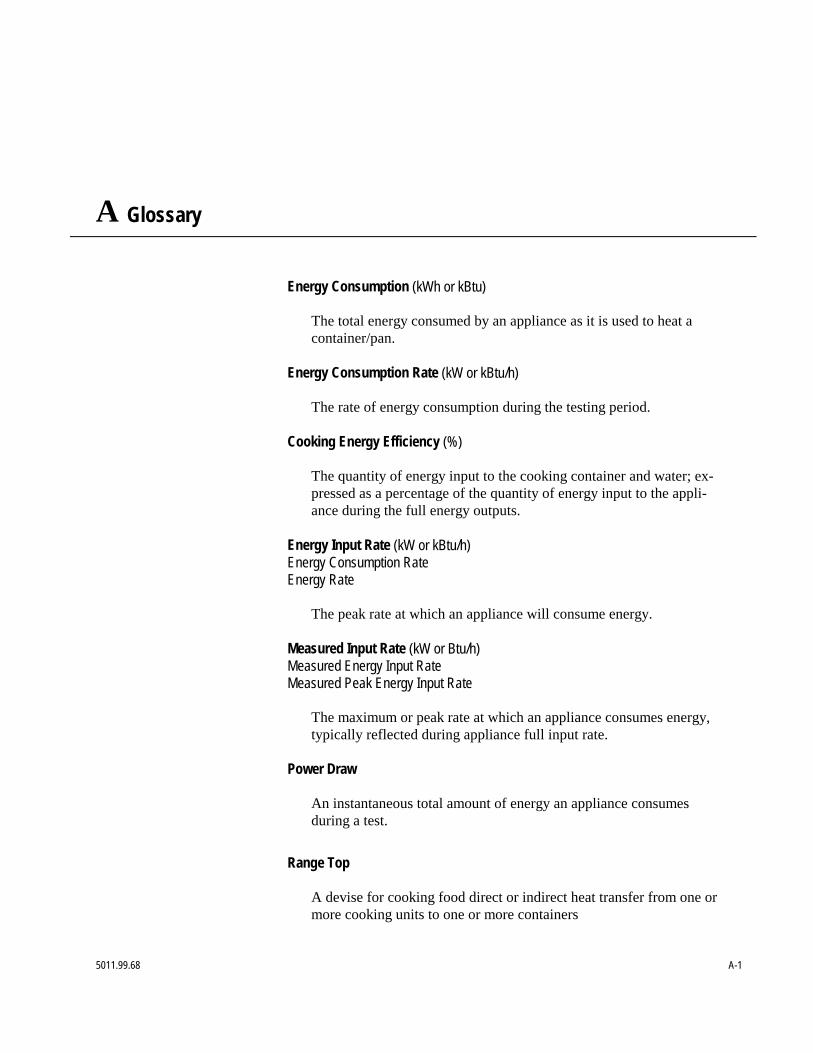
Energy Consumption (kWh or kBtu)
The total energy consumed by an appliance as it is used to heat acontainer/pan.
Energy Consumption Rate (kW or kBtu/h)
The rate of energy consumption during the testing period.
Cooking Energy Efficiency (%)
The quantity of energy input to the cooking container and water; ex-pressed as a percentage of the quantity of energy input to the appli-ance during the full energy outputs.
Energy Input Rate (kW or kBtu/h)Energy Consumption RateEnergy Rate
The peak rate at which an appliance will consume energy.
Measured Input Rate (kW or Btu/h)Measured Energy Input RateMeasured Peak Energy Input Rate
The maximum or peak rate at which an appliance consumes energy,typically reflected during appliance full input rate.
Power Draw
An instantaneous total amount of energy an appliance consumesduring a test.
Range Top
A devise for cooking food direct or indirect heat transfer from one ormore cooking units to one or more containers

Glossary
5011.99.68 A-2
Rated Energy Input Rate (kW, W or Btu/h, Btu/h)Input Rating (ANSI definition)Nameplate Energy Input RateRated Input
The maximum or peak rate at which an appliance consumes energyas rated by the manufacturer and specified on the nameplate.
Test Method
A definitive procedure for the identification, measurement, andevaluation of one or more qualities, characteristics, or properties of amaterial, product, system, or service that produces a test result.
B Pan Sensitivity Testing Data
5011.99.68 B-1
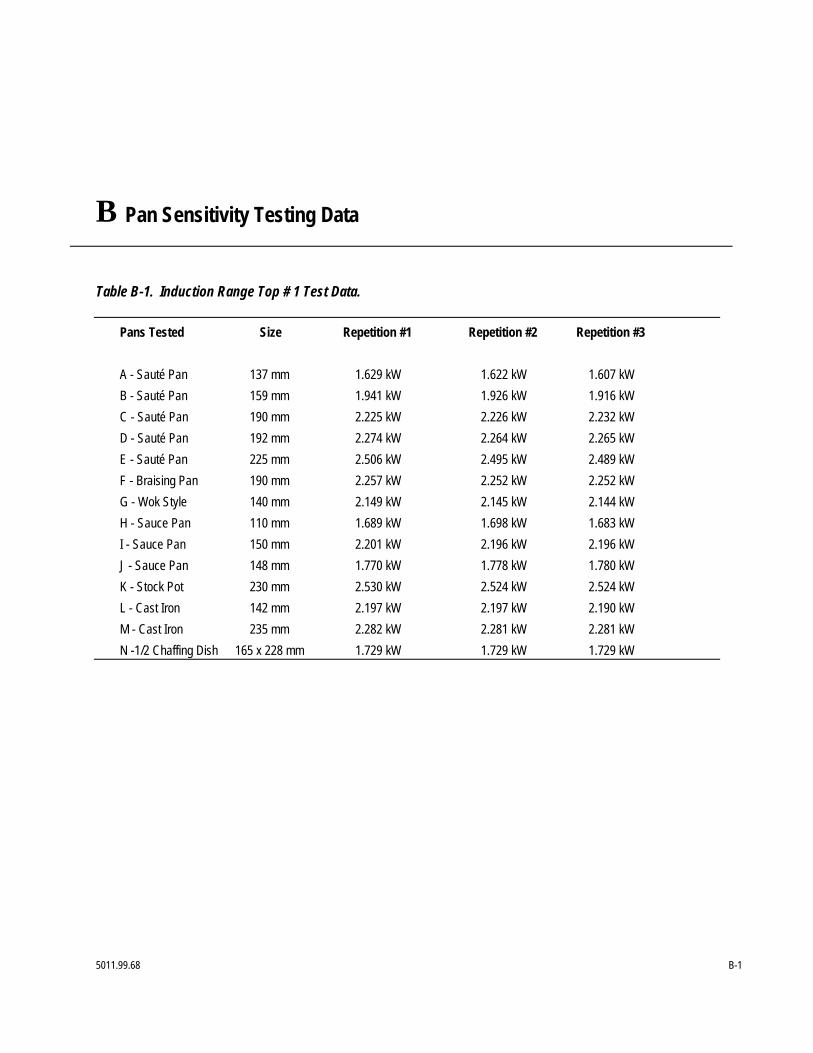
Table B-1. Induction Range Top # 1 Test Data.
Pans Tested Size Repetition #1 Repetition #2 Repetition #3
A - Sauté Pan 137 mm 1.629 kW 1.622 kW 1.607 kWB - Sauté Pan 159 mm 1.941 kW 1.926 kW 1.916 kWC - Sauté Pan 190 mm 2.225 kW 2.226 kW 2.232 kWD - Sauté Pan 192 mm 2.274 kW 2.264 kW 2.265 kWE - Sauté Pan 225 mm 2.506 kW 2.495 kW 2.489 kWF - Braising Pan 190 mm 2.257 kW 2.252 kW 2.252 kWG - Wok Style 140 mm 2.149 kW 2.145 kW 2.144 kWH - Sauce Pan 110 mm 1.689 kW 1.698 kW 1.683 kWI - Sauce Pan 150 mm 2.201 kW 2.196 kW 2.196 kWJ - Sauce Pan 148 mm 1.770 kW 1.778 kW 1.780 kWK - Stock Pot 230 mm 2.530 kW 2.524 kW 2.524 kWL - Cast Iron 142 mm 2.197 kW 2.197 kW 2.190 kWM - Cast Iron 235 mm 2.282 kW 2.281 kW 2.281 kWN -1/2 Chaffing Dish 165 x 228 mm 1.729 kW 1.729 kW 1.729 kW

Pan Sensitivity Testing Data
5011.99.68 B-2
Table B-2. Induction Range Top # 2 Test Data.
Pans Tested Size Repetition #1 Repetition #2 Repetition #3
A - Sauté Pan 137 mm 1.334 kW 1.331 kW 1.330 kWB - Sauté Pan 159 mm 1.399 kW 1.396 kW 1.409 kWC - Sauté Pan 190 mm 1.397 kW 1.392 kW 1.406 kWD - Sauté Pan 192 mm 1.406 kW 1.405 kW 1.416 kWE - Sauté Pan 225 mm 1.411 kW 1.406 kW 1.422 kWF - Braising Pan 190 mm 1.407 kW 1.403 kW 1.416 kWG - Wok Style 140 mm 1.406 kW 1.402 kW 1.417 kWH - Sauce Pan 110 mm 1.271 kW 1.290 kW 1.276 kWI - Sauce Pan 150 mm 1.412 kW 1.403 kW 1.421 kWJ - Sauce Pan 148 mm 1.412 kW 1.402 kW 1.418 kWK - Stock Pot 230 mm 1.412 kW 1.405 kW 1.426 kWL - Cast Iron 142 mm 1.421 kW 1.412 kW 1.428 kWM - Cast Iron 235 mm 1.419 kW 1.410 kW 1.427 kWN -1/2 Chaffing Dish 165 x 228 mm 1.421 kW 1.419 kW 1.420 kW
Pan Sensitivity Testing Data
5011.99.68 B-3
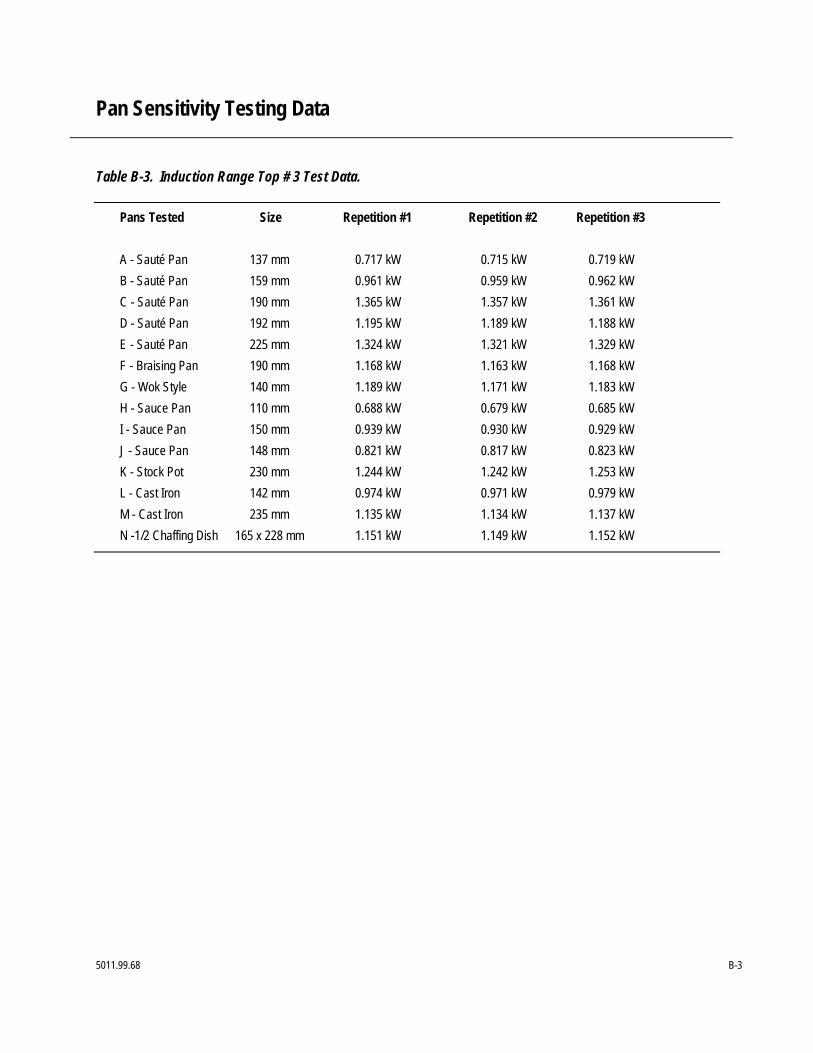
Table B-3. Induction Range Top # 3 Test Data.
Pans Tested Size Repetition #1 Repetition #2 Repetition #3
A - Sauté Pan 137 mm 0.717 kW 0.715 kW 0.719 kWB - Sauté Pan 159 mm 0.961 kW 0.959 kW 0.962 kWC - Sauté Pan 190 mm 1.365 kW 1.357 kW 1.361 kWD - Sauté Pan 192 mm 1.195 kW 1.189 kW 1.188 kWE - Sauté Pan 225 mm 1.324 kW 1.321 kW 1.329 kWF - Braising Pan 190 mm 1.168 kW 1.163 kW 1.168 kWG - Wok Style 140 mm 1.189 kW 1.171 kW 1.183 kWH - Sauce Pan 110 mm 0.688 kW 0.679 kW 0.685 kWI - Sauce Pan 150 mm 0.939 kW 0.930 kW 0.929 kWJ - Sauce Pan 148 mm 0.821 kW 0.817 kW 0.823 kWK - Stock Pot 230 mm 1.244 kW 1.242 kW 1.253 kWL - Cast Iron 142 mm 0.974 kW 0.971 kW 0.979 kWM - Cast Iron 235 mm 1.135 kW 1.134 kW 1.137 kWN -1/2 Chaffing Dish 165 x 228 mm 1.151 kW 1.149 kW 1.152 kW