Embed Size (px)
Citation preview

1
Research Study Report
On
“Industrial Relations and Enterprise Economic Survey Nepal-2010”
BY
Prakash Bahadur Amatya
Ishwar Kumar Shrestha
Federation of Nepalese Chambers Commerce and Industry (FNCCI)
Employers’ Council
Teku, Kathmandu

2
Foreword
Industrial Peace and cooperative relation between the employers and workers is a necessary
prerequisite for enterprise growth and socio economic development of the country. In
order to assess the situation in the industrial units, FNCCI commissioned a survey on
‘Industrial Relation and Enterprise Growth, wages and working conditions in Nepalese
Enterprises’.
The Study Report provides some important information about the different aspects of
industrial relations and salary, wages, fringe benefits and working conditions in Nepalese
industries. Besides, it also gives the views and opinion of management on various labour
related issues. It is hoped that this study will help to understand the various dimensions of
industrial relation and help to improve the existing policy and practices.
The FNCCI – Employers’ Council is publishing the survey report with the objective of
providing information gathered during the survey to the concerned people and
organizations.
On this occasion, I would like to express my sincere thanks to International Labour
Organisation (ILO) for providing financial support to carry out the Research Study. I would
also like to thank Mr. Pradeep Jung Pandey, Vice-President and Chairman, Employers’
Council, FNCCI, for taking initiatives to conduct the Study. Director General, FNCCI and all
staffs of Employers Council deserve special thanks for coordinating the survey and
completing it within the specified time.
7 July, 2010
_________________
President
FNCCI

3
Acknowledgement
The FNCCI-Employers’ Council is pleased to present the study report on “Industrial Relation
and Enterprise Economic Survey Nepal-2010” in the printed form. This survey was
completed in the beginning of this year. We hope that the study will provide relevant
information in the field of wages, benefits and working conditions in Nepalese
manufacturing industries. Further studies on the issues dealt in the survey can be more
fruitful to the concerned people and organizations.
We are grateful to International Labour Organisation (ILO) for its financial support which has
made it possible to conduct the Research Study. We would also like to express our sincere
thanks to Mr. Gotabaya Dasanayaka, Senior Specialist on Employers' Activities, ILO sub
regional office New Delhi and Mr. Shengjie Li, Director, ILO Office in Kathmandu for their
valuable suggestions, comments and guidance in completing the research study.
I would also like to thank Mr. Prakash Bahadur Amatya and Mr. Ishwar Kumar Shrestha,
Research Consultants for undertaking this research study and producing the fruitful result.
Mr. Roman Awick, Industrial Relations and Labour Law Expert (CIM-Germany) also deserves
special thank for his valuable ideas and engagement.
Last but not the least; I would like to thank Dr. Hemant Dawadi, Director General, FNCCI, Mr.
Hansa Ram Pandey, Director, Employers' Council, Mr. YagyaMan Shakya, Assistant Director
and all Secretariat staffs for their coordination and valuable contribution at various points of
the study.
I hope this report will provide useful and important information that will be helpful to the
enterprises, professionals, and to all concerned.
7 July,2010
___________________
Pradeep Jung Pandey
Vice President &
Chairman,
4
Employers’ Council, FNCCI
Contents
Chapter I………………………………………………………………………………………………. 1-3
1.1 Introduction……………………………………………………………………………… 1
1.1.1 Industrial Relations and Economic Growth……………………. 2
1.1.2 Labour Force and their productivity…………………………….. 3
1.2 Objective of study ……………………………………………………………………… 3
Chapter II……………………………………………………………………………………………… 4-5
2.1 Methodology……………………………………………………………………………… 4
2.2 Sample Size………………………………………………………..……………………… 4
2.3 Sample Design…………………………………………………………………….…….. 4
2.4 Sample Frame…………………………………………………………………….……… 5
2.5 Sampling errors and non sampling errors……………………………….…… 5
Chapter III………………………………………………………………………………………………6-7
3.1 Survey Questionnaire ……………………………………………………..…………… 6
3.2 Organization of fieldwork…………………………………………………….……… 6
3.3 Data collection……………………………………………………………………………6
3.4 Data Management……………………………………………………………….……… 7
3.5 Survey Limitation…………………………………………………………………..…… 7
Chapter IV……………………………………………………………………………………..……… 8-11
4.1 Proportion of samples by regions and districts…………………………..… 8

5
4.2 Proportion of samples by districts and sectors……………………………. 8 4.3 Selection of sample by region……………………………………………………. 9 4.4 Selection of industries by sectors………………………………………………… 10 4.5 Type of industries
on the basis of ownership and capital structure 11
Chapter V……………………………………………………………………………………………….12-14
5.1 Number of workers on the basis of classification of industry………… 12 5.2 Employment Practice………………………………………………………………..… 12 5.3 Recruitment process on the basis of type of ownership……………… 13 5.4 Availability of skilled workers…………………………………………….……… 14

6
Chapter VI…………………………………………………………………………………………….. 15-16
6.1 Increase or decrease in work force…………………………………………….… 15 6.2 Capacity expansion of the industries………………………………………….… 15 6.3 Recruitment………………………………………………………………………….…… 16 6.4 Recruitment Pattern……………………………………………………………….…… 16
Chapter VII………………………………………………………………………………….………… 17-18
7.1 Type of employment contract………………………………………………….…… 17 7.2 Leave facilities……………………………………………………………………….…… 17 7.3 Benefits and facilities…………………………………………………………….…… 18
Chapter VIII…………………………………………………………………………..……………… 19-23
8.1 Communication in enterprise………………………………………………………. 19 8.2 Labour management relationship………………………………………………… 19 8.3 Collective bargaining process……………………………………………………… 20 8.4 Dismissal…………………………………………………………………………………… 20 8.5 Industrial disputes……………………………………………………………………… 20 8.6 Dispute resolution and mediation……………………………………………….. 21 8.7 Industrial actions……………………………………………………………………..… 22 8.8 Duration of industrial action………………………………………………………… 22 8.9 Unions in the industries……………………………………………………………… 23
Chapter IX…………………………………………………………………………………………..… 24-29
9.1 Wage pay system………………………………………………………………………. 24 9.2 Wage pay system by gender………………………………………………………. 24 9.3 Wage pay by categories ……………………………………………………………. 24 9.4 Performance evaluation system…………………………………………………… 25 9.5 Growth and Profitability……………………………………………………………… 25 9.6 Productivity……………………………………………………………………………..… 25 9.7 Training……………………………………………………………………………………… 25 9.8 Skill development plan ……………………………………………………………… 26 9.9 Workers by skills and categories ………………………………………………… 26 9.10 Type of product produced by industries …………………………………… 27 9.11 Production index ……………………………………………………………………. 28 9.12 Corporate social responsibility …………………………………………………. 28 9.13 Services expected by FNCCI ……………………………………………………… 29

7
Chapter X……………………………………………………………………………………………… 30-33
10.1 Conclusion……………………………………………………………………………… 30 10.2 Recommendation…………………………………………………………………… 31
10.3 Definition of used terms…………………………………………………………. 32

8
Chapter I
1.1 Introduction
The history of industrialization in Nepal is not very long. The process of industrialization
actually started from 1950 onwards. Only after the restoration of multi-party democracy
system in 1990 and the enactment of Labour Act 1992, industrial relation issues gained
importance. The nascent trade union movement acted as a catalytic agent in the promotion
of industrial relation issues. Therefore, the growth of the industrial relation activity was
gradual and gained momentum within the last two decades.
Unprecedented growth in the number of companies after the adoption of liberalization
policy in Nepal after 1990 and also the growth in the number of trade unions provided the
ground for the promotion of industrial relation issues which were then lying dormant. The
enactment of Labour Act 1992, Labour Rules 1994 and Trade Union Act 1993 prepared the
base for the trade unions to place the demands lawfully to the enterprises and organize
lawful strikes in case of non-fulfillment of their demands. Collective bargaining process
gained legitimacy. However, the later political development had an adverse effect on the
process of industrial relation development. A decade long insurgency completely destroyed
the constructive process of industrial relation development. The politically motivated labour
movement and the competition for the supremacy of the trade unions at the enterprise level
totally diverted the industrial relation development from the right track.
Over the years, there has been a significant change in the relationship between the
employers and workers/employees. The unionization activity has tremendously increased in
different sectors. Workers are being more assertive for their rights. The needs, requirements
and expectations of the workers and employees in the private sector enterprises have been
also changing along with the changing political conditions of the country. High expectations
of the workers, lawlessness in the country, competition among the trade unions for
supremacy at the enterprise level, lack of industrial culture, changing social and economic
conditions, lack of effective enforcement of the existing labour related laws, declining
capacity of the enterprises to provide more employment and fulfill the growing demands of
the workers have direct impact on the industrial relation and economic performance of the
enterprise. In this context, the present survey on “Industrial Relation Situation and Private
Sector Economic Growth” holds great relevance both, for the employers and workers.

9

10
1.1.1 Industrial relations and economic growth
The population of Nepal is estimated to be 27.5 million by the end of 20091. About 73.9% of
the Nepalese work in agriculture, however the GDP contribution of agriculture is about
34%2. The GDP growth rate is estimated to remain 3.5 in 2009 which are not sufficient to
reduce the poverty line of people. The industrial growth and economic activities in Nepal are
not satisfactory. The energy problem, frequent industrial disputes and the continuous
strikes (bandha/hadtal) are some of the major cause that adversely affects the new
employment generation and industrial growth. The recent data shows that in 2009 were all
together 822 different kind of bandha/hadtal organized by different groups including major
political parties. There were 142 major kinds of bandha/hadtal in 2009. Out of 365 days in
2009 only 65 days were free from such kind of disturbances. Additional to this in 145
industries labour disputes were observed in 2009.
In analyzing the factor of export, import and labour productivity there would be
approximately a loss of NRs 1.8 billion due to one day bandha/hadtal. Instead of industrial
growth with a skilled employment generation there is a negative growth of employment
generation and industrial activities.
For this scenario the industrial growth and employment generation is most important to up-
hold the Nepalese economic. This is only possible with a productive, remunerative and
sustainable economic development. And this can be achieved when the youth will have
access to employment possibilities according to their skills
However, Nepali industries or employers are regularly seeking for skilled and experienced
persons. Skilled and trained youth are scattered elsewhere and compelled to leave the
country because of the lack of related information on employment
opportunities/possibilities in Nepal. Therefore, it is urgently required to build up a
mechanism that will serve a link between the skilled human resource and the industries that
have job available.
1 -CBS estimation 2009
2 -Nepal labour Force Survey, 2008

11
1.1.2 Labour force and their productivity
Nepal Labour Force Survey (NLFS) 2008 estimated a Labour force participation rate is 83.4%
(age 15 years and above) i.e. nearly 1.18 million people are currently employed. Base on the
classification of the industry 73.9 % work in agricultural sector and 26.1 % in other sectors.
Labour underutilization rate was estimated to 30.0% including unemployment 2.1%, time
related underemployment 6.7%, inadequate earning 8.1% and Skills mismatch 13.2%3.
The figures clearly indicate that there is the need to adjust skills mismatches. Even, people
employed in the industries do not have sufficient vocational/skills development training that
result in the decrease in productivity. Labor productivity is low in Nepal. Labor productivity
in the non-agriculture sector has declined by 14% (U$ 1061/ per person in industry) during
the last decade (1995/96-2003/04) 4 but annual wage increase (in current price) 12% in
manufacturing and 9% in construction between 2005-2007. Nepal slipped to 121 rank in
2009 from 111 rank in 2008 (rankings on the ease of doing business).
Nepal is also suffering from “Dutch diseases” (increasing overseas employment
opportunities, out-migration, increasing remittances but decline in productivity and
inflexibility in hiring). These are serious problems for overall investment climate of the
country. However, the study has tried to diagnose the investment climate, its growth and
industrial relation dimension.
1.2 Objective of study
The main objectives of industrial relation situation and economic Survey of Private sector
Enterprises in Nepal – Industrial relation, Productivity, Wages, and Working Conditions-
2009/2010 are as follows;
To prepare the base line information on the different aspects of industrial relation,
employment, productivity, wages and working condition;
To analyze the current industrial relation situation and issues pertaining to the
promotion of IR in Nepal
To establish research base information system at FNCCI.
3 -Nepal labour Force Survey, 2008
4- Reinvigorating Private Sector Development by Dr. Shankar Sharma, 11 April 2009
12
Chapter II
2.1 Methodology
The research study is based on the primary data/information taken from the industries. All
the industrial zones are stratified into three regions - the eastern, the central and the
western covering both the hilly and terai areas. Samples were drawn on the basis of
purposive sampling technique considering Probability Proportional to Size (PPS). A period of
three months was given to the team of research consultant and six experienced field
enumerators for the collection of information from the field. Accordingly, the information
was collected from Kathmandu, Lalitpur, Bhaktapur, Bara, Parsa, Makawanpur, Rupandehi,
Kaski, Morang and Sunsari.
Scheduled questionnaires were provided to collect information from the field. To minimize
the respondents’ biasness, higher level management personnels were interviewed for in-
depth and reliable information.
2.2 Sample size
The survey selected a total of 250 samples from major industrial centers comprising of
industries related to manufacturing, hotel, textile/ clothing, beverage/ food etc. Out of
them, 220 are manufacturing industries and 30 are hotel industries. The sample size was 150
for small, 75 for medium and 25 for large scale establishments. The samples were selected
from each industrial region as designed in the sampling technique.
Multi-national industries and hotels located outside the industrial zone are also covered
during the selection.
2.3 Sample design
The sampling design is based on two stage stratified sampling technique. The development
regions are considered for stratification. In the first stage, the development regions are
divided into three strata according to geographical location. The prescribed 10 districts are
selected as Primary Sampling Units (PSU) from hilly and terai area in the second stage. After
then, the sampling units are selected by Probability Proportional to Size (PPS) from each PSU
covering at least 10% of the industries with Purposive Sampling technique. For the reliability
of field work, and to make the survey more representatives, the FNCCI local network (district
chambers of commerce and industry) at local level were fully mobilized.

13
2.4 Sample frame
The lists of industries in different industrial zones and the “Census of Manufacturing
Establishment of Nepal, 2006-07” are taken as sample frame. The Central Bureau of
Statistics, which conducts the census of Manufacturing Establishment every five years does
not take the establishment having 10 or less than 10 workers into consideration. As a result
of which, the complete list of the industries according to the given classification is not
available.
Therefore, to make the survey more representative, the list of hotel industries available
from Hotel Association of Nepal (HAN) and the list of industries employing 10 or less than 10
workers registered in the Ministry of industry and Commerce are also taken into
consideration as sample frame.
However, the Industrial Industries Act 1992 has classified the establishments into three
groups in terms of capital investment. But for the purpose of this study, the sizes of the
establishments are categorized according to the number of employment as shown below:
I. Industry having < 50 workers - Small Scale establishment
II. Industry having < 50 and <200 workers- Medium Scale establishment
III. Industry having >200 workers – large Scale establishment.
2.5 Sampling errors and non sampling errors
As in all surveys, the results may be having two types of errors, mainly sampling and non
sampling errors. The sampling errors, in statistics, are fairly less in the survey and non
sampling errors are likely to be more. Therefore, every effort has been made, at all stages of
the survey, to minimize the non-sampling errors.

14
Chapter III
3.1 Survey questionnaire
Structured questionnaire was designed to cover more sectors and most of the components
to fulfill the objectives of the survey. The questionnaire has three major parts consisting of
41 sub questions. The questionnaire was, then, pre-tested in three industrial zones mainly,
Patan, Balaju and Biratnagar industrial zone. Series of consultative meetings were conducted
with concerned District Chambers of Commerce and Industry and other related stakeholders
at the field level in relation to the process of designing and finalizing questionnaire. The
questionnaire was then standardized from the feedback received from them.
The questionnaires both in English and Nepali version are attached in Annex I.
3.2 Organization of fieldwork
The survey activities were conducted by the staff and the research consultant of Employers’
Council, FNCCI. Altogether six enumerators were employed to undertake fieldwork in
different regions - two for Kathmandu valley, two for Morang and Sunsari , one for Kaski and
Rupandehi and one for Bara, Parsa and Makawanpur .
Enumerators having bachelor’s degree and sound field work experience were selected for
filling the questionnaires in the selected regions. One day intensive orientation programme
on survey operation was conducted. Various topics were covered in the survey. The
enumerators were also given the sample list of industries for data collection. The field pre-
test was carried out in three industrial zones namely Patan, Balaju and Biratnagar. The
questionnaires are prepared in both English and Nepali version.
3.3 Data collection
The data collection was carried out from the month of October to the end of December 2009
after giving orientation to the enumerators. Supervision of the data collection was done by
the concerned District Chambers of commerce and industry. Monitoring was also done
through telephones from FNCCI and the completed questionnaires were randomly cross-
checked by contacting the concerned industries.
The questions and the choices of the responses were coded for better data entry, data
management and their analysis.

15
3.4 Data management
The data entry application is developed in Access Software Package. Three data entry
operators were trained for 2 days at FNCCI office on data coding, editing, scanning, entry
and verification. Only after that, they were engaged for data entry work. The data entry
work was finished within one month.
After completion of the data entry in computers, the data tabulation and analysis were done
by using SPSS software package. In report writing, Ms-word and Excel were used.
Accordingly, the data management, analysis and report writing were done. The hard copies
of all questionnaires are available in the FNCCI office, Teku.
3.5 Survey limitation
In the survey, an effort was made to cover all the industries listed in the sample and
accordingly interviewed. However, very few industries could not be reached for the
interview because of various constraints like lack of time, unavailability of responsible
personnel in the enterprise, reluctance to provide information etc.
Despite every effort to minimize other limitations, we acknowledge the usual difficulties
inherent in the survey covering all sectors and locations of the country.

16
Survey Findings
Industrial Relation Survey – Part I:
Chapter IV
4.1 Proportion of samples by regions and districts
Development Regions Districts Number of industries
Eastern Morang
Sunsari
65
25
Central Kathmandu
Lalitpur
Bhaktapur
Bara
Parsa
Makawanpur
Rupandehi
30
45
20
7
8
5
5
Western Kaski 45
Total 250
4.2 Proportion of sample by districts and sectors
Districts Number of
industries
Manufacturing
Industries
Hotel Industries
Morang
Sunsari
65
25
65
25

17
Kathmandu
Lalitpur
Bhaktapur
Bara
Parsa
Makawanpur
Rupandehi
30
45
15
7
8
5
5
25
44
15
7
8
5
5
5
1
Kaski 45 21 24
4.3 Selection of sample by region
Table 1
Selection and response of
enterprise by region
Development regions
Eastern Central Western Total
Total Sample Selected for each
region
90 110 50 250
Sample size in % 37.4 42.5 20.1 100
Number of industries interviewed 82 93 44 219
Response in % 91 85 88 88
Sample proportion 36 40 20
The ratios of samples are taken in the proportion of 36:40:20 for the eastern, central and
western region.
Figure 1

18
4.4 Selection of industries by sectors
Table 2
Sectors by percentage
Development Region
Eastern Central Western Total
Construction 6.10 8.60 2.27 6.39
Manufacturing Beverage/food 17.07 11.83 29.55 17.35%
Manufacturing(textile/clothing) 17.07 10.75 2.27 11.42
Manufacturing chemicals 10.98 13.98 0.00 10.05
Manufacturing electrical
appliances 13.41 6.45 0.00 7.76
Restaurants/ hotel Industry 0.00 3.23 54.55 12.33
Manufacturing others 35.37 45.16 11.36.000.00 34.708.22
100.00 100.00 100.00 100.00
Other manufacturers include those manufacturing plastic goods, adhesive, GI pipes, wood
carving, lubricants, printing material, statue (metal or wood).
Figure 2

19
4.5 Type of industries on the basis of ownership and capital structure
Table 3
Industries/company
Capital structure investment in %
Indigenous capital 100%
Joint venture corporation(more than 50% indigenous capital)
Joint venture corporation (50% indigenous , 50% foreign)
100% foreign
Total
Typ
e o
f o
wn
ersh
ip Sole
proprietorship 21.46 0 0 0 21.46
Partnership 8.22 0 0.46 0 8.68
Private 62.56 0.46 1.83 0.46 65.30
Public 2.74 0.46 0 0 3.20
Government 1.37 0 0 0 1.37
Total 96.35 0.91 2.28 0.46 100
The bi-variate table analyzed the investment of capital structure vs. ownership type. Among
different types of ownership, it is found that private companies constituted 65.3% and sole
proprietorship firms, partnership firms, public companies and Government Companies
constituted 21.46%, 8.68%, 3.2% and 1.37% respectively. Out of 219 industries, industries
with indigenous capital constituted 96.35% ; joint venture companies having 50% indigenous
capital and 50 % foreign investment constituted 2.28%; joint venture companies having
more than 50% indigenous capital constituted 0.91% and industries having 100% foreign
capital investment constituted 0.46%.
The survey showed that the number of private companies having indigenous capital
investment is significantly higher than other companies. It is also noticed that only the
private companies have adopted the partnership approach for more capital investment.

20
Chapter V
5.1 Number of workers on the basis of classification of industry
Figure 3
In the survey, industries are classified into small, medium and
large on the basis of the number of workers in the industries. Any
industry having equal to or less than 50 workers is categorized as
small scale industry. Similarly, any industry having 51 to 200 is
categorized as medium scale and any enterprise having more than
201 workers is categorized as large scale industry. In the survey, 65.75%, 24.66% and 9.59%
of the industries represent small scale, medium scale and large scale industries respectively.
5.2 Employment practice
Industries in Nepal are adopting different types of recruitment system. The study showed
that 64.9% of the recruitment of the workers is done through personal contact and around
2.7% through private recruitment agencies or labour providers. Advertisement in news
paper, internal promotion system, posting vacancy announcement in the notice board are
some of the major methods of recruitment system adopted in the industries.
Figure 4

21
5.3 Recruitment process on the basis of type of ownership
The survey showed that personal contact is the most popular method of hiring in most of the
companies with an exception to public companies. Some other methods mentioned in the
table 4 are also adopted by different types of business organizations.
Table 4
Method of recruiting
Type of ownership
Sole proprietorship Partnership
Private Company
Public Company
Government own Company
Advertising in news paper 11.43 22.3 13.31 28.57 60
Posting vacancies in the board 5.71 9.3 4.56 7.14 10
Internal promotion 4.29 7.21 13.69 21.43 25
Private recruitment agencies or labour providers 0 5.48 1.52 0 0
Personal contact 54.29 45.71 40.3 14.29 5
Others 24.29 10 26.62 28.57 0
Total 100 100 100 100 100
Figure 5

22
5.4 Availability of skilled workers
The survey showed that 54% of the industries employed skilled workers as per their need.
The remaining 46% of the industries are not able to find skilled workers as per the nature,
demand and need of their industries. 46.6% of the respondents have been expecting to
provide skill training to workers through FNCCI. They have made a suggestion to FNCCI to
establish a training centre, so that it can help them to find skilled workers easily. Production
of skilled workers through needs base training, testing of their skills and establishment of
employment information centre will be a fruitful step. However, there must be a good link
with the industries so that the trained workers can be supplied to those who require them.
FNCCI can play an important role in this area of interest.
23
Chapter VI
6.1 Increase or decrease in work force
In 2007, 24.5 % of the industries recorded the increase in the number of the workers to an
average of 10. Out of those industries surveyed 75.5% of them did not have any change in
the number of workers. However, the maximum number of workers increased by the
industries was found to be 145 and the maximum number of workers reduced by the
industries was 15.
In 2008, 41.2% of the industries recorded the decrease in the number of workers to an
average of 5. The report also showed that 59.8% of the industries did not have any change
in the number of workers in this year. However, the maximum number of workers increased
by the industries was found to be 160 and the maximum number of workers reduced by the
industries was 600. The survey also showed that the number of workers increased or
decreased was between the range of 8 to 40.
In 2009, 37.3% of the industries recorded the increase in the number of workers to an
average of 2. The report also showed that 62.7% of the industries did not have any change
in the number of workers in this year. However, the maximum number of workers increased
by the industries was found to be 600 and the maximum number of workers reduced by the
industries was 600. The survey also showed that the number of workers increased or
decreased was between the ranges of 15 to 35.
6.2 Capacity expansion of the industries
Most of the large and medium scale industries were found to be interested in expanding
their existing capacity in next two years. It is also found that 33.3% of large scale; 48.1% of
medium scale; and 61.9% of small scale industries have been planning to expand their
existing capacity. However, 66.7% of large scale, 51.9% of medium scale and 34.7% of small
scale industries did not like to bring any change in their existing capacities. It is also found
that only a small percentage of small scale industries are planning to reduce their existing
capacities.
It is found that on an average, 51.14 percent of the industries are willing to expand their
existing capacity; 47.03 percent of the industries are willing to maintain the existing capacity
and only 1.83 percent of the industries are willing to reduce their existing capacity. The
detail figures are given in table 5 below:

24
Table 5 Figure 6
Willingness of industries Percentage
Expansion of Capacity 51.14
Maintaining existing capacity 47.03
Reduction of capacity 1.83
Total 100.00
Table 6 Figure 7
Type of industry
Capacity Expansion
Maintaining existing capacity
Capacity Reduction
Small 61.90 34.70 2.50
Medium 48.10 51.90 0.00
Large 33.30 66.70 0.00
6.3 Recruitment
Referring the survey period, it has been observed that 60.7% of the industries have not
recruited any new worker during the period of September 2008 to August 2009. It is found
that the number of workers recruited varied from 1 to 600 for the rest of the industries. A
few large scale industries while establishing their businesses recruited large number of
workers ranging from 100 to 600. Among the rest of the industries, many of them were
found to have recruited the workers in the range of 10 to 35.
6.4 Recruitment pattern
In the survey, it is found that most of the industries preferred to hire those persons having
good experience, skills, education and physical fitness. Where as 59.9% of the industries
were found to have given less preference to women, disabled, elder, ethnic minorities,
literate etc. However, the trend of hiring women in the service sector industries is found to
be relatively high. The rate of preference for hiring women, disabled persons, persons
desirous of working for long time, ethnic minorities in the manufacturing industries are
8.2%, 3.2%, 0.5% and 5.9% respectively.

25
Chapter VII
7.1 Type of employment contract
The survey provides a lot of information on employment contracts. It is found that different
types of employment contracts are used for permanent status, contractual,
casual/temporary, piece rate, workers supplied by labour suppliers and others. Out of them,
44.6% of the workers are found to be working under permanent status, 20.6% - contractual,
0.7% - supplied by labour providers, 15.0% - casual/temporary, 18.6% - piece rate and the
remaining 0.5% - other group.
It is also found that most of the industries prefer more than one type of employment
contract. The report showed that out of 219 industries, permanent workers are found only in
145 industries; piece rate workers are found in 92 industries and only 15 industries are
found to have hired workers through the labour providers. There are also some other types
of employment contracts found in 100 industries used for monthly, part-time or seasonal
workers.
7.2 Leave facilities
It is found that 89.9% of the industries have provided sick leave to their workers. The
duration of sick leave varied from 7 to 15 days in a year. In case of maternity leave, it is
found that 72.1% of the industries have been providing 45 days of maternity leave on an
average. 93.3 % of the industries are found to be providing public holidays. The number of
public holidays provided in these industries ranged from 12- 18 days. In the same manner,
68.5% of the industries are found to be providing mourning leave ranging from 13 to 15
days. However, only a few industries are found to have been providing paternity leave.
Table 7
Leave Facilities Average number days
% of industries
Standard deviation
Sick leave 9 89.9 3.5
Maternity leave 45 72.1 9.8
Home leave / annual leave
16 71.2 7.4
Mourning leave 14 68.5 1.5
Public holidays 15 93.6 4.8
Paternity Leave 5 2.6 2.7

26
7.3 Benefits and facilities
The survey shows that many of the industries are found to have provided different types of
benefits in addition to those required under the existing labour law. Performance allowance,
Dashain allowance, productivity bonus, house rent, medical allowance, transportation
allowance etc are some of the facilities and benefits provided to the workers. Dashain
allowance is another type of allowance provided by 64.4% of the industries. Where as only
5.5% of the industries are found to have provided the educational allowance. The detail
figures are presented in following table 8 below:
Table 8
Types of allowance Percentage Performance allowance 16.9 Productivity bonus 48.4 Clothing allowance 47.5 Transportation allowance 23.3 Dashain allowance 64.4 Education allowance 5.5 Shift allowance 24.2 Credit / loan service 11 Meal allowance 30.1 House rents 40.2 Medical allowance 59.4
Normally some of the benefits like provident fund are provided to the permanent workers. Out of 219 industries, 83.5% of them have been providing such benefit to the permanent workers. Accident and medical benefits are some of the social security benefits provided by more than 45% of the industries. Depending upon the conditions, other benefits provided are retirement benefit, education allowance, shift allowance, hospitalization benefit, life insurance, pension benefit, bereavement or burial benefit. These benefits are provided by less than 10 % of the industries.

27
Chapter VIII
8.1 Communication in enterprise
Communication in every enterprise is very important for building trust between the management and workers. It helps the overall development process including social dialogue within the enterprise. It is found that one or other form of communication mechanism existed in 77.6% of the industries surveyed.
There are various approaches of communication adopted in industries like regular meeting between the management and union, supervisor and workers and the meeting with the task force, productivity group, different departments etc. 19.6% of the industries are also found to have used the suggestion/complain boxes. These boxes are usually cleared within the period of one week to one month. Table 9 shows the detail presentation:
Table 9
Mode of communication Percentage
Communication with Trade union 52.5
Regular meeting between supervisor and worker 55.3
Daily inspection of the workplace by the management 41.6
Task force meeting 7.8
Productivity improvement group meeting 11.9
Suggestions and advice to workers 22.4
Meeting of different departments 5.3
8.2 Labour management relationship
Relationship between management and workers is measured with the help of four scales.
From the survey, it has been found that 22.3% of the industries have very satisfactory
relationship between workers and management, where as only 2.8% of the industries have
poor relationship between them. The detail assessment is found in the table 10 below:
Table 10
Labour Management Relation Percentage
Very satisfactory 22.3
Satisfactory 26.5
Average 35.6
Unsatisfactory 12.8

28
Poor 2.8
Total 100 8.3 Collective bargaining process
Figure 8
Collective bargaining process is still a new concept for the
industries of Nepal. It has been observed that only 16.4% of the
Industries have been following collective bargaining process in
their industries. It seems that some of the industries have started
this practice recently from the year 2009.
8.4 Dismissal
It is found that the workers are dismissed from the job for various reasons. The causes for some of the cases of dismissal occurred during the period of 2007 and 2008 were theft, assault, absenteeism, frequent delay in attending the workplace, damaging of properties of the enterprise, bad behavior and alcohol drinking during working time, immoral activities and fraudulent acts. The maximum number of dismissal cases in 2007 and 2008 was related to fraudulent acts. The detail information with figures is given below in the table 11:
Table 11
Causes of dismissal Year
2007 2008
Theft 7 7
Assault 0 4
Absenteeism 10 8
Tardiness 3 4
Damaging property of enterprise 1 1
Recurring illness 0 1
Alcohol drinking during working time 1 4
Fraudulent acts 10 15
Other not specified 3 4
8.5 Industrial disputes
The major causes of dispute reported in the survey are frequent claim for the increment of
wages and benefits, claim for having permanent status, enforcement problem of labour law,
non implementation of collective bargaining agreement, unhealthy competition between

29
trade unions etc. The number of industrial disputes reported from among the industries
surveyed is as follows:
Table 12
8.6 Dispute resolution and mediation
It is found that out of 219 industries, 86 industries suffered from industrial disputes in 2008;
where as only 53 industries were reported have suffered from industrial disputes in 2009
and 33 in 2007. Most of the disputes were resolved within the industries with the
involvement of management and trade union representatives. However, 11.4% of the
disputes were resolved through mediation with the help of Labour Offices. Some of the
industries did not want to report about the industrial actions and their resolution.
It has been found that grievance handling committee, labour management committee and
voluntary mediation council are some of the bodies formed at enterprise level to handle
industrial action as well as settle dispute. 96.7% of the cases were found to have been
settled within the period of up to 30 days; where as 3.2% of the cases were found to have
been prolonged for more than one month.
8.7 Industrial actions
Different types of industrial action such as strike, mass leave, slow down, refusal to work
overtime, interruption of work, gherao/picketing, lockouts etc. are reported in the survey. It
is reported that internal conflicts, wage determination, non compliance of the law and rules,
promotion issue are some of the main causes of industrial actions. Some of them are the
result of political motivation/polarization within the trade union movement also. Some of
the industrial actions noticed during the past three years are given below in table 13.
Year Number of disputes
2007 33
2008 86
2009 53

30
Table 13
It is found that the causes for most of the industrial actions were wage increment, claim for appointment letter and permanent status, layoff/downsizing, leave benefits, dismissal/disciplinary action, working hours, overtime, working conditions, occupational health and safety measures, change in working time, payment of allowances, and training and development. In some industries, industrial actions occurred because of more than one reason. The reasons for industrial actions can be summarized and presented as follows in table 14:
Table 14
Causes Percentage
Wage increment and payment of allowances 46.2
Claim for appointment letter and permanent status 14.3
Layoff or down sizing 3.1
Leave benefits 5.6
Dismissal or disciplinary action 1.7
Working hours and overtime 8.5
Working conditions 4.3
Occupational health and safety measures 6.4
Change in working time 4.2
Training or development 3.2
Not specified 2.5
8.8 Duration of industrial action
It is also found that 33.3% of the industries have lost more than 15 working days because of
industrial action. It is found that the industries took one to fifteen days to solve the problem.
Type of industrial action Percentage
Strike 39.2
Slow down 14.2
Refusal to work overtime 16.4
Interruption in work 14.2
Gherao/picketing 6.8
Lockout 4.1
Not specified 5.1

31
18.4% of the industries were able to solve their problems between 2 to 5 days. However,
27.9% of the industries were not willing to disclose about the information on industrial
action in their industries. There are some arrangements adopted by different industries to
overcome the loss incurred during industrial action. 22.4% of industries did not make any
effort to do so. Most of the industries managed to operate by requiring the workers to work
overtime.
8.9 Unions in the industries
After the restoration of democracy in 1990, trade union activities gradually increased at
enterprise level. Trade unions became more aggressive for the establishment of their rights.
All the trade unions became active in increasing their members. After the second mass
movement in 2006 against the Royal regime, some new trade unions also came into
existence and raised various demands. As a result of which the competition among them has
become tough. They have been vying with each other for the dominance in the industries.
At the same time, their interference in the industries is growing.
In the survey, it is found that the maximum number of trade unions reported in an
enterprise is 5. The survey also showed that 31.5% of the industries do not have trade
unions. Meanwhile, 36.9% of the industries are reported to have 1 and 24.7% of the
industries are reported to have two unions.
Table 15
No of Trade unions
No of industries Percentage
0 69 31.5
1 81 37.0
2 54 24.7
3 7 3.2
4 6 2.7
5 2 0.9
Total 219 100

32
Enterprise Economic Survey - Part II:
Chapter IX
9.1 Wage pay system
The survey found that 74.3% of the industries have been paying more than or equal to minimum wages fixed by the Government of Nepal. It is also found that the payment of wage is normally made on monthly, daily and piece rate basis. 92.2% of the industries have been paying on monthly basis. Some of the industries are found to have adopted more than one mode of payment such as weekly payment or payment on the basis of task. The figures are summarized and presented as follows in table 16:
Table 16
Payment system Percentage
Daily basis 2.4
Monthly basis 92.2
Piece rate 1.5
Task or weekly basis 3.9
Total 100
9.2 Wage pay system by gender It is found that 92.7% of the industries do not have different pay system for male and female workers. However, only 7.3% of the enterprises are found to have adopted differential payment system for male and female workers. It is found that 10.7% of the small scale industries and 8.7% of the small scale industries have been practicing differential payment system; but in large scale industries the payment system for male and female workers is found to be the same.
9.3 Wage pay by categories The survey shows that out of 18900 workers/employees, 19.5%, 16.8% and 63.7% are found to be administrative staffs, technicians and labours respectively. Among them 78% belongs to the categories of minimum range salary/benefits and 22% in the maximum range salary/benefits as provided by the industries. It is found that during the year 2007, 2008 and 2009 the weighted average salaries/benefits of workers is found to be 4774.7, 5253.9 and 7201.1 for administrative workers, 5760.8, 6577.1

33
and 8641.3 for technicians and 4192.1, 5008.2 and 6448.2 for labour. The detail analysis is given in the table 17 below:
Table 17
Workers/employee
by categories
Wage Pattern
Year
2007 2008 2009
Administrative
Minimum 3300 3350 5000
Maximum 10000 12000 15000
Wt. Average 4774.7 5253.9 7201.1
Technicians
Minimum 4000 4200 6000
Maximum 12000 15000 18000
Wt. Average 5760.8 6577.1 8641.3
Labour
Minimum 3400 3600 4600
Maximum 7000 10000 13000
Wt. Average 4192.1 5008.2 6448.2
9.4 Performance evaluation system
The survey shows that there is no uniformity in the performance evaluation system. The system varied depending upon the nature and size of the industries. 51.6% of the industries are found to have done performance evaluation on yearly basis; 5.9% on half yearly basis and 20.1% on quarterly basis. Where as 11.9% of them were found to have carried out the evaluation in accordance with their own prevailing system; and 10.5% of the industries did not have any evaluation system at all.
9.5 Growth and Profitability It is found that the majority of industries did not have any change in their business operations during the year 2007, 2008 and 2009. The profit ratio of the industries is found to be 11.3%, 11.5% and 12.2% on average in 2007, 2008 and 2009 respectively. However, it was observed that the percentages of loss incurred by some industries were 3.5%, 3% and 2.5% in 2007, 2008 and 2009 respectively.
9.6 Productivity The productivity of the workers in the industries seems to vary in different industries. 73.8% of the industries opined that the productivity of the industries has decreased because of the loss of working hours, power shortage, frequent disturbances, unavailability of raw materials in time etc. Lack of skilled workers, absenteeism and poor performance may be attributed to

34
the declining condition of productivity. In spite of these factors, 17.2% of the industries feel that the productivity of industries has remained the same. 9% of the industries said that the productivity of their industries has increased.
9.7 Training Out of 18900 workers, it is found that most of them have been working without having any training. On an average, 69.6% of them do not have specific training related to their job. However they are handling their work through their own experience. The workers in the industries are also found to have categorized the workers into four groups such as highly skills, skilled, semi-skilled and unskilled. However, during the survey, it was difficult to identify the categories of the workers. There was no clear cut system of ranking in the industries surveyed. They are ranked on the basis of their experiences and duration of works.
It is found that 77.2% of the industries were planning to give in-house training to their workers. Most of the employers interested to send their workers for training were not able to find specific training and the training centre as per their need. A few training institutions which have been established have not been able to fulfill the needs of the industries.
9.8 Skill development plan It is found that 41.09% of the industries have skill development plan, 50.2% of the industries do not have such plan and the remaining 8.7% of industries do not have the specific skill development plan in the time of survey but they are planning to make it in the coming year as per the need of their industries.
Figure 9
9.9 Worker by skills and categories The survey shows that according to skills categories, on an average 8% are found to be highly skilled, 31% skilled, 48% semiskilled and 13% unskilled workers. Out of them 31.1% get training for their particular works where as the remaining 68.9% do not have any particular training. According to skills level- a few percent of unskilled and semiskilled workers (3.4%

35
of semiskilled and 0.4% of unskilled) get training for their respective job. The detail summary is given in the table 18 below:

36
Table 18
Categories of workers No of Workers Trained Untrained
Highly Skilled 1512 19.4 80.6
Skilled 5859 7.9 92.1
Semi-Skilled 9072 3.4 96.6
Unskilled 2457 0.4 99.6
Total 18900 31.1 68.9
Figure 10 Figure 11
9.10 Type of product produced by industries
Out of 219 industries surveyed, only 86.7% of industries responded concerning their
products. The ratios of respondents were found to be 21%, 8.7%, 66.1% 3.3% and 1% for
sole proprietorship, partnership, private company public company and government own
company.
It is found that 56.2% industries produce single product, 12.8% produce two, 15.1% produce three and 15.9% produce more than three different types of products. The detail information with figures is given below in the table 19:

37
Table 19
Type of company Number of product produced by the industries
1 2 3 More than 3 Total
Sole proprietorship 8.2 4.6 4.6 3.6 21
Partnership 5.9 0 2.3 0.5 8.7
Private company 40.6 6.8 7.3 11.4 66.1
Public company 1.4 0.9 0.5 0.5 3.3
Government own Company 0 0.5 0.5 0 1
Total 56.2 12.8 15.1 15.9 100
9.11 Production index
Only a few industries responded the survey questionnaire in relation to the production. It was measured for four different quarters of 2007, 2008 and 2009. The average production fluctuation of the industries for four different quarters of 2007 is found to be 101.81, 98.8, 100.02 and 99.97. Similarly, for 2008 and 2009 it is found to be 102.4, 101.9, 98.55 and 99.14 and 99.71, 98.92, 101.32 and 99.71 respectively. It is found that the maximum annual production was increased by 0.15 and 0.50 in 2007 and 2008. The annual average of production index in 2009 is decreased by -0.09. The figures in the table 20 below show the fluctuation of production index in four different quarters of 2007, 2008 and 2009.
Table 20
Year
Production fluctuation by percentage
Average 1st quarter
2nd quarter 3rd quarter
4th quarter
2007 101.81 98.8 100.02 99.97 0.15
2008 102.4 101.9 98.55 99.14 0.50
2009 99.71 98.92 101.32 99.71 -0.09
9.12 Corporate Social Responsibility (CSR)
38
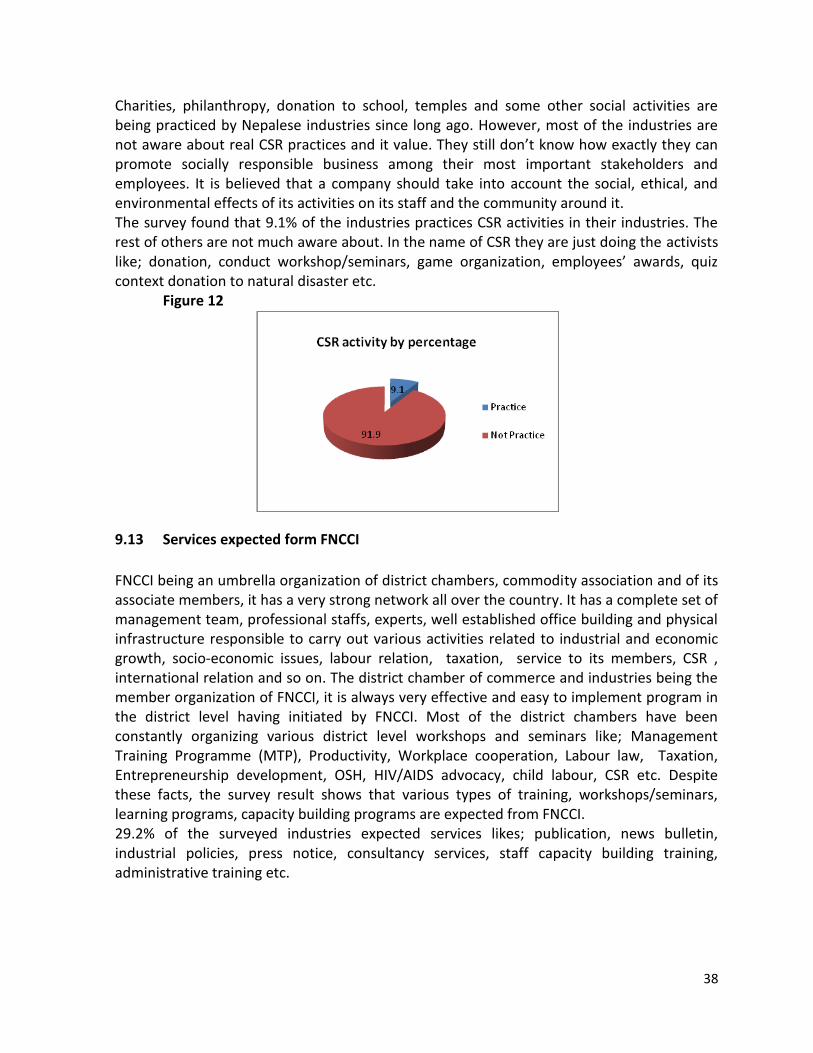
Charities, philanthropy, donation to school, temples and some other social activities are being practiced by Nepalese industries since long ago. However, most of the industries are not aware about real CSR practices and it value. They still don’t know how exactly they can promote socially responsible business among their most important stakeholders and employees. It is believed that a company should take into account the social, ethical, and environmental effects of its activities on its staff and the community around it. The survey found that 9.1% of the industries practices CSR activities in their industries. The rest of others are not much aware about. In the name of CSR they are just doing the activists like; donation, conduct workshop/seminars, game organization, employees’ awards, quiz context donation to natural disaster etc.
Figure 12
9.13 Services expected form FNCCI
FNCCI being an umbrella organization of district chambers, commodity association and of its associate members, it has a very strong network all over the country. It has a complete set of management team, professional staffs, experts, well established office building and physical infrastructure responsible to carry out various activities related to industrial and economic growth, socio-economic issues, labour relation, taxation, service to its members, CSR , international relation and so on. The district chamber of commerce and industries being the member organization of FNCCI, it is always very effective and easy to implement program in the district level having initiated by FNCCI. Most of the district chambers have been constantly organizing various district level workshops and seminars like; Management Training Programme (MTP), Productivity, Workplace cooperation, Labour law, Taxation, Entrepreneurship development, OSH, HIV/AIDS advocacy, child labour, CSR etc. Despite these facts, the survey result shows that various types of training, workshops/seminars, learning programs, capacity building programs are expected from FNCCI. 29.2% of the surveyed industries expected services likes; publication, news bulletin, industrial policies, press notice, consultancy services, staff capacity building training, administrative training etc.

39
Chapter X
10.1 Conclusion
Industrial relation situation in Nepalese industries has undergone a lot of change owing to the internal and external factors within and outside the industries. In the initial phase, the understanding of industrial relation was relatively low; but, the latter phase saw a gradual improvement in the industrial relations scenario. However, the current political instability in the nation has driven the industrial relation to a state of uncertainty.
The finding of the study reveals that the number of the industries under private ownership having indigenous capital investment is significantly higher than the number of industries with foreign investment.
The majority of the industries in the study employ less than 200 workers; while there are very few industries that employ more than 200 workers. This shows the prevalence and dominance of medium scale industries which relatively have limited accessibility to market, productivity and technological advantage.
The concept of collective bargaining has not been able to institutionalize itself. This is evident from the fact that there are only around 17 percent of the industries, which practice collective bargaining. On the other hand, there are also many of the industries which have initiated this process recently.
Recruitment of workers through personal contact and connection is the most common mode of recruitment process in majority of the industries. Recruitment through public advertisement is relatively low. The practice of recruiting workers through personal contact is very common in most of the industries irrespective of their sizes. However, public and government owned industries are found to have followed the recruitment process through advertisement in the newspaper.
The survey report also shows that more than half of the workers employed in the industries surveyed have the required skills to perform their work; while less than half of the workers do not possess the required skills. The mode of hiring workers through personal contact may be one of the primary reasons for the unavailability of the skilled workforce. Also the lack of training institutes and facilities for providing skill-based trainings as per the need of industries is also responsible for this.
With the growing competition in the national and the international market, the industries are under pressure to increase their capacities. Despite majority of the industries are willing to expand their existing capacity, the transitional socio-political situation and unstable security have hampered this.
40
New recruitment was not reported in most of the industries during the period of the survey. This has in fact aggravated the existing unemployment scenario. Economic recession may be one of the primary reasons for less recruitment and retrenchment of the workers in some of the industries.
The industries are also found to have given preference to merit, skills and experience and not other factors like caste, gender etc. Ability to work efficiently is given more importance than preferential treatment to the marginalized group in the recruitment process.
Around 44 percent of the workers in the industries surveyed are employed as permanent workers while others are employed in different modes of employment - like contract, piece rate and daily wages.
Majority of the industries have complied with the provisions of labour law concerning leave facilities, provident fund and Dashain bonus. Industries are also found to have provided different kinds of benefits besides the regular salary.
Majority of the dismissal cases in the companies have occurred due to the misconduct of the workers.
Over all labour-management relationship at the enterprise level is found to be satisfactory.
The survey report also shows that the industries surveyed have experienced almost all industrial actions like strike, slow down, refusal to work overtime, interruption in work, gherao/picketing, lockout.
The trend of unionization and formation of trade unions in the industries is gradually increasing. The existence of multiple trade unions in the industries is a common feature in the industrial sector of Nepal.
10.2 Recommendation
Partnership for skill training – The survey shows that there is a mismatch in the supply and demand of skilled workers. It is important to find out the types of skills required in the labour market. Therefore it is strongly recommended that partnership between training institutions and employers be developed in order to reduce the gap between the need and the supply of skilled workers as per the requirement of the industries.
Formation of permanent wage board - It is found that there is no permanent wage board for the fixation of wage. The process of fixation of minimum wage by the government must be reconsidered so that it does not create differences between the trade unions and employers. Wage is usually determined by means of bargaining in most of the cases. Therefore, it is also recommended that a permanent wage board be formed for providing information and data at the time of review of the wage.

41
Establishment of employment information centre - The survey report shows that there is no information available regarding the employment. It is necessary to create a system so that information on employment opportunities or vacancies can be easily acquired. Labour market information system must be developed. Therefore, the establishment of employment information centers is highly recommended.
Compliance of laws and rules - Compliance of laws and rules is very important for the promotion of industrial relations and maintenance of industrial peace. Disregard of law and rules derails the system and creates problem in the overall development of the industrial sector. It is necessary to follow the system and rules for the common benefit of all.
Enhancement of productivity - Enhancing the industrial productivity is important for the survival of industries. Low productivity has an adverse effect on the overall development of the economy of the country. Therefore, the introduction of productivity based wage system can have a better impact on the improvement of productivity in the industrial sector.
10.3 Definition of used terms
Boycott A form of concerted action by workers and unions to refrain from patronizing the products of their company/enterprise.
CBA Collective Bargaining Agreement – A negotiated contract between a legitimate labour organization and the employer concerning wages, hours of work and all other terms and conditions of employment including mandatory provisions for grievance and mediation/conciliation machinery.
CSR Corporate Social Responsibility ‐ " is the continuing commitment by business behave ethically and contribute to economic development while improving the quality of life of the workforce and their families as well as of the local community and society at large"
Conciliation/Mediation Mode of settlement bringing together the parties in a dispute to come to negotiations and trying to settle the dispute.
Disciplinary Action Action of employer when worker is not fulfilling his duties according to the contract through verbal/written warning, suspension or termination/dismissal.
Dismissal Termination of employment through employer due to misconduct, incompetence of employee etc.

42
Grievance A workers’ s formal complaint regarding working conditions or failure by management to stick to its contract with the employee.
Industrial action Concerted action taken by workers to put pressure on an
employer or from an employer against worker (lock out) to
accede to a demand, usually work‐related, but sometimes of a
political or social nature. It is also resorted to by workers in
protest or in support of a national issue or pronouncement not
arising from conflict between workers and employers.
Examples of industrial action include strikes, overtime bans,
slowdown, etc.
Layoff Termination of employment through employer due to economic reasons. – may be temporary or permanent.
OHS Occupational, Health and Safety – Defined standards for a safe workplace.
Overtime Ban A deliberate refusal of workers and their unions to render overtime work in connection with a labour dispute.
Slowdown A deliberate lessening of work effort for a definite purpose and time.
Strike A temporary stoppage of work by the concerted action of employees as a result of an industrial or labour dispute.
Voluntary Resignation Involves worker volunteering to resign when management calls
for workforce reduction.