Embed Size (px)
Citation preview
Second Quarter 2013
NCCI C fNCCI ConferenceApril 3, 2014
Sasha WeintraubVP, Fuels & Systems Optimization
Second Quarter 2013
NCCI Coal ConferenceApril 25, 2012
Fueling Up within the “Game Changer”
S h W i t bSasha WeintraubDuke Energy
The “Game Changer” is Happening
IHS CERA (September 5, 2012)
“Unconventional gas is changing the energy world. This energy revolution is just
beginning, with the full implications still difficult to discern.”
3
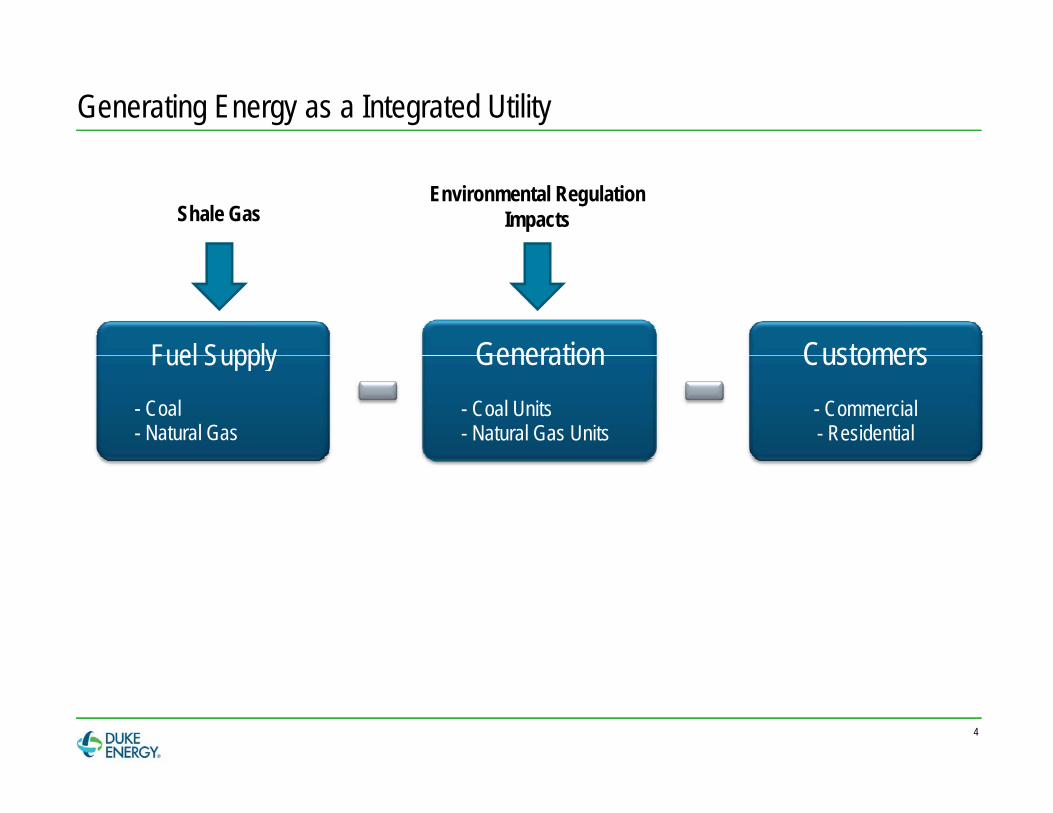
Generating Energy as a Integrated Utility
Environmental Regulation ImpactsShale Gas
Fuel Supply Generation CustomersFuel Supply- Coal - Natural Gas
Generation- Coal Units- Natural Gas Units
Customers- Commercial- Residential
4
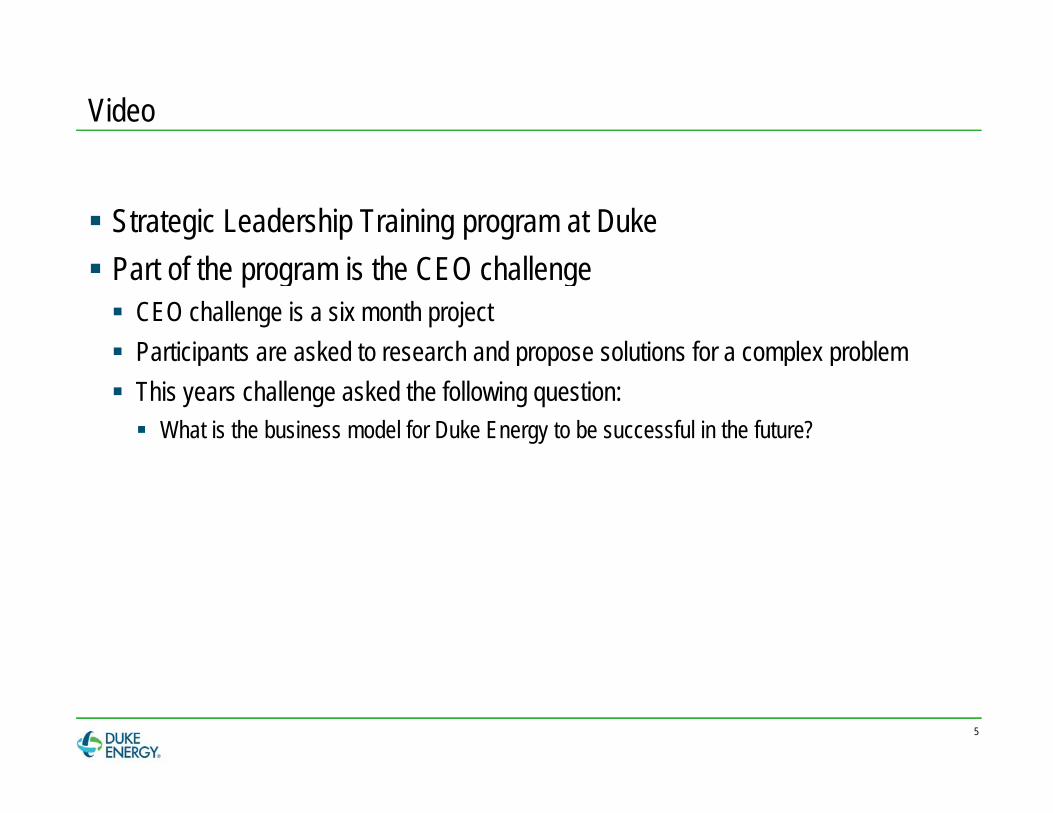
Video
Strategic Leadership Training program at Duke Part of the program is the CEO challenge CEO challenge is a six month project Participants are asked to research and propose solutions for a complex problem Participants are asked to research and propose solutions for a complex problem This years challenge asked the following question: What is the business model for Duke Energy to be successful in the future?
5
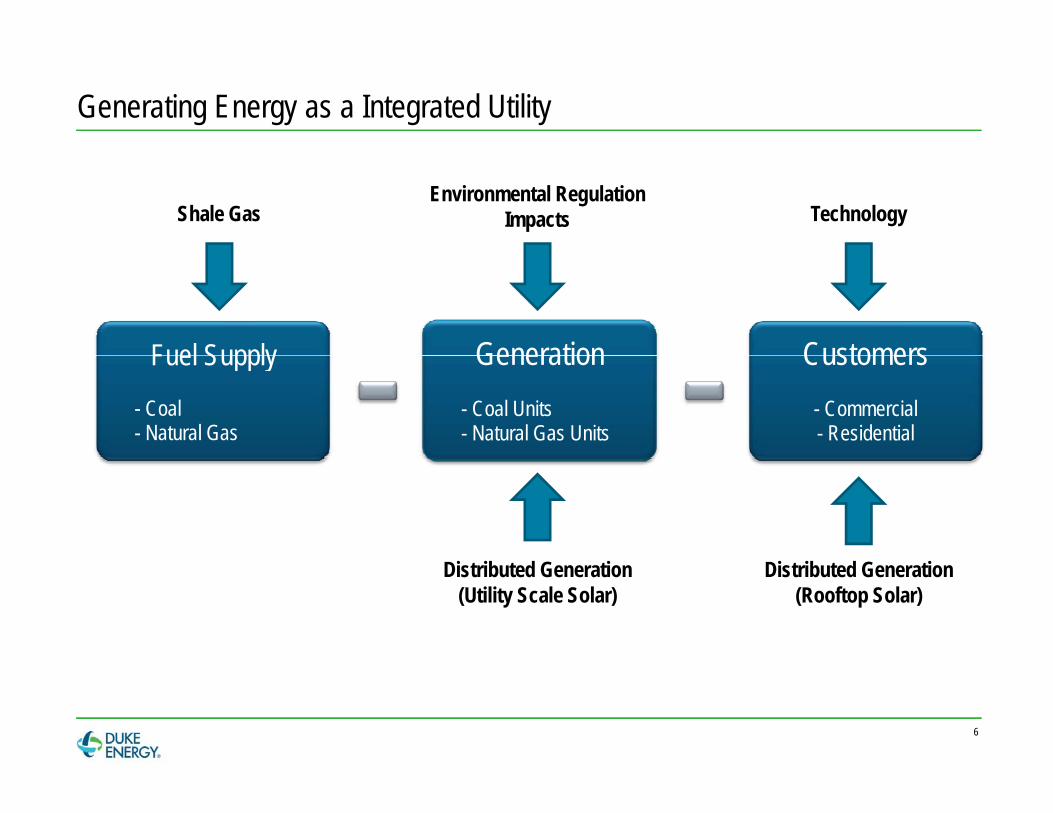
Generating Energy as a Integrated Utility
TechnologyEnvironmental Regulation
ImpactsShale Gas
Fuel Supply Generation CustomersFuel Supply- Coal - Natural Gas
Generation- Coal Units- Natural Gas Units
Customers- Commercial- Residential
Distributed Generation(Utility Scale Solar)
Distributed Generation(Rooftop Solar)
6
Key Messages
Duke Energy supports cost-effective solar energy and recognize it as an evolution of electric generation. $3 billion already invested by Duke Energy in wind and solar $3 billion already invested by Duke Energy in wind and solar An additional $3 billion commitment in renewable energy PPAs
Distributed generation will co exist with our central station generation portfolio and integrated grid Distributed generation will co-exist with our central station generation portfolio and integrated grid. Energy policy must continue to be updated to prepare for the changing marketplace.
We look forward to working with leaders in our jurisdictions to: We look forward to working with leaders in our jurisdictions to: Make solar policies fair for all customers Encourage the use of solar energy Help us spur the economy Help us spur the economy
7
The Germany Experience
Why look at Germany? Frequently mentioned as a world leader in renewable power development ~ 68,000 MWs of wind and solar capacity – about 41% of their entire portfolio
What got them there? Strong desire to combat climate change Rapid subsidy-driven proliferation of wind and solar power, beginning in 2000 Phasing out nuclear units after Fukushima Plans for 35% of energy to be provided from renewables by 2020, rising to 80% by 2050
What is the current status? CO2 emissions are similar to when they began in 2000, and rising Residential customers are paying ~ 34 cents/kWh almost 3x the U SResidential customers are paying 34 cents/kWh, almost 3x the U.S. Industrial customers are paying ~ 15 cents/kWh, ~ 2x the U.S. Rate impacts from renewables are causing a public outcry, with demands to remedy cross-subsidization
issues
8
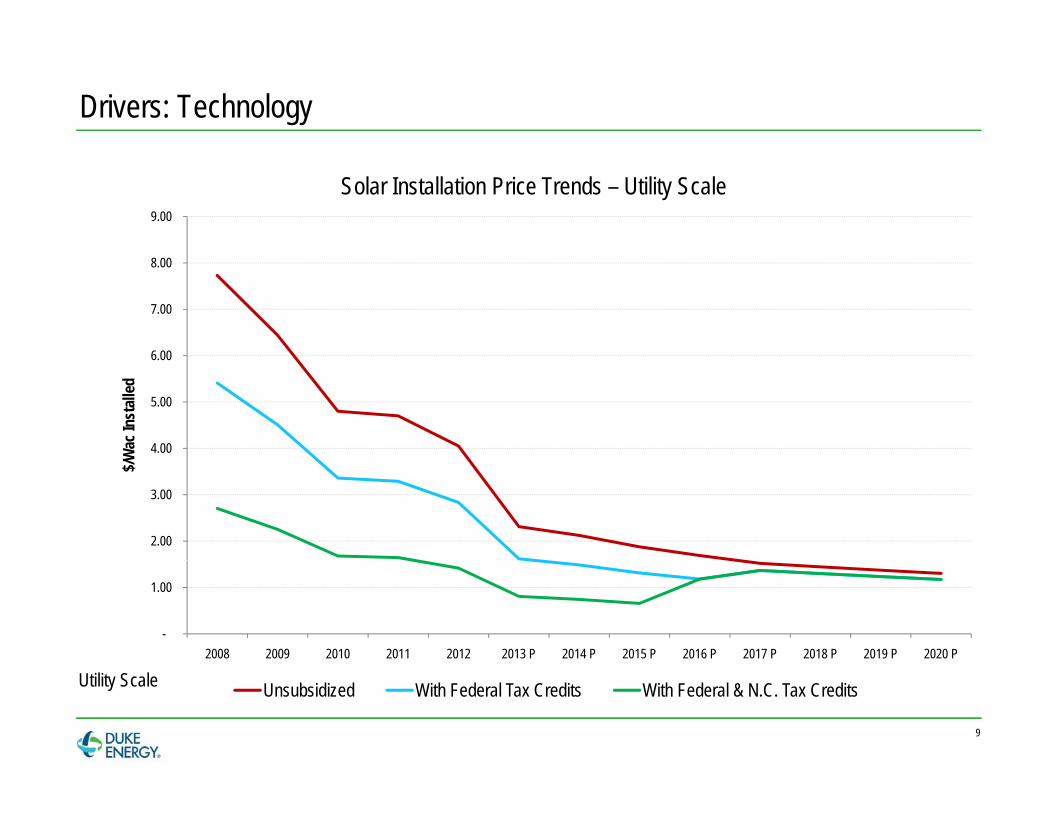
Drivers: Technology
9.00
Solar Installation Price Trends – Utility Scale
6 00
7.00
8.00
4.00
5.00
6.00
Wac
Inst
alled
2.00
3.00
$/W
-
1.00
2008 2009 2010 2011 2012 2013 P 2014 P 2015 P 2016 P 2017 P 2018 P 2019 P 2020 P
9
Unsubsidized With Federal Tax Credits With Federal & N.C. Tax CreditsUtility Scale
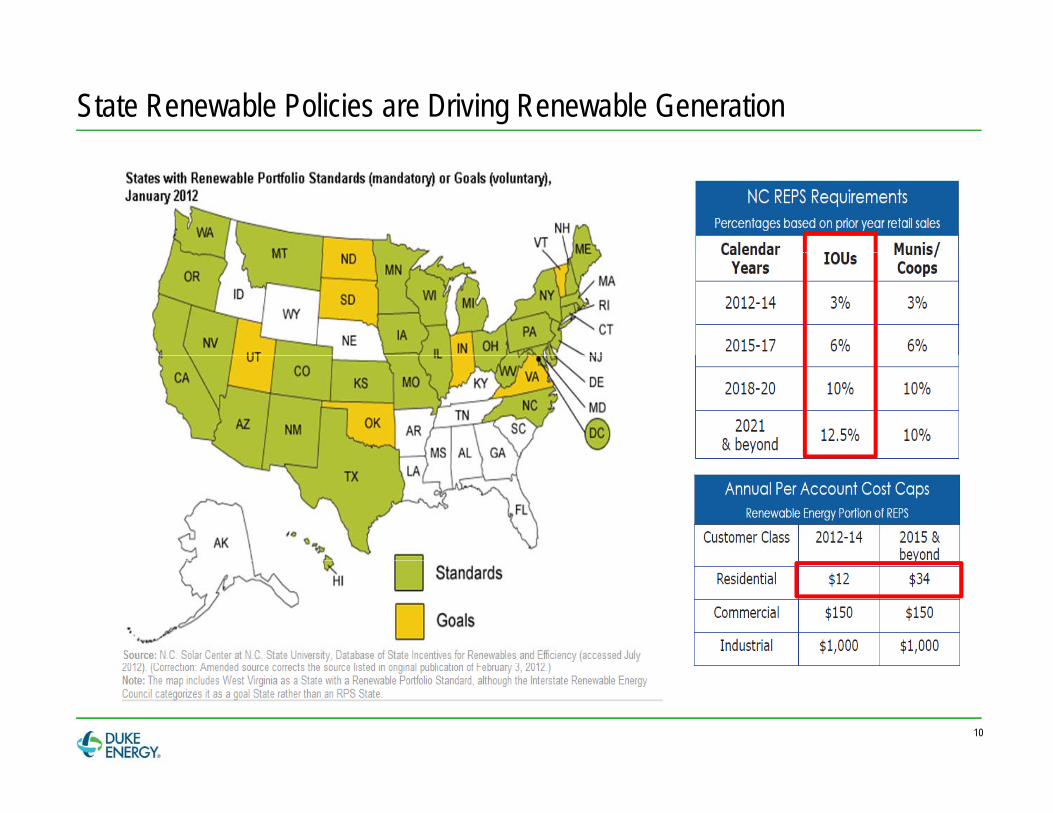
State Renewable Policies are Driving Renewable Generation
10

Drivers: Policy
Source: SNL EnergyOctober 9 2013October 9, 2013Map credit: Jesse Beliavance
11

Second Quarter 2013
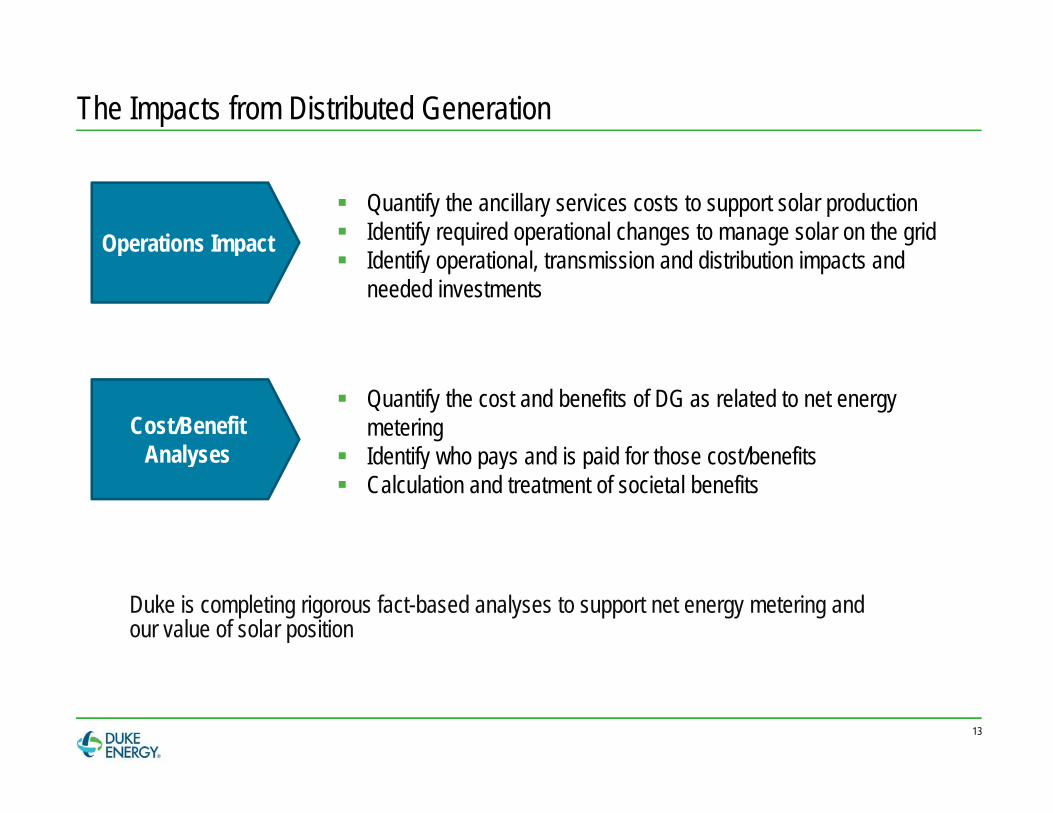
The Impacts from Distributed Generation
Operations Impact Quantify the ancillary services costs to support solar production Identify required operational changes to manage solar on the grid
Id tif ti l t i i d di t ib ti i t d p p
Identify operational, transmission and distribution impacts and needed investments
Cost/Benefit Analyses
Quantify the cost and benefits of DG as related to net energy metering
Identify who pays and is paid for those cost/benefitsAnalyses Identify who pays and is paid for those cost/benefits Calculation and treatment of societal benefits
Duke is completing rigorous fact-based analyses to support net energy metering and our value of solar position
13
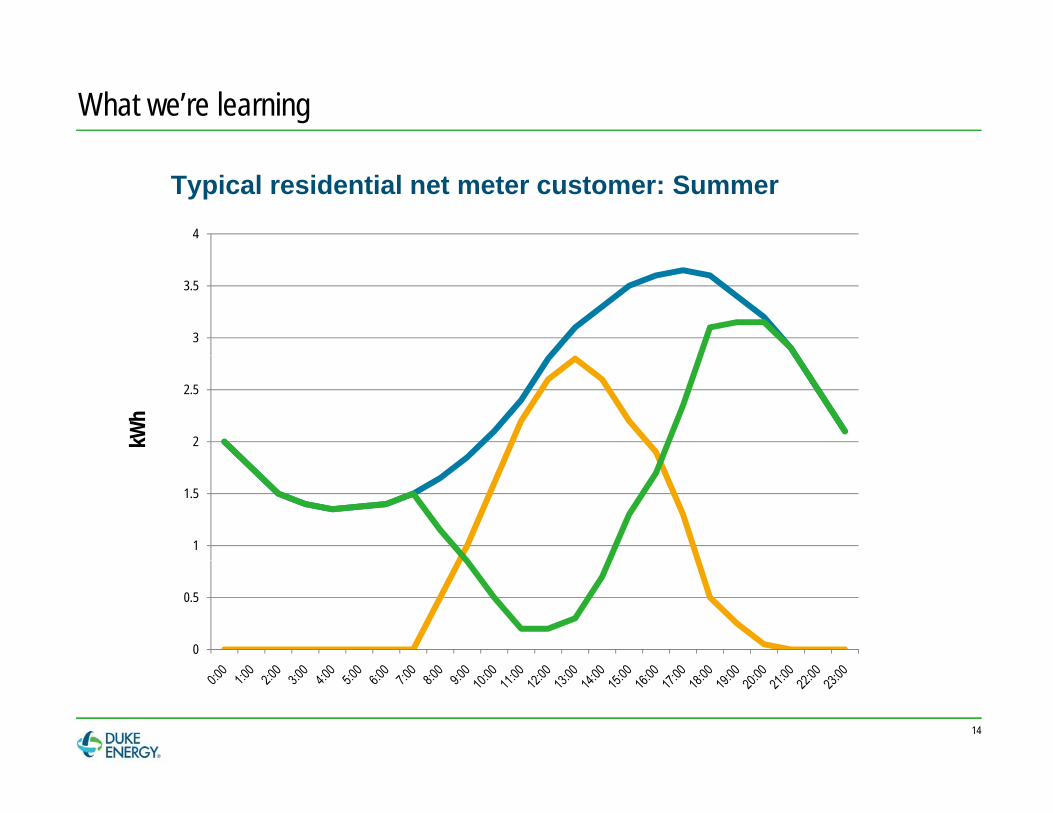
What we’re learning
Typical residential net meter customer: Summer4
3
3.5
2
2.5
kWh
1
1.5
0
0.5
14
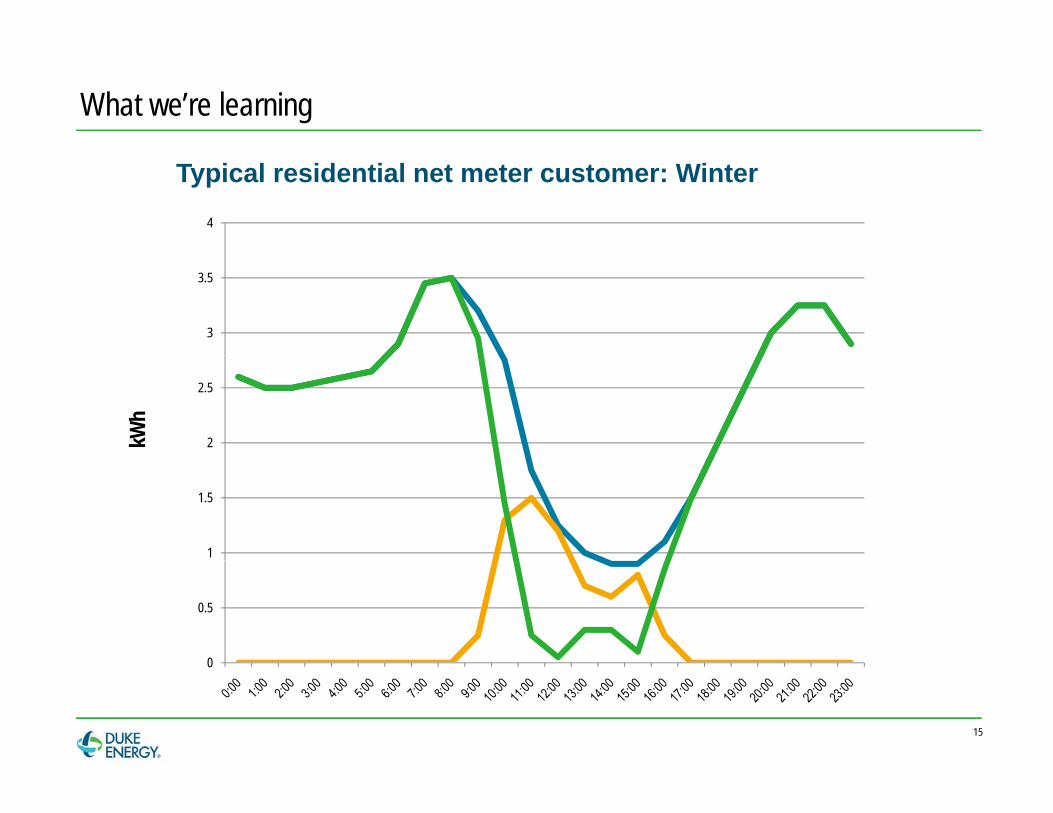
What we’re learning
Typical residential net meter customer: Winter4
3
3.5
2
2.5
kWh
1
1.5
0
0.5
15
0
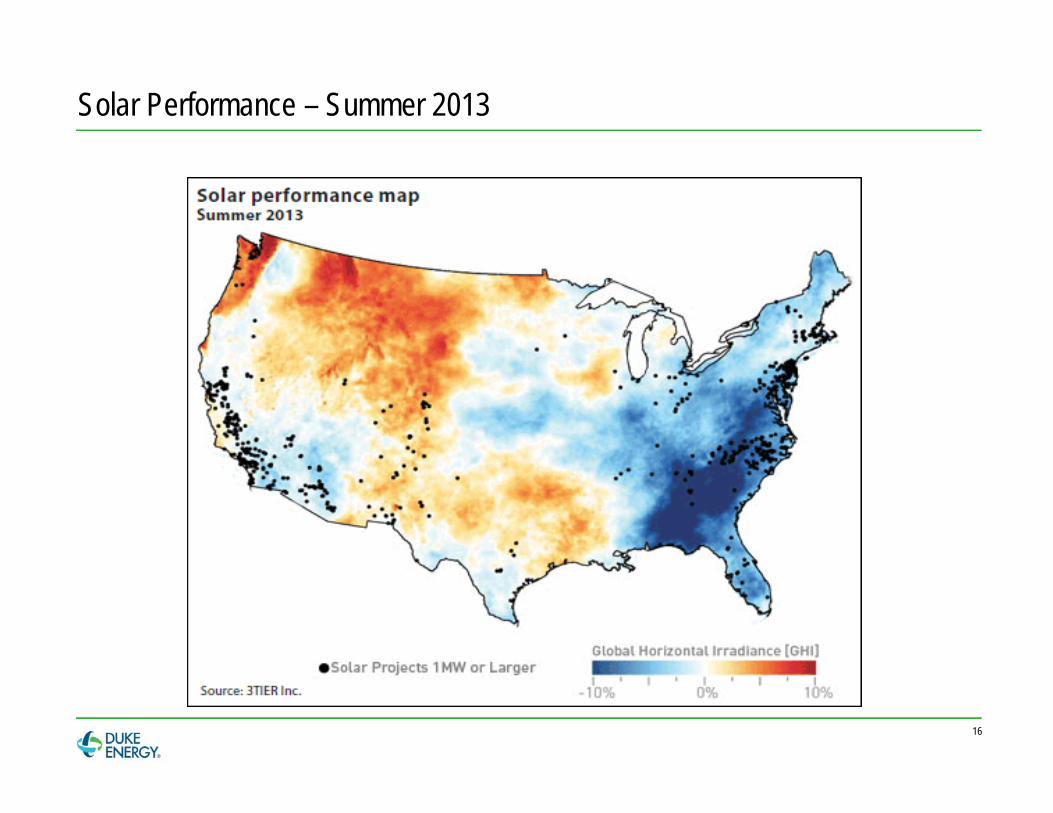
Solar Performance – Summer 2013
16
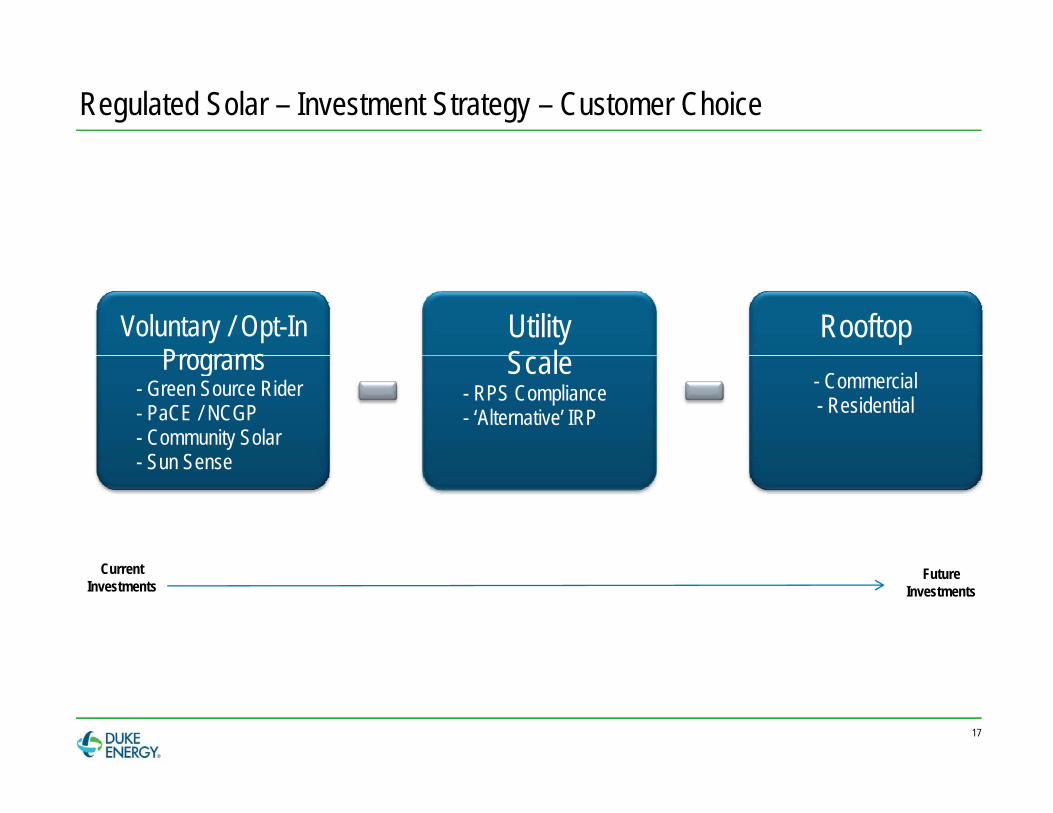
Regulated Solar – Investment Strategy – Customer Choice
Voluntary / Opt-In Programs
Utility S l
RooftopPrograms
- Green Source Rider- PaCE / NCGP - Community Solar
S n Sense
Scale - RPS Compliance- ‘Alternative’ IRP
- Commercial- Residential
- Sun Sense
Current Investments
FutureInvestments
17
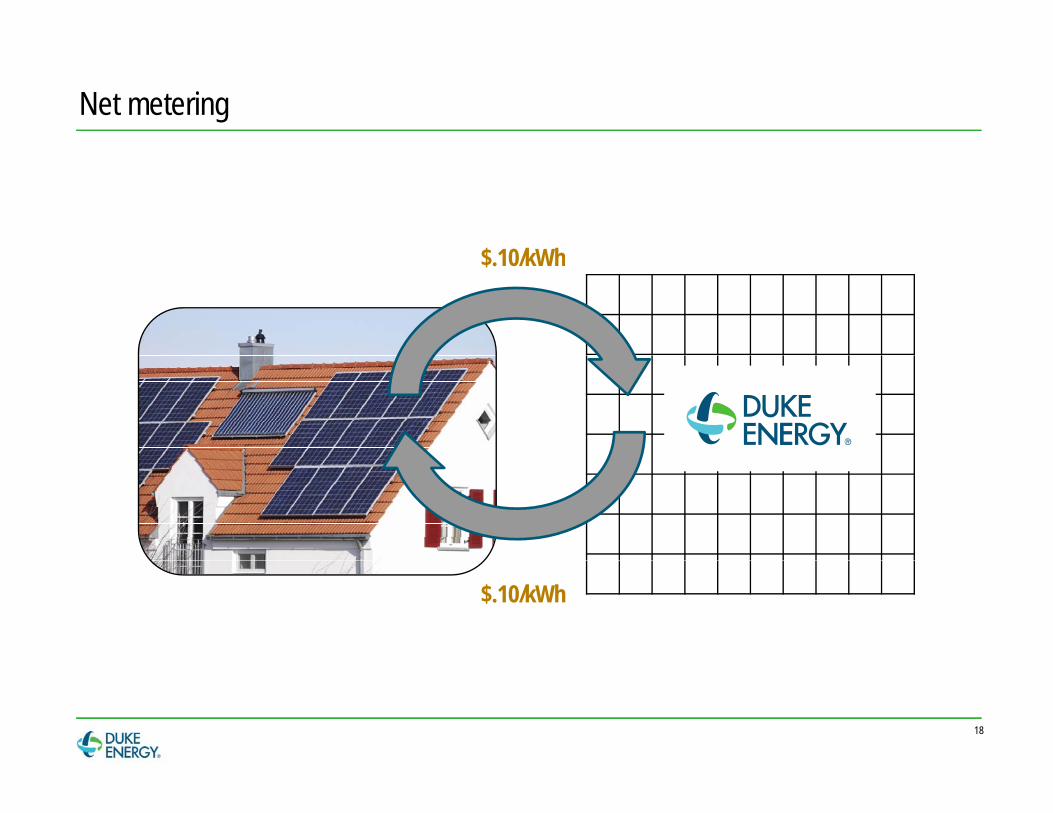
Net metering
$ 10/kWh$.10/kWh
$.10/kWh
18
Net Metering Analogy
19
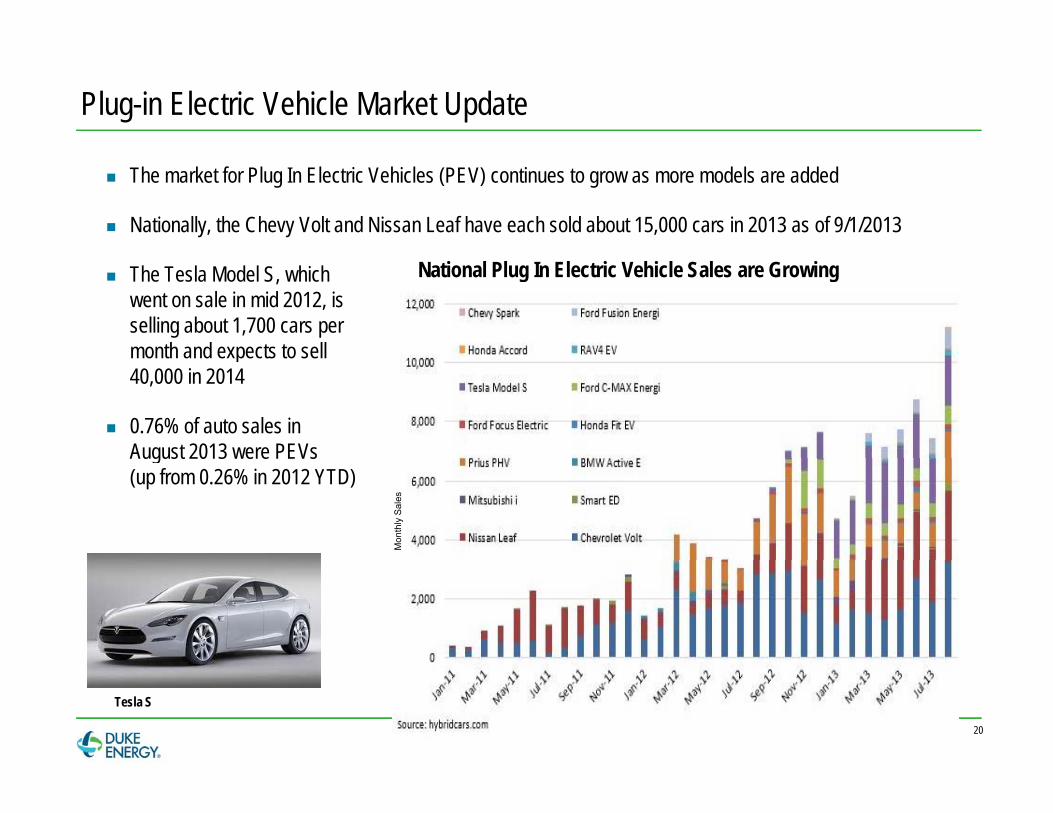
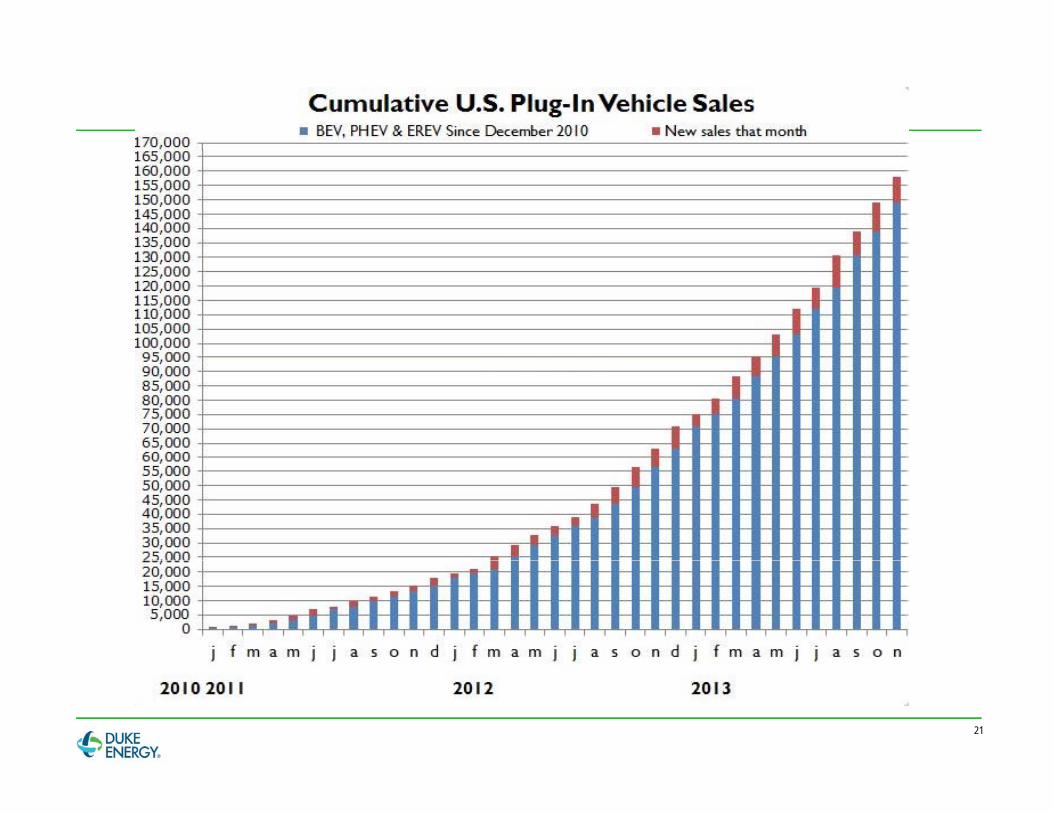
Plug-in Electric Vehicle Market Update
The market for Plug In Electric Vehicles (PEV) continues to grow as more models are added
Nationally, the Chevy Volt and Nissan Leaf have each sold about 15,000 cars in 2013 as of 9/1/2013
The Tesla Model S, whichwent on sale in mid 2012, is selling about 1,700 cars per month and expects to sell
National Plug In Electric Vehicle Sales are Growing
month and expects to sell 40,000 in 2014
0.76% of auto sales in August 2013 were PEVs August 2013 were PEVs (up from 0.26% in 2012 YTD)
Mon
thly
Sal
es
20
Tesla S
21
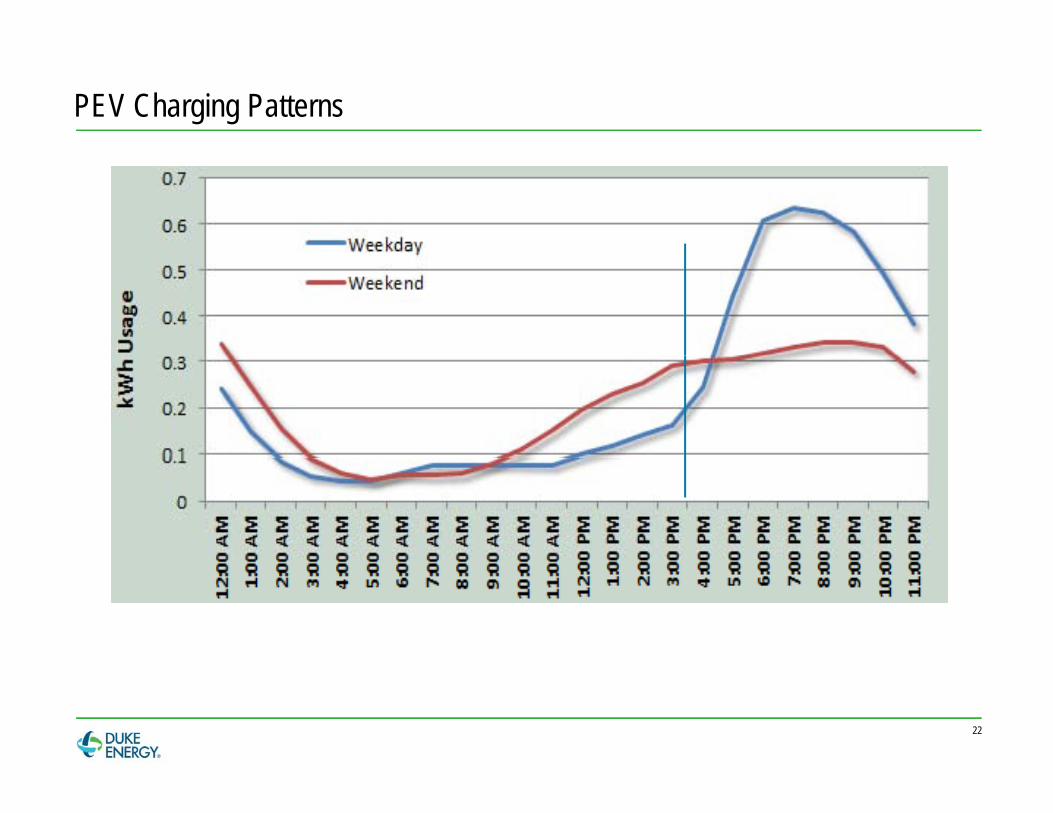
PEV Charging Patterns
22
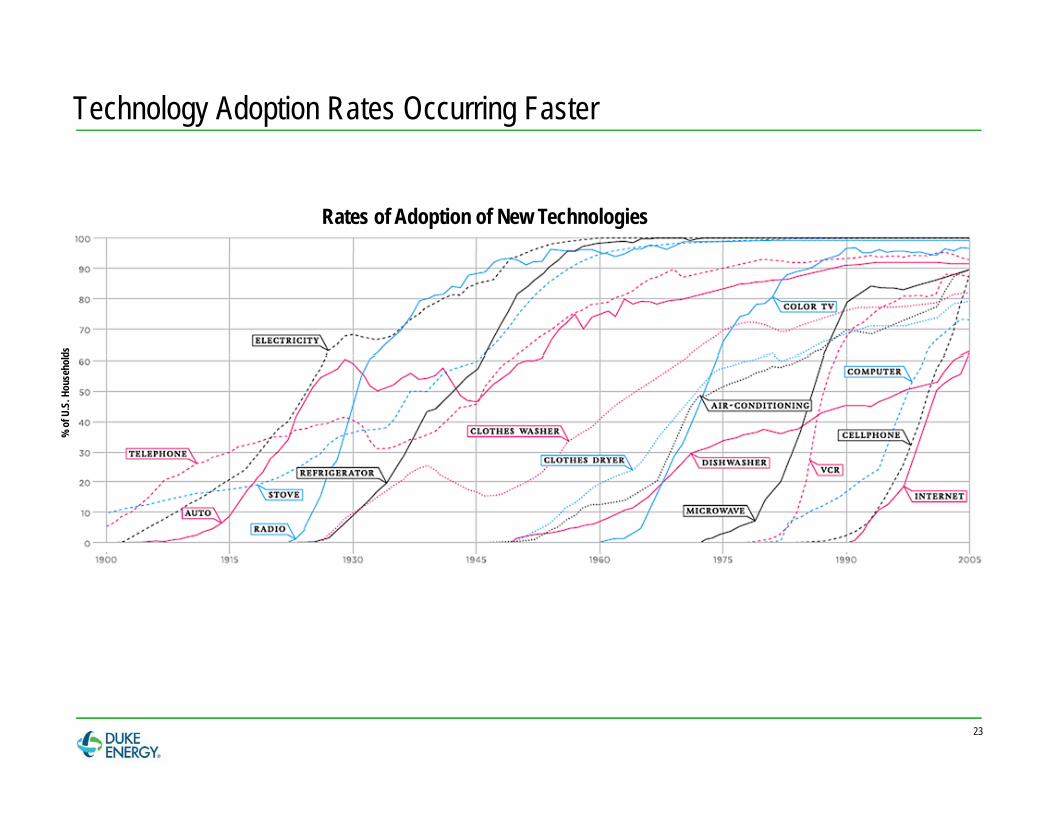
Technology Adoption Rates Occurring Faster
Rates of Adoption of New Technologies
ds%
of U
.S. H
ouse
hold
23
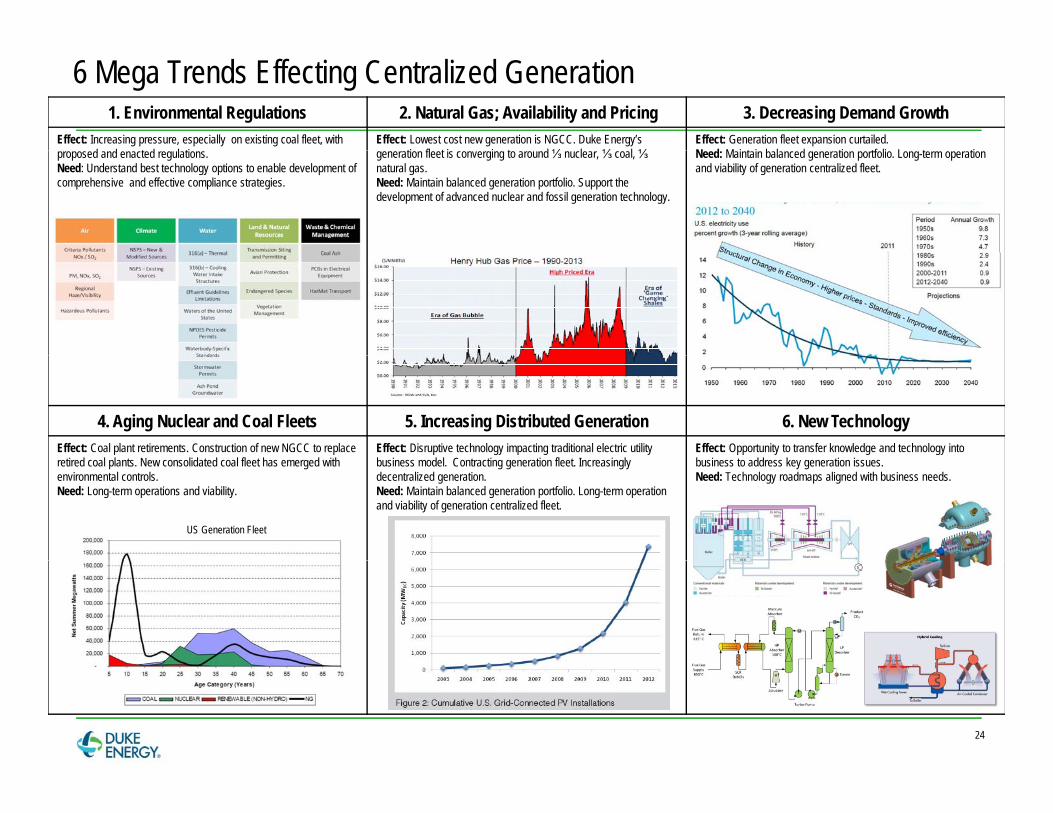
6 Mega Trends Effecting Centralized Generation1. Environmental Regulations 2. Natural Gas; Availability and Pricing 3. Decreasing Demand Growth
Effect: Increasing pressure, especially on existing coal fleet, with d d t d l ti
Effect: Lowest cost new generation is NGCC. Duke Energy’sti fl t i i t d ⅓ l ⅓ l ⅓
Effect: Generation fleet expansion curtailed. N d M i t i b l d ti tf li L t ti proposed and enacted regulations.
Need: Understand best technology options to enable development of comprehensive and effective compliance strategies.
generation fleet is converging to around ⅓ nuclear, ⅓ coal, ⅓natural gas.Need: Maintain balanced generation portfolio. Support the development of advanced nuclear and fossil generation technology.
Need: Maintain balanced generation portfolio. Long-term operation and viability of generation centralized fleet.
4. Aging Nuclear and Coal Fleets 5. Increasing Distributed Generation 6. New TechnologyEffect: Coal plant retirements. Construction of new NGCC to replace
i d l l N lid d l fl h d i h Effect: Disruptive technology impacting traditional electric utility b i d l C i i fl I i l
Effect: Opportunity to transfer knowledge and technology into b i dd k i iretired coal plants. New consolidated coal fleet has emerged with
environmental controls. Need: Long-term operations and viability.
business model. Contracting generation fleet. Increasingly decentralized generation.Need: Maintain balanced generation portfolio. Long-term operation and viability of generation centralized fleet.
business to address key generation issues.Need: Technology roadmaps aligned with business needs.
US Generation Fleet
24
U.S. DOE, Sept. 2013
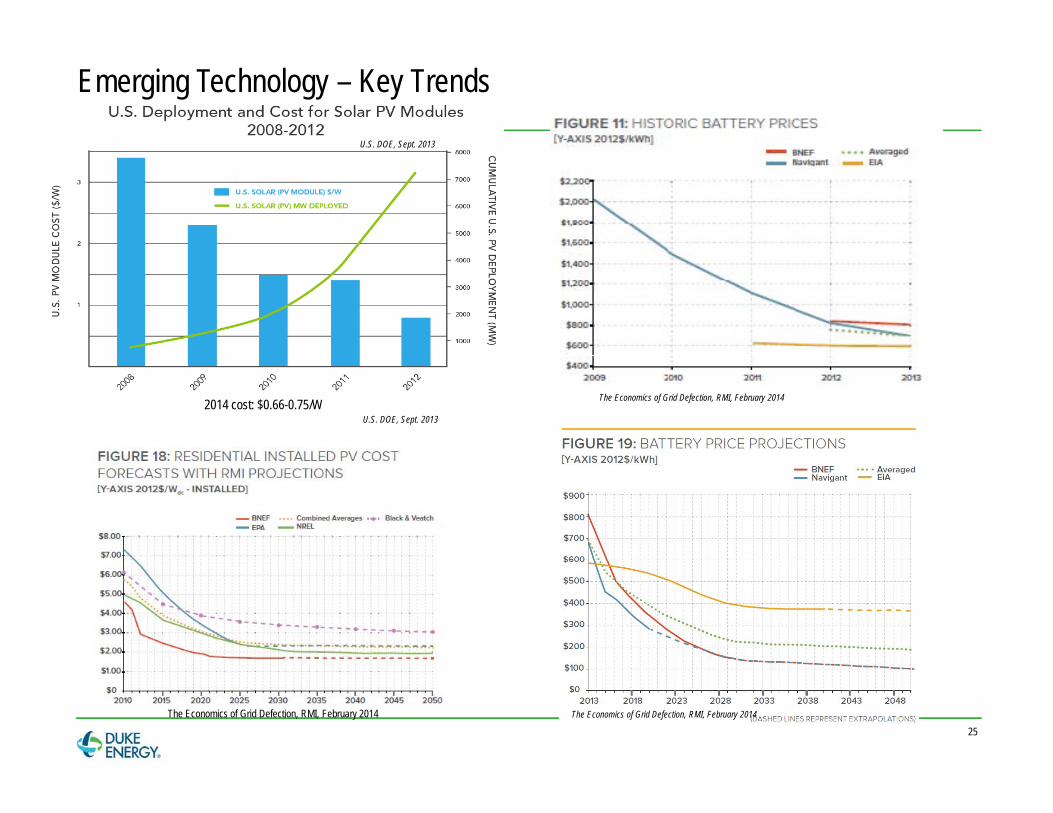
Emerging Technology – Key Trends
The Economics of Grid Defection, RMI, February 2014
U.S. DOE, Sept. 20132014 cost: $0.66-0.75/W
25The Economics of Grid Defection, RMI, February 2014 The Economics of Grid Defection, RMI, February 2014
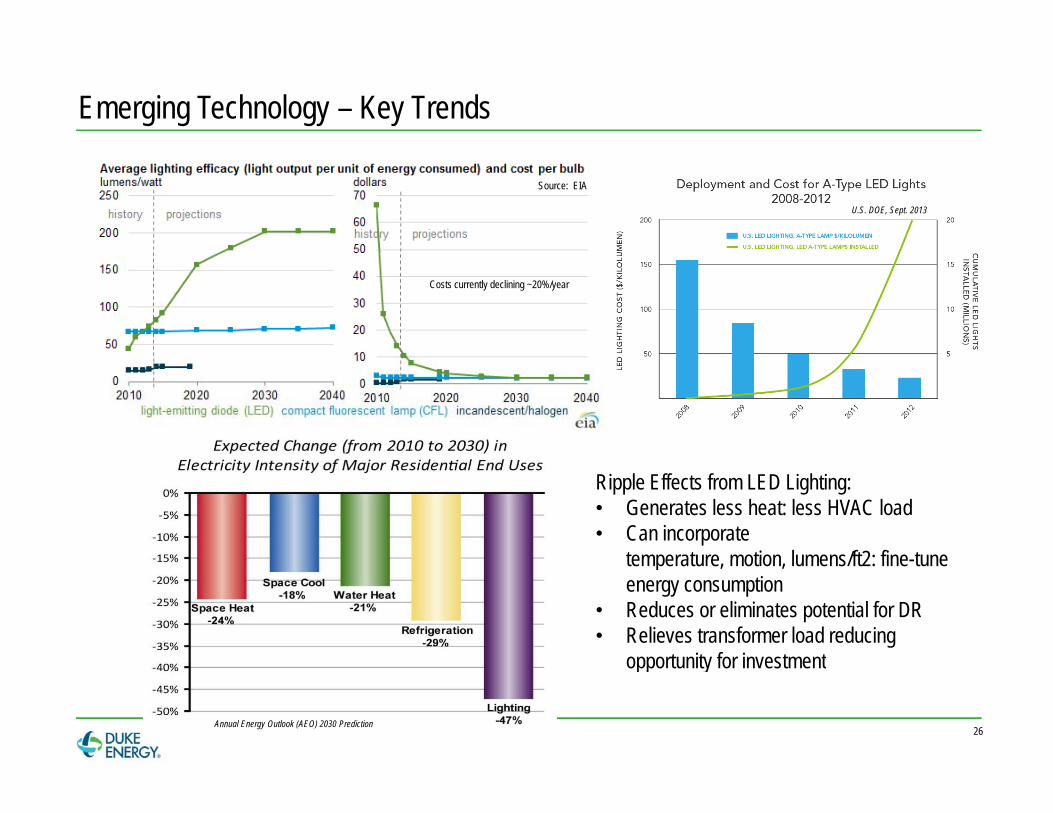
Emerging Technology – Key Trends
Source: EIA
U.S. DOE, Sept. 2013
Costs currently declining ~20%/year
Ripple Effects from LED Lighting:• Generates less heat: less HVAC load• Can incorporate
temperature motion lumens/ft2: fine-tune temperature, motion, lumens/ft2: fine-tune energy consumption
• Reduces or eliminates potential for DR• Relieves transformer load reducing
opportunity for investment
26Annual Energy Outlook (AEO) 2030 Prediction
opportunity for investment
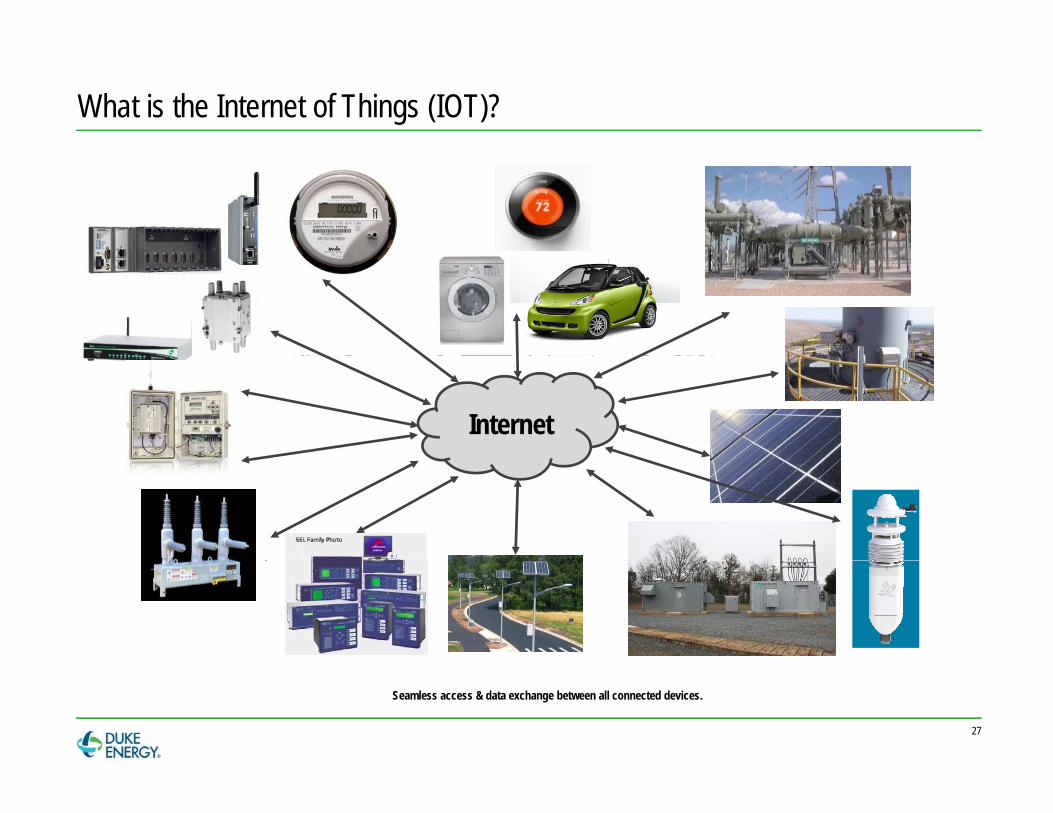
What is the Internet of Things (IOT)?
InternetInternet
Seamless access & data exchange between all connected devices.
27
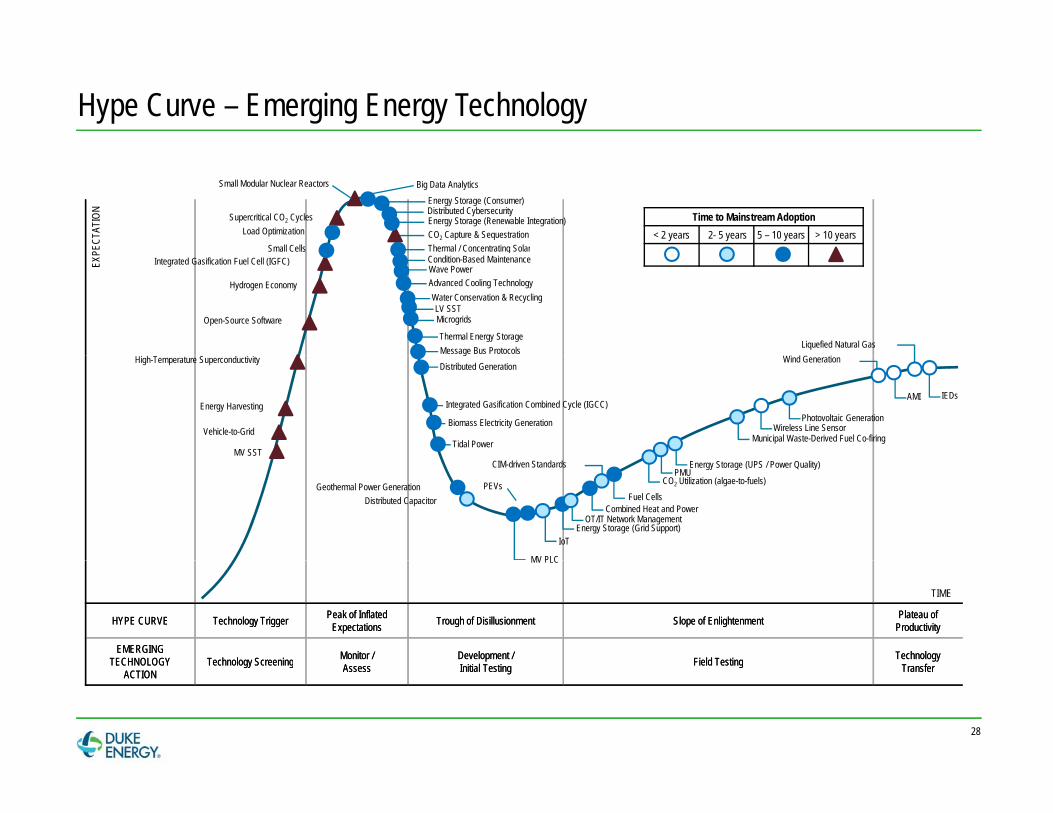
Hype Curve – Emerging Energy Technology
CO2 Capture & Sequestration
Time to Mainstream Adoption< 2 years 2- 5 years 5 – 10 years > 10 years
Small Modular Nuclear Reactors
Energy Storage (Consumer)
Thermal / Concentrating Solar
Energy Storage (Renewable Integration)
PECT
ATIO
N
Supercritical CO2 Cycles
Small Cells
Load Optimization
Big Data Analytics
Distributed Cybersecurity
Hydrogen Economy
g
Wave Power
Microgrids
Thermal Energy StorageLiquefied Natural Gas
Advanced Cooling TechnologyWater Conservation & Recycling
EXP
Integrated Gasification Fuel Cell (IGFC)
Open-Source Software
Condition-Based Maintenance
LV SST
Message Bus ProtocolsHigh-Temperature Superconductivity
Photovoltaic Generation
Tidal Power
Distributed Generation
Integrated Gasification Combined Cycle (IGCC)
Biomass Electricity GenerationVehicle-to-Grid
Energy Harvesting
Wind Generation
Municipal Waste-Derived Fuel Co-firingMV SST
g
Wireless Line Sensor
AMI IEDs
Fuel Cells
Energy Storage (UPS / Power Quality)
Combined Heat and Power
Energy Storage (Grid Support)
Geothermal Power Generation PEVs CO2 Utilization (algae-to-fuels)
Distributed Capacitor
MV PLC
IoT
OT/IT Network Management
CIM-driven StandardsPMU
HYPE CURVE Technology Trigger Peak of Inflated Expectations Trough of Disillusionment Slope of Enlightenment Plateau of
Productivity
EMERGING TECHNOLOGY Technology Screening Monitor / Development / Field Testing Technology
HYPE CURVE Technology Trigger Peak of Inflated Expectations Trough of Disillusionment Slope of Enlightenment Plateau of
Productivity
EMERGING TECHNOLOGY Technology Screening Monitor / Development / Field Testing Technology
TIME
MV PLC
TECHNOLOGY ACTION
Technology Screening Assess Initial Testing Field Testing TransferTECHNOLOGY ACTION
Technology Screening Assess Initial Testing Field Testing Transfer
28
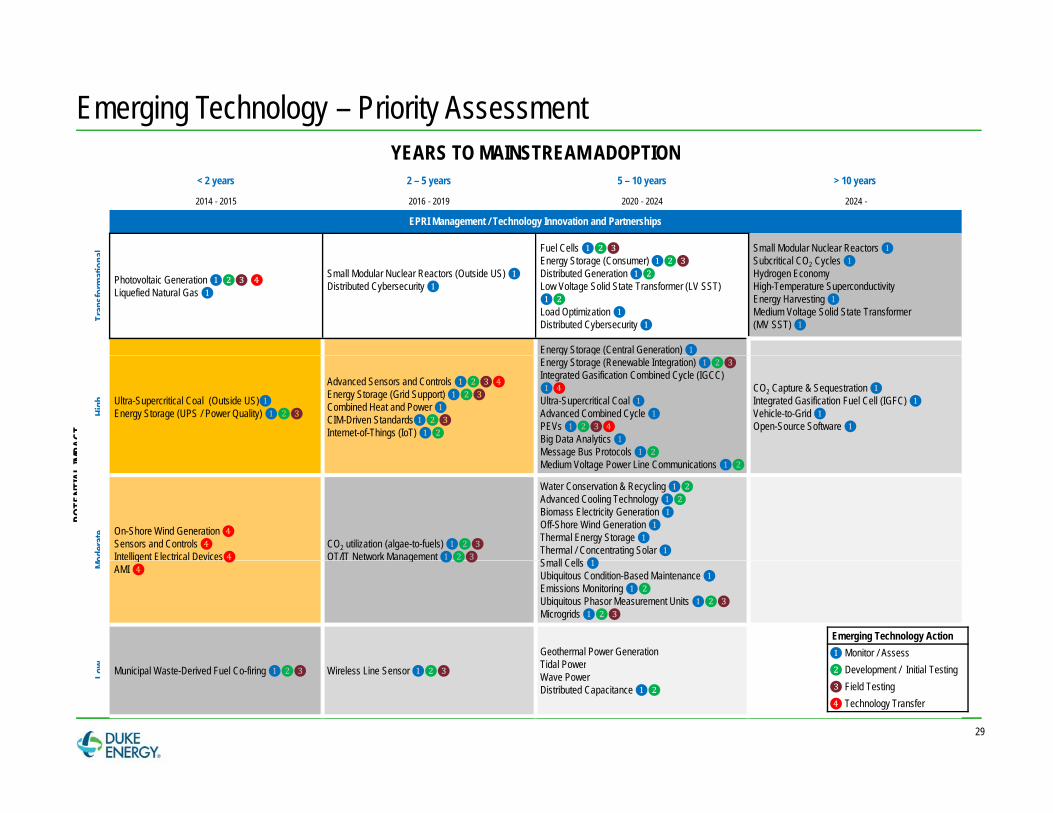
Emerging Technology – Priority AssessmentYEARS TO MAINSTREAM ADOPTIONYEARS TO MAINSTREAM ADOPTION
< 2 years 2 – 5 years 5 – 10 years > 10 years
2014 - 2015 2016 - 2019 2020 - 2024 2024 -
EPRI Management / Technology Innovation and Partnerships
l Fuel Cells ❶❷❸ Small Modular Nuclear Reactors ❶
Tran
sfor
mat
iona
Photovoltaic Generation ❶❷❸❹Liquefied Natural Gas ❶
Small Modular Nuclear Reactors (Outside US) ❶Distributed Cybersecurity ❶
❶❷❸Energy Storage (Consumer)❶❷❸Distributed Generation ❶❷Low Voltage Solid State Transformer (LV SST) ❶❷Load Optimization ❶Distributed Cybersecurity ❶
❶Subcritical CO2 Cycles ❶Hydrogen EconomyHigh-Temperature SuperconductivityEnergy Harvesting ❶Medium Voltage Solid State Transformer (MV SST) ❶
Energy Storage (Central Generation) ❶
MPAC
THi
gh Ultra-Supercritical Coal (Outside US)❶Energy Storage (UPS / Power Quality) ❶❷❸
Advanced Sensors and Controls ❶❷❸❹Energy Storage (Grid Support) ❶❷❸Combined Heat and Power ❶CIM-Driven Standards❶❷❸Internet-of-Things (IoT) ❶❷
❶Energy Storage (Renewable Integration) ❶❷❸Integrated Gasification Combined Cycle (IGCC) ❶❹Ultra-Supercritical Coal ❶Advanced Combined Cycle ❶PEVs ❶❷❸❹Big Data Analytics ❶Message Bus Protocols ❶❷
CO2 Capture & Sequestration ❶Integrated Gasification Fuel Cell (IGFC) ❶Vehicle-to-Grid ❶Open-Source Software ❶
POTE
NTIA
L IM Medium Voltage Power Line Communications ❶❷
oder
ate On-Shore Wind Generation ❹
Sensors and Controls ❹Intelligent Electrical Devices❹
CO2 utilization (algae-to-fuels)❶❷❸OT/IT Network Management ❶❷❸
Water Conservation & Recycling ❶❷Advanced Cooling Technology ❶❷Biomass Electricity Generation ❶Off-Shore Wind Generation ❶Thermal Energy Storage ❶Thermal / Concentrating Solar ❶S ll C ll ❶Mo
g ❹AMI ❹
g ❶❷❸ Small Cells ❶Ubiquitous Condition-Based Maintenance ❶Emissions Monitoring ❶❷Ubiquitous Phasor Measurement Units ❶❷❸Microgrids ❶❷❸
w
Geothermal Power GenerationTidal Power
Emerging Technology Action❶ Monitor / Assess
29
Low Municipal Waste-Derived Fuel Co-firing ❶❷❸ Wireless Line Sensor ❶❷❸ Tidal Power
Wave PowerDistributed Capacitance ❶❷
❷ Development / Initial Testing❸ Field Testing❹ Technology Transfer
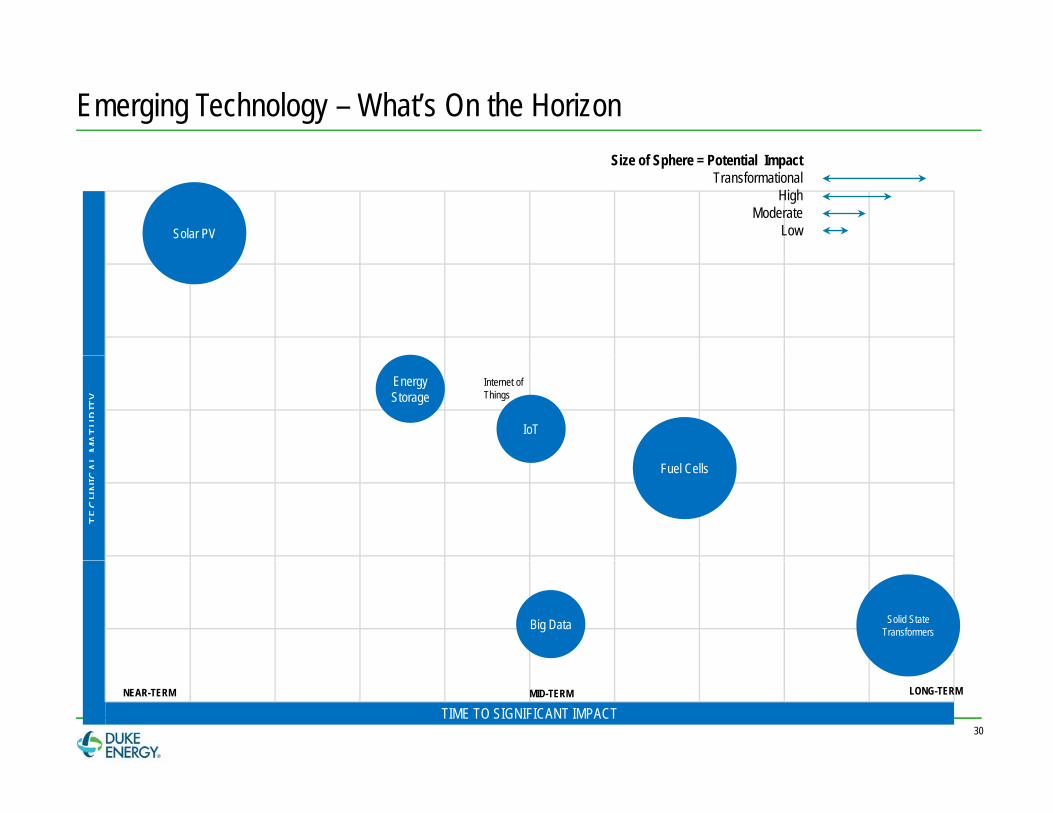
Emerging Technology – What’s On the Horizon
Solar PV
Size of Sphere = Potential ImpactTransformational
HighModerate
Low
L MAT
URIT
Y
IoT
Internet of Things
Energy Storage
TECH
NICA
L
Fuel Cells
Solid State TransformersBig Data
30TIME TO SIGNIFICANT IMPACT
NEAR-TERM LONG-TERMMID-TERM
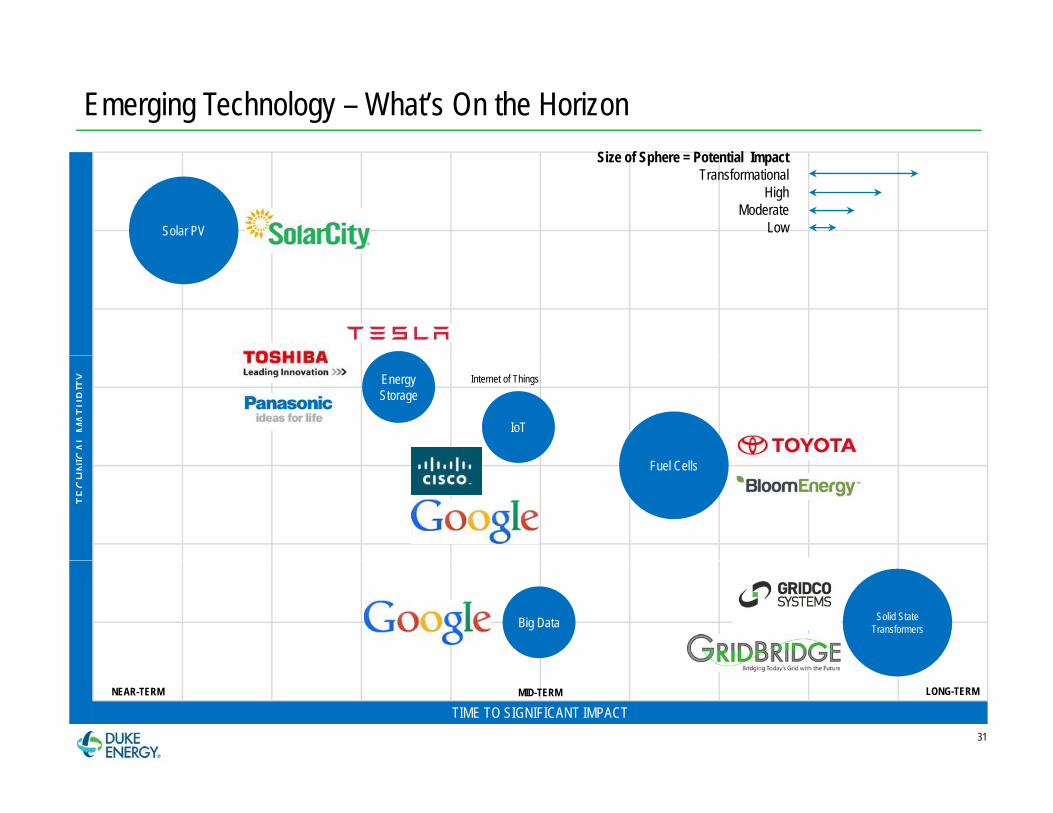
Emerging Technology – What’s On the Horizon
Solar PV
Size of Sphere = Potential ImpactTransformational
HighModerate
Low
CAL M
ATUR
ITY
IoT
Internet of ThingsEnergy Storage
TECH
NIC
Fuel Cells
Solid State TransformersBig Data
31
TIME TO SIGNIFICANT IMPACTNEAR-TERM LONG-TERMMID-TERM
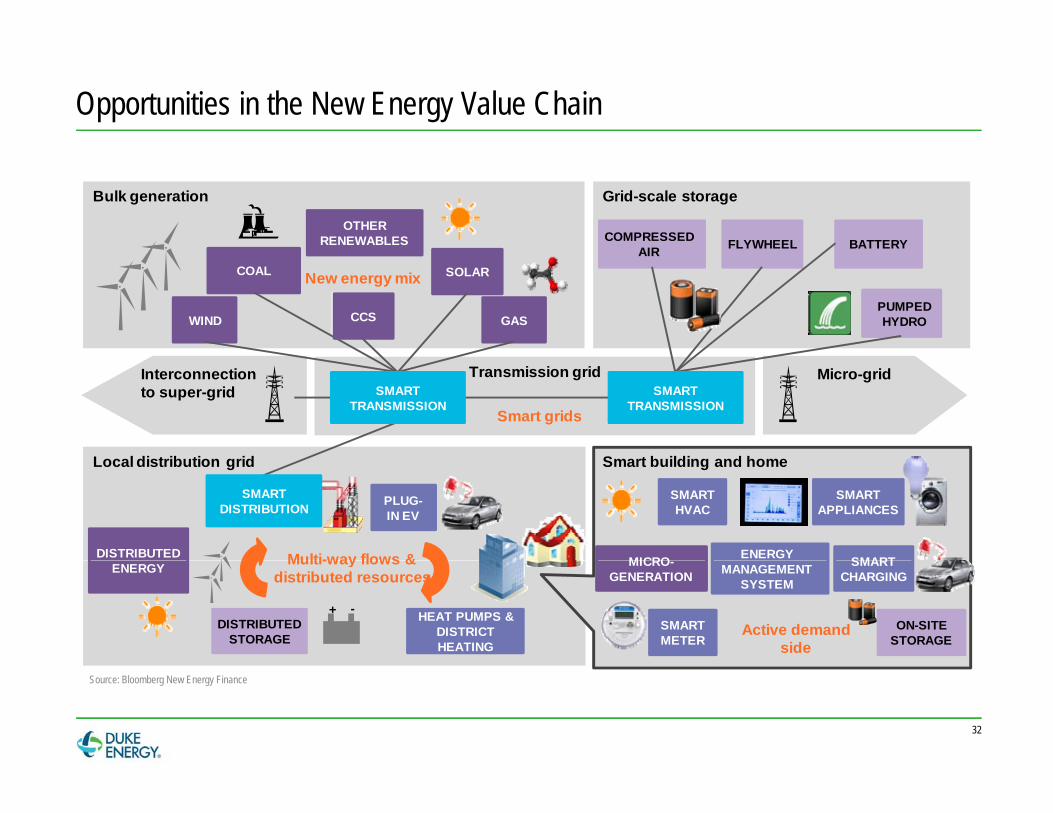
Opportunities in the New Energy Value Chain
Bulk generation Grid-scale storage
OTHER RENEWABLES FLYWHEEL BATTERYCOMPRESSED
AIRCOAL
WIND Coal
SOLARNew energy mix
GASPUMPED HYDRO
AIR
CCS
Transmission grid
L l di t ib ti id S t b ildi d h
Interconnection to super-grid
Micro-grid
Smart gridsSMART
TRANSMISSIONSMART
TRANSMISSION
Local distribution grid Smart building and home
DISTRIBUTED Multi-way flows &
PLUG-IN EV
ENERGY
SMART HVAC
SMART APPLIANCES
SMARTMICRO
SMART DISTRIBUTION
ENERGY
DISTRIBUTED STORAGE
+ - HEAT PUMPS &DISTRICT HEATING
Multi-way flows &distributed resources
Active demandside
SMART METER
MANAGEMENTSYSTEM
SMART CHARGING
ON-SITE STORAGE
MICRO-GENERATION
32
Source: Bloomberg New Energy Finance
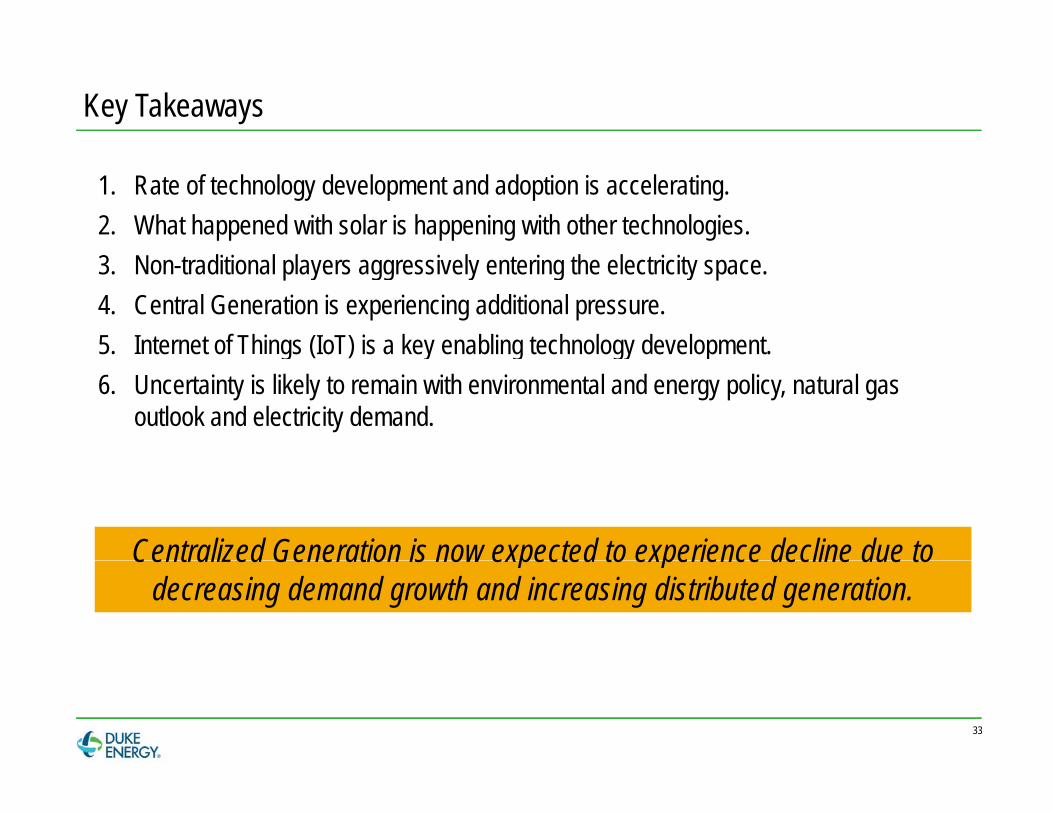
Key Takeaways
1. Rate of technology development and adoption is accelerating.2. What happened with solar is happening with other technologies.3. Non-traditional players aggressively entering the electricity space.4. Central Generation is experiencing additional pressure.5. Internet of Things (IoT) is a key enabling technology development.g ( ) y g gy p6. Uncertainty is likely to remain with environmental and energy policy, natural gas
outlook and electricity demand.
Centralized Generation is now expected to experience decline due to Centralized Generation is now expected to experience decline due to decreasing demand growth and increasing distributed generation.
33
How Can We Operate Within This “Game Changer”
How do changing markets change procurement activities
Coal volumes are down and future coal burn projections volatileCoal volumes are down and future coal burn projections volatile
How should we buy coal? More spot purchases? Call options or put options?
V l ti i t t ? O ti f diff t i ? Volume options in contracts? Options for different regions?
How should transportation contracts be structured? Fixed? Variable?
How should contracts be priced? Fixed? Index? How can escalators be hedged?
How to create value by for centralized generation by providing flexibility
that other fuel types can not
34
The “Game Changer” is Happening
What role will Duke Energy and us play five years from now in all of this? years from now in all of this?
35