Embed Size (px)
Citation preview

Industry‐Government Partnership ‐
The Asian Experience in Building Energy Infrastructure
ASEAN Conference on Energy 2010, Innovation and
Sustainable Development
October 4, 2010Presented by: Mr. Abdul Nasir Adnan

2005 2006 2007 2008 2009 2010* 2011*
Central Asia 11.4 13.3 12 6.1 2.7 4.7 5.9
East Asia 8.2 9.4 10.4 7.3 5.9 8.3 7.7
South Asia 9.1 9 8.7 6.4 6.5 7.4 8
South-East Asia 5.8 6.1 6.5 4.3 1.2 5.1 5.30
The Pacific 3.1 1.7 5 5.4 2.3 3.7 5.00
Developing Asia 8 8.9 9.6 6.7 5.2 7.5 7.30
GDP Growth Trend 2005 ‐
2011
Source: Asian Development Outlook 2010

Stimulus Plans by Countries
($ billion)
Georgia 19.92 Thailand 17.22 Kazakhstan 13.83 People's Rep. of China 13.30 Viet Nam 9.68 Rep. of Korea 6.56 Singapore 5.71 Malaysia 5.67 Hong Kong, China 5.22 Philippines 4.40 Taipei,China 4.04 India 3.53 Indonesia 1.40 Bangladesh 1.38 Sri Lanka 1.02 Average 7.53
Source: Asian Development Bank

Composition of Fiscal Packages
Fiscal Packages
Advanced economies
Developing and emerging
economiesEmployment measures 2.90 0.20Infrastructure spending 14.90 46.50Tax cuts 34.10 3.00Transfers to low income households 10.80 6.80Other spending 37.20 43.50
Source: s. Khatiwada. 2009. Stimulus Packages to Counter Global Economic Crisis: A Review. International Institute for Labour Studies Discussion Paper 196/2009.

Energy Production & Consumption
World Energy Production & Consumption
Sourcces: History: Energy Information Administration (EIA), International Energy Annual 2006 (June-December 2008).
Projected Energy Consumption
Source: Annual Energy Review 2008,
June 2009

Projection of World Consumption of Marketed Energy Use by Fuel Type
Source: 2010 International Energy Outlook, U.S. Department of Energy, Energy Information Administration

Project Investment Ranked by Region, 1990–2005
REGION INVESTMENT VALUE (US$M)
Latin America & Carribean 407,202
East Asia & Pacific 224,194
Europe and Central Asia 182,449
South Asia 70,435
Middle East & North Africa 41,163
Sub‐Saharan Africa 36,510
Source: Public‐Private Infrastructure Advisory Facility (PPIAF), World Bank.

Top 10 Countries by Investment, 1990–2005
COUNTRY INVESTMENT VALUE (US$M)
BRAZIL 169,363
ARGENTINA 72,833
P.R. OF CHINA 72,468
MEXICO 70,205
INDIA 51,432
MALAYSIA 47,516
PHILLIPPINES 36,624
INDONESIA 32,624
RUSSIA (FEDERATION) 32,056
TURKEY 30,270
Source: PPIAF, World Bank

Top 6 Countries by Private Investment, 1984–2005
COUNTRY PERCENTAGE INVESTMENT ( %)
P.R OF CHINA 25.3
INDIA 17.0
MALAYSIA 15.5
PHILLIPPINES 10.9
THAILAND 10.5
INDONESIA 8.8
OTHERS 11.2
TOTAL 100
Source: PPIAF, World Bank

Top 10 Countries by Projects, 1990–2005
COUNTRY NUMBER OF PROJECTS
P.R OF CHINA 483
BRAZIL 297
RUSSIA 284
ARGENTINA 182
INDIA 172
MEXICO 151
Chile 103
COLOMBIA 90
MALAYSIA 87
THAILAND 84
Source: PPIAF, World Bank.
Primary Sectors Ranked by Number of Projects in the World, 1990–2005
SECTOR NUMBER OF PROJECTS
ENERGY 1,307
TRANSPORT 829
TELECOMMUNICATIONS 749
WATER & SEWERAGE 383
Source: PPIAF, World Bank.

Investment Commitments to Infrastructure Project with Private Participation in Developing Countries by Sector, 1990–2005
Sources: World Bank and PPIAF, PPI Project database
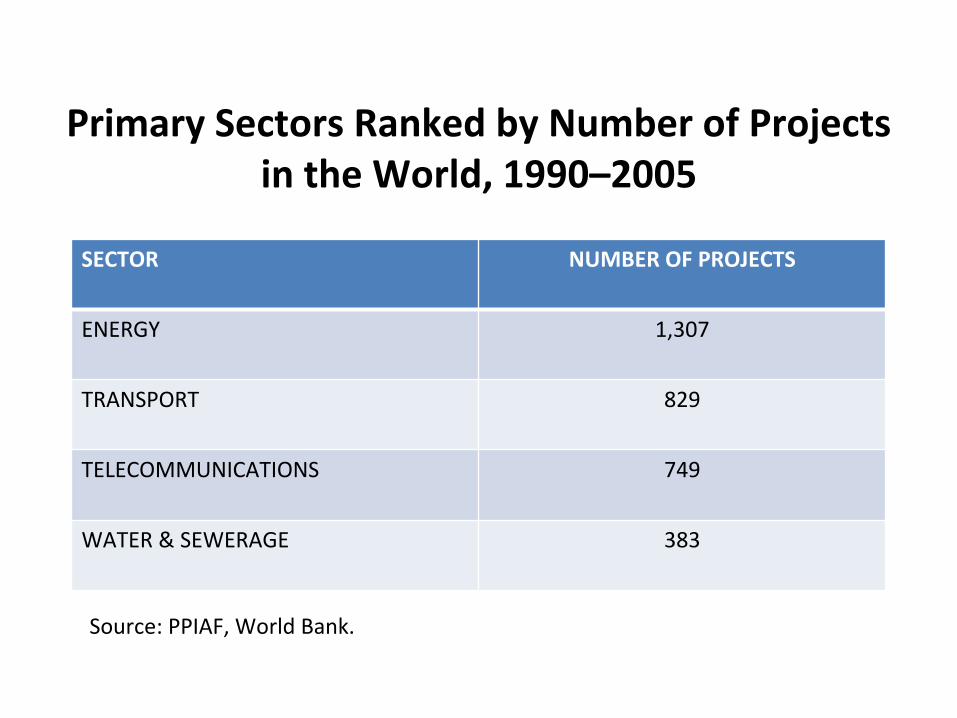
ENERGY SOURCES IN ASEAN
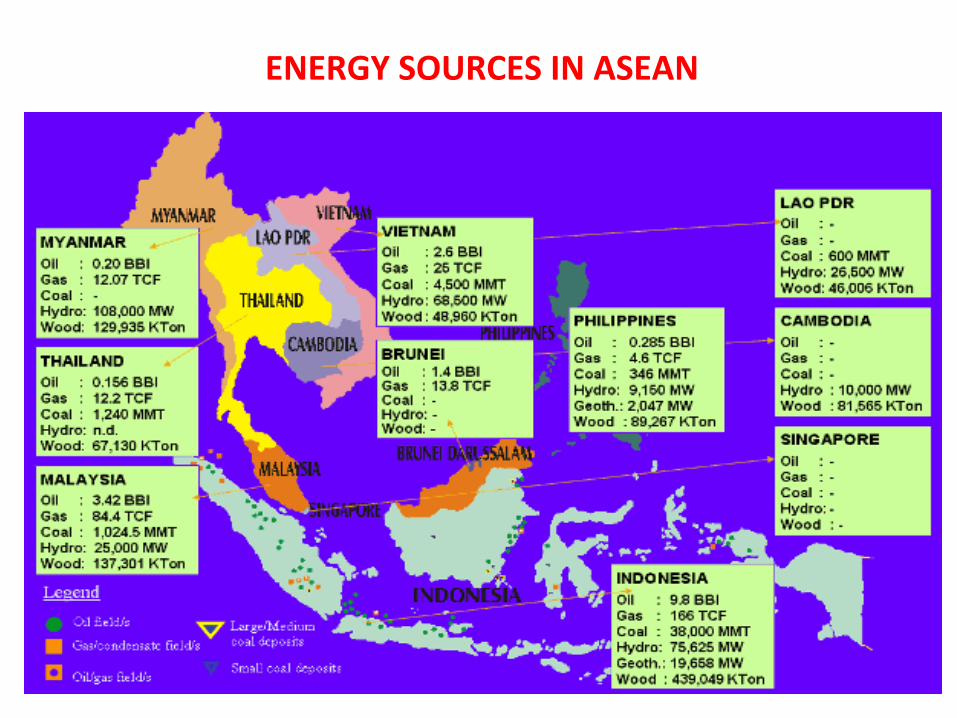
Map of TAGP
TRANS‐ASEAN GAS PIPELINE

Map of ASEAN Power Grid
ASEAN POWER GRID

“ PRIVATE FUNDED RENEWABLE ENERGY PROJECT FOR
SUSTAINABILITY & VALUE CREATION ‐
: THE MALAYSIAN
EXPERIENCE ”

SOURCES OF WASTE

DELIMMA OF SOLID WASTE MANAGEMENT IN MALAYSIA
“SOLID WASTE COLLECTION IS SATISFACTORY BUT THE DISPOSAL
SYSTEM IS LARGELY BY CONTROLLED TIPPING AND BURNING.
THE DISPOSAL OF SOLID WASTE IS A PROBLEM LIKE THOSE IN
ANY COUNTRIES AND
AN ORGANIZED PROGRAMME IN THIS
DIRECTION IS NEEDED. THE LOCAL AUTHORITIES IN MANY
CASES ARE HAMPERED BY LACK OF TRAINED EXPERIENCED
PERSONNEL, FINANCIAL RESOURCES, AND KNOWLEDGE OF
THE EFFECTS OF HEALTH.”
(Ref: Malaysia, Government of (1971). Report of the Government of Malaysia for the
UN Conference on Human Environment. April 1.p.10)
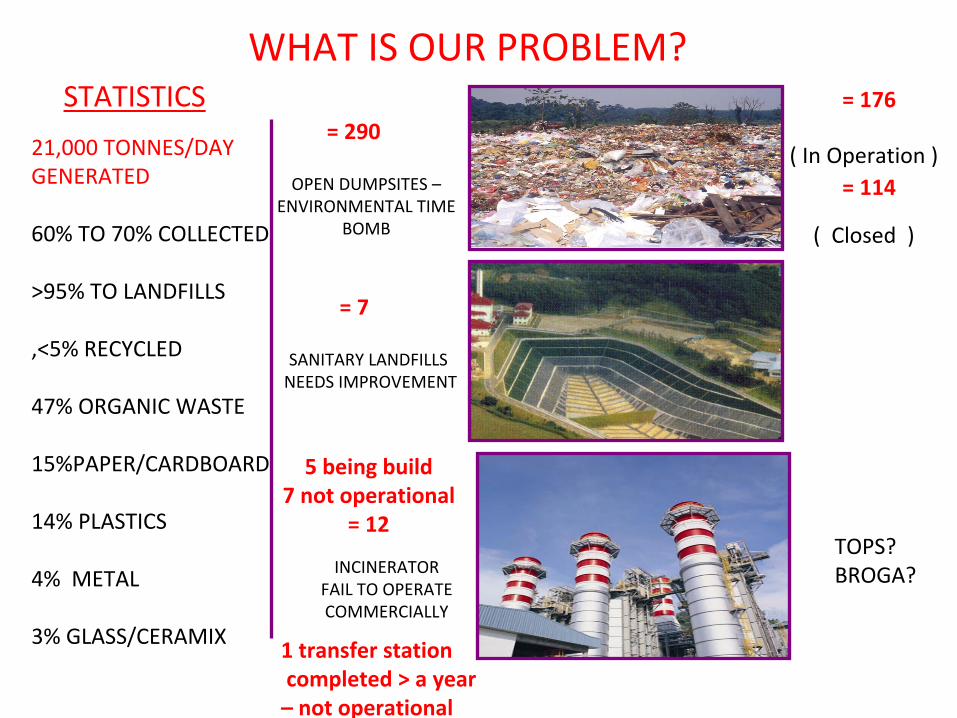
WHAT IS OUR PROBLEM?
OPEN DUMPSITES –
ENVIRONMENTAL TIME
BOMB
SANITARY LANDFILLSNEEDS IMPROVEMENT
INCINERATOR FAIL TO OPERATE
COMMERCIALLY
= 290
= 7
5 being build7 not operational
= 12
STATISTICS
21,000 TONNES/DAYGENERATED
60% TO 70% COLLECTED
>95% TO LANDFILLS
,<5% RECYCLED
47% ORGANIC WASTE
15%PAPER/CARDBOARD
14% PLASTICS
4% METAL
3% GLASS/CERAMIX
= 176
= 114( In Operation )
( Closed )
1 transfer station completed > a year–
not operational
TOPS?BROGA?

UNSUSTAINABLE MANAGEMENT OF MSW
FOUL
SMELL/UNSIGHTLY
VIEWS
LEACHATE
POTENTIAL ENERGY
LANDFILLGAS FIRES
UNHYGIENIC
ENVIRONMENT
ILLEGALBURNING

NATIONAL STRATEGIC PLAN
FOR PERIOD 2004‐ 2020
FACILITY TYPE AND NUMBERS
ESTIMATED COST
o CAPEX – RM 15.6 BILLION
o OPEX – RM 14.4 BILLION
TYPE NUMBERSSANITARY LANDFILL 22 SITESTRANSFER STATION 45 STATIONSMRF 7 FACILITIESTHERMAL TREATMENT PLANT
6 +2
22
45
7
8

COMMERCIAL RRC/WTE FACILITY (700 TONS/DAY)
“INTEGRATED SOLID WASTE MANAGEMENT FACILITY”

THE RRC‐WTE FACILITY
EFFLUENT TREATMENT
PLANT
ENERGY RECOVERY
MATERIAL RECOVERY

SUSTAINABLE and FULL PRIVATE FUNDING
Sanitary Landfill Incineration Transfer station
+ +
Mechanical Biological Thermal
( INTEGRATED )
PRIVA
TE FUNDIN
G
( STAND ALONE )
PUBLIC FUNDING

IMPACT ON LAND USE & ENVIRONMENT
OPEN DUMPSITE IN
SUNGAI KEMBONG
SUNGAI LALANG SITE
BEFORE
CONSTRUCTION OF
THE FACILITY
COMMERCIAL FACILITY OFWASTE TO ENERGY PLANT
BEFORE
AFTER

ENVIRONMENTAL DEGRADATION CONTROLLED
FOUL
SMELL/UNSIGHTLY
VIEWS
LEACHATE
POTENTIAL ENERGY
LANDFILLGAS FIRES
UNHYGIENIC
ENVIRONMENT
ILLEGALBURNING
S O L V
E D

GENERATE RENEWABLE ENERGY
POWER PLANT BOILER
TURBINE GENERATOR
POLLUTION CONTROL SYSTEM
CHIMNEY WITH CEMs SYSTEM

REDUCE CARBON FOOTPRINT
0.58 kg
CO2/kWh
0.138 kg
CO2/kWh
CONVENTIONAL POWER PLANT RDF POWER PLANT

LEACHATELEACHATE -- TREATED TO STANDARD A TREATED TO STANDARD A QUALITY QUALITY

Treated Leachate Water Treated Leachate Water USEDUSED and and REUSEDREUSED for lorry and plant for lorry and plant washing.washing.
REUSE AND RECYCLEREUSE AND RECYCLE

Film Plastic Resin Products
. Organics to composting. Organics to composting
. Recover . Recover METALS, PLASTICS, RECYCLABLESMETALS, PLASTICS, RECYCLABLES
RECYCLABLESRECYCLABLES
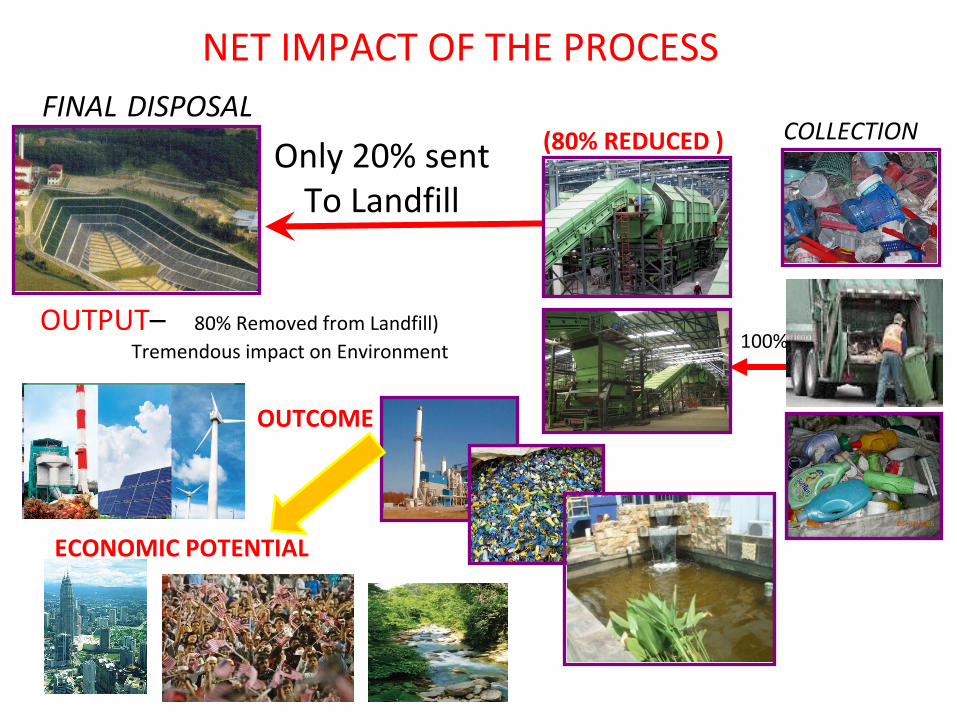
NET IMPACT OF THE PROCESS
COLLECTIONFINAL
DISPOSAL
100%
Only 20% sentTo Landfill
(80% REDUCED )
ECONOMIC POTENTIAL
OUTPUT–
80% Removed from Landfill)
Tremendous impact on Environment
OUTCOME

OUTPUT AND OUTCOME
INTANGIBLESTANGIBLES
Recover and Recycle Resources
Renewable Energy
Better Use of Land than Landfill
Jobs/Businesse
s
Beautiful Environment
Avoid Future Environment Cleanup
Healthy SocietySOCIETY
ENERGY
ECONOMY ENVIRONMENT

THE WAY FORWARD – THE BIG PICTURE
RM 30 Billion + RM4 Billion( Redeployment)
(Injection)
POLITICAL WILL
MINDSET CHANGE
+

Malaysian Experience
Soft Infrastructure• Policy and Act • Financial• HRD• R&D• Gov Institutions and governance• Market support
Hard Infrastructure
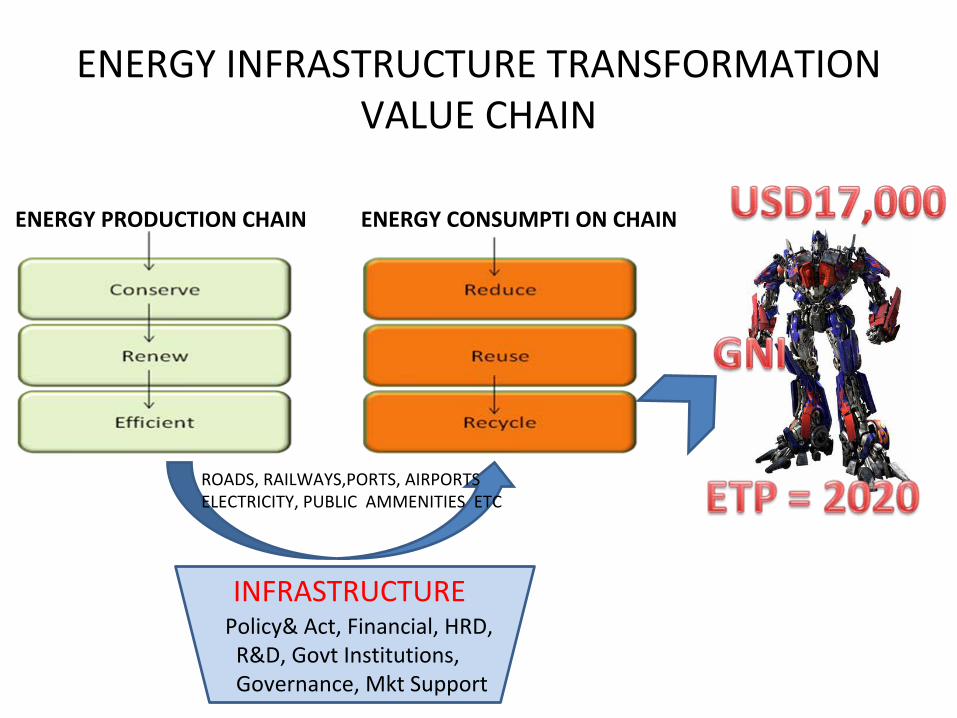
ENERGY INFRASTRUCTURE TRANSFORMATION VALUE CHAIN
ENERGY PRODUCTION CHAIN ENERGY CONSUMPTI ON CHAIN
Policy& Act, Financial, HRD,R&D, Govt Institutions,Governance, Mkt Support
INFRASTRUCTURE
ROADS, RAILWAYS,PORTS, AIRPORTSELECTRICITY, PUBLIC AMMENITIES ETC

Malaysian Experience
Soft Infrastructure• Policy and Act
‐
Integrated
policy
not
contravening
other
policies
set
by
governments.
Policy
executed
in
silos
by
different
government
agencies
serving
their
own
agencies
needs
rather
than
the
broad
and
integrated
country
needs.
Eg
Science
&Technology
Policy
encouraged
local
technology
development
thru
R&D,
RE
and
Solid
Waste
Policy
and
Act
should
give
a
relevant
recognition
and
priorities to address, facilitate and make it happen.
‐
Need
a
clear
policy
nationwide
and
well
integrated
for
local
technology to be developed at R&D, Pilot, Trail and Demonstration
Scale,
to
nurture
the
local
technology
with
final
objectives
of
implementing and exporting them.

Malaysian Experience
• Financial
‐
Must have a good and able financial support institutions.‐
Able
to
take
risks.
E,g
Venture
capital
failure
in
understanding the project merits.‐
Combination of Equity, Venture Capital, Commercial Loans,
Development
Bank
Loan
and
Risk
Guarantee
Mechanisms/Credit
Guarantee
Schemes
,
Vendors
Financing
Scheme should be made available.‐
Continuous development of the capital markets, products in
place.‐
Clear
understanding
between
funders,
lenders
operators,
and government officers the new PPP procurement methods.
Soft Infrastructure
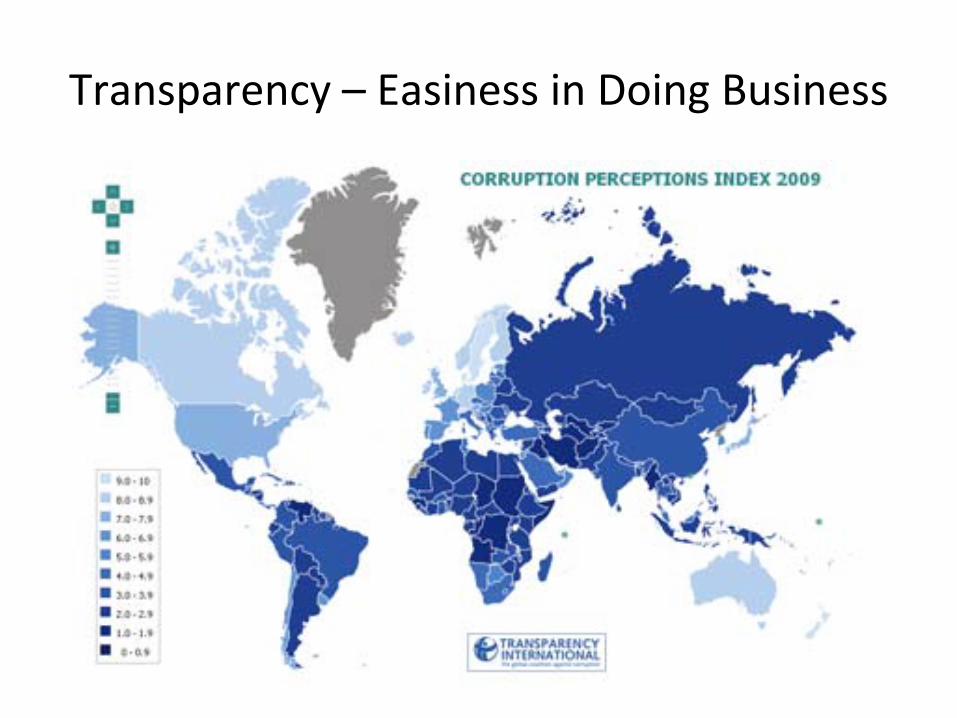
Transparency – Easiness in Doing Business

Corruption Perceptions Index
Country Rank 2001 2005 2009
PR China 57 78 79
India 71 88 84
Bangladesh 91 158 139
Pakistan 79 144 139
Thailand 61 59 84
Singapore 4 5 3
Phillippines 65 117 139
Vietnam 75 107 120
Malaysia 36 39 56
Indonesia 88 137 111
Japan 21 21 17
Source: Transparency International

Malaysian Experience
Soft Infrastructure• Human Resource Development
‐
Human
capital
capabilities
in
practical
and
detail S&T
not
yet
available,
especially
at
technical
scale
(most of our champions resides in the lab)
‐
Government
must
pay
to
this
effort
by
leveraging government
R&D
and
Universities
to
interact
with
private
by
virtue
of
attachments,
OJT,
etc
over
the project development/management period

Malaysian Experience
Soft Infrastructure• Human Resource Development‐
No
local
engineering
capabilities/
consultants/
universities/
research
assistants
in
process
engineering e.g boilers have to be designed overseas.
‐
Ability
to
rate
technology
and
financial
viability
of
energy
projects
e.g
technical due
diligence
by
outsiders.
Government insist
on
Local
teams
but
evaluation
has
been
delayed
for
an
unreasonable
time
due
to
inexperience
and
lack of knowledge in the said technology.

Malaysian Experience
Soft Infrastructure• Research & Development
‐
Local
R&D
are
very
lab
oriented,
due
to
weak
HR above,
relatively
rigid
government
procedures
not
giving
opportunities
for
free
flow
of
staff
and knowledge between private and public sector
‐
Funding and Research Scientist Engineers need to be enhanced by many fold.

Malaysian Experience
Soft Infrastructure• Government Institutions and governance
‐
Vested interest serving certain quarters and working in silos
‐
To have a clear role of government and private, concept of
PFI (success of ETP depends on the PPP…92% private).
‐
Lack
of
understanding
in
the
global
view
e.g
fighting
between the advantage of landfill vs MRF vs RDF/RE
‐
Establishment
of
a
capable
technical
and
financial
rating
agency
badly
needed
for
technology
and
investment
assessment

Malaysian Experience
Soft Infrastructure• Market support
‐
Allow fair competition, less politicking/political intervention

Malaysian ExperienceHard Infrastructure
• Industrial Capabilities and Support‐
Local
capabilities
in
engineering
are
good
but
lack
the
process
engineering and scaling up experience
• Physical Infrastructure‐
Physical infra like roads, waste disposal sites, utilities ‐
normal
• TechnologiesLocal
technological
development
should
be
given
priorities
to
be
developed, supported and nurtured till success
‐

STAKEHOLDERS ROUNDTABLE
Regular & ContinuousConsultation & Feedback

ENERGY DEMAND TREND 2006 ‐
2030
• The trend between 2006 and 2030, on current trends under a
“baseline”
scenario,
world
energy
demand*
will
increase
by
47
per
cent
to
17.7
billion
toe,
with
the
Asia‐Pacific**
region
accounting
for
almost
50
per
cent
of
the
total
global
energy
demand in 2030.
• If
countries
in
the
region
were
to
change
their
policies
and
embark on more sustainable energy paths, this demand could
be contained to 7.7 billion toe and requires $375 billionannually—over $9 trillion in total
• Note:* growth rate provided by IEA** growth rate provided by Institute of Energy Economics
WAY FORWARD
• There could be a wide supply‐demand gap due to tight supplies
and
high
prices
and
the
region’s
economic
powers
are
concerned
about
energy
security
which will pose constrain on economic growth
• The
cost
of
expanding
and
modernizing
the
region’s energy
systems
on
the
baseline
scenario
expected
at
$375
billion
annually—over
$9
trillion
in
total. Financing is of major concern.

WAY FORWARD
• The
authorities
should
design
strategies
to
reduce energy
demand
(via
EE),
secure
additional
energy
supplies, move towards more sustainable technologies and
fuel
types,
and
hence
build
the
necessary
infrastructure
• This
call
for
a
greater
partnership
inclusiveness between the Industry and Government to achieve the goal.

THANK YOU