Embed Size (px)
Citation preview
The costs of inequality: whole-population modellingstudy of lifetime inpatient hospital costs in theEnglish National Health Service by level ofneighbourhood deprivationMiqdad Asaria,1 Tim Doran,2 Richard Cookson1
▸ Additional material ispublished online only. To viewplease visit the journal online(http://dx.doi.org/10.1136/jech-2016-207447).1Centre for Health Economics,University of York, York, UK2Department of HealthSciences, University of York,York, UK
Correspondence toDr Miqdad Asaria, Centre forHealth Economics, University ofYork, York YO10 5DD, UK;[email protected]
Received 26 February 2016Revised 15 April 2016Accepted 19 April 2016Published Online First17 May 2016
To cite: Asaria M, Doran T,Cookson R. J EpidemiolCommunity Health2016;70:990–996.
ABSTRACTBackground There are substantial socioeconomicinequalities in both life expectancy and healthcare use inEngland. In this study, we describe how these two setsof inequalities interact by estimating the social gradientin hospital costs across the life course.Methods Hospital episode statistics, population andindex of multiple deprivation data were combined atlower-layer super output area level to estimate inpatienthospital costs for 2011/2012 by age, sex anddeprivation quintile. Survival curves were estimated foreach of the deprivation groups and used to estimateexpected annual costs and cumulative lifetime costs.Results A steep social gradient was observed in overallinpatient hospital admissions, with rates ranging from31 298/100 000 population in the most affluent fifth ofareas to 43 385 in the most deprived fifth. This gradientwas steeper for emergency than for elective admissions.The total cost associated with this inequality in 2011/2012 was £4.8 billion. A social gradient was alsoobserved in the modelled lifetime costs where the lowerlife expectancy was not sufficient to outweigh the higheraverage costs in the more deprived populations. Lifetimecosts for women were 14% greater than for men, dueto higher costs in the reproductive years and greater lifeexpectancy.Conclusions Socioeconomic inequalities result inincreased morbidity and decreased life expectancy.Interventions to reduce inequality and improve health inmore deprived neighbourhoods have the potential tosave money for health systems not only within years butacross peoples’ entire lifetimes, despite increased costsdue to longer life expectancies.
INTRODUCTIONHealthcare systems in most high-income countriesaspire to provide equitable care, adopting the prin-ciple of equal access to services for equal need,1
even when this is difficult to define and implementin practice.2 Some, such as the National HealthService (NHS) in England go further, and aim forequal use of healthcare or even equal outcomes.3
However, health status is powerfully influenced bysocioeconomic factors, with lower income asso-ciated with greater healthcare needs.4 So for asystem to be equitable it must de-couple use ofhealthcare services from individual income andcontributions towards system costs. This is usuallyachieved through social insurance schemes, or—asin the case of the English NHS—by funding systemcosts through progressive income taxation.
Through the use of such funding arrangements,healthier people subsidise care for those who fallill, and more affluent sections of society subsidisethe more deprived.There is a widespread assumption that over the
life course such systems disproportionately favourpeople lower down the socioeconomic scale, interms of the imbalance between their contributionto the costs of health services and their use ofthose services.5 Lower socioeconomic status isassociated with lower incomes, and therefore,smaller income tax and social insurance contribu-tions, but also with greater healthcare need, in par-ticular, the earlier development of multiplechronic morbidities.6 7 However, evidence onactual use of services is more nuanced. Moredeprived populations tend to make greater use ofunplanned (emergency) services than affluentpopulations, and are slightly more likely to visitthe GP,8 but are less likely to visit a medical spe-cialist or to use many types of planned and pre-ventative services.9
Most studies, to date, on the costs and use ofhealthcare services by different socioeconomicgroups have been cross-sectional. This is animportant limitation, because morbidity and mor-tality may have opposing impacts on lifetimehealthcare costs—greater morbidity will tend toincrease lifetime costs, whereas dying youngerwill tend to reduce them. After early childhood,average current-year healthcare costs for indivi-duals increase throughout life, rising dramaticallyfrom the age of 50.10 These higher healthcarecosts for poorer people in life may be partiallyoffset by a shorter lifespan. Alternatively, giventhat the rising costs in older age are largelydriven by the onset of chronic disease, earlieronset of these diseases in poorer populations maysimply shift the healthcare costs to younger agegroups.Consideration of these longitudinal relationships
is necessary in order to determine the impact ofsocioeconomic factors on health system costs.Measuring the size of this impact is important notjust to quantify the relative healthcare benefitsreceived by different social groups, but to under-stand the costs borne by the health service as a con-sequence of social inequality. In this study, weaimed to measure the costs to the NHS of socio-economic inequality, by estimating the lifetimeinpatient hospital costs of the whole English popu-lation by socioeconomic status.
990 Asaria M, et al. J Epidemiol Community Health 2016;70:990–996. doi:10.1136/jech-2016-207447
Inequality and health on January 2, 2022 by guest. P
rotected by copyright.http://jech.bm
j.com/
J Epidem
iol Com
munity H
ealth: first published as 10.1136/jech-2016-207447 on 17 May 2016. D
ownloaded from
METHODSDataThis study focuses on socioeconomic differences in inpatienthospital costs across the life course. Hospital admissions inEngland are recorded in the Hospital episode statistics (HES)data set used to reimburse hospitals for provided care. This dataset contains details on every episode of care, and a new finishedconsultant episode (FCE) record is created for every new admis-sion, and every time responsibility for the care of a patientpasses from one consultant to another. The HES FCE recordsdata about the patient (age, sex, place of residence) and theirhospital stay (diagnoses, procedures, length of stay). Using thisinformation the FCE is allocated to a healthcare resource group(HRG), which collates hospital stays that use similar levels ofresources—this is the English version of diagnosis related groupsused in the USA. Hospitals are reimbursed by the NHS throughthe payments by results (PbR) system based on the HRG,adjusted for the specifics of the case—for example, a more com-plicated case with longer than usual length of stay attracts add-itional reimbursement. Reimbursement is also adjusted for localcost variations (termed ‘market forces factors’). Costs attachedto each HRG for each year, and variations for more complexcases, are given in the NHS national reference costs.11 Details ofhow to derive costs from HES data are available in the PbRdocumentation,12 and their use in health economic analysis isdiscussed in Asaria et al.13 We use HES inpatient data for 2011/2012 and associated reference costs in this study.
The basic geographical unit of analysis in this study is thelower-layer super output area (LSOA). The country is dividedinto 32 482 LSOAs each containing, on average, 1500 people(range 1000–3000). Population data for 2011/2012 are takenfrom Office for National Statistics (ONS) midyear populationestimates split by LSOA, sex and age (ages 0–84 in single-yearestimates, and then 85+). This data estimates the total residentpopulation, including homeless people and people living ininstitutions. Mortality data for 2011/2012 are taken from theONS, split by LSOA, sex and age (ages 0–84 in 5-year agebands, and then 85+). Area deprivation for LSOAs is measuredusing the index of multiple deprivation (IMD) for 2010. TheIMD includes seven domains: (1) income; (2) employment; (3)health deprivation and disability; (4) education skills and train-ing; (5) barriers to housing and services; (6) crime; and (7)living environment. These domains are combined to produce anoverall deprivation rank for each LSOA. We grouped LSOAsinto deprivation quintiles based on this rank ranging from Q1(the most deprived fifth of LSOAs) to Q5 (the least deprivedfifth of LSOAs).
AnalysisWe grouped HES inpatient data into age, sex and IMD quintilecategories. Of the 18 808 903 episodes in our 2011/2012 HESdata set, 1 659 295 episodes (8.8%) could not be grouped dueto missing data on either age, sex or LSOA of residence, andwere dropped from the analysis. We then calculated the totalcost for each age, sex and IMD quintile group using the HRGsand the relevant reference costs. Market forces factors adjust-ments were not made as we are interested in the variation inresource use by deprivation group rather than local cost varia-tions. We then inflated these costs by 8.8% to account for themissing data (we assumed that missing data were equally distrib-uted across all patient groups and HRGs). Finally, we divided bythe population in each age, sex and IMD quintile group usingONS population estimates to estimate average costs for eachgroup:
average costage; sex; imd ¼P
hospital costsage; sex; imd�1:088Ppopulationage; sex; imd
We used these average costs to calculate the total cost associatedwith inequality in 2011/2012 by comparing the costs asobserved in the data with the costs calculated, by assuming thateach individual experienced the average costs (split by age andsex) experienced in the least deprived fifth of areas:
cost of inequalityimd; age; sex ¼X
½populationage; sex; imd
� ðaverage costage; sex; imd
� average costage; sex; imd¼Q5Þ�
Next we used the mortality data to calculate mortality rates byage, sex and IMD quintile group and used these in turn to cal-culate survival curves for each group:
mortality rateage; sex; imd ¼P
deathsage; sex; imdPpopulationage; sex; imd
survivalage; sex; imd ¼1; age ¼ 0survivalage�1;sex;imd�ð1�mortality rateage�1; sex; imdÞ age . 0
8<:
We used these survival curves to calculate expected cost at eachage split by sex and IMD quintile group by adjusting the averagecost for the probability of an individual from each group beingalive to incur that cost. Finally, we summed across these agegroups to get an expected lifetime cost for an individual in eachsex and IMD quintile group (assuming mortality experience andhospital costs remained constant at 2011/2012 level):
expected costage; sex; imd ¼ survivalage; sex; imd
� average costage; sex; imd
expected lifetime costsex;imd¼Xage
expected costage; sex; imd
We repeated this analysis for emergency and elective hospitalisa-tions, and also compared rates of outpatient hospital use amongthe different groups.
The analysis was performed using Oracle 11g and R 3.2.3—the analysis code is available at https://github.com/miqdadasaria/cost-of-inequality
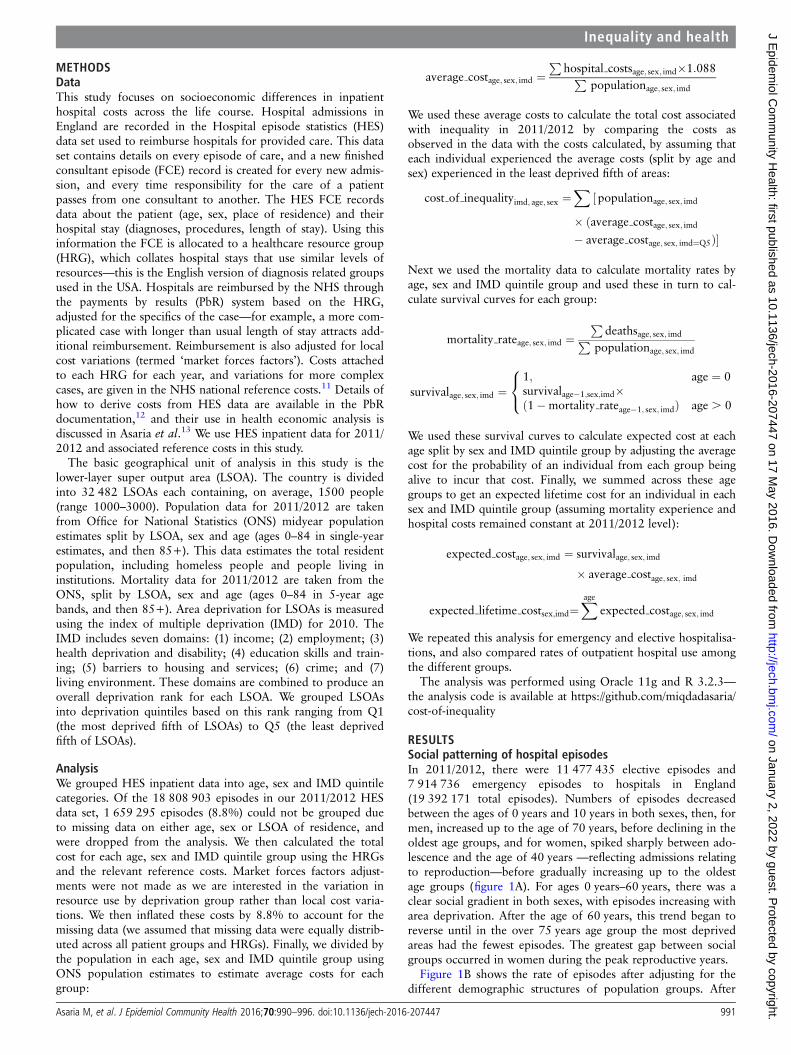
RESULTSSocial patterning of hospital episodesIn 2011/2012, there were 11 477 435 elective episodes and7 914 736 emergency episodes to hospitals in England(19 392 171 total episodes). Numbers of episodes decreasedbetween the ages of 0 years and 10 years in both sexes, then, formen, increased up to the age of 70 years, before declining in theoldest age groups, and for women, spiked sharply between ado-lescence and the age of 40 years —reflecting admissions relatingto reproduction—before gradually increasing up to the oldestage groups (figure 1A). For ages 0 years–60 years, there was aclear social gradient in both sexes, with episodes increasing witharea deprivation. After the age of 60 years, this trend began toreverse until in the over 75 years age group the most deprivedareas had the fewest episodes. The greatest gap between socialgroups occurred in women during the peak reproductive years.
Figure 1B shows the rate of episodes after adjusting for thedifferent demographic structures of population groups. After
Asaria M, et al. J Epidemiol Community Health 2016;70:990–996. doi:10.1136/jech-2016-207447 991
Inequality and health on January 2, 2022 by guest. P
rotected by copyright.http://jech.bm
j.com/
J Epidem
iol Com
munity H
ealth: first published as 10.1136/jech-2016-207447 on 17 May 2016. D
ownloaded from
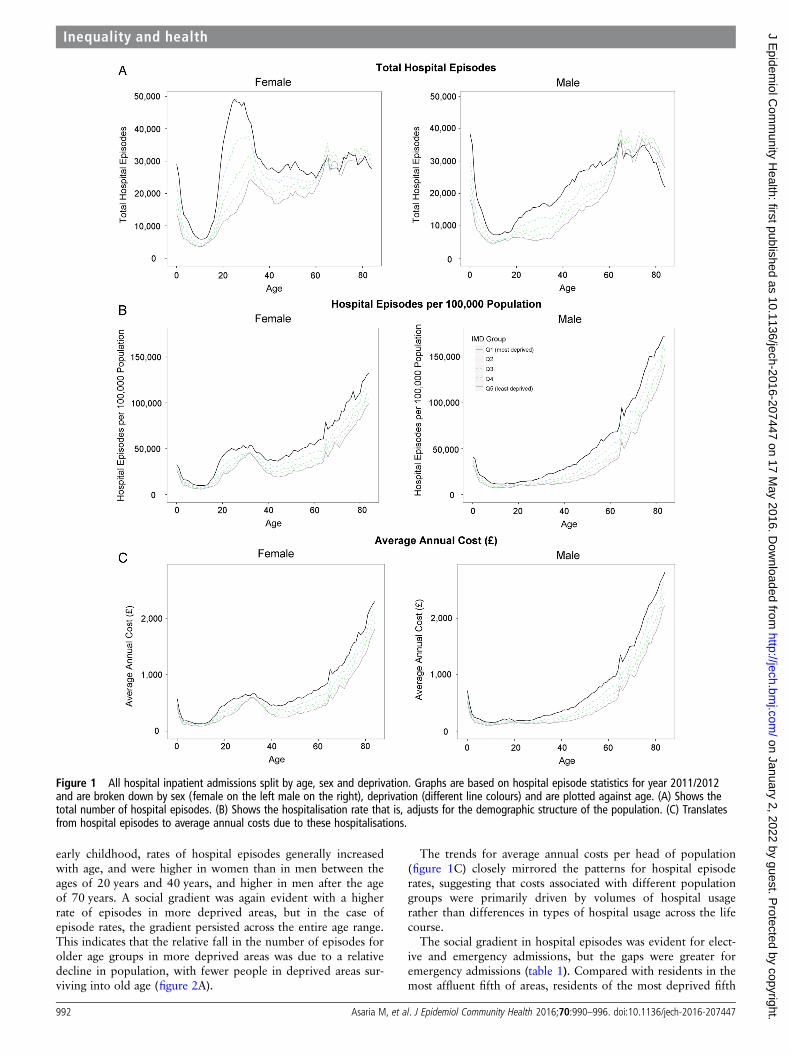
early childhood, rates of hospital episodes generally increasedwith age, and were higher in women than in men between theages of 20 years and 40 years, and higher in men after the ageof 70 years. A social gradient was again evident with a higherrate of episodes in more deprived areas, but in the case ofepisode rates, the gradient persisted across the entire age range.This indicates that the relative fall in the number of episodes forolder age groups in more deprived areas was due to a relativedecline in population, with fewer people in deprived areas sur-viving into old age (figure 2A).
The trends for average annual costs per head of population(figure 1C) closely mirrored the patterns for hospital episoderates, suggesting that costs associated with different populationgroups were primarily driven by volumes of hospital usagerather than differences in types of hospital usage across the lifecourse.
The social gradient in hospital episodes was evident for elect-ive and emergency admissions, but the gaps were greater foremergency admissions (table 1). Compared with residents in themost affluent fifth of areas, residents of the most deprived fifth
Figure 1 All hospital inpatient admissions split by age, sex and deprivation. Graphs are based on hospital episode statistics for year 2011/2012and are broken down by sex (female on the left male on the right), deprivation (different line colours) and are plotted against age. (A) Shows thetotal number of hospital episodes. (B) Shows the hospitalisation rate that is, adjusts for the demographic structure of the population. (C) Translatesfrom hospital episodes to average annual costs due to these hospitalisations.
992 Asaria M, et al. J Epidemiol Community Health 2016;70:990–996. doi:10.1136/jech-2016-207447
Inequality and health on January 2, 2022 by guest. P
rotected by copyright.http://jech.bm
j.com/
J Epidem
iol Com
munity H
ealth: first published as 10.1136/jech-2016-207447 on 17 May 2016. D
ownloaded from
of areas had a 20% higher rate of elective episodes, a 71%higher rate of emergency episodes, and a 39% higher rate ofepisodes overall. Detailed age, sex and deprivation breakdownsof the different types of admissions are given in the onlinesupplementary appendix figure A1.
The potential savings for the NHS if the costs associated withthe age and sex-specific episode rates in the most affluent quin-tile in 2011/2012 were achieved in the other deprivation groupsare given in table 2. The total cost associated with socio-economic inequality in 2011/2012 was £4.8 billion, and therewas a clear social gradient across the entire deprivation
Figure 2 Survival curves and cumulative lifetime costs split by age, sex and deprivation. Graphs are based on mortality data and hospital episodestatistics for year 2011/2012, and are broken down by sex (female on the left male on the right), deprivation (different line colours) and are plottedagainst age. (A) Shows the probability of surviving against age. (B) Shows the cumulative expected hospital costs calculated by adjusting hospitalcosts by the probability of being alive at any given age and cumulating these adjusted costs over all previous years.
Table 2 Estimated cost of social inequality
IMD quintile Female (£) Male (£) Total (£)
Q1 (most deprived) 1 127 006 663 1 065 236 932 2 192 243 595Q2 706 629 004 671 287 893 1 377 916 897Q3 410 841 645 405 654 922 816 496 567Q4 198 794 943 19 012 169 9 388 916 642Q5 (most affluent)* − − −Overall 2 443 272 255 2 332 301 446 4 775 573 701
This table shows the difference in inpatient hospital costs between those in the mostaffluent group and each of the other deprivation groups assuming everybody in theother groups would have the same average hospital costs as those in the mostaffluent groups adjusted for the different demographic profiles of the groups. All dataare based on hospital episode statistics for year 2011/2012.*Comparator group—costs in this group are £2 608 800 295, £2 208 982 887 and£4 817 783 181 for women, men and total, respectively.IMD, index of multiple deprivation.
Table 1 Number and rate of hospital episodes by admission type
IMDquintile
Elective Emergency All
Total Rate* Total Rate* Total Rate*
Q1 (mostdeprived)
2 481 014 23 727 2 055 481 19 658 4 536 495 43 385
Q2 2 355 297 22 338 1 706 833 16 188 4 062 130 38 526Q3 2 310 208 21 811 1 546 013 14 596 3 856 220 36 408Q4 2 235 779 21 254 1 390 347 13 217 3 626 126 34 472Q5 (mostaffluent)
2 095 137 19 804 1 216 063 11 495 3 311 200 31 298
Overall 11 477 435 21 783 7 914 736 15 021 19 392 171 36 804
This table shows the total numbers and rates of hospital episodes split by type ofhospital admission and deprivation group. All data are based on hospital episodestatistics for year 2011/2012.*Rate per 100 000 population.IMD, index of multiple deprivation.
Asaria M, et al. J Epidemiol Community Health 2016;70:990–996. doi:10.1136/jech-2016-207447 993
Inequality and health on January 2, 2022 by guest. P
rotected by copyright.http://jech.bm
j.com/
J Epidem
iol Com
munity H
ealth: first published as 10.1136/jech-2016-207447 on 17 May 2016. D
ownloaded from
spectrum, with the largest cost observed in the most deprivedgroup (£2.2 billion). Costs were broadly similar in men andwomen.
Estimates of lifetime costsSurvival curves for men and women by deprivation quintile areshown in figure 2A. People who lived in more affluent areaswere expected to live longer than those who lived in moredeprived areas, and women were expected to live longer thanmen at any given deprivation level.
Combining data on survival and average costs, we calculatedexpected costs of hospital admission over the life course foreach deprivation group, assuming survival and costs remainedconstant at 2011/2012 levels. Cumulative lifetime costs areshown in figure 2B. Average lifetime costs for men ranged from£43 358 for the most affluent group to £50 163 for the mostdeprived, and the respective costs for women ranged from£48 409 to £59 255. Overall, women had 14% higher expectedlifetime hospital costs than men, largely due to the increasedcosts associated with the reproductive years, but also due totheir longer life expectancy. Despite having longer life expect-ancy, people living in the most affluent fifth of areas had lowerlifetime hospital costs than those living in more deprived areas.
Analyses for emergency and elective admissions are presentedin the online supplementary appendix figures A1 and A2.Results were broadly similar to those for all admissions, butexpected cumulative lifetime costs for elective episodes in menconverged and were highest for people living in the most afflu-ent fifth of areas. Results for outpatient appointments are alsogiven in the online supplementary appendix figure A3. Verysimilar trends were apparent to those for inpatient admissions,with outpatient hospital use increasing with greater deprivationlevel and age, and spiking for women between the ages of20 years and 40 years.
DISCUSSIONSummary of key findingsIn this study, we aimed to quantify the hospital care costs to theNHS of socioeconomic inequality. As expected, we found thathospital admission rates generally increased with age, and werehigher in women during the reproductive years and higher inmen at most other ages. For all ages, there was a clear socio-economic gradient, particularly for emergency admissions, withthe rate of admissions increasing with neighbourhood depriv-ation. The costs to the NHS associated with this inequality werepartially offset by lower life expectancy in more deprivedgroups, but remained substantial: £4.8 billion per year at 2011/2012 levels.
Strengths and limitationsThis is the first study based on comprehensive whole-populationdata in England to explore the relationship between lifetimehospital costs to the NHS and socioeconomic inequality. Weused data at small-area level to minimise, as far as possible, therisk of ecological fallacy that may have masked inequality atlarger and coarser geographical levels. Mortality data were usedto extrapolate the results of the analysis across the patient life-time to allow conclusions to be drawn on both cross-sectionaland lifetime costs of inequality to the NHS.
The study is subject to several limitations. First, we did notcontrol for differing need for healthcare among the differentgroups, and so do not make any judgements on whether the dif-ferent levels of healthcare use are ‘fair’ or appropriate, given dif-ferences in need. For example, it may be the case that for any
given level of morbidity, poorer patients use less healthcare thanricher patients, and hence, our estimate of the cost of inequalityto the NHS, while representing current practice, underestimatesideal practice where patients receive equal treatment for equalneed. Second, the focus of our analysis was inpatient care, buthealthcare costs are also incurred through outpatient appoint-ments and in primary care. In 2011/2012, inpatient costs andprimary care costs each constituted 22% of the total NHSbudget of £101.42 billion.14 In our supplementary analyses, wefound that outpatient healthcare use followed trends similar tothose for inpatient use. This suggests that our estimates repre-sent a lower bound on the total cost of inequality to the NHS.Third, our lifetime extrapolation assumes that hospitalisationrates and costs observed in 2011/2012 will remain constant intothe future, and that mortality rates in 2011/2012 can be used topredict survival rates in future years. The extrapolation alsoassumes that deprivation levels are fixed over individuals’ life-times. While these assumptions may not hold in practice we feelthey give a reasonable indication of the relative magnitudes anddirections of future trends. Fourth, the underlying populationand mortality data breakdowns that we use in this study aretruncated at 85 years of age, so mortality and hospitalisationrates for older age groups are assumed to be constant and not toincrease further with age. Finally, while we use small-area-leveldeprivation in our analysis, to fully guard against ecologicalfallacy, individual-level deprivation data would be required.Such data are not available in a form that can be linked tohealth data in England. This remaining potential for ecologicalfallacy is likely to bias our estimate of the costs of inequalitydownwards.
Comparison with other studiesAs far as we know, this is the first published analysis of theinpatient costs of socioeconomic inequality in England. The2010 Strategic Review of Health Inequalities (the MarmotReview) estimated the cost of inequality to the NHS to be £5.5billion per year,4 but the basis for this calculation and thedetailed findings were not described. ONS estimated that overallNHS spending in 2011/12 was 25.3% higher for those in thelowest income quintile compared with those in the highest(spending of £1836 and £1465 respectively).15 However, this isan estimate based only on variation in the age and sex make-upof respondents from neighbourhoods with different levels ofdeprivation. By contrast, we used comprehensive national datato calculate the actual variation in healthcare costs by areadeprivation, and to model lifetime costs. Our approach foundthat inpatient hospital costs in 2011/2012 were 31% higher forpeople living in the most deprived quintile of neighbourhoodscompared with people living in the least deprived quintile(average annual inpatient hospital costs per resident of £597and £455, respectively). Forget et al16 modelled lifetime health-care costs based on the population of Manitoba, finding costsfor women were 40% higher than for men. As with our study,this gap between the sexes developed during the peak childbear-ing years and widened at the end of life. However, while theauthors described wide variations in healthcare costs betweenindividuals, the contribution of socioeconomic factors was notassessed. Finally, Hanratty et al17 modelled socioeconomicinequalities in public expenditure on healthcare in the last yearof life in Stockholm County Council. They used individual-levelincome data as their socioeconomic variable and found thatafter controlling for age, sex, diagnosis group and healthcareutilisation there was substantially greater public expenditure onhigher income patients than on lower income patients. This
994 Asaria M, et al. J Epidemiol Community Health 2016;70:990–996. doi:10.1136/jech-2016-207447
Inequality and health on January 2, 2022 by guest. P
rotected by copyright.http://jech.bm
j.com/
J Epidem
iol Com
munity H
ealth: first published as 10.1136/jech-2016-207447 on 17 May 2016. D
ownloaded from
suggests that if we were able to adjust for need and to useindividual-level deprivation data in our analysis, our estimate ofthe cost of inequality to the NHS would be higher.
Policy/clinical implicationsSocioeconomic inequalities in the determinants of health resultin both increased morbidity and decreased life expectancy. Wefound that the substantially higher healthcare costs accrued byresidents of deprived areas throughout their lives are onlyslightly offset by their lower life expectancy. Evidence suggeststhat even in a country with universal access to healthcare, moreaffluent groups benefit more,8 18 19 and healthcare is notentirely equitable. If healthcare provision were to adequatelymeet need, the cost disparities we describe could be evengreater, although better prevention and early intervention couldalso result in a net reduction in the costs associated withinequality, as has been found in social and educationalinterventions.20 21
Rising healthcare costs in older age are largely driven by theonset of chronic disease, and the earlier onset of these diseases inpoorer populations shifts the healthcare costs to younger agegroups. Better primary and secondary prevention, progressivelyweighted towards more deprived populations, is an obviousresponse, but one that has proved hard to achieve. Anticipatoryinterventions to tackle the onset of chronic conditions indeprived neighbourhoods can result in significant patientbenefit,22 potentially generating net savings for the health systemin any given year, as well as across the lifetimes of these patients.However, while there is scope for health professionals to domore to tackle health inequalities as providers and
commissioners,23 24 the root causes of these inequalities aresocioeconomic, and the healthcare system—however, equitable—can only partially alleviate their impact.25 26 A range of recentnational social and health system programmes (eg, Health ActionZones, the Quality and the Outcomes Framework) have beenassociated with more equitable access to high-quality care,26 27
and in some cases, with improvements in educational and healthoutcomes,28 29 but for the most part inequalities in health out-comes have persisted—or have actually worsened.30–32
Twitter Follow Tim Doran at @narodmit
Acknowledgements The authors would like to thank Katja Grasic, MauroLaudicella, Eldon Spackman, Susan Griffin, Simon Walker and HEDG seminarparticipants at the University of York for their useful comments and suggestions onthis work.
Contributors MA assembled the data set and performed the analysis. MA and TDdrafted the manuscript. All authors were involved in designing the study and revisingthe manuscript.
Funding This study is independent research supported by the National Institute forHealth Research (SRF-2013-06-015). The funding body did not play any role instudy design; in the collection, analysis, and interpretation of data; in the writing ofthe report; and in the decision to submit the article for publication. The viewsexpressed in this publication are those of the author(s) and not necessarily those ofthe NHS, the National Institute for Health Research or the Department of Health.
Competing interests RC reports grants from NIHR, during the conduct of the study.
Provenance and peer review Not commissioned; externally peer reviewed.
Data sharing statement The code for the analysis and aggregated data that formthe basis of the results are available from: https://github.com/miqdadasaria/cost-of-inequality.
Open Access This is an Open Access article distributed in accordance with theterms of the Creative Commons Attribution (CC BY 4.0) license, which permitsothers to distribute, remix, adapt and build upon this work, for commercial use,provided the original work is properly cited. See: http://creativecommons.org/licenses/by/4.0/
REFERENCES1 Judge K, Platt S, Costongs C, et al. Health inequalities: a challenge for Europe.
London, 2006. http://ec.europa.eu/health/ph_determinants/socio_economics/documents/ev_060302_rd05_en.pdf
2 Oliver A, Mossialos E. Equity of access to health care: outlining the foundations foraction. J Epidemiol Community Health 2004;58:655–8.
3 Health and Social Care Act 2012. http://www.dh.gov.uk/health/2012/06/act-explained/
4 Marmot M, Bell R. Fair society, healthy lives. Public Health 2012;126(Suppl 1):S4–10.5 Mackintosh M. Planning and market Regulation: Strength, weaknesses and
interactions in the provision of less inequitable and better qaulity health care. 2007.http://www.who.int/entity/social_determinants/resources/csdh_media/planning_market_regulation_2007_en.pdf?ua=1
6 Barnett K, Mercer SW, Norbury M, et al. Epidemiology of multimorbidity andimplications for health care, research, and medical education: a cross-sectionalstudy. Lancet 2012;380:37–43.
7 Eachus J, Chan P, Pearson N, et al. An additional dimension to health inequalities:disease severity and socioeconomic position. J Epidemiol Community Heal1999;53:603–11.
8 Dixon A, Le Grand J, Henderson J, et al. Is the British National Health Serviceequitable? The evidence on socioeconomic differences in utilization. J Health ServRes Policy 2007;12:104–9.
9 Goddard M, Smith P. Equity of access to health care services: theory and evidencefrom the UK. Soc Sci Med 2001;53:1149–62.
10 Alemayehu B, Warner KE. The lifetime distribution of health care costs. Health ServRes 2004;39:627–42.
11 Department of Health. NHS reference costs: financial year 2011 to 2012. 2012. https://www.gov.uk/government/publications/nhs-reference-costs-financial-year-2011-to-2012
12 Department of Health Payment by Results team. A simple guide to Payment byResults. 2012; https://www.gov.uk/government/uploads/system/uploads/attachment_data/file/213150/PbR-Simple-Guide-FINAL.pdf
13 Asaria M, Grasic K, Walker S. Using linked electronic health records to estimatehealthcare costs: key challenges and opportunities. Pharmacoeconomics2016;34:155–60.
14 Lafond S, Arora S, Charlesworth A, et al. Into the red? The state of the NHSfinances. 2014. http://www.nuffieldtrust.org.uk/sites/files/nuffield/publication/into_the_red.pdf
What is already known on this subject
▸ Poorer people tend to use more healthcare at any given age,because they are sicker, but also tend to have shorter lives.
▸ It is not known how these two sets of inequalities interactto produce lifetime healthcare costs for differentsocioeconomic groups.
What this study adds
▸ There is a social gradient in both current and lifetimehospital costs. Despite dying at a younger age, people frommore deprived neighbourhoods tend to require morehealthcare, and cost the National Health Service (NHS) moreover their lifetimes than people from more affluentneighbourhoods.
▸ Socioeconomic inequality cost the NHS in England £4.8billion in 2011/2012 as a result of excess hospitaladmissions.
▸ There is a financial as well as a moral case for tacklingsocioeconomic inequality: reducing socioeconomicinequalities in health would reduce the excess morbidity ofthe poor, resulting in longer lives. Our modelling suggeststhat the reduction in healthcare costs resulting fromreducing morbidity among the poor would outweigh theincrease in healthcare costs resulting from their increasedlongevity.
Asaria M, et al. J Epidemiol Community Health 2016;70:990–996. doi:10.1136/jech-2016-207447 995
Inequality and health on January 2, 2022 by guest. P
rotected by copyright.http://jech.bm
j.com/
J Epidem
iol Com
munity H
ealth: first published as 10.1136/jech-2016-207447 on 17 May 2016. D
ownloaded from
15 Office for National Statistics. The effects of taxes and benefits on householdincome: 2011/2012. 2012; http://www.ons.gov.uk/peoplepopulationandcommunity/personalandhouseholdfinances/incomeandwealth/bulletins/theeffectsoftaxesandbenefitsonhouseholdincome/2013-07-10
16 Forget EL, Roos LL, Deber RB, et al. Variations in lifetime healthcare costs across apopulation. Healthc Policy 2008;4:e148–67.
17 Hanratty B, Burström B, Walander A, et al. Inequality in the face of death? Publicexpenditure on health care for different socioeconomic groups in the last year oflife. J Health Serv Res Policy 2007;12:90–4.
18 Watt G. The inverse care law today. Lancet 2002;360:252–4.19 McLean G, Sutton M, Guthrie B. Deprivation and quality of primary care services:
evidence for persistence of the inverse care law from the UK Quality and OutcomesFramework. J Epidemiol Community Health 2006;60:917–22. .
20 Heckman JJ. Schools, skills, and synapses. Econ Inq 2008;46:289.21 Heckman JJ, Moon SH, Pinto R, et al. The rate of return to the HighScope Perry
Preschool Program. J Public Econ 2010;94:114–28.22 Hart JT, Thomas C, Gibbons B, et al. Twenty five years of case finding and audit in
a socially deprived community. BMJ 1991;302:1509–13.23 Allen M, Allen J, Hogarth S, et al. Working for health equity: the role of health
professionals. London, 2013. https://www.instituteofhealthequity.org/projects/working-for-health-equity-the-role-of-health-professionals\npapers3://publication/uuid/9FFBA56D-FCAE-4E7E-B36E-FE70955204F0
24 Baum FE. Health systems: how much difference can they make to health inequities?J Epidemiol Community Health 2016; doi:10.1136/jech-2015-207071.
25 Bunker J, Frazier H, Mosteller F. The role of medical care in determining health:creating an inventory of benefits. In: Amick B, Tarlov A, eds. Society and health.Oxford University Press, 1995:305–41.
26 Asaria M, Ali S, Doran T, et al. How a universal health systemreduces inequalities: lessons from England. J Epidemiol Community Health 2016;doi:10.1136/jech-2015-206742.
27 Doran T, Fullwood C, Kontopantelis E, et al. Effect of financial incentives oninequalities in the delivery of primary clinical care in England: analysis of clinicalactivity indicators for the quality and outcomes framework. Lancet2008;372:728–36.
28 Stafford M, Badland H, Nazroo J, et al. Evaluating the health inequalities impact ofarea-based initiatives across the socioeconomic spectrum: a controlled interventionstudy of the New Deal for Communities, 2002–2008. J Epidemiol CommunityHealth 2014;68:979–86.
29 Barr B, Bambra C, Whitehead M. The impact of NHS resource allocation policy onhealth inequalities in England 2001-11: longitudinal ecological study. BMJ2014;348:g3231.
30 Thomas B, Dorling D, Smith GD. Inequalities in premature mortality in Britain:observational study from 1921 to 2007. BMJ 2010;341:c3639.
31 Hacking JM, Muller S, Buchan IE. Trends in mortality from 1965 to 2008 across theEnglish north-south divide: comparative observational study. BMJ 2011;342:d508.
32 Maheswaran H, Kupek E, Petrou S. Self-reported health and socio-economicinequalities in England, 1996-2009: repeated national cross-sectional study. Soc SciMed 2015;136–137:135–46.
996 Asaria M, et al. J Epidemiol Community Health 2016;70:990–996. doi:10.1136/jech-2016-207447
Inequality and health on January 2, 2022 by guest. P
rotected by copyright.http://jech.bm
j.com/
J Epidem
iol Com
munity H
ealth: first published as 10.1136/jech-2016-207447 on 17 May 2016. D
ownloaded from