Embed Size (px)
Citation preview
Introduction Model Empirical Test Results Counterfactual Experiments Conclusion
Inferring Strategic VotingKawai and Watanabe (2010)
Allyson Pellissier
Presented at California Institute of [email protected]
February 2012

Introduction Model Empirical Test Results Counterfactual Experiments Conclusion
Outline
1 Introduction
2 Model
3 Empirical Test
4 Results
5 Counterfactual Experiments
6 Conclusion
Introduction Model Empirical Test Results Counterfactual Experiments Conclusion
Introduction
Main Question:“Can we identify the existence and estimate the prevalence ofstrategic voting empirically?”
Components:
• model based on Myerson and Weber (1993) and Myerson(2002)
• identification of misalinged voting in Japanese generalelections
• counterfactual experiments

Introduction Model Empirical Test Results Counterfactual Experiments Conclusion
Sincere, Strategic, and Misaligned Voting
Definitions:
• sincere voting: voting according to your preferences
• strategic voting: voting conditioned on pivotality
• misaligned voting: voting for a candidate other than themost-preferred; subset of strategic voting
• pivotality: the state of having the decisive vote between apair of candidates
Introduction Model Empirical Test Results Counterfactual Experiments Conclusion
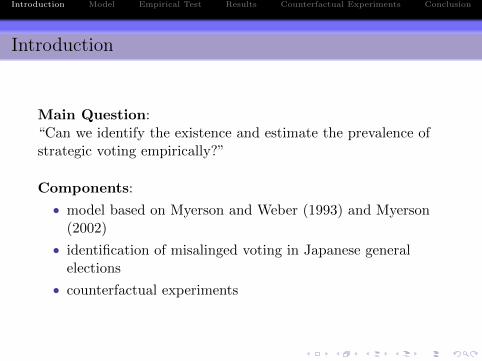
Setup
General Information:• plurality-rule with K candidates (restriction: K ≥ 3)
• M municipalities/ electoral district
• finite number of voters Nm in each district
Model:unk = u(xn, zk) + ξkm + εnk
• xn: voter characteristics
• zk: candidate characteristics
• ξkm: municipality-level shocks for candidate k
• εnk individual-level shocks for candidate k
Introduction Model Empirical Test Results Counterfactual Experiments Conclusion
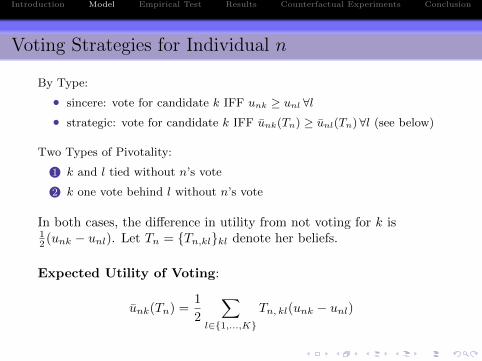
Voting Strategies for Individual n
By Type:
• sincere: vote for candidate k IFF unk ≥ unl ∀l• strategic: vote for candidate k IFF unk(Tn) ≥ unl(Tn) ∀l (see below)
Two Types of Pivotality:
1 k and l tied without n’s vote
2 k one vote behind l without n’s vote
In both cases, the difference in utility from not voting for k is12 (unk − unl). Let Tn = {Tn,kl}kl denote her beliefs.
Expected Utility of Voting:
unk(Tn) =1
2
∑l∈{1,...,K}
Tn, kl(unk − unl)
Introduction Model Empirical Test Results Counterfactual Experiments Conclusion
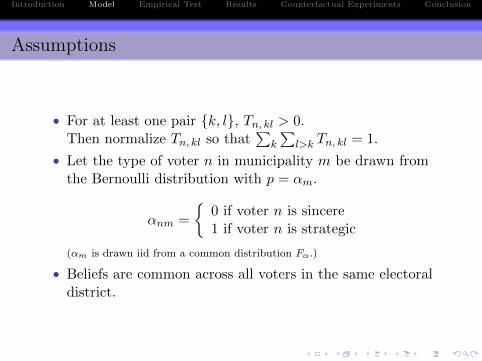
Assumptions
• For at least one pair {k, l}, Tn, kl > 0.Then normalize Tn, kl so that
∑k
∑l>k Tn, kl = 1.
• Let the type of voter n in municipality m be drawn fromthe Bernoulli distribution with p = αm.
αnm =
{0 if voter n is sincere1 if voter n is strategic
(αm is drawn iid from a common distribution Fα.)
• Beliefs are common across all voters in the same electoraldistrict.
Introduction Model Empirical Test Results Counterfactual Experiments Conclusion
Aggregating
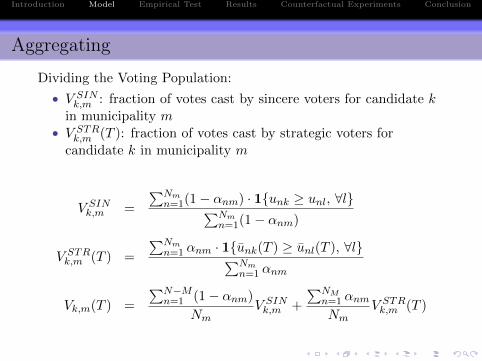
Dividing the Voting Population:
• V SINk,m : fraction of votes cast by sincere voters for candidate k
in municipality m• V STR
k,m (T ): fraction of votes cast by strategic voters forcandidate k in municipality m
V SINk,m =
∑Nmn=1(1− αnm) · 1{unk ≥ unl, ∀l}∑Nm
n=1(1− αnm)
V STRk,m (T ) =
∑Nmn=1 αnm · 1{unk(T ) ≥ unl(T ), ∀l}∑Nm
n=1 αnm
Vk,m(T ) =
∑N−Mn=1 (1− αnm)
NmV SINk,m +
∑NMn=1 αnmNm
V STRk,m (T )
Introduction Model Empirical Test Results Counterfactual Experiments Conclusion
Solution Outcomes
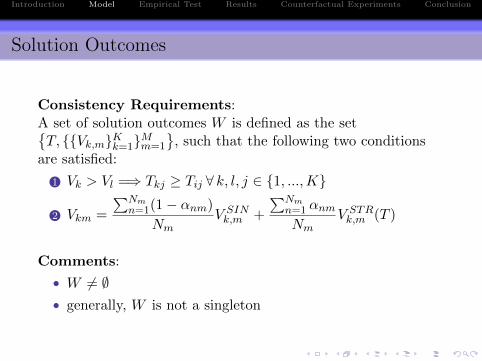
Consistency Requirements:A set of solution outcomes W is defined as the set{T, {{Vk,m}Kk=1}Mm=1
}, such that the following two conditions
are satisfied:
1 Vk > Vl =⇒ Tkj ≥ Tij ∀ k, l, j ∈ {1, ...,K}
2 Vkm =
∑Nmn=1(1− αnm)
NmV SINk,m +
∑Nmn=1 αnmNm
V STRk,m (T )
Comments:
• W 6= ∅• generally, W is not a singleton
Introduction Model Empirical Test Results Counterfactual Experiments Conclusion
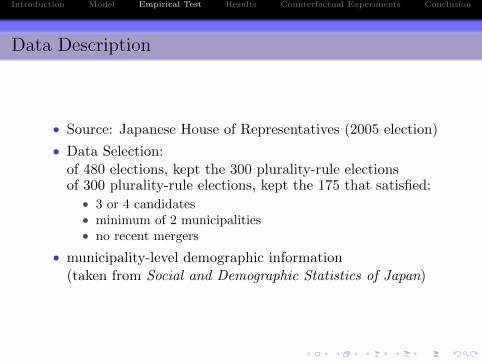
Data Description
• Source: Japanese House of Representatives (2005 election)
• Data Selection:of 480 elections, kept the 300 plurality-rule electionsof 300 plurality-rule elections, kept the 175 that satisfied:• 3 or 4 candidates• minimum of 2 municipalities• no recent mergers
• municipality-level demographic information(taken from Social and Demographic Statistics of Japan)

Introduction Model Empirical Test Results Counterfactual Experiments Conclusion
Specification (1 of 2)
unmk = u(xn, zkm; θPREF ) + ξkm + εnk
• xn: voter characteristics(education, income, elderly indicator)
• zkm = {zPOSk , zQLTY
km }: candidate characteristics
zPOSk : ideological characteristics
zQLTYkm : non-ideological characteristics
• θPREF : vector of preference parameters• ξkm ∼ N(0, θξ) ≡ Fξ• εnk follows Type-I extreme value distribution
Introduction Model Empirical Test Results Counterfactual Experiments Conclusion
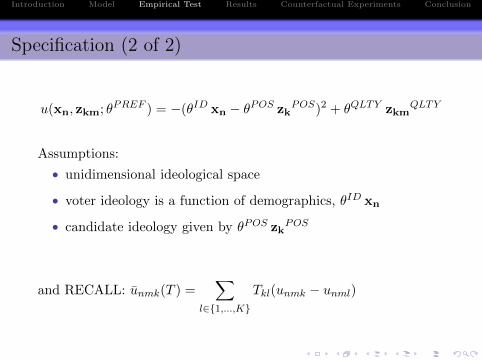
Specification (2 of 2)
u(xn, zkm; θPREF ) = −(θID xn − θPOS zkPOS)2 + θQLTY zkm
QLTY
Assumptions:
• unidimensional ideological space
• voter ideology is a function of demographics, θID xn
• candidate ideology given by θPOS zkPOS
and RECALL: unmk(T ) =∑
l∈{1,...,K}
Tkl(unmk − unml)

Introduction Model Empirical Test Results Counterfactual Experiments Conclusion
Identification
Assumptions:
• voting games are played in D districts, playedindependently of one another
• D →∞• Md <∞, where Md is the number municipalities in
district d
Types of Identification:
1 partial identification of preference parameters
2 partial identification of fraction of strategic voters
Introduction Model Empirical Test Results Counterfactual Experiments Conclusion
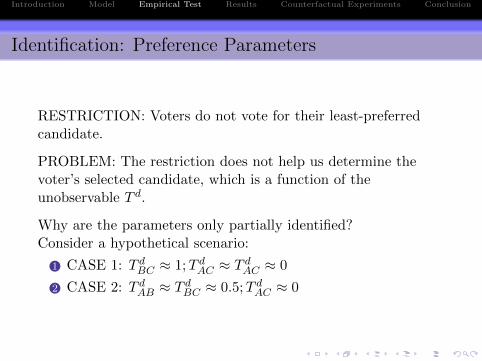
Identification: Preference Parameters
RESTRICTION: Voters do not vote for their least-preferredcandidate.
PROBLEM: The restriction does not help us determine thevoter’s selected candidate, which is a function of theunobservable T d.
Why are the parameters only partially identified?Consider a hypothetical scenario:
1 CASE 1: T dBC ≈ 1;T dAC ≈ T dAC ≈ 0
2 CASE 2: T dAB ≈ T dBC ≈ 0.5;T dAC ≈ 0

Introduction Model Empirical Test Results Counterfactual Experiments Conclusion

Introduction Model Empirical Test Results Counterfactual Experiments Conclusion
Identification: Fraction of Strategic Voters
• Given preference parameters, the model can predict what the voteshare would be in each municipality if the voters voted accordingto their preferences.
• If the proportion of strategic voters is large, though, the vote sharecan systematically diverge from the predicted outcome.
• Strategic voters make voting decisions conditional on the eventthat their votes are pivotal. If the beliefs regarding the probabilityof being pivotal differ across electoral districts, the behavior ofstrategic voters will also differ across districts. This corresponds todifferent outcomes being played in different districts.
• To the extent that preference parameters are only partiallyidentified, we can vary θPREF in the identified set: This allows usto trace out the identified set of the extent of strategic voting.
Introduction Model Empirical Test Results Counterfactual Experiments Conclusion
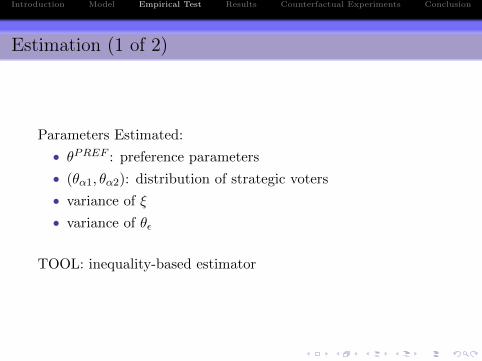
Estimation (1 of 2)
Parameters Estimated:
• θPREF : preference parameters
• (θα1, θα2): distribution of strategic voters
• variance of ξ
• variance of θε
TOOL: inequality-based estimator
Introduction Model Empirical Test Results Counterfactual Experiments Conclusion
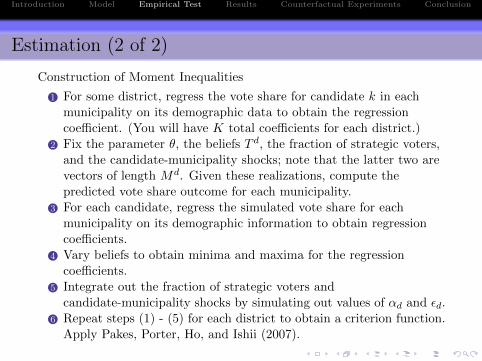
Estimation (2 of 2)
Construction of Moment Inequalities
1 For some district, regress the vote share for candidate k in eachmunicipality on its demographic data to obtain the regressioncoefficient. (You will have K total coefficients for each district.)
2 Fix the parameter θ, the beliefs T d, the fraction of strategic voters,and the candidate-municipality shocks; note that the latter two arevectors of length Md. Given these realizations, compute thepredicted vote share outcome for each municipality.
3 For each candidate, regress the simulated vote share for eachmunicipality on its demographic information to obtain regressioncoefficients.
4 Vary beliefs to obtain minima and maxima for the regressioncoefficients.
5 Integrate out the fraction of strategic voters andcandidate-municipality shocks by simulating out values of αd and εd.
6 Repeat steps (1) - (5) for each district to obtain a criterion function.Apply Pakes, Porter, Ho, and Ishii (2007).

Introduction Model Empirical Test Results Counterfactual Experiments Conclusion
Parameter Estimates
Introduction Model Empirical Test Results Counterfactual Experiments Conclusion
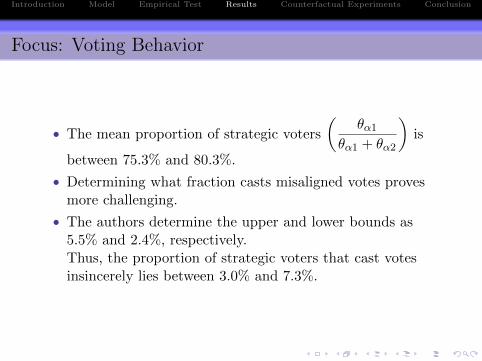
Focus: Voting Behavior
• The mean proportion of strategic voters
(θα1
θα1 + θα2
)is
between 75.3% and 80.3%.
• Determining what fraction casts misaligned votes provesmore challenging.
• The authors determine the upper and lower bounds as5.5% and 2.4%, respectively.Thus, the proportion of strategic voters that cast votesinsincerely lies between 3.0% and 7.3%.

Introduction Model Empirical Test Results Counterfactual Experiments Conclusion
Experiment 1 of 2: Proportional Representation
• Votes would not be “wasted” under PR, so less incentiveexists to vote strategically.
• The authors compute the counterfactual vote share byassuming that all voters vote for the party closest to theirown. Furthermore, they assume that each of the fourparties fields a candidate in the voter’s district.
• Two effects:
1 sincere-voting effect (change in behavior of strategic voters)2 choice-expansion effect
• To arrive at the distribution of seats, the authors multipliedeach party’s vote share by the total number of districts.
Introduction Model Empirical Test Results Counterfactual Experiments Conclusion
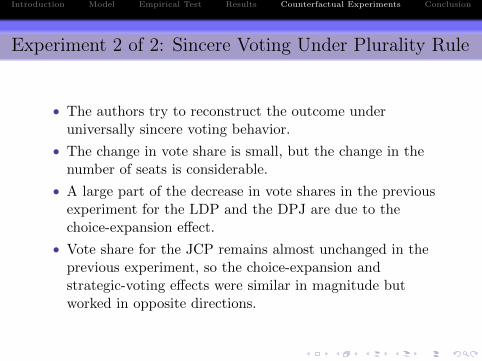
Experiment 2 of 2: Sincere Voting Under Plurality Rule
• The authors try to reconstruct the outcome underuniversally sincere voting behavior.
• The change in vote share is small, but the change in thenumber of seats is considerable.
• A large part of the decrease in vote shares in the previousexperiment for the LDP and the DPJ are due to thechoice-expansion effect.
• Vote share for the JCP remains almost unchanged in theprevious experiment, so the choice-expansion andstrategic-voting effects were similar in magnitude butworked in opposite directions.
Introduction Model Empirical Test Results Counterfactual Experiments Conclusion
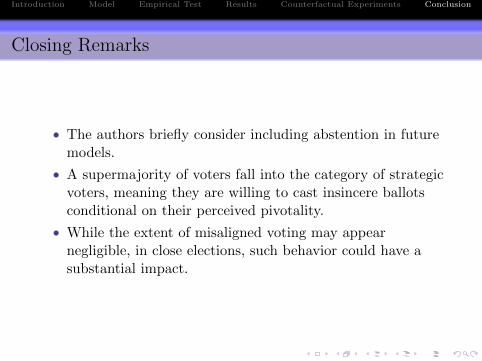
Closing Remarks
• The authors briefly consider including abstention in futuremodels.
• A supermajority of voters fall into the category of strategicvoters, meaning they are willing to cast insincere ballotsconditional on their perceived pivotality.
• While the extent of misaligned voting may appearnegligible, in close elections, such behavior could have asubstantial impact.