Embed Size (px)
Citation preview
Research ArticleInflammation-Related Patterns in the Clinical Staging andSeverity Assessment of Chronic Kidney Disease
Simona Mihai ,1 Elena Codrici ,1 Ionela D. Popescu,1 Ana-Maria Enciu ,1,2
Elena Rusu,3,4 Diana Zilisteanu,3,4 Laura G. Necula,5 Gabriela Anton,5
and Cristiana Tanase1,6
1Biochemistry-Proteomics Department, Victor Babes National Institute of Pathology, Splaiul Independentei 99-101, 050096 Sector 5,Bucharest, Romania2Cellular and Molecular Medicine Department, Carol Davila University of Medicine and Pharmacy, No. 8 B-dul Eroilor Sanitari,050474 Sector 5, Bucharest, Romania3Fundeni Clinic of Nephrology, Carol Davila University of Medicine and Pharmacy, Sos Fundeni 258, 022328 Sector 2,Bucharest, Romania4Nephrology Department, Fundeni Clinical Institute, Sos Fundeni 258, 022328 Sector 2, Bucharest, Romania5Molecular Virology Department, Stefan S. Nicolau Institute of Virology, Sos Mihai Bravu 285, 030304 Sector 3, Bucharest, Romania6Titu Maiorescu University, Cajal Institute, Faculty of Medicine, Strada Dâmbovnicului 22, 040441, Sector 4, Bucharest, Romania
Correspondence should be addressed to Elena Codrici; [email protected]
Received 12 June 2019; Revised 2 August 2019; Accepted 10 August 2019; Published 7 October 2019
Guest Editor: Christos Chadjichristos
Copyright © 2019 Simona Mihai et al. This is an open access article distributed under the Creative Commons Attribution License,which permits unrestricted use, distribution, and reproduction in any medium, provided the original work is properly cited.
Chronic kidney disease (CKD) is an irreversible loss of kidney function, and it represents a major global public health burden due toboth its prevalence and its continuously increasing incidence. Mineral bone disorders (MBDs) constitute a hallmark of CKD, andalongside cardiovascular complications, they underlie a poor prognosis for these patients. Thus, our study focused on novel CKDbiomarker patterns and their impact on the clinical staging of the disease. As a first testing approach, the relative expressionlevels of 105 proteins were assessed by the Proteome Profiler Cytokine Array Kit for pooled CKD stage 2–4 serum samples toestablish an overall view regarding the proteins involved in CKD pathogenesis. Among the molecules that displayed significantdysregulation in the CKD stages, we further explored the involvement of Dickkopf-related protein 1 (Dkk-1), a recognisedinhibitor of the Wnt signalling pathway, and its crosstalk with 1,25OH2D3 (calcitriol) as new players in renal bone and vasculardisease. The serum levels of these two molecules were quantified by an ELISA (76 samples), and the results reveal decreasingcirculating levels of Dkk-1 and calcitriol in advanced CKD stages, with their circulating expression showing a downward trendas the CKD develops. In the next step, we analysed the inflammation and MBD biomarkers’ expression in CKD (by xMAParray). Our results show that the molecules involved in orchestrating the inflammatory response, interleukin-6 (IL-6) andtumour necrosis factor alpha (TNFα), as well as the mineral biomarkers osteoprotegerin (OPG), osteocalcin (OC), osteopontin(OPN), and fibroblast growth factor 23 (FGF-23), correlate with Dkk-1 and calcitriol, raising the possibility of them beingpotential useful CKD biomarkers. These results reveal the impact of different biomarker patterns in CKD staging and severity,thus opening up novel approaches to be explored in CKD clinical management.
1. Introduction
Chronic kidney disease (CKD) represents a major global dis-ease that covers all degrees of injured renal function, with arising incidence and prevalence of kidney failure resultingin poor outcomes and high economic costs. According to
the Kidney Disease Improving Global Outcomes (KDIGO)2017 Clinical Practice Guideline Update for the Diagnosis,Evaluation, Prevention, and Treatment of Chronic KidneyDisease: Mineral and Bone Disorder (CKD-MBD), thedisease is defined as “abnormalities of the kidney structureor function, present for more than 3 months, with
HindawiDisease MarkersVolume 2019, Article ID 1814304, 12 pageshttps://doi.org/10.1155/2019/1814304

implications for health” [1]. The characteristic features ofCKD are the progressive and irreversible loss of renal func-tion, which results in extensive kidney damage, leadingunconditionally to end-stage renal disease (ESRD). Over thelast 10 years, CKD has reached epidemic proportions, witha constant increase in terms of both prevalence andincidence, and it has been classified by the Global Burden ofDisease Study as “the 12th most common cause of death,accounting for 1.1 million deaths worldwide.” Overall, itspoor prognoses ranked CKD as “the 17th leading cause ofglobal year loss of life and the 3rd largest increase of anymajor cause of death” [2, 3].
Cardiovascular disease (CVD) is noted as the main causeof morbidity and mortality in these patients, while CKD isconsidered an accelerator of cardiovascular events and anindependent risk factor for CVD. It was also shown that allCKD stages are accompanied by an elevated risk of cardio-vascular complications and a decreased quality of life [4].
The causes of high cardiovascular mortality related toCKD have been attributed in part to CKD-MBD syndrome,which generates a unique environment that acceleratesvascular calcification (VC)—the pathological deposition ofcalcium phosphate in the vasculature’s medial layer. Evenin the early CKD stages, the systemic mineral metabolismand bone composition begin to alter; thus, the dysregulationof mineral metabolism is considered a key player in CKDpathophysiology.
An imbalance in the kidney-vascular-bone axis, a multi-faceted active process, is induced by mineral metabolismdisorders and also by local inflammation; nevertheless, themost extensive mineral disorders are experienced by patientssuffering from CKD [5].
The discovery of Wnt inhibitors, among them Dickkopf-related protein 1 (Dkk-1), released during renal repair ascrucial components of mineral bone disorder (MBD) patho-genesis, suggests that additional pathogenic factors need to beexplored [6, 7].
Elucidating the signalling pathways involved in vascularsmooth muscle cell calcification holds the promise of beingable to unravel novel therapeutic approaches counteractingthe progression of MBDs in CKD.
Various factors mediate the VC mechanisms includingdisturbances in the serum calcium/phosphate balance, sys-temic and local inflammation, the receptor activator ofnuclear factor kappa B (RANK)/RANK ligand (RANK-L)/osteoprotegerin (OPG) triad, aldosterone, microRNAs,osteogenic transdifferentiation, and the effects of vitamins[8]. The emerging role of 1,25-dihydroxyvitamin D3 (calci-triol, 1,25OH2D3) in CKD has been extensively explored,since vitamin D deficiency/insufficiency is known to becommon among patients with CKD or in those undergoingdialysis. Vitamin D has pleiotropic effects on the immune,cardiovascular, and neurological systems, and many extrare-nal organs have the enzymatic capability to convert 25OHD3to 1,25OH2D3. It was also hypothesised that serum1,25OH2D3 and 25OHD expressions tend to positively corre-late, together with the renal function, as well [9].
Persistent low-grade inflammation is currently consid-ered an essential part of CKD and as a traditional risk factor
for renal pathology, hugely contributing to the developmentof all-cause mortality in these patients [10]. The role ofproinflammatory cytokine overexpression inside the renalpatient’s landscape has drawn considerable attention, andvarious studies have explored the potential link betweeninflammatory status and renal function decline [11, 12]. Achallenging theory regarding the direct consequence ofinflammation on the progression of both CKD and CVDwas developed based on the supposition of this associationbetween markers of inflammation and an estimated glomer-ular filtration rate (eGFR) imbalance [13].
Despite the accessibility to the studies published in thepast few years, the KDIGO Guideline Committee underlinesthe lack of strong clinical proof, emphasizing the critical roleof understanding the mechanisms underlying the disease’sdevelopment, yet stressing the need for comprehensive, accu-rate clinical trials in this direction [14].
Considering the aforementioned aspects, in this study,the correlation between the severity of CKD and inflamma-tory factors, MBD biomarkers, and other novel biomarkerswith an impact on CKD’s pathophysiology was investigatedto reveal potential proteome patterns that better characterisethe condition characteristic of each stage of CKD.
2. Materials and Methods
2.1. Patients and Samples
2.1.1. Study Population. We included 56 patients in ourcross-sectional study who were diagnosed with CKD accord-ing to the KDIGO Guidelines alongside 20 normal controls.The CKD patients were divided into three groups based onthe CKD staging criteria as follows: 16 patients with CKDstage 4 (25% female and 75% male; mean age 63 ± 14:8),26 with CKD stage 3 (31% female and 69% male; meanage 68 ± 8:5), and 14 with CKD stage 2 (29% female and71% male; mean age 65 ± 10:3). Written informed consentwas obtained from all subjects prior to their inclusion inthe study according to the Helsinki Declaration and EthicsCommittee that approved this study.
Patients with acute infections, acute heart failure and sig-nificant heart valvular disease, chronic use of glucocorticoidsand immunosuppressive agents, and knownmalignancy wereexcluded from our study. In addition, in order to avoidthe potential bias, patients undergoing vitamin D syntheticanalogue treatment were also excluded.
2.1.2. Clinical and Biochemical Assessment. On the day theblood samples were collected, clinical and anthropometricdata were gathered: age, sex, weight, height, medical history,and concomitant treatment. Laboratory tests were performedon admission, namely, haemoglobin, haematocrit, serum cre-atinine, urea, uric acid, glucose, total cholesterol, triglycer-ides, alkaline phosphatase, phosphate, calcium, albumin,and fibrinogen. The eGFR was calculated based on theCKD-epidemiology collaboration (EPI) equation. Urinaryprotein excretion was determined from a 24h urine sample.
The blood samples were harvested the morning after a12 h fast. After a standard centrifugation, the serum was ali-quoted and stored at −80°C pending further analysis.
2 Disease Markers

2.2. Human Dot-Blot Proteome Profiler. Semiquantitativeimmunodetection of serum cytokines, chemokines, growthfactors, angiogenesis markers, and other soluble proteinswas performed using the immuno-dot-blot method in theProteome Profiler Human XL Cytokine Array Kit (ARY022B,R&D Systems, Inc., Abingdon, UK). A number of 105 cap-tured antibodies, along with reference controls, were spottedin duplicate on nitrocellulose membranes and incubatedovernight with 100mL of pooled serum samples. Each ofthe four pools was obtained by mixing the serum samplesfrom CKD patients in stages 4, 3, and 2, respectively; the4th pool was assigned to control sera. The protocol recom-mended by the manufacturer was followed accordingly. Themembranes were incubated with biotinylated detectionantibodies, streptavidin-horseradish peroxidase (HRP), andchemoluminescent detection reagents. Chemiluminescencesignals, corresponding to the amount of protein bound, weredetected using the MicroChemi 4.2 System (DNR Bio-Imaging Systems, Israel), and the intensity of the chemilumi-nescence signals (pixel densities) was measured using ImageJ1.42 software (National Institute of Health, Bethesda, MD,USA). For each measured analyte, the average signal of theduplicate spots was determined and normalised to the aver-age signal of the reference spots after being corrected withthe background signal.
2.3. ELISA Immunoassay. Dkk-1 serum levels were assessedusing the Quantikine ELISA Human Dkk-1 ImmunoassayKit (R&D Systems, Inc., USA) according to the manufac-turer’s protocol. The quantitative determination of the calci-triol (1,25OH2D3 (1,25-dihydroxyvitamin D3)) serum levelswas made using the EIAab ELISA General Calcitriol Kit(Wuhan EIAab Science Co., Ltd., China), and the manufac-turer’s instructions were followed accordingly. The opticaldensities were measured using an Anthos Zenyth 3100Microplate Multimode Detector.
2.4. Luminex xMAP Array Analysis. The Luminex xMAParray procedure was performed according to the manufac-turer’s instructions. The serum levels of the 6-plex analyteswere simultaneously quantified on the Luminex 200 multi-plexing platform. The Luminex xMAP array technique isbased on proprietary colour-coded microspheres coated withspecific capture antibodies. After the analytes from the serumsamples were captured by the bead cocktail, a biotinylateddetection antibody was added. The reaction mixture was thenincubated with the reporter molecule conjugate (streptavi-din-phycoerythrin (SA-PE)) to complete the reaction on thesurface of the microspheres. After the reaction steps had beencompleted, the microspheres were passed rapidly through ared laser which excited the internal dyes, thus identifyingeach unique microsphere set. The green laser excited PE,the fluorescent dye on the reporter molecule, which wasdirectly correlated with the amount of analyte found in thesample. All the acquired data was processed by high-speeddigital-signal processors and by xPONENT 3.1 software, gen-erating results expressed in pg/mL.
Cytokine levels and BMD biomarkers were assayed usingthe MILLIPLEXMAPHuman Bone Magnetic Bead Panel Kit
(Merck-Millipore, Billerica, MA, USA), which comprises acocktail of six analytes: proinflammatory cytokines IL-6and TNF-α and the MBD biomarkers OPG, osteocalcin(OCN), osteopontin (OPN), and fibroblast growth factor23 (FGF-23).
For all the biological specimens, duplicate samples wereused and their average concentrations were taken into con-sideration for further statistical analysis.
2.5. Statistical Analysis. As a first statistical approach, weapplied the Kolmogorov-Smirnov and D’Agostino and Pear-son normality tests to all the CKD and control samples underanalysis. The Kolmogorov-Smirnov test was used to evaluatethe normality of the data distribution. The groups presentedwith a nonnormal distribution (p < 0:0001); therefore, non-parametric statistical tests were used for further analysis.The groups were not homogeneous in terms of age and gen-der, but according to the results obtained after applying theChi-square test, they did not influence the level of the ana-lysed molecules; age was expressed as the mean ± SD. Thedifferences between the variables were analysed using theKruskal-Wallis test (a one-way analysis of variance) followedby a Bonferroni post hoc test to compare the results inside thedifferent CKD stage groups. The Chi-square test for trendswas applied to reveal the differences in molecule expressionbetween the various CKD stages. The differences betweenthe nominal variables were analysed using Chi-square tests(r, p). A value of p < 0:05 was considered statistically signifi-cant (∗p < 0:05, ∗∗p < 0:01, and ∗∗∗p < 0:001). Spearman’scorrelation analysis was used to evaluate the correlationsbetween the analysed markers (r, p). GraphPad Prism version5 software for Windows was used for the statistical analysis.
3. Results and Discussion
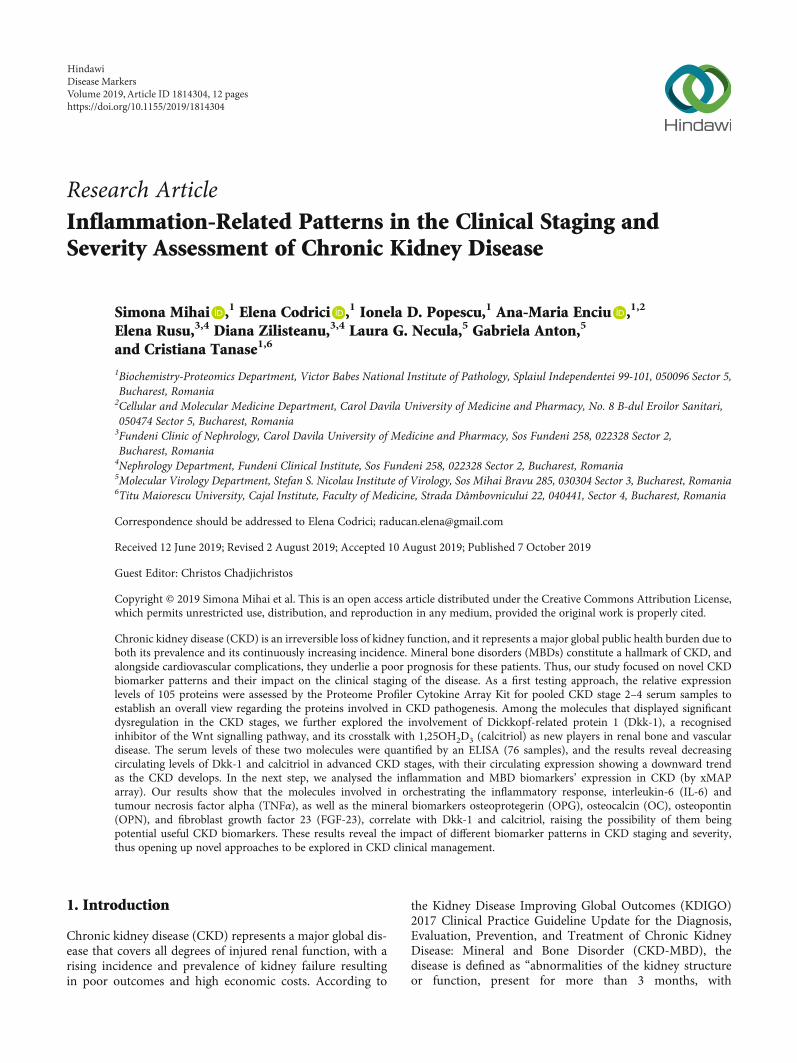
3.1. Proteome Profiler for CKD Clinical Staging by Dot-BlotArray Assessment. An overall perspective on the multipleproteins that are differentially expressed in the CKD stagesand thus potentially influence CKD’s pathophysiology wasgained by performing semiquantitative dot-blot immunode-tection [15, 16]. Out of 105 molecules included in the Prote-ome Profiler Human XL Cytokine Array Kit, 24 relevantmolecules were identified as expressing significant levels inCKD patients versus the control group. At first glance, thedot-blot analysis revealed that molecules orchestrating theinflammatory response were significantly overexpressed inCKD; moreover, the multianalyte screening showed differentpatterns of expression depending on the CKD stage (as illus-trated in Figure 1). The integrated relative pixel density ofthese molecules trended towards a progressive pattern ofexpression, exhibiting gradual amounts depending on thestage of renal disease. The most significant expression levelfor proteins was identified in CKD stage 4. Among theproteins that displayed a significant fold change versus thecontrol (about a 1.5-fold change), markers for inflammatoryresponse were identified, reflecting the high significance ofthe inflammatory component in CKD. Among them, IL-6,IL-8, IL-12, IL-18, interferon gamma (IFN-γ), the regulatedupon activation normal T-cell expressed and secreted
3Disease Markers
(RANTES), the receptor for advanced glycation end products(RAGE), intercellular adhesion molecule 1 (ICAM-1), induc-ible protein 10 (IP-10), plasminogen activator inhibitor 1(PAI-1), platelet-derived growth factor (PDGF), and otherswere identified as having a place in the CKD proteomepattern, as shown in Figure 1.
Persistent, low-grade inflammation constitutes a commonfeature of the disease, which accompanies CKD from its onset[17]. Inflammatory biomarkers such as C-reactive protein andIL-6 are known to independently predict mortality in thesepatients. The origins of inflammation in kidney disease aremultifactorial, including the imbalance between proinflamma-tory increased production, induced on the one hand by varioussources of inflammatory stimuli (oxidative stress, acidosis,comorbidities, genetic and epigenetic influences, etc.) and onthe other hand by their insufficient elimination due toimpaired glomerular filtration [18]. IL-6 hastens the develop-ment of CKD not only by aggravating kidney injury but alsoby initiating its complications, especially the cardiovascularones. It is well established that IL-6 initiates the endothelialinjury mostly by reducing endothelial nitric oxide synthaseand adiponectin (an antiatherogenic adipokine) expression,thus contributing to the increased incidence of cardiovascularevents in CKD patients. Taken together, an increased IL-6level not only is a consequence of CKD but also acts as a triggerfor CKD-related complications [19].
Mediators of inflammation have been shown to be at highlevels in CKD patients. IL-12 and IL-18 are elevated duringthe earlier stages of CKD, and the association with eGFRsuggests that IL-18 is mainly dependent upon renal clearance,as suggested by Yong et al. [20].
The urokinase receptor system, a key regulator at theintersection between inflammation, immunity, and coagula-tion [21], has also been shown to significantly increase inCKD patients. Nuclear factor kappa B (NF-κB), a pivotalmediator of inflammatory responses through triggering the
prototypical proinflammatory signalling pathway, appearsto mediate renal inflammation in different cell types includ-ing renal cells, innate immune cells, and lymphocytes [22,23]. It was shown that NF-κB also controls several genesinvolved in inflammation, and RAGE (an advanced glycationend-product-specific receptor) itself seems to be upregulatedby NF-κB [24].
The pleiotropic cytokine OPN is increased in earlyCKD stages, and its circulatory level increases with theseverity of the disease stage. OPN is an important factorin bone remodelling, as it is involved in the pathogenesisof both kidney and cardiovascular diseases. Barreto et al.reported a positive correlation between OPN levels andthe clinical outcomes of CKD patients depending on theirinflammatory status [25].
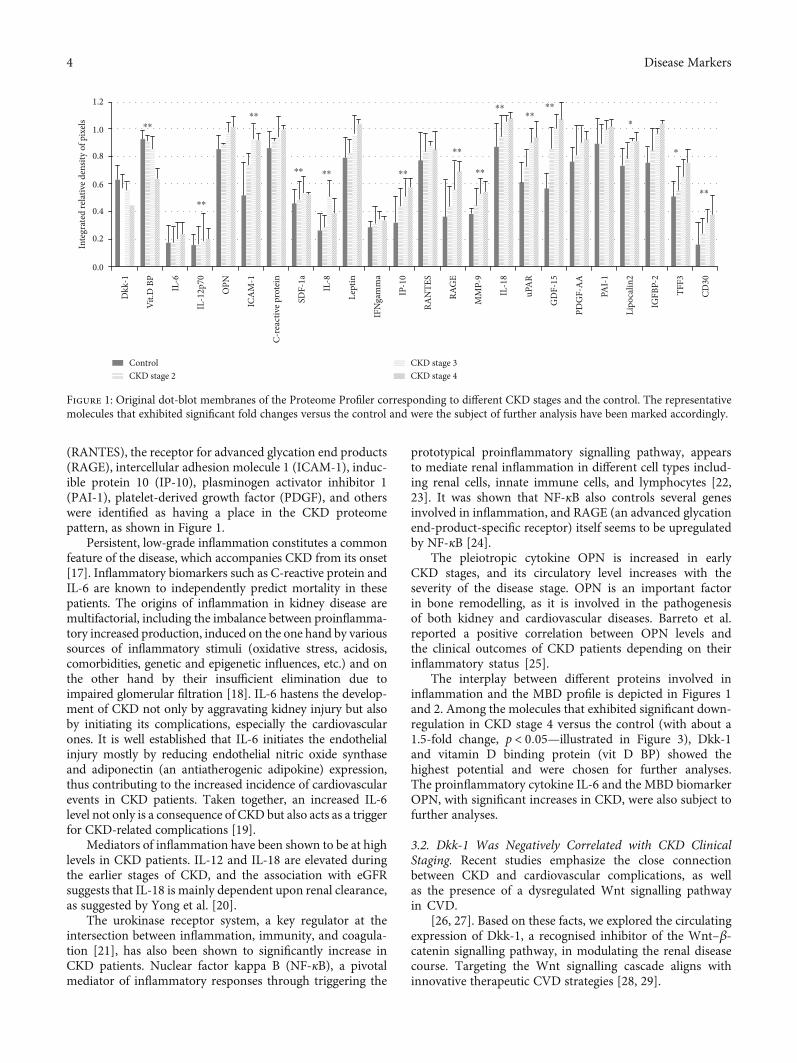
The interplay between different proteins involved ininflammation and the MBD profile is depicted in Figures 1and 2. Among the molecules that exhibited significant down-regulation in CKD stage 4 versus the control (with about a1.5-fold change, p < 0:05—illustrated in Figure 3), Dkk-1and vitamin D binding protein (vit D BP) showed thehighest potential and were chosen for further analyses.The proinflammatory cytokine IL-6 and the MBD biomarkerOPN, with significant increases in CKD, were also subject tofurther analyses.
3.2. Dkk-1 Was Negatively Correlated with CKD ClinicalStaging. Recent studies emphasize the close connectionbetween CKD and cardiovascular complications, as wellas the presence of a dysregulated Wnt signalling pathwayin CVD.
[26, 27]. Based on these facts, we explored the circulatingexpression of Dkk-1, a recognised inhibitor of the Wnt–β-catenin signalling pathway, in modulating the renal diseasecourse. Targeting the Wnt signalling cascade aligns withinnovative therapeutic CVD strategies [28, 29].
CKD stage 4CKD stage 3
CKD stage 2Control
⁎⁎
⁎⁎
⁎⁎
⁎⁎ ⁎⁎
⁎⁎
⁎⁎
⁎⁎
⁎⁎
⁎⁎⁎⁎
Inte
grat
ed re
lativ
e den
sity
of p
ixel
s
1.2
1.0
0.8
0.6
0.4
0.2
0.0
Dkk
-1
Vit.D
BP
IL-6
IL-1
2p70
OPN
ICA
M-1
C-re
activ
e pro
tein
SDF-
1a
IL-8
Lept
in
IFN
gam
ma
IP-1
0
RAN
TES
RAG
E
MM
P-9
IL-1
8
uPA
R
GD
F-15
PDG
F-A
A
PAI-
1
Lipo
calin
2
IGFB
P-2
TFF3
CD30
⁎⁎
⁎
⁎
Figure 1: Original dot-blot membranes of the Proteome Profiler corresponding to different CKD stages and the control. The representativemolecules that exhibited significant fold changes versus the control and were the subject of further analysis have been marked accordingly.
4 Disease Markers
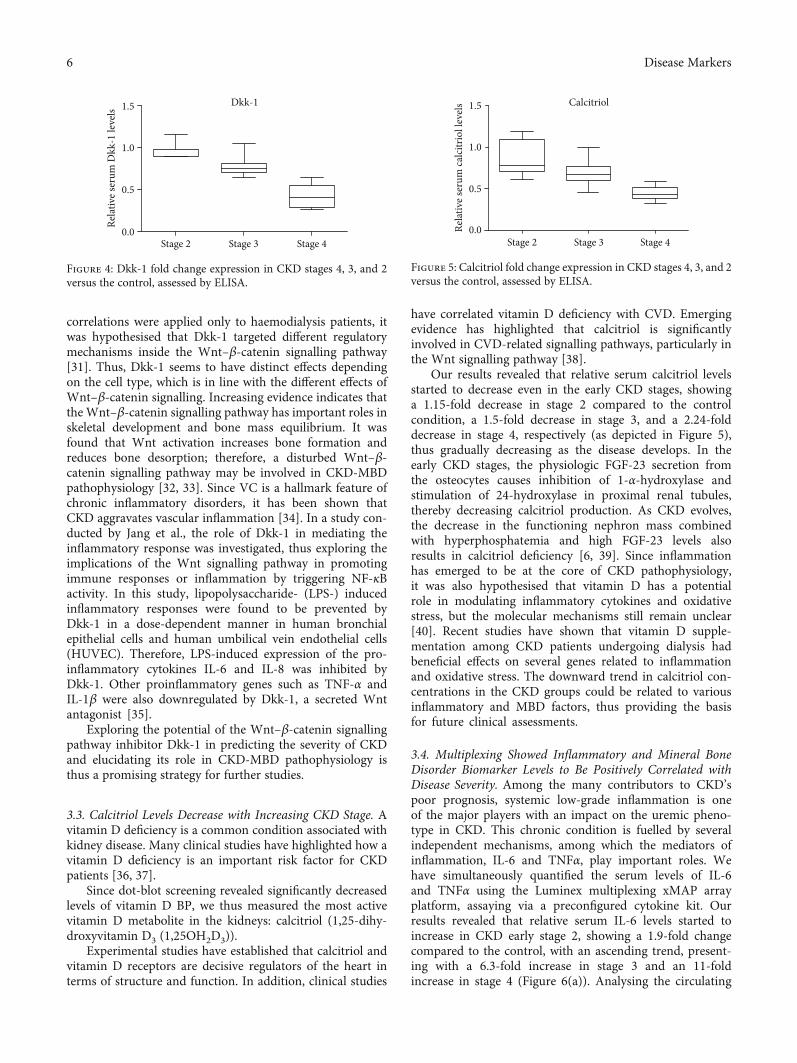
The significant downregulation of Dkk-1 in CKD stage4, determined via a dot-blot analysis, was further con-firmed by running a quantitative ELISA. Our resultsshowed a statistically significant decreased expression ofDkk-1 in CKD patients compared to the control group(p < 0:05, Figure 4).
Relative serum Dkk-1 levels decreased even in the earlystages of CKD, with a 1.05-fold decrease in stage 2 versusthe control and a 1.3-fold decrease in stage 3. Dkk-1 circulat-
ing levels showed a downward trend, culminating in stage 4,where a significant 2.36-fold decrease was recorded versus thecontrol. Recent studies have also reported that serum Dkk-1levels were lower in CKD patients as compared with controlsand that Dkk-1 levels had a tendency to decrease withthe progressive development of CKD [30]. Interestingly,Behets et al. reported lower levels in CKD patients than inthe controls, but Dkk-1 levels were not associated with thelaboratory parameters of mineral metabolism. Since these
Control
CKDstage 3
CKDstage 2
CKDstage 4
Reference
Reference ReferenceDKK-1
Vit. DBP
Reference Vit. DBP
IL-6 Reference ReferenceDKK-1IL-6
Reference ReferenceDKK-1IL-6Reference ReferenceDKK-1IL-6OPN
OPN
Reference Vit. DBP
OPN
Reference Vit. DBP
OPN
Figure 2: Serum protein profiling in CKD stages 2–4 versus the control. The integrated relative density of the pixels was calculated for eachmolecule after normalisation to the average signal of the reference spots. The molecules showed an ascending trend of expression according tothe severity of the disease; Dkk-1 and vit D BP showed a descending trend.
−1.5
−1
−0.5
0
0.5
1
1.5
2
2.5
Fold
chan
ge-
CKD
stag
e 4 v
ersu
s con
trol
Dkk
-1Vi
t.D B
PIL
-6IL
-12p
70O
PNIC
AM
-1C-
reac
tive p
rote
inSD
F-1a
IL-8
Lept
inIF
Nga
mm
aIP
-10
RAN
TES
RAG
EM
MP-
9IL
-18
uPA
RG
DF-
15PD
GF-
AA
PAI-
1Li
poca
lin2
IGFB
P-2
TFF3
CD30
Figure 3: The fold change in protein expression in CKD stage 4 versus the control. The average for the control group was established at 1.0,and for each analysed molecule, the fold change was expressed as the CKD stage 4/control ratio.
5Disease Markers
correlations were applied only to haemodialysis patients, itwas hypothesised that Dkk-1 targeted different regulatorymechanisms inside the Wnt–β-catenin signalling pathway[31]. Thus, Dkk-1 seems to have distinct effects dependingon the cell type, which is in line with the different effects ofWnt–β-catenin signalling. Increasing evidence indicates thatthe Wnt–β-catenin signalling pathway has important roles inskeletal development and bone mass equilibrium. It wasfound that Wnt activation increases bone formation andreduces bone desorption; therefore, a disturbed Wnt–β-catenin signalling pathway may be involved in CKD-MBDpathophysiology [32, 33]. Since VC is a hallmark feature ofchronic inflammatory disorders, it has been shown thatCKD aggravates vascular inflammation [34]. In a study con-ducted by Jang et al., the role of Dkk-1 in mediating theinflammatory response was investigated, thus exploring theimplications of the Wnt signalling pathway in promotingimmune responses or inflammation by triggering NF-κBactivity. In this study, lipopolysaccharide- (LPS-) inducedinflammatory responses were found to be prevented byDkk-1 in a dose-dependent manner in human bronchialepithelial cells and human umbilical vein endothelial cells(HUVEC). Therefore, LPS-induced expression of the pro-inflammatory cytokines IL-6 and IL-8 was inhibited byDkk-1. Other proinflammatory genes such as TNF-α andIL-1β were also downregulated by Dkk-1, a secreted Wntantagonist [35].
Exploring the potential of the Wnt–β-catenin signallingpathway inhibitor Dkk-1 in predicting the severity of CKDand elucidating its role in CKD-MBD pathophysiology isthus a promising strategy for further studies.
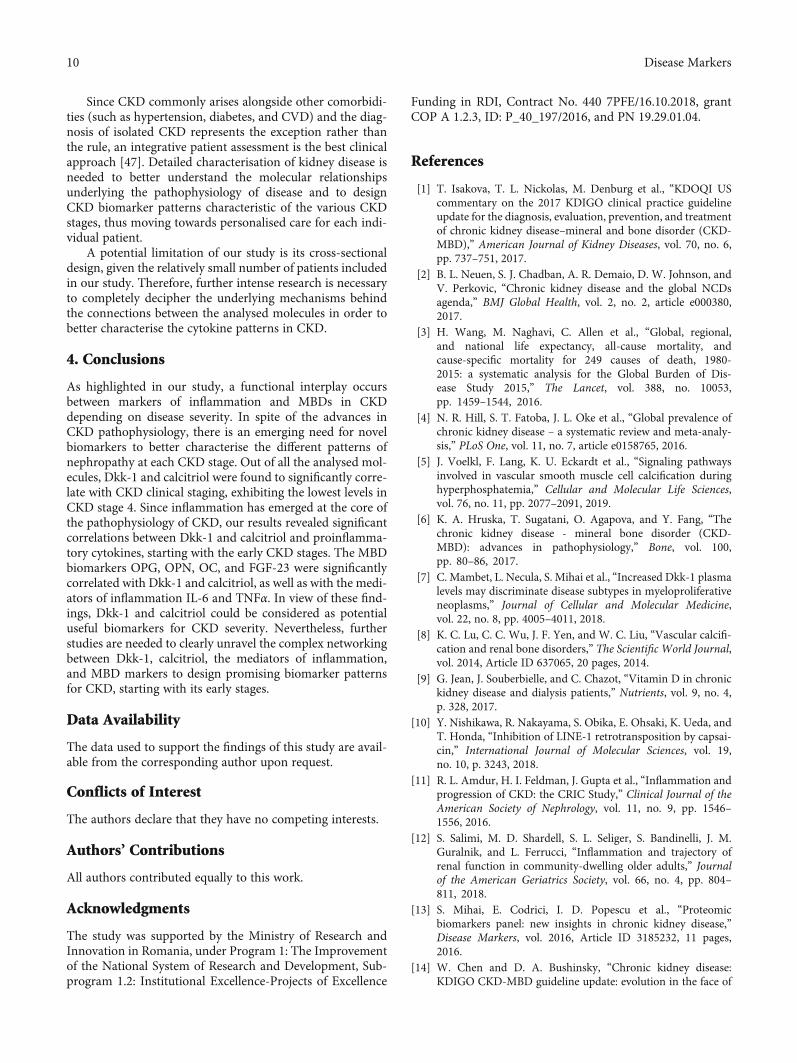
3.3. Calcitriol Levels Decrease with Increasing CKD Stage. Avitamin D deficiency is a common condition associated withkidney disease. Many clinical studies have highlighted how avitamin D deficiency is an important risk factor for CKDpatients [36, 37].
Since dot-blot screening revealed significantly decreasedlevels of vitamin D BP, we thus measured the most activevitamin D metabolite in the kidneys: calcitriol (1,25-dihy-droxyvitamin D3 (1,25OH2D3)).
Experimental studies have established that calcitriol andvitamin D receptors are decisive regulators of the heart interms of structure and function. In addition, clinical studies
have correlated vitamin D deficiency with CVD. Emergingevidence has highlighted that calcitriol is significantlyinvolved in CVD-related signalling pathways, particularly inthe Wnt signalling pathway [38].
Our results revealed that relative serum calcitriol levelsstarted to decrease even in the early CKD stages, showinga 1.15-fold decrease in stage 2 compared to the controlcondition, a 1.5-fold decrease in stage 3, and a 2.24-folddecrease in stage 4, respectively (as depicted in Figure 5),thus gradually decreasing as the disease develops. In theearly CKD stages, the physiologic FGF-23 secretion fromthe osteocytes causes inhibition of 1-α-hydroxylase andstimulation of 24-hydroxylase in proximal renal tubules,thereby decreasing calcitriol production. As CKD evolves,the decrease in the functioning nephron mass combinedwith hyperphosphatemia and high FGF-23 levels alsoresults in calcitriol deficiency [6, 39]. Since inflammationhas emerged to be at the core of CKD pathophysiology,it was also hypothesised that vitamin D has a potentialrole in modulating inflammatory cytokines and oxidativestress, but the molecular mechanisms still remain unclear[40]. Recent studies have shown that vitamin D supple-mentation among CKD patients undergoing dialysis hadbeneficial effects on several genes related to inflammationand oxidative stress. The downward trend in calcitriol con-centrations in the CKD groups could be related to variousinflammatory and MBD factors, thus providing the basisfor future clinical assessments.
3.4. Multiplexing Showed Inflammatory and Mineral BoneDisorder Biomarker Levels to Be Positively Correlated withDisease Severity. Among the many contributors to CKD’spoor prognosis, systemic low-grade inflammation is oneof the major players with an impact on the uremic pheno-type in CKD. This chronic condition is fuelled by severalindependent mechanisms, among which the mediators ofinflammation, IL-6 and TNFα, play important roles. Wehave simultaneously quantified the serum levels of IL-6and TNFα using the Luminex multiplexing xMAP arrayplatform, assaying via a preconfigured cytokine kit. Ourresults revealed that relative serum IL-6 levels started toincrease in CKD early stage 2, showing a 1.9-fold changecompared to the control, with an ascending trend, present-ing with a 6.3-fold increase in stage 3 and an 11-foldincrease in stage 4 (Figure 6(a)). Analysing the circulating
1.5
1.0
0.5
0.0Stage 2 Stage 3 Stage 4
Dkk-1Re
lativ
e ser
um D
kk-1
leve
ls
Figure 4: Dkk-1 fold change expression in CKD stages 4, 3, and 2versus the control, assessed by ELISA.
1.5
1.0
0.5
0.0Stage 2 Stage 3 Stage 4
Relat
ive s
erum
calc
itrio
l lev
els Calcitriol
Figure 5: Calcitriol fold change expression in CKD stages 4, 3, and 2versus the control, assessed by ELISA.
6 Disease Markers

expression of TNFα, we also observed an ascending trend,with a 3.3-fold increase in stage 4 versus the control, andas for CKD stages 3 and 4, the increases were 1.8-foldand 1.7-fold, respectively (Figure 6(b)).
Given the fact that various cytokines mediate the inflam-matory response, the extent to which inflammation plays arole in raising the risk of MBDs in CKD remains unclear.Regarding the MBD molecules, we analysed the serum levelsfor OPG, OC, OPN, and FGF-23. All these biomarkers pre-sented with an upward trend of expression, correlated withdisease severity. In CKD stage 4, the circulatory levels showedthe most significant differences compared to the control, asfollows: for OPG, a 3.14-fold increase; for OC, a 4.6-foldincrease; for OPN, a 7-fold increase; and for FGF-23, a 17-fold increase. Our results suggest that the serum levels ofthe above-mentioned molecules start to increase progres-sively, even from the CKD early stage 2, as depicted inFigures 6(c)–6(f).
Since all the analysed biomarkers expressed the highestconcentrations in the most advanced stage of the disease,and given that the circulatory trend increases as the diseaseevolves, we considered it necessary to further analyse the pos-sible correlations between these molecules that had a poten-tial impact on CKD pathogenesis.
3.5. Correlations between Orchestrators of InflammatoryResponse and Biomarkers of Mineral and BoneDisorders in CKD
3.5.1. The Trend for Biomarker Expression Was ModifiedDepending on the CKD Stage. The pathophysiologic inter-play between mediators of inflammation and the moleculesinvolved in MBDs was further analysed to establish potentialsignificant correlations at each stage of renal disease. Byapplying the Chi-square test for trends, it was found that eachCKD stage had its own unique biomarker signature.
In CKD stage 4, we found a strong positive correlationbetween Dkk-1 and calcitriol and a negative correlationbetween Dkk-1 and IL-6, OPG, OC, OPN, and FGF-23(p < 0:001, Chi-square test for trends). Renal function(eGFR) was positively correlated with Dkk-1 in CKD stage4 (p < 0:001).
Yeremenko et al. also observed an inverse correlationbetween Dkk-1 and IL-6 in a study on inflamed arthriticjoints, potentially reflected by the differential regulation ofDkk-1 production by TNFα and IL-6 [41]. Besides, it wassuggested that there were other recognised signalling path-ways that Dkk-1 utilises other than the well-known canonicalWnt pathway [42]. Another study highlighted that the
IL-6
Relat
ive s
erum
IL-6
leve
ls 25
20
15
10
5
0Stage 2 Stage 3 Stage 4
(a)
Stage 2 Stage 3 Stage 4
15
10
5
0Relat
ive s
erum
TN
F𝛼 le
vels TNF𝛼
(b)
Relat
ive s
erum
OPG
leve
ls
Stage 2 Stage 3 Stage 4
6
4
2
0
OPG
(c)
Relat
ive s
erum
OC
leve
ls OC
Stage 2 Stage 3 Stage 4
15
10
5
0
(d)
Relat
ive s
erum
OPN
leve
ls
Stage 2 Stage 3 Stage 4
20
15
10
5
0
OPN
(e)
FGF-23
0
10
20
30
40
50Re
lative
seru
m F
GF-2
3 lev
els
Stage 2 Stage 3 Stage 4
(f)
Figure 6: Fold change in serum IL-6 (a), TNFα (b), OPG (c), OC (d), OPN (e), and FGF-23 (f) expressions in CKD stages 4, 3, and 2 versusthe control, assessed by xMAP array.
7Disease Markers

production of proinflammatory cytokines IL-4 and IL-10 wasnotably reduced by Dkk-1 inhibitor treatment, suggestingthat Dkk-1 utilises the MAPK and mTOR signalling pathwaycomponents to induce type 2 cell-mediated immuneresponses or inflammation [43]. In a study conducted byMalysheva et al., it was shown that proinflammatory cytokineIL-6 repressed the activation of the Wnt signalling pathwayin human synoviocyte cells, and together with TNFα andDkk-1, it inhibited the activation of the Wnt response [44].
It was also found that calcitriol distinctly regulated twogenes encoding the extracellular Wnt inhibitors Dkk-1 andDkk-4 via an indirect transcriptional mechanism. Thus, cal-citriol increases the expression of Dkk-1 RNA and protein,acting as a tumour suppressor in human colon cancer cellsharbouring endogenous mutations in the Wnt–β-cateninpathway [45].
Moreover, in CKD stage 4, the serum calcitriol concen-trations were significantly correlated with proinflammatorycytokine TNFα (p < 0:01, Chi-square test) and the MBDmarkers OC, OPN, and FGF-23.
Our findings support the hypothesis that Dkk-1 could bea useful biomarker for CKD severity, together with calcitriol,both expressing the lowest levels in CKD stage 4.
According to recent studies, serum Dkk-1 levels werelower in CKD patients, displaying different kinetics depend-ing on the disease stage [31].
We also obtained significant correlations between Dkk-1and calcitriol in CKD stages 3 and 2 and with several proin-flammatory and MBD markers, as follows: Dkk-1 and OPG,OPN, and FGF-23 (p < 0:001, Chi-square test for trends) inCKD stages 3 and 2; calcitriol and TNFα (p < 0:01) in CKDstage 3; and Dkk-1 and OPG and FGF-23 (p < 0:001) inCKD stage 2.
According to our results, Dkk-1, calcitriol, mediators ofinflammation, and MBD markers showed significantinteractions, also being correlated with the severity ofCKD. How the relative balance between Dkk-1 and othercytokines determines Wnt signalling and the pattern ofinflammation in CKD’s different stages needs to be furtherinvestigated.
3.5.2. Strong Correlations between Dkk-1 and Calcitriol,Inflammatory Cytokines, and Renal Function in the CKDPatient Groups. The investigation of correlations in theCKD patient groups was examined by applying the χ2 test(χ2, p) for serum levels of all the above-mentioned markers,and strong correlations were found between Dkk-1 and calci-triol (χ2 = 21:4, p < 0:001). Furthermore, Dkk-1 was alsostrongly correlated with the mediators of inflammation IL-6(χ2 = 13:7, p < 0:001) and TNFα (χ2 = 10:4, p = 0:001) andwith the MBD biomarker FGF-23 (χ2 = 10, p = 0:001).
Calcitriol expression in the CKD patient groups was cor-related with IL-6 (χ2 = 4:4, p < 0:05) and FGF-23 (χ2 = 5:5,p = 0:01). Regarding renal function, we found a strong corre-lation between eGFR and Dkk-1 (χ2 = 8:48, p < 0:01) and cal-citriol (χ2 = 8:36, p < 0:01), indicating the increased potentialfor these two molecules in terms of assessing the severity ofthe disease.
In order to reveal the significant biomarker correlationsbetween the CKD stages, we performed Spearman correla-tion tests (r, p value). In advanced CKD stage 4, we obtainedsignificant correlations, as follows: TNFα and Dkk-1(r = 0:50, p < 0:05), OPG (r = 0:58, p < 0:05), and OPN(r = 0:66, p = 0:001). The MBD biomarkers OPG and OPNwere also correlated (r = 0:51, p < 0:05).
Other studies also supported the interactions betweenthe key players of bone metabolism, Dkk-1 and OPG, inmodulating the Wnt signalling pathway by balancing outbone absorption and reconstruction. TNF-α, a key inducerof Dkk-1, alongside OPG emerged as independent predic-tors of osteoarthritis severity. TNF-α, Dkk-1, and OPGwere considered as valuable biomarkers in predicting theseverity of the disease. The study also supportedinflammation-induced Dkk-1 and OPG in osteoarthritispathogenesis [46].
In CKD stage 3, correlations between the proinflamma-tory biomarkers TNFα and OPG (r = 0:6, p = 0:001) andFGF-23 (r = 0:57, p < 0:01) are highlighted. In CKD earlystage 2, we found a strong negative correlation betweenDkk-1 and FGF-23 (r = −0:84, p < 0:001); moderate correla-tions were also observed between calcitriol and IL-6(r = 0:53, p < 0:05), TNFα (r = 0:58, p < 0:05), OPG(r = 0:71, p < 0:05), and FGF-23 (r = 0:52, p < 0:05). Themediators of inflammation, IL-6 and TNFα, were also mod-erately correlated (r = 0:58, p < 0:05), and a moderate corre-lation was found between IL-6 and OPG (r = 0:61, p = 0:01).
In CKD, a complex network between Dkk-1, calcitriol,mediators of inflammation, and MBD markers exists, butthe level at which it can affect the course of the diseaseremains in question.
3.5.3. Significant Differences between Dkk-1, Calcitriol,Mineral Disorders, Inflammatory Markers, and RenalFunction, Depending on CKD Stages. By applying theKruskal-Wallis one-way analysis of variance, we obtainedsignificant differences in the circulating expression of Dkk-1, calcitriol, and eGFR in CKD patients (p < 0:0001). The posthoc analysis showed that levels of Dkk-1, calcitriol, and eGFRwere significantly different between CKD stage 4 and stage 3,CKD stages 4 and 2, and CKD stages 3 and 2, respectively(p < 0:0001), highlighting the potential of these two markersin evaluating the severity of the disease.
Significant differences in IL-6 were observed in CKDpatients (p < 0:0001). Bonferroni’s multiple comparison testshowed that IL-6 was significantly different between CKDstage 4 and stage 3, CKD stages 4 and 2 (p < 0:0001), andCKD stages 3 and 2 (p < 0:05). TNFα showed a significantvariance in CKD patients (p < 0:01), and the differencesbetween the stages were as follows: CKD stage 4 and stage 3and CKD stages 4 and 2 (p < 0:05), according to our posthoc analysis.
FGF-23 and OC presented with significant differences inthe CKD group (p < 0:0001), and the comparisons betweenstages were only significant between CKD stage 4 and stage3 and CKD stages 4 and 2 (p < 0:0001).
According to our results, we can conclude that a crosstalkbetween Dkk-1, calcitriol, mineral disorders, inflammation,
8 Disease Markers

and renal function is present in CKD, thus influencing CKDpathophysiology. Inflammation, the hallmark feature ofchronic diseases, seems to be a common mediator for bothkidney function and subsidiary MBDs. Because of its insidi-ous nature, CKD silently evolves alongside other chronicconditions, exhibiting different biomarker patterns depend-ing on disease severity.
3.6. Functional Interplay between Markers of Inflammationand Mineral Bone Disorders in CKD. Considering the rel-
evant proteins revealed by dot-blot immunodetectionscreening, the functional interactions between the mole-cules involved in shaping the different patterns of CKDhave been put together by employing the STRING data-bases. The interactions include functional associationsbetween multiple molecules stemming from computationalprediction, knowledge transfer between organisms, andinteractions derived from other databases. Stronger evidencefor an association is represented by a thicker network edge, asdepicted in Figure 7.
PLAT
GDF15
PDGFA IL19 IL12B
IL6R
TIMP3
TIMP2
MMP2PDGFRA
IL18
LCN2 IFNG
PLAUR SERPINE1MMP9
IL6
CRP
STAT3
IL10CCL5
JAK2
TNFRSF8
CYP24A1
AHSG
FGF23
ICAM1
CXCL8
CCR5
CXCR2
CXCL10 CXCR1
TFF3
CXCL12
TNFRSF11B
LEP
DKK1
SPP1
VDR
BGLAP
DKKL1
MOKT21
KREMEN2
KREMEN1MSX2
GC
Figure 7: Functional interaction between different molecules involved in inflammation and MBDs in CKD. The coloured nodes arerepresented by query proteins and the first shell of interactors. Edges represent protein-protein functional associations, assigned withdifferent colour codes, as follows: a blue edge indicates known interactions from curated databases, a pink edge indicates knowninteractions that have been experimentally determined, a green edge indicates predicted interactions in the gene neighbourhood, a rededge indicates predicted interactions for gene fusions, a blue-ink edge indicates predicted interactions for gene cooccurrences, a light-green edge indicates other interactions derived from text mining, and a black edge indicates gene coexpression derived from otherdatabases. Abbreviations: CYP24A1: calcitriol, 1,25-dihydroxyvitamin D3, and 1,25OH2D3; SPP1: osteopontin, OPN; TNFRSF11B:osteoprotegerin, OPG; BGLAP: osteocalcin, OC; CXCL8: IL-8, interleukin-8; GC: vitamin D binding protein, DBP; VDR: vitamin D receptor.
9Disease Markers
Since CKD commonly arises alongside other comorbidi-ties (such as hypertension, diabetes, and CVD) and the diag-nosis of isolated CKD represents the exception rather thanthe rule, an integrative patient assessment is the best clinicalapproach [47]. Detailed characterisation of kidney disease isneeded to better understand the molecular relationshipsunderlying the pathophysiology of disease and to designCKD biomarker patterns characteristic of the various CKDstages, thus moving towards personalised care for each indi-vidual patient.
A potential limitation of our study is its cross-sectionaldesign, given the relatively small number of patients includedin our study. Therefore, further intense research is necessaryto completely decipher the underlying mechanisms behindthe connections between the analysed molecules in order tobetter characterise the cytokine patterns in CKD.
4. Conclusions
As highlighted in our study, a functional interplay occursbetween markers of inflammation and MBDs in CKDdepending on disease severity. In spite of the advances inCKD pathophysiology, there is an emerging need for novelbiomarkers to better characterise the different patterns ofnephropathy at each CKD stage. Out of all the analysed mol-ecules, Dkk-1 and calcitriol were found to significantly corre-late with CKD clinical staging, exhibiting the lowest levels inCKD stage 4. Since inflammation has emerged at the core ofthe pathophysiology of CKD, our results revealed significantcorrelations between Dkk-1 and calcitriol and proinflamma-tory cytokines, starting with the early CKD stages. The MBDbiomarkers OPG, OPN, OC, and FGF-23 were significantlycorrelated with Dkk-1 and calcitriol, as well as with the medi-ators of inflammation IL-6 and TNFα. In view of these find-ings, Dkk-1 and calcitriol could be considered as potentialuseful biomarkers for CKD severity. Nevertheless, furtherstudies are needed to clearly unravel the complex networkingbetween Dkk-1, calcitriol, the mediators of inflammation,and MBD markers to design promising biomarker patternsfor CKD, starting with its early stages.
Data Availability
The data used to support the findings of this study are avail-able from the corresponding author upon request.
Conflicts of Interest
The authors declare that they have no competing interests.
Authors’ Contributions
All authors contributed equally to this work.
Acknowledgments
The study was supported by the Ministry of Research andInnovation in Romania, under Program 1: The Improvementof the National System of Research and Development, Sub-program 1.2: Institutional Excellence-Projects of Excellence
Funding in RDI, Contract No. 440 7PFE/16.10.2018, grantCOP A 1.2.3, ID: P_40_197/2016, and PN 19.29.01.04.
References
[1] T. Isakova, T. L. Nickolas, M. Denburg et al., “KDOQI UScommentary on the 2017 KDIGO clinical practice guidelineupdate for the diagnosis, evaluation, prevention, and treatmentof chronic kidney disease–mineral and bone disorder (CKD-MBD),” American Journal of Kidney Diseases, vol. 70, no. 6,pp. 737–751, 2017.
[2] B. L. Neuen, S. J. Chadban, A. R. Demaio, D. W. Johnson, andV. Perkovic, “Chronic kidney disease and the global NCDsagenda,” BMJ Global Health, vol. 2, no. 2, article e000380,2017.
[3] H. Wang, M. Naghavi, C. Allen et al., “Global, regional,and national life expectancy, all-cause mortality, andcause-specific mortality for 249 causes of death, 1980-2015: a systematic analysis for the Global Burden of Dis-ease Study 2015,” The Lancet, vol. 388, no. 10053,pp. 1459–1544, 2016.
[4] N. R. Hill, S. T. Fatoba, J. L. Oke et al., “Global prevalence ofchronic kidney disease – a systematic review and meta-analy-sis,” PLoS One, vol. 11, no. 7, article e0158765, 2016.
[5] J. Voelkl, F. Lang, K. U. Eckardt et al., “Signaling pathwaysinvolved in vascular smooth muscle cell calcification duringhyperphosphatemia,” Cellular and Molecular Life Sciences,vol. 76, no. 11, pp. 2077–2091, 2019.
[6] K. A. Hruska, T. Sugatani, O. Agapova, and Y. Fang, “Thechronic kidney disease - mineral bone disorder (CKD-MBD): advances in pathophysiology,” Bone, vol. 100,pp. 80–86, 2017.
[7] C. Mambet, L. Necula, S. Mihai et al., “Increased Dkk-1 plasmalevels may discriminate disease subtypes in myeloproliferativeneoplasms,” Journal of Cellular and Molecular Medicine,vol. 22, no. 8, pp. 4005–4011, 2018.
[8] K. C. Lu, C. C. Wu, J. F. Yen, and W. C. Liu, “Vascular calcifi-cation and renal bone disorders,” The Scientific World Journal,vol. 2014, Article ID 637065, 20 pages, 2014.
[9] G. Jean, J. Souberbielle, and C. Chazot, “Vitamin D in chronickidney disease and dialysis patients,” Nutrients, vol. 9, no. 4,p. 328, 2017.
[10] Y. Nishikawa, R. Nakayama, S. Obika, E. Ohsaki, K. Ueda, andT. Honda, “Inhibition of LINE-1 retrotransposition by capsai-cin,” International Journal of Molecular Sciences, vol. 19,no. 10, p. 3243, 2018.
[11] R. L. Amdur, H. I. Feldman, J. Gupta et al., “Inflammation andprogression of CKD: the CRIC Study,” Clinical Journal of theAmerican Society of Nephrology, vol. 11, no. 9, pp. 1546–1556, 2016.
[12] S. Salimi, M. D. Shardell, S. L. Seliger, S. Bandinelli, J. M.Guralnik, and L. Ferrucci, “Inflammation and trajectory ofrenal function in community-dwelling older adults,” Journalof the American Geriatrics Society, vol. 66, no. 4, pp. 804–811, 2018.
[13] S. Mihai, E. Codrici, I. D. Popescu et al., “Proteomicbiomarkers panel: new insights in chronic kidney disease,”Disease Markers, vol. 2016, Article ID 3185232, 11 pages,2016.
[14] W. Chen and D. A. Bushinsky, “Chronic kidney disease:KDIGO CKD-MBD guideline update: evolution in the face of
10 Disease Markers
uncertainty,” Nature Reviews Nephrology, vol. 13, no. 10,pp. 600–602, 2017.
[15] C. Tanase, R. Albulescu, E. Codrici et al., “Decreased expres-sion of APAF-1 and increased expression of cathepsin B ininvasive pituitary adenoma,” OncoTargets and Therapy,vol. 8, pp. 81–90, 2015.
[16] M. H. Hanna, A. Dalla Gassa, G. Mayer et al., “The nephrolo-gist of tomorrow: towards a kidney-omic future,” PediatricNephrology, vol. 32, no. 3, pp. 393–404, 2017.
[17] S. Mihai, E. Codrici, I. D. Popescu et al., “Inflammation-relatedmechanisms in chronic kidney disease prediction, progression,and outcome,” Journal of Immunology Research, vol. 2018,Article ID 2180373, 16 pages, 2018.
[18] L. Dai, E. Golembiewska, B. Lindholm, and P. Stenvinkel,“End-stage renal disease, inflammation and cardiovascularoutcomes,” Contributions to Nephrology, vol. 191, pp. 32–43,2017.
[19] H. Su, C. T. Lei, and C. Zhang, “Interleukin-6 signaling path-way and its role in kidney disease: an update,” Frontiers inImmunology, vol. 8, p. 405, 2017.
[20] K. Yong, E. M. Ooi, G. Dogra et al., “Elevated interleukin-12and interleukin-18 in chronic kidney disease are not associ-ated with arterial stiffness,” Cytokine, vol. 64, no. 1, pp. 39–42, 2013.
[21] M. Del Rosso, F. Margheri, S. Serrati, A. Chilla, A. Laurenzana,and G. Fibbi, “The urokinase receptor system, a key regulatorat the intersection between inflammation, immunity, andcoagulation,” Current Pharmaceutical Design, vol. 17, no. 19,pp. 1924–1943, 2011.
[22] T. Liu, L. Zhang, D. Joo, and S. C. Sun, “NF-κB signaling ininflammation,” Signal Transduction and Targeted Therapy,vol. 2, no. 1, 2017.
[23] H. Zhang and S. C. Sun, “NF-κB in inflammation and renaldiseases,” Cell & Bioscience, vol. 5, no. 1, 2015.
[24] G. Lui, C. K. Wong, M. Ip et al., “HMGB1/RAGE signaling andpro-inflammatory cytokine responses in non-HIV adults withactive pulmonary tuberculosis,” PLoS One, vol. 11, no. 7, articlee0159132, 2016.
[25] D. V. Barreto, A. Lenglet, S. Liabeuf et al., “Prognostic implica-tion of plasma osteopontin levels in patients with chronic kid-ney disease,” Nephron Clinical Practice, vol. 117, no. 4,pp. c363–c372, 2011.
[26] P. Evenepoel, P. D'Haese, and V. Brandenburg, “Sclerostinand DKK1: new players in renal bone and vascular dis-ease,” Kidney International, vol. 88, no. 2, pp. 235–240,2015.
[27] B. Thompson and D. A. Towler, “Arterial calcification andbone physiology: role of the bone-vascular axis,” NatureReviews Endocrinology, vol. 8, no. 9, pp. 529–543, 2012.
[28] A. Gay and D. A. Towler, “Wnt signaling in cardiovasculardisease: opportunities and challenges,” Current Opinion inLipidology, vol. 28, no. 5, pp. 387–396, 2017.
[29] D. Wo, J. Peng, D. N. Ren et al., “Opposing roles of Wnt inhib-itors IGFBP-4 and Dkk1 in cardiac ischemia by differential tar-geting of LRP5/6 and β-catenin,” Circulation, vol. 134, no. 24,pp. 1991–2007, 2016.
[30] K. Hamada-Ode, Y. Taniguchi, Y. Shimamura, S. Fujimoto,and Y. Terada, “Serum dickkopf-related protein 1 and scleros-tin may predict the progression of chronic kidney disease inJapanese patients,” Nephrology, Dialysis, Transplantation,vol. 34, no. 8, pp. 1426-1427, 2019.
[31] G. J. Behets, L. Viaene, B. Meijers et al., “Circulating levels ofsclerostin but not DKK1 associate with laboratory parametersof CKD-MBD,” PLoS One, vol. 12, no. 5, article e0176411,2017.
[32] The PLOS ONE Staff, “Correction: relationship of Dickkopf1(DKK1) with cardiovascular disease and bone metabolism inCaucasian type 2 diabetes mellitus,” PLoS One, vol. 10, no. 1,article e0117687, 2015.
[33] S. U. Kim, J. H. Park, H. S. Kim et al., “Serum Dickkopf-1 as abiomarker for the diagnosis of hepatocellular carcinoma,”Yonsei Medical Journal, vol. 56, no. 5, pp. 1296–1306, 2015,Epub 2015/08/11.
[34] M. Rogers, C. Goettsch, and E. Aikawa, “Medial and intimalcalcification in chronic kidney disease: stressing the contribu-tions,” Journal of the American Heart Association, vol. 2,no. 5, article e000481, 2013.
[35] J. Jang, Y. Jung, Y. Kim, E. H. Jho, and Y. Yoon, “LPS-inducedinflammatory response is suppressed by Wnt inhibitors,Dickkopf-1 and LGK974,” Scientific Reports, vol. 7, no. 1,article 41612, 2017.
[36] C. Liu and H. Li, “Correlation of the severity of chronic kidneydisease with serum inflammation, osteoporosis and vitamin Ddeficiency,” Experimental and Therapeutic Medicine, vol. 17,no. 1, pp. 368–372, 2018.
[37] C. L. Lu, D. F. Yeih, Y. C. Hou et al., “The emerging role ofnutritional vitamin D in secondary hyperparathyroidism inCKD,” Nutrients, vol. 10, no. 12, p. 1890, 2018.
[38] A. Gil, J. Plaza-Diaz, and M. D. Mesa, “Vitamin D: classic andnovel actions,” Annals of Nutrition & Metabolism, vol. 72,no. 2, pp. 87–95, 2018.
[39] D. Mattinzoli, M. Ikehata, K. Tsugawa et al., “FGF23 andFetuin-A interaction and mesenchymal osteogenic transfor-mation,” International Journal of Molecular Sciences, vol. 20,no. 4, p. 915, 2019.
[40] H. Haddad Kashani, E. Seyed Hosseini, H. Nikzad et al.,“The effects of vitamin D supplementation on signalingpathway of inflammation and oxidative stress in diabetichemodialysis: a randomized, double-blind, placebo-con-trolled trial,” Frontiers in Pharmacology, vol. 9, p. 50,2018.
[41] N. Yeremenko, K. Zwerina, G. Rigter et al., “Brief Report:Tumor necrosis factor and interleukin-6 differentially regulateDkk-1 in the inflamed arthritic joint,” Arthritis & Rheumatol-ogy, vol. 67, no. 8, pp. 2071–2075, 2015.
[42] T. Fukuda, S. Kokabu, S. Ohte et al., “Canonical Wnts andBMPs cooperatively induce osteoblastic differentiationthrough a GSK3β-dependent and β-catenin-independentmechanism,” Differentiation, vol. 80, no. 1, pp. 46–52,2010.
[43] W. J. Chae, A. K. Ehrlich, P. Y. Chan et al., “The Wnt antago-nist Dickkopf-1 promotes pathological type 2 cell-mediatedinflammation,” Immunity, vol. 44, no. 2, pp. 246–258, 2016.
[44] K. Malysheva, K. de Rooij, C. W. G. M. Löwik et al., “Interleu-kin 6/Wnt interactions in rheumatoid arthritis: interleukin 6inhibits Wnt signaling in synovial fibroblasts and osteoblasts,”Croatian Medical Journal, vol. 57, no. 2, pp. 89–98, 2016.
[45] N. Pendas-Franco, O. Aguilera, F. Pereira, J. M. Gonzalez-Sancho, and A. Munoz, “Vitamin D and Wnt/beta-cateninpathway in colon cancer: role and regulation of DICKKOPFgenes,” Anticancer Research, vol. 28, no. 5A, pp. 2613–2623,2008.
11Disease Markers

[46] S. Min, C. Wang, W. Lu et al., “Serum levels of the bone turn-over markers dickkopf-1, osteoprotegerin, and TNF-α in kneeosteoarthritis patients,” Clinical Rheumatology, vol. 36, no. 10,pp. 2351–2358, 2017.
[47] S. D. Fraser and T. Blakeman, “Chronic kidney disease: identi-fication and management in primary care,” Pragmatic andObservational Research, vol. 7, pp. 21–32, 2016.
12 Disease Markers

Stem Cells International
Hindawiwww.hindawi.com Volume 2018
Hindawiwww.hindawi.com Volume 2018
MEDIATORSINFLAMMATION
of
EndocrinologyInternational Journal of
Hindawiwww.hindawi.com Volume 2018
Hindawiwww.hindawi.com Volume 2018
Disease Markers
Hindawiwww.hindawi.com Volume 2018
BioMed Research International
OncologyJournal of
Hindawiwww.hindawi.com Volume 2013
Hindawiwww.hindawi.com Volume 2018
Oxidative Medicine and Cellular Longevity
Hindawiwww.hindawi.com Volume 2018
PPAR Research
Hindawi Publishing Corporation http://www.hindawi.com Volume 2013Hindawiwww.hindawi.com
The Scientific World Journal
Volume 2018
Immunology ResearchHindawiwww.hindawi.com Volume 2018
Journal of
ObesityJournal of
Hindawiwww.hindawi.com Volume 2018
Hindawiwww.hindawi.com Volume 2018
Computational and Mathematical Methods in Medicine
Hindawiwww.hindawi.com Volume 2018
Behavioural Neurology
OphthalmologyJournal of
Hindawiwww.hindawi.com Volume 2018
Diabetes ResearchJournal of
Hindawiwww.hindawi.com Volume 2018
Hindawiwww.hindawi.com Volume 2018
Research and TreatmentAIDS
Hindawiwww.hindawi.com Volume 2018
Gastroenterology Research and Practice
Hindawiwww.hindawi.com Volume 2018
Parkinson’s Disease
Evidence-Based Complementary andAlternative Medicine
Volume 2018Hindawiwww.hindawi.com
Submit your manuscripts atwww.hindawi.com