Embed Size (px)
Citation preview
Influence of Building Shape Coefficient on Energy Consumption of
Office Buildings in Hot-Summer-and-Cold-Winter Area of China
Meishun Lin1,*, Yiqun Pan1, Weiding Long1, Weizhen Chen2
1 School of Mechanical Engineering, Tongji University, Shanghai 201804, China 2 College of Architecture and Urban Planning, Tongji University, Shanghai 201804,
China
ABSTRACT
Building shape coefficient is an important index in building energy efficiency design,
it is considered that the smaller the indicator, the less heat loss via the building
envelope and the less energy consumption. However, building energy consumption
consists not only air-conditioning consumption, but also lighting consumption. This
study is based on the concept of passive volume and assumed to fully use of passive
energy, natural ventilation and daylighting, in the passive area of a building. Taking a
group of office buildings in Shanghai as an example, with the help of the dynamic
simulation software DeST-c, the relationship between the building shape coefficient
and building energy consumption is studied.
KEYWORDS
Building shape coefficient, Passive volume, Energy consumption, Office building
INTRODUCTION
Buildings represent a large proportion of global energy demand. Approximately 40
percent of energy end-use in the developed world takes place in buildings, compared
to a figure of 20 percent in the developing world – the latter still an increasingly
significant amount (Pérez-Lombard et al 2008). Accordingly, the building sector is a
main contributor to carbon emissions. In 2004, this resulted in global emissions of 8.6
GtCO2e (Levine et al. 2007) or approximately 33 percent of all energy-related
greenhouse gas emissions and 17.6 percent of all anthropogenic greenhouse gas
emissions (Rogner et al. 2007). To realize energy conservation and emissions
reduction, reducing building energy demand and improving energy efficiency are the
key points.
Architecture design considerations at conceptual design stage have essential impact
on building energy demand and consumption. In principle, three factors could play
equally important roles in reducing energy demand: behavioural adjustments,
technological advancement and design considerations. For the overall energy
consumption in non-domestic buildings, Baker and Steemers (2000) suggest that these
* Corresponding author email: [email protected]
728
three factors together could account for variations in energy demand by a factor of 10
(2, 2, and 2.5, respectively). Recent years, to reduce building energy demand, passive
building design has received attention again. Generally,passive building design
makes use of nature energy, such as sunlight, wind, rather than conventional energy
resources. Passive building design methods mainly include the following aspects: 1.
Orientation; 2. Building shape; 3. Building insulation; 4. Ratio of window-to-wall; 5.
Building shade; 6. Natural ventilation.
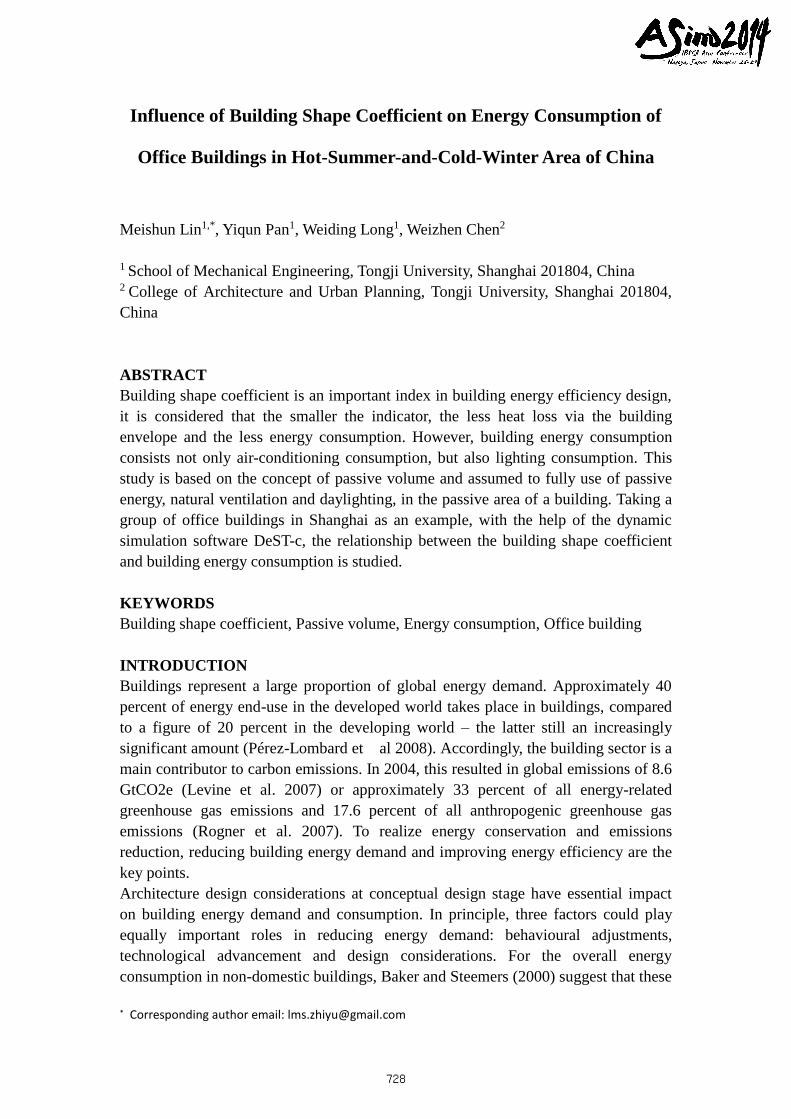
At conceptual design stage, building shape coefficient is an important consideration in
energy saving. Moreover, according to Ratti et al.(2005), an important indicator, the
ratio of passive-to-non-passive (passive volume ratio), also should be taken into
account. This concept is made explicit with the definition of passive and non-passive
zones/volume, which quantifies the potential of each part of a building to use daylight,
sunlight and natural ventilation. By a simple rule of thumb, based on empirical
observations, all perimeter parts of buildings lying within 6 m of the facade, or twice
the ceiling height, are classified passive, while all the other zones are considered
non-passive (Fig 1).
Fig 1. Parts of a building that can be naturally lit and ventilated are called ‘passive
zones’. Source: Ratti et al,(2005)
In addition, of all energy used in buildings, energy for space heating/cooling and
lighting represents the greatest demand. However, most studies about building shape
focus on the energy demand of space heating/cooling, and overlook the energy
end-use of lighting (Salat S. et al. 2009).
This paper is based on the concept of passive volume ratio and assumed to fully use of
passive energy, natural ventilation and daylighting, in the passive zone of a building.
Taking a group of office buildings in Shanghai as an example, with the help of the
dynamic simulation software DeST-c, the relationship between the building shape
coefficient and building energy consumption is studied.
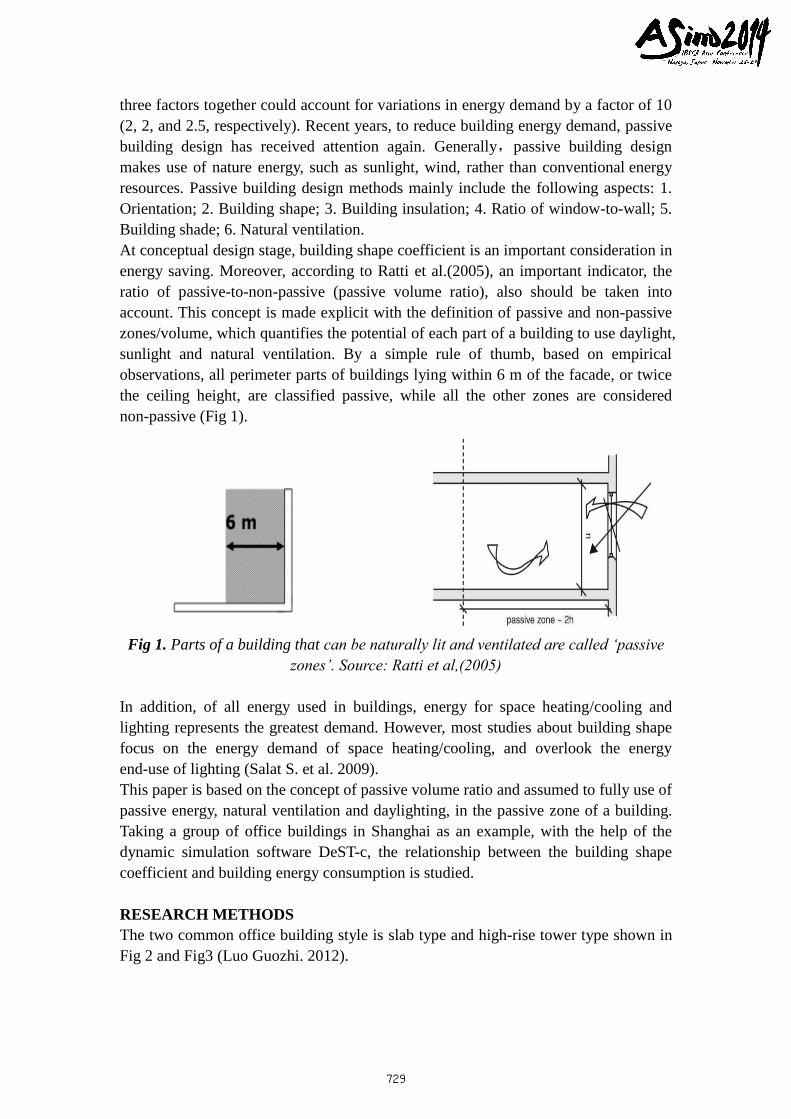
RESEARCH METHODS
The two common office building style is slab type and high-rise tower type shown in
Fig 2 and Fig3 (Luo Guozhi. 2012).
729
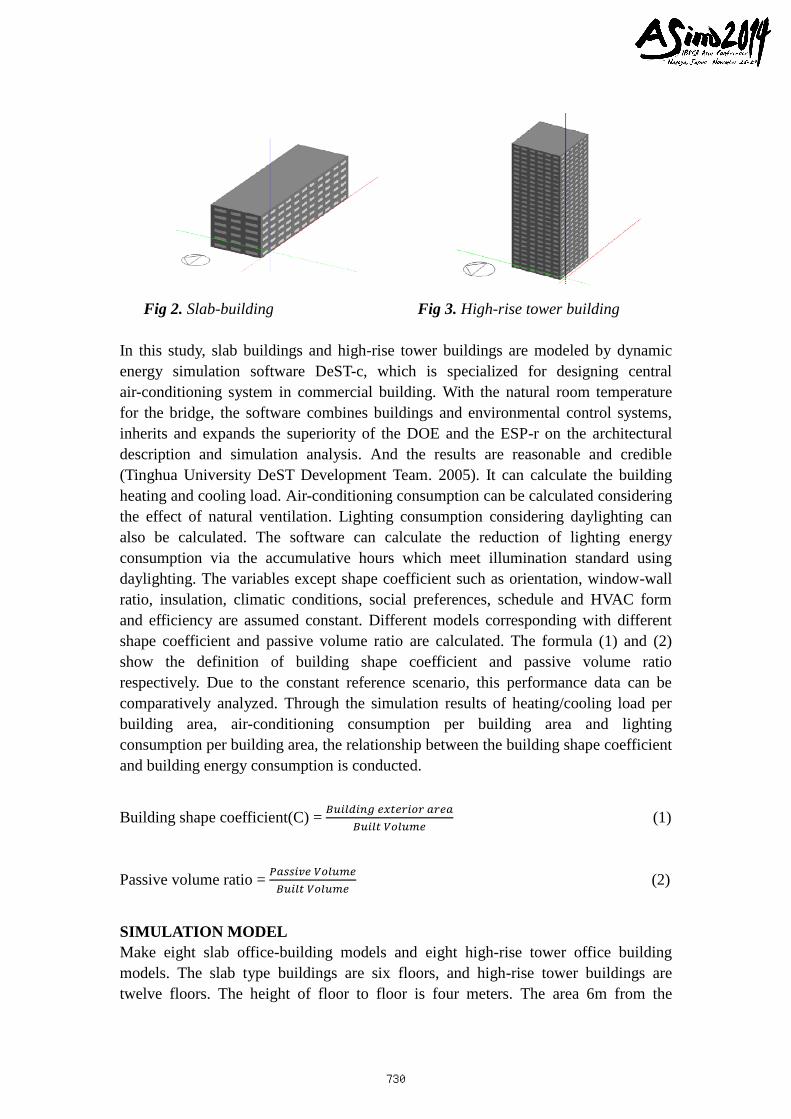
Fig 2. Slab-building Fig 3. High-rise tower building
In this study, slab buildings and high-rise tower buildings are modeled by dynamic
energy simulation software DeST-c, which is specialized for designing central
air-conditioning system in commercial building. With the natural room temperature
for the bridge, the software combines buildings and environmental control systems,
inherits and expands the superiority of the DOE and the ESP-r on the architectural
description and simulation analysis. And the results are reasonable and credible
(Tinghua University DeST Development Team. 2005). It can calculate the building
heating and cooling load. Air-conditioning consumption can be calculated considering
the effect of natural ventilation. Lighting consumption considering daylighting can
also be calculated. The software can calculate the reduction of lighting energy
consumption via the accumulative hours which meet illumination standard using
daylighting. The variables except shape coefficient such as orientation, window-wall
ratio, insulation, climatic conditions, social preferences, schedule and HVAC form
and efficiency are assumed constant. Different models corresponding with different
shape coefficient and passive volume ratio are calculated. The formula (1) and (2)
show the definition of building shape coefficient and passive volume ratio
respectively. Due to the constant reference scenario, this performance data can be
comparatively analyzed. Through the simulation results of heating/cooling load per
building area, air-conditioning consumption per building area and lighting
consumption per building area, the relationship between the building shape coefficient
and building energy consumption is conducted.
Building shape coefficient(C) = 𝐵𝑢𝑖𝑙𝑑𝑖𝑛𝑔 𝑒𝑥𝑡𝑒𝑟𝑖𝑜𝑟 𝑎𝑟𝑒𝑎
𝐵𝑢𝑖𝑙𝑡 𝑉𝑜𝑙𝑢𝑚𝑒 (1)
Passive volume ratio = 𝑃𝑎𝑠𝑠𝑖𝑣𝑒 𝑉𝑜𝑙𝑢𝑚𝑒
𝐵𝑢𝑖𝑙𝑡 𝑉𝑜𝑙𝑢𝑚𝑒 (2)
SIMULATION MODEL
Make eight slab office-building models and eight high-rise tower office building
models. The slab type buildings are six floors, and high-rise tower buildings are
twelve floors. The height of floor to floor is four meters. The area 6m from the
730
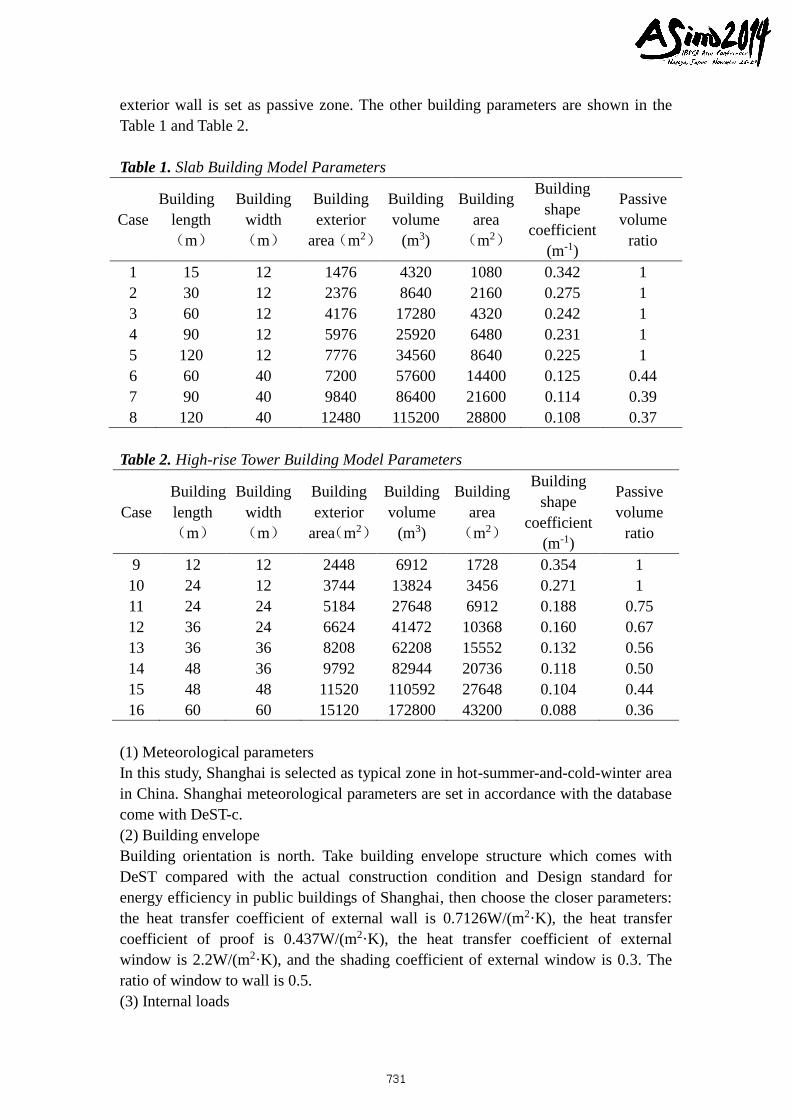
exterior wall is set as passive zone. The other building parameters are shown in the
Table 1 and Table 2.
Table 1. Slab Building Model Parameters
Case
Building
length
(m)
Building
width
(m)
Building
exterior
area(m2)
Building
volume
(m3)
Building
area
(m2)
Building
shape
coefficient
(m-1)
Passive
volume
ratio
1 15 12 1476 4320 1080 0.342 1
2 30 12 2376 8640 2160 0.275 1
3 60 12 4176 17280 4320 0.242 1
4 90 12 5976 25920 6480 0.231 1
5 120 12 7776 34560 8640 0.225 1
6 60 40 7200 57600 14400 0.125 0.44
7 90 40 9840 86400 21600 0.114 0.39
8 120 40 12480 115200 28800 0.108 0.37
Table 2. High-rise Tower Building Model Parameters
Case
Building
length
(m)
Building
width
(m)
Building
exterior
area(m2)
Building
volume
(m3)
Building
area
(m2)
Building
shape
coefficient
(m-1)
Passive
volume
ratio
9 12 12 2448 6912 1728 0.354 1
10 24 12 3744 13824 3456 0.271 1
11 24 24 5184 27648 6912 0.188 0.75
12 36 24 6624 41472 10368 0.160 0.67
13 36 36 8208 62208 15552 0.132 0.56
14 48 36 9792 82944 20736 0.118 0.50
15 48 48 11520 110592 27648 0.104 0.44
16 60 60 15120 172800 43200 0.088 0.36
(1) Meteorological parameters
In this study, Shanghai is selected as typical zone in hot-summer-and-cold-winter area
in China. Shanghai meteorological parameters are set in accordance with the database
come with DeST-c.
(2) Building envelope
Building orientation is north. Take building envelope structure which comes with
DeST compared with the actual construction condition and Design standard for
energy efficiency in public buildings of Shanghai, then choose the closer parameters:
the heat transfer coefficient of external wall is 0.7126W/(m2·K), the heat transfer
coefficient of proof is 0.437W/(m2·K), the heat transfer coefficient of external
window is 2.2W/(m2·K), and the shading coefficient of external window is 0.3. The
ratio of window to wall is 0.5.
(3) Internal loads
731
The thermal disturbance of people, lighting and equipment of office buildings are set
in accordance with Design standard for energy efficiency in public buildings of
Shanghai. The minimum illumination of room is set as 300Lx. Specific parameters are
shown in the Table 3:
Table 3. Thermal disturbance parameter of various functions rooms
Occupant density
(person/m2)
Per fresh air capacity
(m3/h)
Lighting load
(w/m2)
Equipment load
(w/m2)
0.2 30 11 20
(4)Air-conditioning system
The air condition temperature in summer is designed for 24~26℃, while in winter it
is designed for 20~22℃. The relative humidity is designed for 50%~60%. For natural
ventilation, the maximum temperature is 26℃,the minimum temperature is 18℃, and
the maximum relative humidity is 60%. All rooms are used fan-coil plus fresh air
system. Cold source is centrifugal chiller, and its COP is 5.0. Heat source is gas-fired
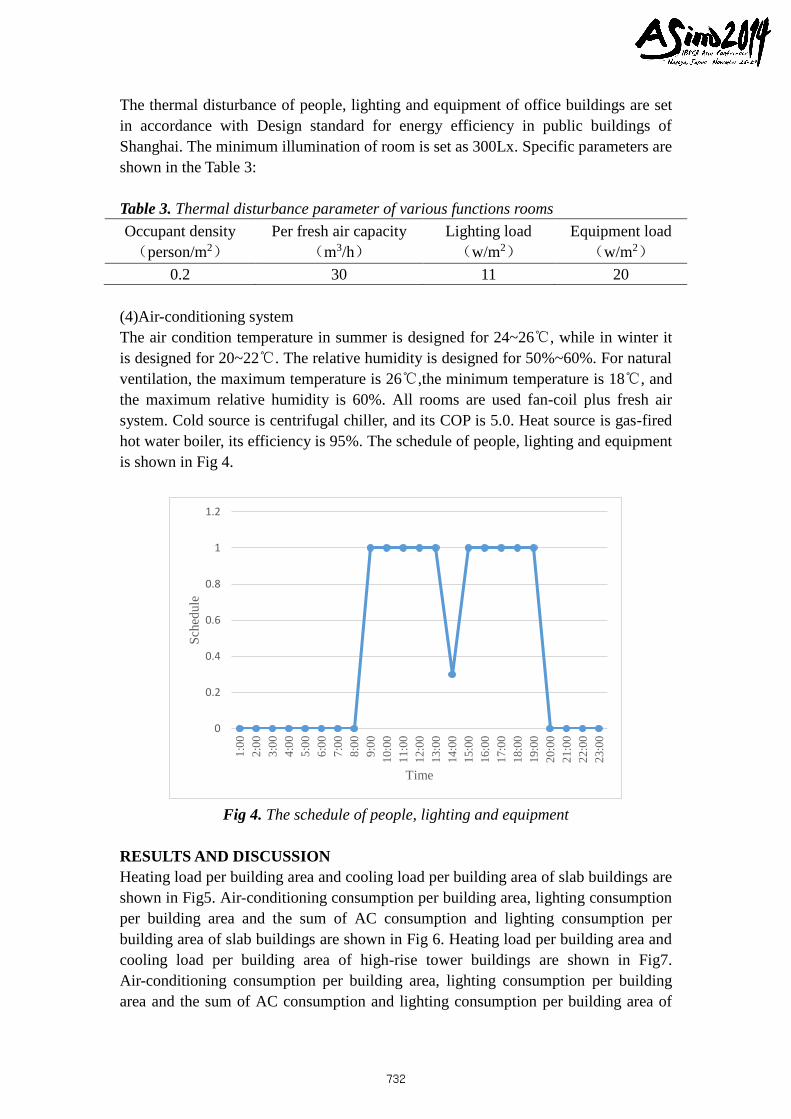
hot water boiler, its efficiency is 95%. The schedule of people, lighting and equipment
is shown in Fig 4.
Fig 4. The schedule of people, lighting and equipment
RESULTS AND DISCUSSION
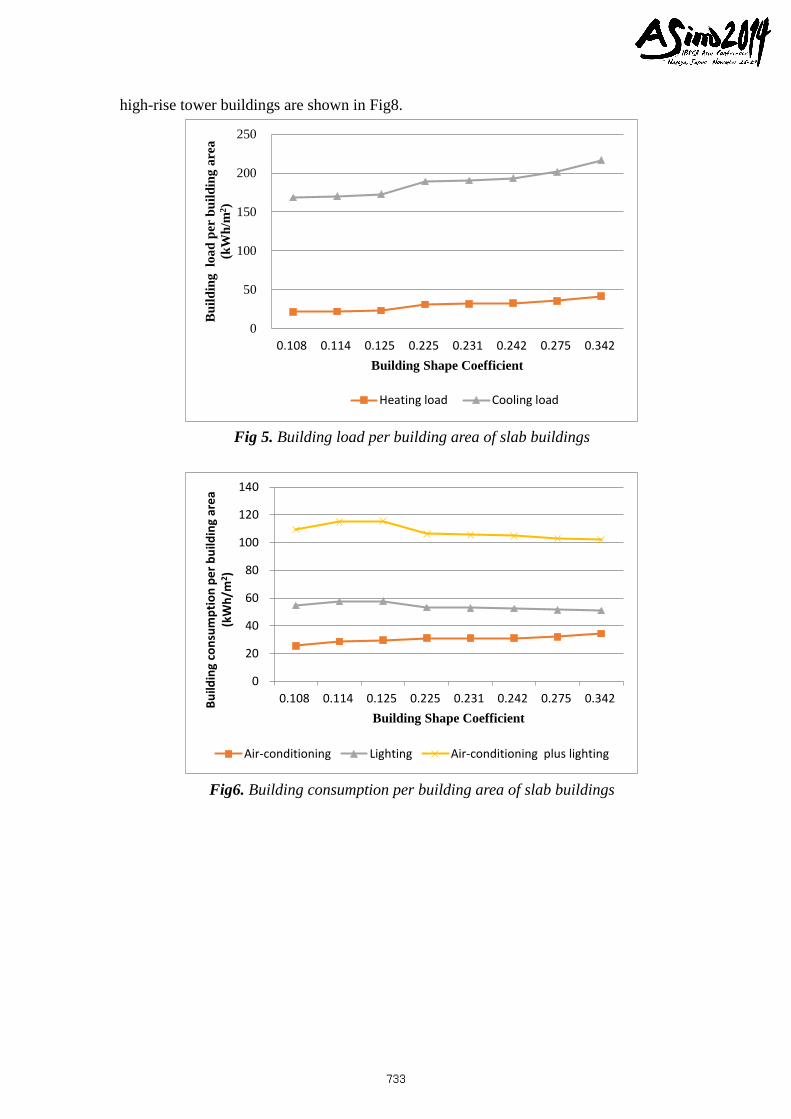
Heating load per building area and cooling load per building area of slab buildings are
shown in Fig5. Air-conditioning consumption per building area, lighting consumption
per building area and the sum of AC consumption and lighting consumption per
building area of slab buildings are shown in Fig 6. Heating load per building area and
cooling load per building area of high-rise tower buildings are shown in Fig7.
Air-conditioning consumption per building area, lighting consumption per building
area and the sum of AC consumption and lighting consumption per building area of
0
0.2
0.4
0.6
0.8
1
1.2
1:0
0
2:0
0
3:0
0
4:0
0
5:0
0
6:0
0
7:0
0
8:0
0
9:0
0
10:0
0
11:0
0
12:0
0
13:0
0
14:0
0
15:0
0
16:0
0
17:0
0
18:0
0
19:0
0
20:0
0
21:0
0
22:0
0
23:0
0
Sch
edule
Time
732
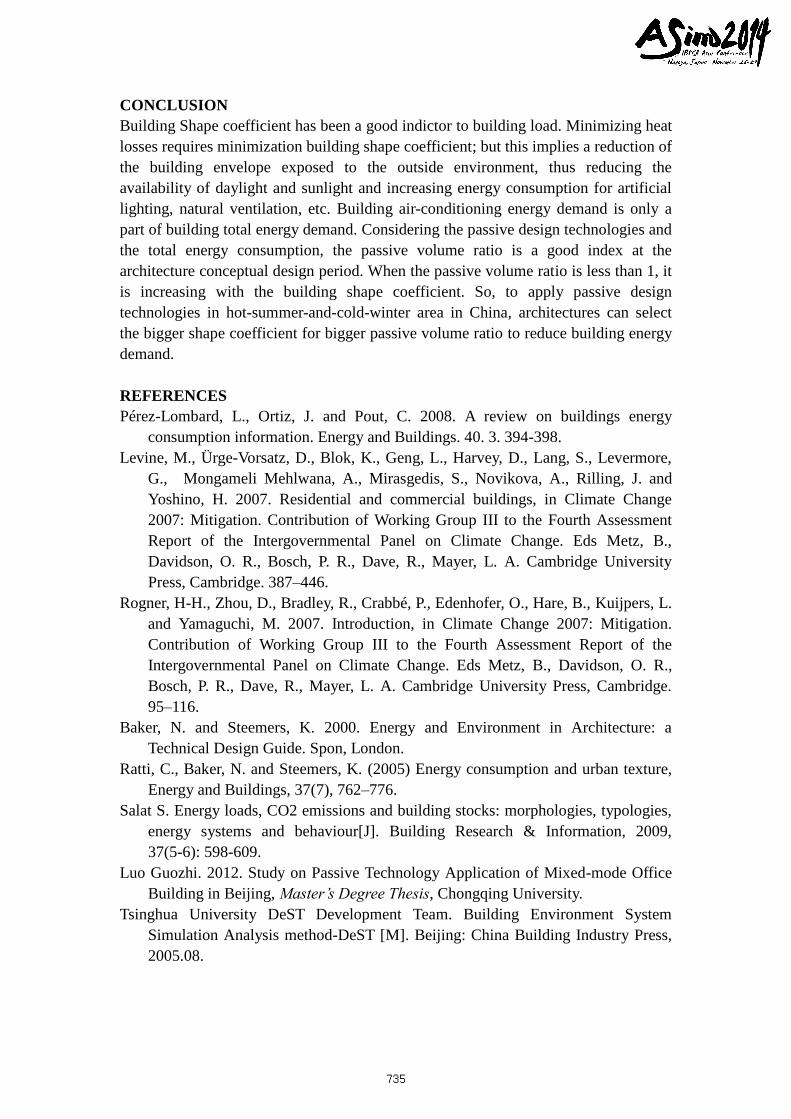
high-rise tower buildings are shown in Fig8.
Fig 5. Building load per building area of slab buildings
Fig6. Building consumption per building area of slab buildings
0
50
100
150
200
250
0.108 0.114 0.125 0.225 0.231 0.242 0.275 0.342
Bu
ild
ing
lo
ad
per
bu
ild
ing
are
a
(kW
h/m
2)
Building Shape Coefficient
Heating load Cooling load
0
20
40
60
80
100
120
140
0.108 0.114 0.125 0.225 0.231 0.242 0.275 0.342Bu
ildin
g co
nsu
mp
tio
n p
er
bu
ildin
g ar
ea
(kW
h/m
2)
Building Shape Coefficient
Air-conditioning Lighting Air-conditioning plus lighting
733
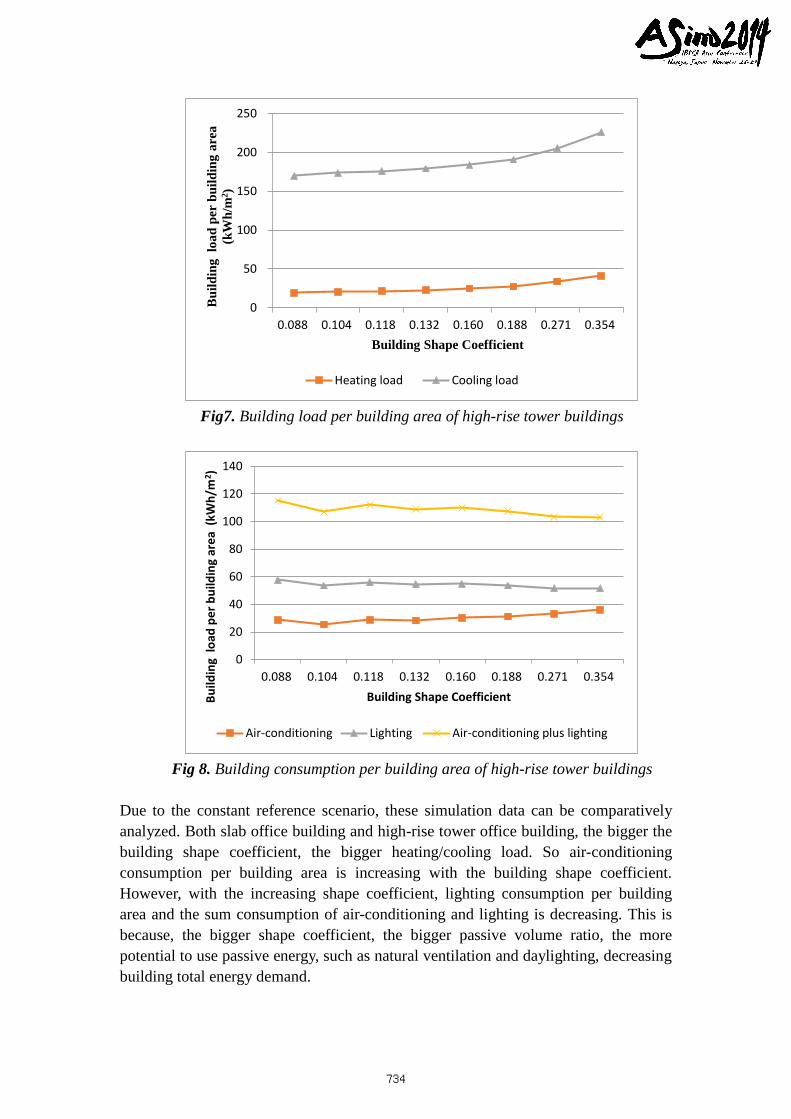
Fig7. Building load per building area of high-rise tower buildings
Fig 8. Building consumption per building area of high-rise tower buildings
Due to the constant reference scenario, these simulation data can be comparatively
analyzed. Both slab office building and high-rise tower office building, the bigger the
building shape coefficient, the bigger heating/cooling load. So air-conditioning
consumption per building area is increasing with the building shape coefficient.
However, with the increasing shape coefficient, lighting consumption per building
area and the sum consumption of air-conditioning and lighting is decreasing. This is
because, the bigger shape coefficient, the bigger passive volume ratio, the more
potential to use passive energy, such as natural ventilation and daylighting, decreasing
building total energy demand.
0
50
100
150
200
250
0.088 0.104 0.118 0.132 0.160 0.188 0.271 0.354
Bu
ild
ing
lo
ad
per
bu
ild
ing
are
a
(kW
h/m
2)
Building Shape Coefficient
Heating load Cooling load
0
20
40
60
80
100
120
140
0.088 0.104 0.118 0.132 0.160 0.188 0.271 0.354
Bu
ildin
g lo
ad p
er
bu
ildin
g ar
ea
(kW
h/m
2 )
Building Shape Coefficient
Air-conditioning Lighting Air-conditioning plus lighting
734
CONCLUSION
Building Shape coefficient has been a good indictor to building load. Minimizing heat
losses requires minimization building shape coefficient; but this implies a reduction of
the building envelope exposed to the outside environment, thus reducing the
availability of daylight and sunlight and increasing energy consumption for artificial
lighting, natural ventilation, etc. Building air-conditioning energy demand is only a
part of building total energy demand. Considering the passive design technologies and
the total energy consumption, the passive volume ratio is a good index at the
architecture conceptual design period. When the passive volume ratio is less than 1, it
is increasing with the building shape coefficient. So, to apply passive design
technologies in hot-summer-and-cold-winter area in China, architectures can select
the bigger shape coefficient for bigger passive volume ratio to reduce building energy
demand.
REFERENCES
Pérez-Lombard, L., Ortiz, J. and Pout, C. 2008. A review on buildings energy
consumption information. Energy and Buildings. 40. 3. 394-398.
Levine, M., Ürge-Vorsatz, D., Blok, K., Geng, L., Harvey, D., Lang, S., Levermore,
G., Mongameli Mehlwana, A., Mirasgedis, S., Novikova, A., Rilling, J. and
Yoshino, H. 2007. Residential and commercial buildings, in Climate Change
2007: Mitigation. Contribution of Working Group III to the Fourth Assessment
Report of the Intergovernmental Panel on Climate Change. Eds Metz, B.,
Davidson, O. R., Bosch, P. R., Dave, R., Mayer, L. A. Cambridge University
Press, Cambridge. 387–446.
Rogner, H-H., Zhou, D., Bradley, R., Crabbé, P., Edenhofer, O., Hare, B., Kuijpers, L.
and Yamaguchi, M. 2007. Introduction, in Climate Change 2007: Mitigation.
Contribution of Working Group III to the Fourth Assessment Report of the
Intergovernmental Panel on Climate Change. Eds Metz, B., Davidson, O. R.,
Bosch, P. R., Dave, R., Mayer, L. A. Cambridge University Press, Cambridge.
95–116.
Baker, N. and Steemers, K. 2000. Energy and Environment in Architecture: a
Technical Design Guide. Spon, London.
Ratti, C., Baker, N. and Steemers, K. (2005) Energy consumption and urban texture,
Energy and Buildings, 37(7), 762–776.
Salat S. Energy loads, CO2 emissions and building stocks: morphologies, typologies,
energy systems and behaviour[J]. Building Research & Information, 2009,
37(5-6): 598-609.
Luo Guozhi. 2012. Study on Passive Technology Application of Mixed-mode Office
Building in Beijing, Master’s Degree Thesis, Chongqing University.
Tsinghua University DeST Development Team. Building Environment System
Simulation Analysis method-DeST [M]. Beijing: China Building Industry Press,
2005.08.
735