Embed Size (px)
Citation preview
Influence of carrier transport on Raman amplification in silicon waveguides
Aashish Singh*
Department of Electrical & Computer Systems Engineering, Monash University, Clayton, VIC 3800, Australia
Abstract: This paper analyze for the first time the impact of the charge carrier transport on the continuously pumped stimulated Raman amplification in silicon waveguides. A novel analytical model is developed using which the coupled differential equations of the pump and the probe optical signals and those of carrier transport are solved concurrently. The simulation and analysis suggest that the neglect of the carrier transport phenomenon, reported in the previously published works, is approximately justified only if the effective carrier lifetime is comparable to the carrier transit time, otherwise it can result in substantial overestimation of the free carrier density at the optical mode center.
©2010 Optical Society of America
OCIS codes: (250.4480) Optical amplifiers; (250.5300) Photonic integrated circuits; (190.5650) Raman Effect; (230.7370) Waveguides; (230.4320) Nonlinear optical devices.
References and links
1. R. Claps, D. Dimitropoulos, and B. Jalali, “Stimulated Raman scattering in silicon waveguides,” Electron. Lett. 38(22), 1352–1354 (2002).
2. R. Claps, D. Dimitropoulos, V. Raghunathan, Y. Han, and B. Jalali, “Observation of stimulated Raman amplification in silicon waveguides,” Opt. Express 11(15), 1731–1739 (2003).
3. R. Espinola, J. Dadap, R. Osgood, Jr., S. McNab, and Y. Vlasov, “Raman amplification in ultrasmall silicon-on-insulator wire waveguides,” Opt. Express 12(16), 3713–3718 (2004).
4. A. Liu, H. Rong, M. Paniccia, O. Cohen, and D. Hak, “Net optical gain in a low loss silicon-on-insulator waveguide by stimulated Raman scattering,” Opt. Express 12(18), 4261–4268 (2004).
5. O. Boyraz, and B. Jalali, “Demonstration of a silicon Raman laser,” Opt. Express 12(21), 5269–5273 (2004). 6. Q. Xu, V. R. Almeida, and M. Lipson, “Demonstration of high Raman gain in a submicrometer-size silicon-on-
insulator waveguide,” Opt. Lett. 30(1), 35–37 (2005). 7. H. Rong, A. Liu, R. Jones, O. Cohen, D. Hak, R. Nicolaescu, A. Fang, and M. Paniccia, “An all-silicon Raman
laser,” Nature 433(7023), 292–294 (2005). 8. R. Jones, H. Rong, A. Liu, A. Fang, M. Paniccia, D. Hak, and O. Cohen, “Net continuous wave optical gain in a
low loss silicon-on-insulator waveguide by stimulated Raman scattering,” Opt. Express 13(2), 519–525 (2005). 9. H. Rong, R. Jones, A. Liu, O. Cohen, D. Hak, A. Fang, and M. Paniccia, “A continuous-wave Raman silicon
laser,” Nature 433(7027), 725–728 (2005). 10. R. Jones, A. Liu, H. Rong, M. Paniccia, O. Cohen, and D. Hak, “Lossless optical modulation in a silicon
waveguide using stimulated Raman scattering,” Opt. Express 13(5), 1716–1723 (2005). 11. V. Raghunathan, R. Claps, D. Dimitropoulos, and B. Jalali, “Parametric Raman wavelength conversion in scaled
silicon waveguides,” J. Lightwave Technol. 23(6), 2094–2102 (2005). 12. S. Fathpour, K. K. Tsia, and B. Jalali, “Energy harvesting in silicon Raman amplifiers,” Appl. Phys. Lett. 89(6),
061109 (2006). 13. V. Sih, S. Xu, Y. H. Kuo, H. Rong, M. Paniccia, O. Cohen, and O. Raday, “Raman amplification of 40 Gb/s data
in low-loss silicon waveguides,” Opt. Express 15(2), 357–362 (2007). 14. H. Rong, A. Liu, R. Nicolaescu, M. Paniccia, O. Cohen, and D. Hak, “Raman gain and nonlinear optical
absorption measurements in a low-loss silicon waveguide,” Appl. Phys. Lett. 85(12), 2196–2198 (2004). 15. H. Rong, S. Xu, Y. H. Kuo, V. Sih, O. Cohen, O. Raday, and M. Paniccia, “Low-threshold continuous-wave
Raman silicon laser,” Nat. Photonics 1(4), 232–237 (2007). 16. V. Raghunathan, D. Borlaug, R. R. Rice, and B. Jalali, “Demonstration of a Mid-infrared silicon Raman
amplifier,” Opt. Express 15(22), 14355–14362 (2007). 17. M. Dinu, F. Quochi, and H. Garcia, “Third-order nonlinearities in silicon at telecom wavelengths,” Appl. Phys.
Lett. 82(18), 2954–2956 (2003). 18. T. K. Liang, and H. K. Tsang, “Role of free carriers from two-photon absorption in Raman amplification in
silicon-on-insulator waveguides,” Appl. Phys. Lett. 84(15), 2745–2747 (2004).
#126931 - $15.00 USD Received 15 Apr 2010; revised 19 May 2010; accepted 20 May 2010; published 27 May 2010(C) 2010 OSA 7 June 2010 / Vol. 18, No. 12 / OPTICS EXPRESS 12569

19. R. Claps, V. Raghunathan, D. Dimitropoulos, and B. Jalali, “Influence of nonlinear absorption on Raman amplification in Silicon waveguides,” Opt. Express 12(12), 2774–2780 (2004).
20. D. Dimitropoulos, S. Fathpour, and B. Jalali, “Limitations of active carrier removal in silicon Raman amplifiers and lasers,” Appl. Phys. Lett. 87(26), 261108 (2005).
21. Y. Liu, and H. K. Tsang, “Nonlinear absorption and Raman gain in helium-ion-implanted silicon waveguides,” Opt. Lett. 31(11), 1714–1716 (2006).
22. N. M. Wright, D. J. Thomson, K. L. Litvinenko, W. R. Headley, A. J. Smith, A. P. Knights, J. H. B. Deane, F. Y. Gardes, G. Z. Mashanovich, R. Gwilliam, and G. T. Reed, “Free carrier lifetime modification for silicon waveguide based devices,” Opt. Express 16(24), 19779–19784 (2008).
23. O. Boyraz, and B. Jalali, “Demonstration of 11dB fiber-to-fiber gain in a silicon Raman amplifier,” IEICE Electron. Express 1(14), 429–434 (2004).
24. K. K. Tsia, S. Fathpour, and B. Jalali, “Energy harvesting in silicon wavelength converters,” Opt. Express 14(25), 12327–12333 (2006).
25. M. Krause, H. Renner, S. Fathpour, B. Jalali, and E. Brinkmeyer, “Gain enhancement in cladding-pumped silicon raman amplifiers,” IEEE J. Quantum Electron. 44(7), 692–704 (2008).
26. Y. Huang, P. Shum, and C. Lin, “Proposal for loss reduction and output enhancement of silicon Raman laser using bi-directional pumping scheme,” Opt. Commun. 283(7), 1389–1393 (2010).
27. I. D. Rukhlenko, C. Dissanayake, M. Premaratne, and G. P. Agrawal, “Maximization of net optical gain in silicon-waveguide Raman amplifiers,” Opt. Express 17(7), 5807–5814 (2009).
28. M. Krause, H. Renner, and E. Brinkmeyer, “Silicon Raman Amplifiers With Ring-Resonator-Enhanced Pump Power,” IEEE J. Sel. Top. Quantum Electron. 16(1), 216–225 (2010).
29. Q. Lin, O. J. Painter, and G. P. Agrawal, “Nonlinear optical phenomena in silicon waveguides: modeling and applications,” Opt. Express 15(25), 16604–16644 (2007).
30. D. Dimitropoulos, D. R. Solli, R. Claps, O. Boyraz, and B. Jalali, “Noise figure of silicon Raman amplifiers,” J. Lightwave Technol. 26(7), 847–852 (2008).
31. Y. Liu, and H. K. Tsang, “Time dependent density of free carriers generated by two photon absorption in silicon waveguides,” Appl. Phys. Lett. 90(21), 211105 (2007).
32. A. Singh, “Impact of optical pulse width on the frequency response of p-i-n photodiodes,” IEEE Photon. Technol. Lett. 22(8), 589–591 (2010).
33. S. M. Sze, and K. K. Ng, Physics of Semiconductor Devices, 3rd ed. (Wiley, New York, 2007). 34. D. M. Caughey, and R. E. Thomas, “Carrier mobilities in silicon empirically related to doping and field,” Proc.
IEEE 55(12), 2192–2193 (1967). 35. K. J. Williams, R. D. Esman, and M. Dagenais, “Effects of high space-charge fields on the response of
microwave photodetectors,” IEEE Photon. Technol. Lett. 6(5), 639–641 (1994). 36. D. Dimitropoulos, R. Jhaveri, R. Claps, J. C. S. Woo, and B. Jalali, “Lifetime of photogenerated carriers in
silicon-on-insulator rib waveguides,” Appl. Phys. Lett. 86(7), 071115 (2005).
1. Introduction
Silicon based active photonic devices particularly the ones based on stimulated Raman scattering (SRS) have shown remarkable progress in the last couple of years [1–13]. By far one of the most promising applications of SRS in silicon demonstrated in the recent times is the feasibility of a chip scale amplifier [2–4,6,8,14] and laser [5,7,9,15,16]. However, due to the presence of the nonlinear optical phenomenon of two photon absorption (TPA) [2,14,17–19], free carrier gets generated, which induce absorption [free carrier absorption (FCA)] loss and saturates the gain of silicon Raman amplifier [14,18–20] and output power in silicon Raman laser [5,7,9,15]. The key to enhance the performance of these devices is to reduce the FCA loss in some way or the other. Few of the techniques reported in the literature for this purpose are: ion implantation in the intrinsic region [21,22], use of pulsed pumping with the pulse repetition rate greater than the carrier lifetime [4,23], utilization of the TPA induced photoelectric effect to extract the free carriers [12,24], modifying the pumping scheme [25,26] or waveguide structure [27,28] and the most prominent being the use of a reverse bias P-i-N diode structure [6–9,12,24] to extract the free carriers out of the path of the propagating optical beam.
In the recent past, enormous effort had been invested to experimentally enhance the performance of silicon Raman amplifier [4,6,8,12,22,23] and silicon Raman laser [5,7,9,15,16] and in developing the device physics and modeling from the optical point of view [8,19,20,25–31]. However, virtually no attention had been paid on the charge carrier transport and its influence on the device performance. The neglect of the transport of the TPA generated free carriers may be valid for the case of pumping with short optical pulse of picosecond or even smaller pulse width [3,5–7,23,31]. However as described in this paper, in the continuous wave (CW) regime the neglect of the carrier transport can lead to substantial
#126931 - $15.00 USD Received 15 Apr 2010; revised 19 May 2010; accepted 20 May 2010; published 27 May 2010(C) 2010 OSA 7 June 2010 / Vol. 18, No. 12 / OPTICS EXPRESS 12570

overestimation of the carrier density at the optical mode center. This is particularly important for the CW Raman amplifiers and lasers where the modeled curve is fitted to the experimental data to estimate the effective carrier lifetime (ECL) [7–9,22].
In order to study the influence of the free carrier transport on the CW Raman amplification the modeling equations describing the distribution of the charge carriers should be solved concurrently with the propagation of optical pump and probe beams describing the CW Raman amplification. This amount to developing a coupled electro-optic model, which can enable simultaneous solution of a set of boundary value partial differential equations (PDE) (describing the TPA generated free carrier distribution) and a set of initial value PDE (describing the CW Raman amplification process).
To accomplish this, advantage has been taken of the structural similarity between the P-i-N diode silicon waveguide and a high speed P-i-N photodiode [32] and a simple modeling approach is developed in Section 2. The model is then used to analyze the impact of the inclusion/neglect of the carrier transport phenomenon on the estimation of the carrier density at the optical mode center in Section 3. In particular, two cases of carrier transport are considered namely the diffusion only transport (DOT) and the high reverse bias (HRB). The DOT case corresponds to the practical situation of carrier transport in the absence of P-i-N diode structure. The HRB case corresponds to the practical situation of high external biasing voltage such that the depletion region extends through out the intrinsic region. In Section 4 the impact of the carrier transport on the CW Raman amplification is analyzed. The discrepancy observed between the modeling results and the published experimental results are examined and some practical guidelines are suggested for the improvement of the device performance. Section 5 concludes the paper.
2. Sliced waveguide model
The evolution of pump and stokes signal, in the absence of pump depletion along the longitudinal direction of propagation (see Fig. 1) is given by [8,19]
2( ) ( )( ) ( ) ( )
p plin FCA
p p p p
eff
dP z P zP z z P z
dz Aα α β= − − − (1)
( ) ( )( )
( ) ( ) ( ) ( 2 )s plin FCAs
s s s s R
eff
P z P zdP zP z z P z g
dz Aα α β= − − + − (2)
wherep
P , s
P represents the power; ,lin in
p s
lα α are the linear absorption loss; ,FCA CA
p s
Fα α are the
free carrier absorption loss; β is the TPA coefficient; R
g is the Raman gain coefficient;
subscripts ' 'p and ' 's denotes the pump and signal respectively. The FCA loss for the pump
and the signal are defined as [19]
( ) ( )2 2
( ) ( ) ( )( ) 1.55 ( ) 1.55 ( )FCA
p s e p s p p sz n z p zα σ λ σ λ= × + × (3)
where 188.5 10e
σ −= × cm2and
186 10
pσ −= × cm
2 are the free carrier absorption coefficient for
the electrons and holes respectively; p
λ , s
λ are the pump and signal wavelengths.
The free carriers generated by the TPA, quickly re-distribute within the silicon waveguide region by virtue of diffusion, drift and recombination mechanism in order to restore the steady state condition. Although the distribution of the free carriers within the waveguide is in three dimensions, however in the presence of high reverse bias voltage the transport can be assumed to be predominantly confined in the lateral x-direction and can be described by [33]
2
2
( , , ) ( , , ) ( , , ) ( ,)
)( , ,
,n n n
n
n x z t n x z t n x z t n x z tD G
t xxx z tυ
τ∂ ∂ ∂
= + + −∂ ∂∂
(4)
#126931 - $15.00 USD Received 15 Apr 2010; revised 19 May 2010; accepted 20 May 2010; published 27 May 2010(C) 2010 OSA 7 June 2010 / Vol. 18, No. 12 / OPTICS EXPRESS 12571
2
2
( , , ) ( , , ) ( , , ) ( , , )( , , )p p p
p
p x z t p x z t p x z t p x z tD G x z t
t xxυ
τ∂ ∂ ∂
= − + −∂ ∂∂
(5)
The various parameters in Eqs. (4), (5) are: n (electron), p (hole) densities; n
G ,p
G are
the generation rates; ,n p
D D are the diffusion coefficients; ,n p
υ υ are the drift velocities and
,n p
τ τ are the average electron and hole lifetime. It is clear from Eqs. (1), (2) that in order to
evaluate the pump power ( )p
P z and the signal power ( )s
P z at any given point ' 'z we should
know ( ), ( )s
FCA FCA
pz zα α [described by Eq. (3)] at that point which in turn depends on the
electron and hole density [described by Eqs. (4), (5)]. In order to solve the coupled Eqs. (1)–(5) concurrently, divide the waveguide [see
Fig. 1(a)] along its longitudinal direction into ' 'M slices, each of thickness ( )' ' LsM
∆ = such
that within each slice , ,,FCA F
p s
CA
p sP Pα α can be taken as constant. This can be insured by
making ' 's∆ small or in other words by increasing ' 'M sufficiently (In this work ' 'M = 99 is
used). Using this simplification Eqs. (1), (2) reduce to simple initial value ordinary differential equations with constant coefficients. This can be solved analytically resulting in the following closed form expressions for the pump and the signal power
( )
( )
( )
( ) 1
FCAp p
FCAp p
sFCA
p p
p posFCA
p p po
eff
eP P
P eA
α α
α α
α α
βα α
− + ∆
− + ∆
+=
+ + −
(6)
{ }
{ }
( )(2 ) /
(2 ) /
( )
( )
( ) 1
FCAs s
FCA FCAp pR p p
R
FCAp p
sgFCA
p p
s so g
sFCA
p p po
eff
e
P P
P eA
α αα αβ β α α
β β
α α
α α
βα α
+
− + ∆− +
−
− + ∆
+=
+ + −
(7)
where0p
P and 0s
P are the initial power at the input of any slice; p
P and s
P are the respective
quantities at the output of it. As the signal power is much smaller than that of the pump, the free carriers are predominantly generated by the pump induced TPA [8,19]. Using the known
0pP at the input of a slice, we can evaluate the electron and hole carrier densities in that slice.
In the time-independent case and in the absence of any transport phenomenon, the carrier density resulting from Eqs. (4), (5) is simply given by [8,19]
2
22
po
eff
Pn p
h A
βτυ
= = (8)
where τ is the effective carrier lifetime (ECL) and is taken equal for both electrons and holes [8,19]. The evaluation of the pump power, signal power and the Raman gain at the output of the waveguide can be done using Eq. (3) and Eq. (6)–(8) as depicted in the flowchart [see Fig. 1(c)] and as described in the following. The pump and the probe powers at the input of the waveguide are known parameters. Thus, at the first slice the free carrier density is evaluated using Eq. (8), which is then used to evaluate the free carrier absorption loss for the pump and the signal beam using Eq. (3). The free carrier absorption losses are then used to evaluate the output pump power using Eq. (6) and the output signal power using Eq. (7) from
the first slice. The output pump power p
P and the output signal powers
P from the first slice
then acts as the input pump power0p
P and the input signal power0s
P respectively in the
#126931 - $15.00 USD Received 15 Apr 2010; revised 19 May 2010; accepted 20 May 2010; published 27 May 2010(C) 2010 OSA 7 June 2010 / Vol. 18, No. 12 / OPTICS EXPRESS 12572

following slice. This procedure is repeated in each slice until the end of the waveguide is reached. Thus the Raman gain in each slice is given by
10 log( )s
i
so
PG
P= (9)
and the net gain at the end of the waveguide is given by the sum of the gain in each slice
1
i M
i
i
G G=
=
= ∑ (10)
The SWM was validated by reproducing the results of Ref [8]. by using Eq. (3) and Eq. (6)–(8), and also by numerically solving Eqs. (1)–(3) and Eq. (8) in MATLAB.
Z
Y
X
L
Pin(z,t)
Po(z,t)
∆s
12
M
3
,FCAsα FCA
pα
Yes
No
,finalp pP P=,final
s sP P=1
M
i
i
G G=
= ∑
po pP P=,so sP P=,pP ,sP
,poP ,soP
,n p
1M =
Is
99?M =1M M= +
MG
P+ N+
W
dh
H
SiO2
Si
Air
-Vc
RL
IL
T
(a)
(b) (c)
Fig. 1. A p-i-n diode silicon on insulator rib waveguide (a) Slice waveguide model (SWM). The waveguide is divided into 'M' slices each of width ∆s, with a negligible inter-slice separation. The input beam is centered at the origin of the co-ordinate axis, which is assumed to be located at the center of the intersection of the slab and the rib region of the waveguide. (b) 2-D cross-section of the waveguide with reverse bias. (c) Flowchart depicting the procedure for evaluating the output pump power, signal power and Raman gain using the SWM.
To analyze the influence of the carrier transport on the estimation of the carrier density in the waveguide region and hence on the modeling of CW Raman amplification, consider two extreme scenarios; the diffusion only transport (DOT) case and the high reverse bias (HRB) case. To arrive at the electron and hole distribution, which are the solution of Eq. (4), (5), we must know the generation rate of the free carriers. Assuming that the excited fundamental
mode of the waveguide can be approximated by a Gaussian beam (with mode spot size 0
σ ),
the carrier generation rate can be approximately calculated by averaging it over the rib region [20] and is derived as
#126931 - $15.00 USD Received 15 Apr 2010; revised 19 May 2010; accepted 20 May 2010; published 27 May 2010(C) 2010 OSA 7 June 2010 / Vol. 18, No. 12 / OPTICS EXPRESS 12573
2 2
20
2/2 ( )
, 2 /2
2 2
0
2
0 0 0
1( )
2
1( ) ( ) ( )
2 2 2
x y
W H hpo
n pW h
eff
po
eff
PG e dxdy
h WHA
P W h H herf erf erf
h WHA
σβν
πσβν σ σ σ
+ −−
− −= ×
− += × × × × −
∫ ∫ (11)
In the time independent DOT case, the distribution of electron density in each slice can be evaluated by dropping the drift term and solving the remainder of Eq. (4) with the boundary
condition ( / 2) 0, ( / 2) 0n T n T− = = to arrive at
2
( )( ) 1 { ( ) ( )}
( ) 1
n
n n
n
T
L x xn n L LT
L
expen xp exp
expx G τ
= × − × + −
+ (12)
wheren n n
L Dτ= is the effective diffusion length. For the distribution of hole density simply
replace “n” with “p” in Eq. (12). In the time independent HRB case the general solution of Eq. (4) is given by
1 1 2 2
( ) ( ) ( )n n
n x C exp k x C exp k x G τ= + + (13)
with 1
k , 2
k defined as
1 2 2
4, 1 1
2
n n
n n n
Dk k
D
υ
τ υ
= × ± +
(14)
The constants 1
C and 2
C in Eq. (13) can be obtained by using the boundary conditions at
the electrode terminals. In the presence of high reverse voltage, excess electrons will exit via
the N+ terminal, thus n(x=- /2)=0T . Further, at the P
+ terminal, assumption of negligible
surface recombination velocity gives / 2
| 0x T
dn
dx= = . Thus the constants
1C and
2C are
2
2
2
1
(-
( / 2)
/ 2)1
0
n n
n
k TG exp
exp kC
T k
τ
∆
−
×= (15)
1
2
1 1
( / 2)
( / 2) 0
1 n n
n
exp k T GC
exp k T k
τ− −
×=
∆ (16)
1
1 1 2
2
2
( / 2) ( / 2)
( / 2) ( / 2)n
exp k T exp k T
exp k T k exp k T k×∆
− −
×= (17)
For the distribution of the hole density replace “n” with “p”, “n
υ ” with “p
υ− ” and
“ / 2T ” with “ / 2T− ” in Eqs. (13)–(17). Note that, in the absence of the transport
phenomenon, Eq. (12) and Eq. (13) reduce to Eq. (8). In the remainder of the paper following
numerical parameters are used [8]: R
g = 9.5 cm/W, β = 0.5 cm/W, ps
α α= = 0.39 dB/cm,
L = 4.8 cm, h = 0.85 µm, T = 6 µm, 0
σ = 1 µm, H = 1.55 µm, W = 1.5 µm, d = 2.25
µm, 1684s
λ = nm, 1548p
λ = nm, 71 10n
υ = × cm/s, 6
106p
υ = × cm/s [34], D 40n
= cm2/s,
D 10p
= cm2/s [19]. Further, wherever a reference to Eq. (12) or Eq. (13) is made to account
for the transport effect on the carrier density evaluation, it is imperative that a similar equation for the hole density distribution has been taken into account.
#126931 - $15.00 USD Received 15 Apr 2010; revised 19 May 2010; accepted 20 May 2010; published 27 May 2010(C) 2010 OSA 7 June 2010 / Vol. 18, No. 12 / OPTICS EXPRESS 12574

3. Influence of carrier transport on the estimation of carrier density
In Fig. 2(a), the distribution of the carrier density (at the optical mode center) is plotted along the length of the waveguide for the DOT case [obtained using Eq. (3), Eq. (6), (7) and Eq. (12) in the SWM]; for the ECL values of 1 ns, 10 ns and 100 ns. Note that, due to the larger diffusion coefficient of the electrons compared to the holes, electrons diffuse away faster from the optical mode center resulting in a smaller density compared to that of the holes. Further, as the ECL is decreased from 100 ns (dotted line) to 10 ns (broken line), there is a very small variation in the curves. However, as the ECL is decreased further down to 1 ns (solid line) the carrier density decreased rapidly. This is because for ECL of 1 ns, the effective
diffusion lengths for electrons (n
L = 1 µm) and for holes (p
L = 2 µm) are smaller than the
length of the slice ( " "T = 6 µm) over which the free carriers diffuse. Thus, recombination phenomenon plays prominent role along with the diffusion to establish the carrier density.
However, for the ECL of 10 ns and above, n
L and p
L become large and the influence of the
recombination phenomenon on the transport mechanism diminishes.
0 2 4 60
1
2
3x 10
16
Length (cm)
Ca
rrie
r C
on
c.
(cm
-3)
0 2 4 60
2
4
6x 10
14
Length (cm)
Ca
rrie
r C
on
c.
(cm
-3)
0 2 4 610
15
1016
1017
1018
Length (cm)
Ca
rrie
r C
on
c.
(cm
-3)
0 2 4 610
14
1015
1016
1017
Length (cm)
Ca
rrie
r c
on
c.
(cm
-3)
(a) (b)
(c) (d)
Net
Hole
Electron
Electron
Hole
Net
No Transport
With Transport
No Transport
Diffusion
Fig. 2. Influence of the carrier transport and ECL on the estimation of the carrier density along the length of the waveguide, evaluated at the origin of the co-ordinate axis (optical mode center) (a) DOT case: solid line for τ = 1 ns, broken line for τ = 10 ns and dotted line for τ = 100 ns. (b) HRB case: solid line for τ = 0.1 ns, broken line for τ = 1 ns and dotted lines for τ = 10 ns. Curve with τ = 1 ns superimpose the curve with τ = 10 ns (c) DOT case: Effect of the inclusion and neglect of the diffusion phenomenon, solid line for τ = 1 ns, broken line for τ = 10 ns and dotted line for τ = 100 ns. (d) HRB case: Effect of the inclusion and neglect of the transport phenomenon, solid line for τ = 0.1 ns, broken line for τ = 1 ns and dotted lines for τ = 10 ns. Curve with τ = 1 ns superimpose the curve with τ = 10 ns. In all the four plots, pump power used is 1 Watt.
Figure 2(b) shows the counterpart of Fig. 2(a) for the HRB case [obtained using Eq. (3), Eq. (6), (7) and Eq. (13) in the SWM]; for the ECL values of 0.1 ns (solid line), 1 ns (broken line) and 10 ns (dotted line). As electrons have larger drift velocity (thus smaller transit time)
#126931 - $15.00 USD Received 15 Apr 2010; revised 19 May 2010; accepted 20 May 2010; published 27 May 2010(C) 2010 OSA 7 June 2010 / Vol. 18, No. 12 / OPTICS EXPRESS 12575

compared to the holes, they drift away from the optical mode center more rapidly and hence results in smaller density compared to the holes. Further, the curve corresponding to ECL of 1 ns superimpose the curve with the ECL of 10 ns, indicating that below 1 ns there is no effect of ECL on the estimation of the carrier density. This is because the transit time of the holes
(T/p
υ ~0.1 ns) and that of the electrons (T/n
υ ~0.06 ns) are much smaller than ECL of 1 ns
( " "T = 6 µm is the electrode separation). Thus, the free carriers will drift out of the waveguide before recombining. This is precisely why the variation in the ECL from 1 ns to 10 ns doesn’t result in visible change in the carrier density distribution. Thus, in this case even if the recombination term is removed from the modeling equations, the result will remain unaffected. Indeed this is what is done in modeling high speed P-i-N photodiodes [32].
Figure 2(c) shows the influence of the inclusion [obtained using Eq. (3), Eqs. (6), (7), Eq. (12) in the SWM and shown by black color lines] and neglect [obtained using Eq. (3), Eqs. (6)–(8) in the SWM and shown by blue color lines] of the diffusion phenomenon on the evolution of the carrier density, for the ECL values of 1 ns, 10 ns and 100 ns. The plots corresponding to the inclusion of the diffusion phenomenon are same as shown in Fig. 2(a) and hold the same explanation. For the plots corresponding to “no transport”, note that the carrier density [given by Eq. (8)] is directly proportional to the product of the pump power
squared and ECL (2 2
,p p
n P p Pτ τ∝ ∝ ). Thus, at the input face of the waveguide (givenp
P ), a
change in one order of magnitude of ECL results in a similar change in the magnitude of the carrier density. Inside the waveguide, the carrier density follows the nonlinear evolution of pump power. On the other hand, the presence of diffusion transport smoothes out the carrier density distribution. Overall the neglect of the diffusion phenomenon results in a large discrepancy in the estimation of the carrier density at the optical mode center. This discrepancy is highest at the input face of the waveguide where the carrier density is largest and reduces as the ECL is reduced.
Figure 2(d) shows the counterpart of Fig. 2(c) for the HRB case and can be understood similarly. The necessary point to note is that the neglect of the transport phenomenon can result in excessive overestimation of the carrier density, depending upon the ECL. For example if the ECL is 0.1 ns, then the discrepancy in the carrier density estimation can be up to half an order of magnitude, which can increase to over 1 order of magnitude if the ECL is 1 ns. In other words, the estimation of ECL obtained by fitting the experimental data with the modeling equations [using Eqs. (1)–(3) and Eq. (8)] as is done in the literature (see for e.g [7,8].), can result in large error if the carrier transport is ignored.
4. Influence of carrier transport on the CW Raman amplification
To elucidate the influence of the inclusion/neglect of the carrier transport on the CW Raman amplification; the probe net gain vs. input pump power [Fig. 3(a)] and the output pump power vs. input pump power [Fig. 3(b)]. In both the figures two set of curves corresponding to “with transport” and “without transport” are plotted. Black colored lines are used for the case of “with transport” and blue colored lines are used for the case of “without transport” (the red color dash-dot curve corresponding to ECL of 100 ns is explained later). For each set of curve (“with transport” and “without transport”) three different ECL values are used viz. 0.1 ns (solid lines), 1 ns (broken lines) and 16 ns (dotted lines). Note that, the ECL values of 16 ns (corresponding to the open circuit case) and that of 1 ns (corresponding to 25 V case) were obtained in Ref [8]. by fitting the experimental data with the modeling equations [Eq. (1)–(3) and Eq. (8)], without taking into account the carrier transport.
For the open circuit case, the transport will be diffusion assisted only. In this case the experimental points [8] are shown with blue squares in Fig. 3(a) and Fig. 3(b). The blue dotted line touching the experimental points corresponds to the modeled curve “without transport” case, with ECL of 16 ns [obtained using Eq. (3) and Eqs. (6)–(8) in SWM]. The black dotted curve with ECL of 16 ns is the one corresponding to “with transport” case [obtained using Eq. (3), Eqs. (6), (7), and Eq. (12) in SWM]. There is a large discrepancy between the curves corresponding to “with transport” and “without transport”.
#126931 - $15.00 USD Received 15 Apr 2010; revised 19 May 2010; accepted 20 May 2010; published 27 May 2010(C) 2010 OSA 7 June 2010 / Vol. 18, No. 12 / OPTICS EXPRESS 12576

First, note that in Fig. 2(c) increasing the ECL from 10 ns to 100 ns does not result in any significant change in the carrier density for the “Diffusion” case. Thus, even if we increase the ECL from 16 ns to 100 ns, there should be no significant change in the position of the “black dotted curve” with ECL of 16 ns shown in Fig. 3(a) and Fig. 3(b). Indeed this is the case as shown with red dash-dot line corresponding to ECL of 100 ns. Further, note that reducing the ECL from 10 ns to 1 ns in Fig. 2(c) for the “Diffusion” case results in the reduction of the carrier density. Thus, if we decrease ECL from 16 ns to 1 ns the black dotted curve in Fig. 3(a) and Fig. 3(b) will shift slightly up, due to reduced FCA loss.
0 400 800 12000
200
400
600
800
Input Pump Power (mW)O
ut. P
um
p P
ow
er
(mW
)0 400 800 1200
-6
-3
0
3
6
9
Input Pump Power (mW)
Pro
be
ne
t g
ain
(d
B)
τ = 0.1, 1 ns with trans.
τ = 0.1 ns without trans.τ = 0.1, 1 ns with trans.
τ = 0.1 ns without trans.
(a)(b)
16 ns (open)
16 ns
100 ns
1 ns (25 V)1 ns
16 ns
100 ns
16 ns
Fig. 3. Influence of the inclusion/neglect of the free carrier transport on the estimation of the (a) Probe net gain (b) Output pump power; as a function of the input pump power. In both the plots, black color lines are used for “with transport” case and blue color lines are used for “without transport” case. Both black and blue color lines corresponding to ECL of 0.1 ns are shown by solid curves; for ECL of 1 ns, with broken curves and for ECL of 16 ns, with dotted curves. Note that the two curves (black lines) corresponding to the “with transport” (HRB) case are superimposing each other in both the plots. Experimental data from Ref [8].
Also to note is the fact that part of the TPA generated free carriers will diffuse (inside the waveguide) towards the longitudinal direction ('z-direction'), which is neglected in the present analysis. Inclusion of which will result in slight lowering of the carrier density estimates for the “Diffusion” case shown in the Fig. 2(c). This will result in further smaller FCA loss incurred by the optical pump and probe beams. Thus, the probe net gain and the output pump power (black dotted curves) corresponding to ECL of 16 ns should be slightly higher to what is shown in Fig. 3). In any case, the change in the ECL from 16 ns to 100 ns or to 1 ns and/or the inclusion of the diffusion phenomenon in the longitudinal direction will not bring the “black dotted curves” (corresponding to the “with transport”) case in close proximity to the experimental data and the 'blue dotted curve” (corresponding to “without transport” case). Then what is the cause of this discrepancy?
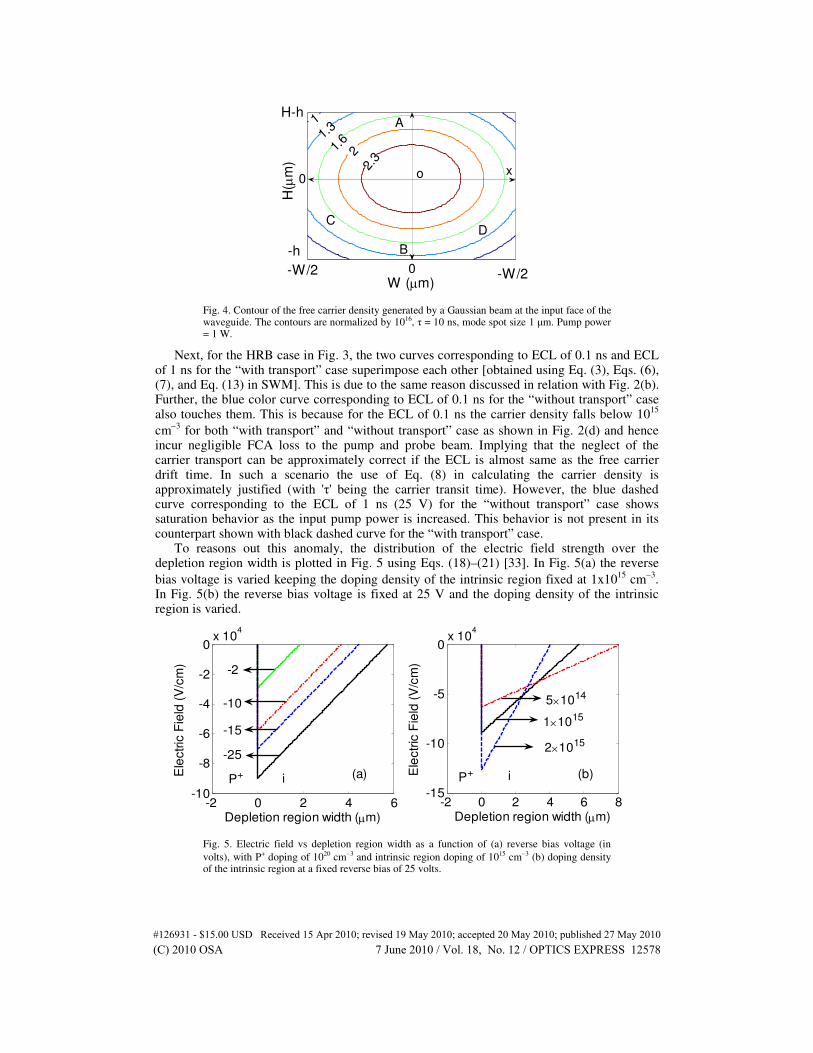
To understand this, the distribution of the free carrier (generated by an optical beam of Gaussian spatial profile) over the waveguide rib region is plotted in Fig. 4. It is evident from the figure that the free carrier density is maximum around the central region marked 'O' and decreases radially outwards towards the regions marked as 'A', 'B', 'C' and 'D'. The free carriers (irrespective of the charge type) generated in the rib region (above the x-axis) will diffuse down towards the region marked 'B' and outwards towards the region marked 'C' and 'D' only and only when the respective carrier density at the x-axis turns less than the density above it, until then the free carriers (above the x-axis) will diffuse towards the rib surfaces or into the waveguide (‘z’ direction) towards the propagating optical beam. In the continuous wave case, the density of the free carriers above the x-axis is unlikely to become less than the density at the x-axis due to the Gaussian nature of the generation profile. Thus, the free carriers will get clustered inside the rib region resulting in FCA loss.
#126931 - $15.00 USD Received 15 Apr 2010; revised 19 May 2010; accepted 20 May 2010; published 27 May 2010(C) 2010 OSA 7 June 2010 / Vol. 18, No. 12 / OPTICS EXPRESS 12577
0
0
W (µm)H
(µm
) 2.321.
61.31
-W/2 -W/2
H-h
-h
o
CD
x
A
B
Fig. 4. Contour of the free carrier density generated by a Gaussian beam at the input face of the waveguide. The contours are normalized by 1016, τ = 10 ns, mode spot size 1 µm. Pump power = 1 W.
Next, for the HRB case in Fig. 3, the two curves corresponding to ECL of 0.1 ns and ECL of 1 ns for the “with transport” case superimpose each other [obtained using Eq. (3), Eqs. (6), (7), and Eq. (13) in SWM]. This is due to the same reason discussed in relation with Fig. 2(b). Further, the blue color curve corresponding to ECL of 0.1 ns for the “without transport” case also touches them. This is because for the ECL of 0.1 ns the carrier density falls below 10
15
cm−3
for both “with transport” and “without transport” case as shown in Fig. 2(d) and hence incur negligible FCA loss to the pump and probe beam. Implying that the neglect of the carrier transport can be approximately correct if the ECL is almost same as the free carrier drift time. In such a scenario the use of Eq. (8) in calculating the carrier density is approximately justified (with 'τ' being the carrier transit time). However, the blue dashed curve corresponding to the ECL of 1 ns (25 V) for the “without transport” case shows saturation behavior as the input pump power is increased. This behavior is not present in its counterpart shown with black dashed curve for the “with transport” case.
To reasons out this anomaly, the distribution of the electric field strength over the depletion region width is plotted in Fig. 5 using Eqs. (18)–(21) [33]. In Fig. 5(a) the reverse
bias voltage is varied keeping the doping density of the intrinsic region fixed at 1x10¹⁵
cm−3
. In Fig. 5(b) the reverse bias voltage is fixed at 25 V and the doping density of the intrinsic region is varied.
-2 0 2 4 6-10
-8
-6
-4
-2
0x 10
4
Depletion region width (µm)
Ele
ctr
ic F
ield
(V
/cm
)
-2 0 2 4 6 8-15
-10
-5
0x 10
4
Depletion region width (µm)
Ele
ctr
ic F
ield
(V
/cm
)
5×10¹⁴
1×10¹⁵
2×10¹⁵
(b)(a)
-25
-15
-10
-2
P+ i P+ i
Fig. 5. Electric field vs depletion region width as a function of (a) reverse bias voltage (in
volts), with P+ doping of 1020 cm−3 and intrinsic region doping of 1015 cm−3 (b) doping density of the intrinsic region at a fixed reverse bias of 25 volts.
#126931 - $15.00 USD Received 15 Apr 2010; revised 19 May 2010; accepted 20 May 2010; published 27 May 2010(C) 2010 OSA 7 June 2010 / Vol. 18, No. 12 / OPTICS EXPRESS 12578

( ) ( ); 0a
p p p
qNE x x x x x
ε= − + − < < (18)
( ) ( ); 0d
i i i
qNE x x x x x
ε= − − < < (19)
where p
x , i
x are the depletion region width in the P+-type and i-type region respectively with
their corresponding magnitude given by
2 ( )
( )
bi d
p
a a d
V V Nx
q N N N
ε −= ×
+ (20)
2 ( )
( )
bi a
i
d a d
V V Nx
q N N N
ε −= ×
+ (21)
wherebi
V is the built in potential, d
N is the donar concentration, a
N is the acceptor
concentration, ε is the relative permittivity of the medium and q is the electronic charge. Note
that the intrinsic region is in fact a lightly doped P-type region [4]. First, in the modeling for the HRB case it has been assumed that the applied reverse bias is
high enough to completely deplete the intrinsic region and induce electric field high enough to enable the free carriers to drift at their respective saturated velocity. For the above assumption to be valid, an electric field of ~7x10
4 V/cm [34] should be present through out the intrinsic
region, which is not the case as shown in Fig. 5(a). Thus, the analysis carried out for the HRB case clearly represent the upper limit.
Second, it is evident from Fig. 5(a) that as the reverse bias voltage is increased the depletion region extends more towards the N
+ side, enhancing the region of electric field
assisted free carrier sweep out. Those free carriers which are out of the depletion region will be transported predominantly by the diffusion mechanism. Thus as the reverse bias is kept on increasing, larger fraction of the free carriers will be swept out by the electric field, reducing FCA loss and enhancing the device performance. It is to be noted though that the electric field strength varies linearly in the depletion region and drops significantly (in this case to “zero”) near the N
+ region compared to the P
+ region where it is maximum. Thus, the free carriers will
we swept out relatively quickly from the P+-i end compared to the i-N
+ junction where they
slow down and get clustered. This phenomenon is similar to the one observed in high intensity P-i-N photodiode [35]. Moreover, the detrimental effect of the space charge screening [12,36] is likely to aggravate this issue further.
A reduction in the doping density of the intrinsic region can help improve this situation as shown in Fig. 5(b). It is evident from this figure that the depletion region width and the maximum attainable electric field are highly sensitive to the intrinsic region doping density.
For example, increasing the intrinsic region doping density from 1x10¹⁵
cm−3
(p-type) to
2x10¹⁵
cm−3
, increases the maximum obtainable electric field strength. However, this reduces the depletion region width by almost 2 micron. On the other hand, if the doping density is
reduced from 1x10¹⁵
cm−3
(p-type) to 5x10¹⁴
cm−3
, the depletion region punch through the N+
doped region.
6. Conclusion
The influence of the TPA generated free carrier transport on the CW Raman amplification in silicon waveguide was examined for the first time. A novel analytical model was developed to concurrently solve the set of initial-boundary value PDE, describing the free carrier transport and the CW Raman amplification. The model was used to ascertain the influence of the inclusion/neglect of the carrier transport (in the modeling equation) on the estimation of the TPA generated free carrier density (at the optical mode center). Analysis suggests that the
#126931 - $15.00 USD Received 15 Apr 2010; revised 19 May 2010; accepted 20 May 2010; published 27 May 2010(C) 2010 OSA 7 June 2010 / Vol. 18, No. 12 / OPTICS EXPRESS 12579

magnitude of the discrepancy (in the carrier density estimation) depends upon the estimated ECL and the mode of carrier transport. In the diffusion only transport case, the discrepancy can range between half an order of magnitude (for ECL of 1 ns) to over one order of magnitude (for ECL of 100 ns) at the input face of the waveguide. On the other hand, in the presence of high reverse voltage the discrepancy can range from half an order of magnitude (for ECL of 0.1 ns) to up to two orders of magnitude for ECL of 10 ns. However, the neglect of the carrier transport from the modeling equations may be approximately correct, if the estimated ECL is approximately same as the carrier transit time.
Further, the model was used to study the influence of the carrier transport on the CW Raman amplification. Analysis reveals that in the absence of reverse bias voltage, the clustering of the free carriers in the rib region of the waveguide results in excessive FCA loss, which may nullify the Raman gain. The application of the reverse bias voltage can assist in sweeping out the TPA generated free carriers from the path of the propagating beam, reducing the FCA loss and enhancing the Raman gain. However, the applied biasing voltage and the intrinsic region doping density should be properly optimized to achieve full benefit of this technique, for the reduction of FCA loss.
#126931 - $15.00 USD Received 15 Apr 2010; revised 19 May 2010; accepted 20 May 2010; published 27 May 2010(C) 2010 OSA 7 June 2010 / Vol. 18, No. 12 / OPTICS EXPRESS 12580