Embed Size (px)
Citation preview
Influence of Different Platen Angles and Selected Roof Header Reinforcements on
the Quasi‐Static Roof Strength of a 2003 Ford Explorer FE Model
Joachim Scheub, Fadi Tahan, Kennerly Digges, Cing‐Dao Kan
Abstract The objective of this study was to analyze the influence of different platen angles of the Federal
Motor Vehicle Safety Standard (FMVSS) 216 test and the influence of the resulting load application on roof
deformation patterns. Of particular interest was how the strength of the connection between the A‐pillars (roof
header) influenced the roof crush performance. A Finite Element based study using the Ford Explorer altered
the roof header design and applied High Strength Steel (HSS). Pitch and roll angles of the loading device were
varied.
When the pitch angle increases, the strength‐to‐weight ratio (SWR) decreases for all roll angles. The worst
case scenario was with a platen angle of 25° roll and 10° pitch. Once the connection between the A‐pillars was
improved, the SWR increased for high roll angles. The combination of a redesigned roof header and the use of
HSS led to the highest SWR improvements ranging from 12.9% to 23.1%. The fixed platen angles for FMVSS 216
test appear to provide little incentive to improve the overall roof structure by load transfer to the opposite side
A‐pillar. Actual rollover accident subjects the roof to a variety of loading angles more extreme than the FMVSS
216 test condition.
Keywords crashworthiness, finite element model, FMVSS 216, quasi‐static roof crush, roof header
reinforcement
I. INTRODUCTION
In 2010, nearly 9.1 million crashes involving passenger cars, pickups, SUVs and vans occurred in the United
States of America. In only 2.1% of these crashes, a rollover where a car rolled for at least 90° was involved.
Although rollover crashes are such a rare event, they accounted for almost 35%, more than 7,600, of all deaths
on US streets in 2010 [1]. Consequently, the automotive society has a keen interest in improving the
crashworthiness of vehicles in rollover crashes.
To evaluate the performance in rollover crashes, newly introduced vehicles have to meet the requirements of
the Federal Motor Vehicle Safety Standard (FMVSS) 216. In this test the vehicle is subjected to a loading device,
which is positioned under certain roll and pitch angles. The car has to withstand a quasi‐static force of at least
three times its own weight [2]. The regulation is already in a phase‐in status and becomes mandatory on
September 1, 2015.
Furthermore, some researchers have suggested, based on studies of real world crashes that the current
loading angles of the device are not realistic and the authors think that the FMVSS 216 platten angles should
be changed [3]. Other researchers used the numerical analysis methods on a certain vehicle to draw
similar conclusions and to identify the worst case scenario [4][5]. However, the vehicle’s response to
certain loading conditions strongly depends on the roof structure of the vehicle [3].
This study analyzes the influence of varying the FMVSS 216 platen roll and pitch angles on the roof strength of
a 2003 Ford Explorer with the help of numerical simulations using the commercial FE solver LS‐DYNA. The Ford
Explorer has been selected since it represents an SUV with a high center of gravity that has a high rollover risk.
Additionally, the connection between the A‐pillars, which is referred to as the roof header, and the roof
J. Scheub has a MSc degree from the National Crash Analysis Center at George Washington University, Washington, D.C., USA (phone +1
703 726‐8327, email: [email protected]); F. Tahan is a Research Scientist and Doctoral Candidate and Professor K. Digges is a
Research Director at the National Crash Analysis Center at the George Washington University, Virginia, USA; C‐D Kan is a
Professor of Physics, Astronomy, and Computational Sciences at the George Mason University, Fairfax, Virginia, USA.
IRC-13-42 IRCOBI Conference 2013
- 380 -
strength to meet the new regulations
Several roof structure reinforcement
improvements include material changes
reinforcement methods are then evaluate
roof strength test.
Finite Element (FE) analysis was
development and design, as well as vehicl
FE‐solver LS‐DYNA by the Livermore So
the 2003 Ford Explorer.
This section describes the methodol
quasi‐static roof crush test and the FE‐
Quasi‐Static Roof Crush Test (FMVSS 216)
To address the issues created by the
rollover crash, the National Highwa
Vehicle Safety Standard (FMVSS) No.
rollover crashes due to roof crush [6].
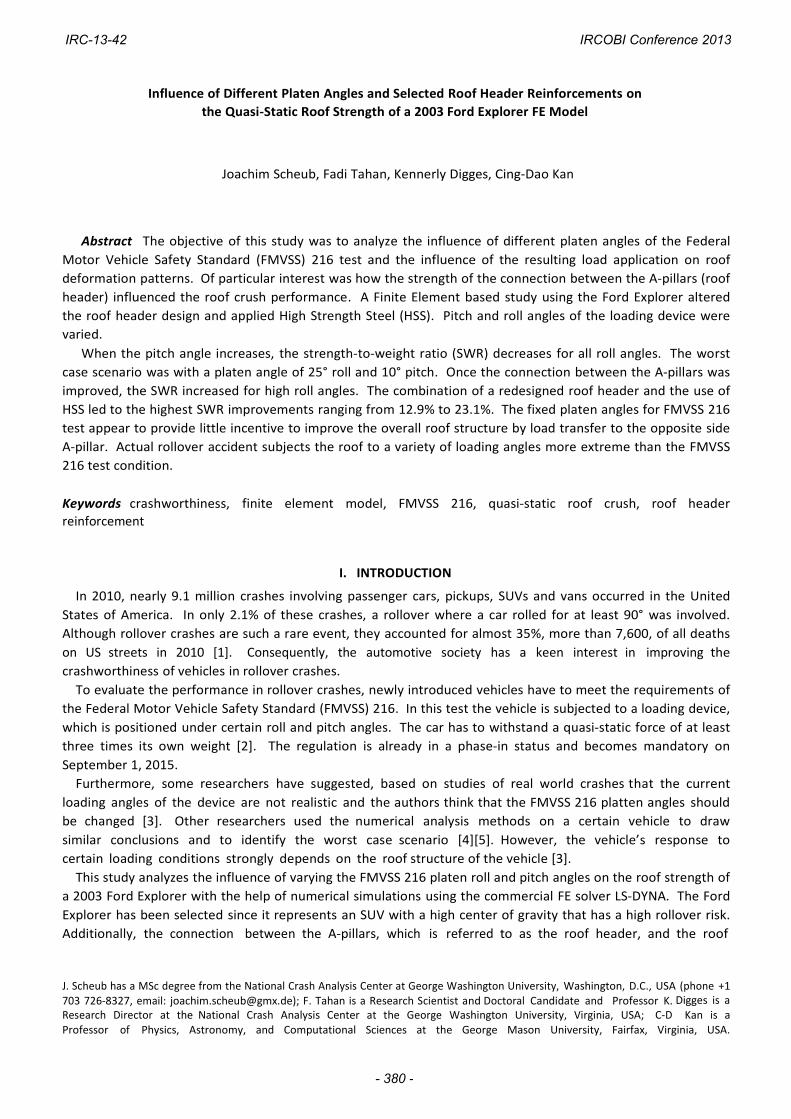
The original test requires that the
quasi‐static applied load of 1.5 times
device of 127 mm. The loading device
To simulate the rollover, the platen is
during the test and to eliminate the inf
the body has to be restrained. The test
perpendicular to the surface of the loadin
controlled test [6].
In 2009, the standard was updated
sides of the roof, sequentially. Theref
the previous standard test. Additional
the maximum force must be recorded
Fig. 1. Quas
2003 Ford Explorer FE‐Model
The Finite Element (FE) model was
Washington University. The NCAC dig
published the FE‐model in 2007 on the
component tests and a full frontal rigid
are considered and evaluated.
reinforcements are selected in order to improve the Explore
changes, design changes and combinations of
evaluated by the strength‐to‐weight ratio (SWR) value
II. METHODS
used in this study since it is a proven metho
vehicle crashworthiness evaluation. This work mad
oftware Technology Corporation (LSTC) to evaluat
methodology used by explaining the design of experi
‐model. The validation of the FE‐model is also presented
216)
the intrusion of the roof structure into the passenge
Highway Traffic Safety Administration (NHTSA) introduc
216. Its main purpose is to reduce the numbe
vehicle roof of passenger cars that weigh less tha
the unloaded vehicle weight (UVW) within a displac
e is a rigid plate whose dimensions and positionin
s positioned at 25° of roll and 5° of pitch. To preven
influence of the suspension system, the car is rigidl
test setup of the loading device is shown in Fig. 1.
loading device in a quasi‐static and constant manne
d. The test now requires a strength‐to‐weight‐rati
Therefore, both sides have to be loaded separately unde
Additionally, the loading device is limited to 127 mm of displacement
d and meet the required strength [2].
Quasi‐Static Roof Crush (FMVSS 216) Test setup [2]
s obtained from the National Crash Analysis Cente
digitized a 2003 Ford Explorer at its Vehicle Modelin
the NCAC website [7]. The model has been validate
rigid barrier test, which was conducted by NHTSA.
Explorer roof strength. These
of both methods. The
values similar to FMVSS 216
method that can help vehicle
made use of the commercial
evaluate the crashworthiness of
experiments, the basics of the
presented.
passenger compartment during a
introduced the Federal Motor
er of deaths and injuries in
than 2,722 kg withstands a
displacement of the loading
positioning can be found in ref. [6].
prevent the vehicle motion
rigidly fixed to the ground and
. The force is then applied
manner. The test is a motion
ratio (SWR) of 3.0 on both
under the same conditions as
displacement, during which
Center (NCAC) at the George
Modeling Laboratory (VML) and
validated towards several sub‐
The material data for the
IRC-13-42 IRCOBI Conference 2013
- 381 -
FE‐model were derived from coupon tests and is therefore assumed to be realistic. Additional validations
were performed for the Canada Motor Vehicle Safety Standard (CMVSS) 212‐301, the side New Car
Assessment Program (SNCAP) tests and the Insurance Institute for Highway Safety (IIHS) offset deformable
barrier (ODB) test. All validation reports can be obtained from the NCAC website [7].
For this particular study, the modeling of the windshield was improved in order to get a more realistic
behavior under this specific type of load where the windows and the windshield play a significant role. The
original vehicle model used two layers of glass. The modified model added a polymer layer between the two
glass layers, simulating correctly the laminated windshield. Furthermore, the glass modeling was changed
from an elastic to a piecewise linear plastic material with a considerably low plastic strain as failure criterion
to represent the brittle behavior of glass. The polymer layer is also modeled as a piecewise linear plastic
material, with a high Young’s Modulus and a high failure criteria.
Simulation Setup
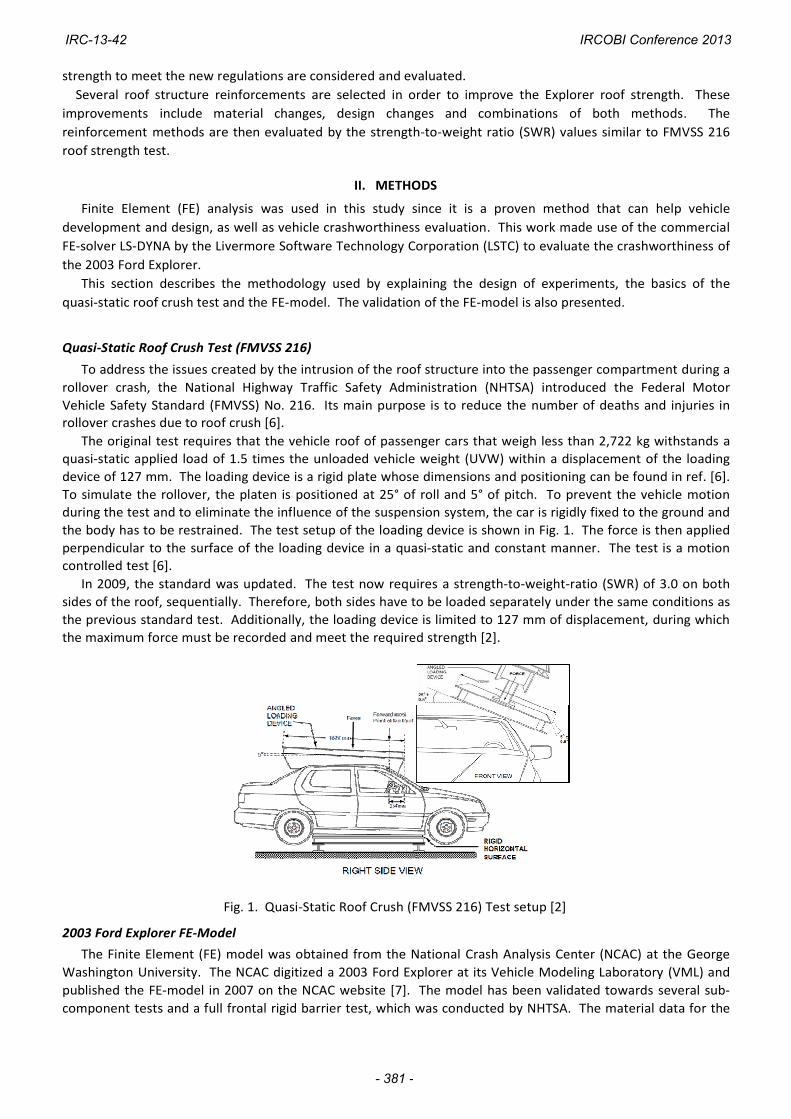
In the FE model, the vehicle’s body was restrained using the LS‐DYNA keyword *BOUNDARY_SPC_SET with a
constraint in the translational and rotational degrees of freedom. The loading device was modeled by a moving
rigid wall. The LS‐DYNA command used is *RIGIDWALL_GEOMETRIC_FLAT_MOTION. The geometric shape and
position relative to the vehicle roof meet the FMVSS 216 test requirements. In order to increase the speed of
the simulation, the wall speed in the FE‐model was set to a constant 5 mph (2.233 m/s), which leads to a
simulation time of 113 ms. The different platen angles were first varied in roll angle, and then in pitch. Fig. 2
shows the simulation setup of the FMVSS 216 test with the rigid wall at a roll angle of 45° and a pitch angle of
10°. The simulations were performed on an Intel platform MPI 3.1 Xeon64. Using eight processors, the
simulation took approximately 8 hours for 120 ms. The LS‐DYNA version used was MPP971sR4.2.1.
Fig. 2. FMVSS 216 test simulation setup with platen angles of 45° roll and 10° pitch
FE‐Model Validation
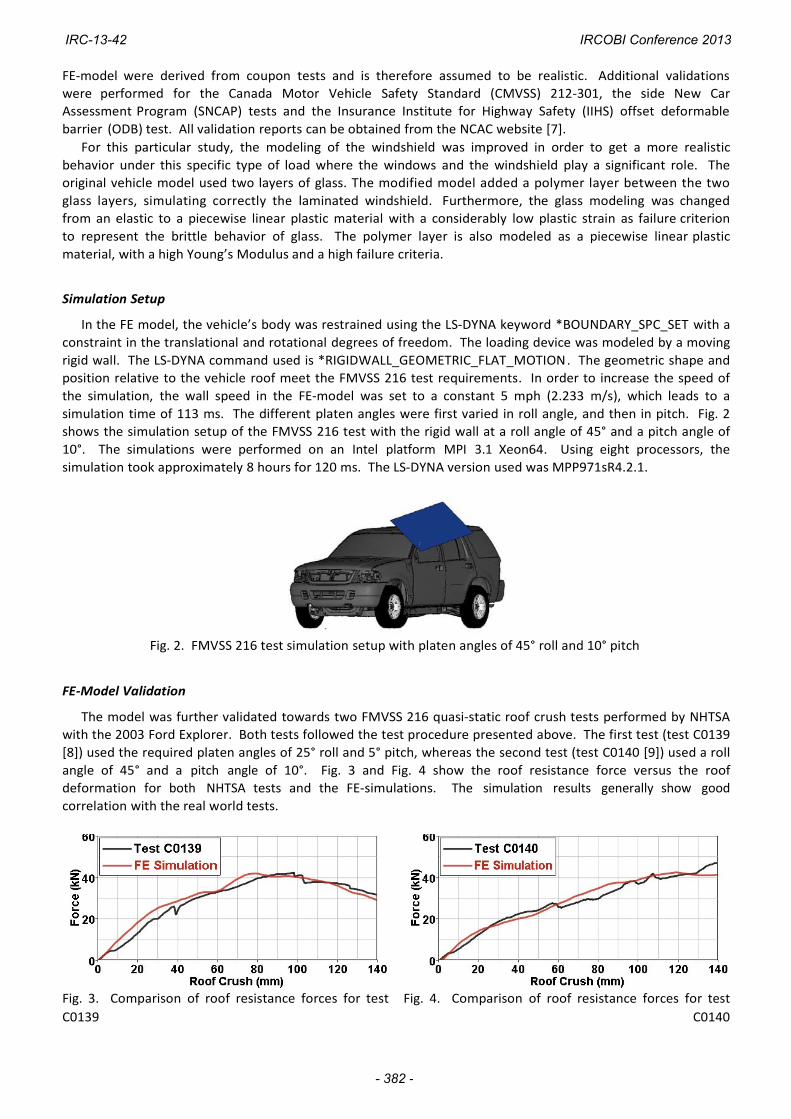
The model was further validated towards two FMVSS 216 quasi‐static roof crush tests performed by NHTSA
with the 2003 Ford Explorer. Both tests followed the test procedure presented above. The first test (test C0139
[8]) used the required platen angles of 25° roll and 5° pitch, whereas the second test (test C0140 [9]) used a roll
angle of 45° and a pitch angle of 10°. Fig. 3 and Fig. 4 show the roof resistance force versus the roof
deformation for both NHTSA tests and the FE‐simulations. The simulation results generally show good
correlation with the real world tests.
Fig. 3. Comparison of roof resistance forces for test Fig. 4. Comparison of roof resistance forces for test
C0139 C0140
IRC-13-42 IRCOBI Conference 2013
- 382 -
A statistical method was used to verify the validation of the FE model to the test. This particular procedure
was developed and suggested by the National Cooperative Highway Research Program (NCHRP) project 22‐24
[10]. It utilizes a MATLAB based software package, which applies a series of statistical tests to a paired set of
curves that represent the simulation and the actual test. The software compares the data and determines the
quality of the matching curves. For this study, the single‐channel comparison of the data captured by the
instrumentation used in the tests and the simulation results generated the following metrics: Magnitude, Phase
and Comprehensive (MPC) metrics, based on the Geers approach, and the ANOVA metric, based on the analysis
of variation approach. The recommended passing values for the MPC metrics should be less than 40% for each
of the magnitude (M), phase (P) and the comprehensive (C, the square root of the sum of the squares of M and
P) values, and for the ANOVA metrics should be less than 5% for the average residual and less than 35% for the
standard deviation. When the values fall under these acceptance criteria, the simulation can be said to have
good correlation with the test, with any deviations in the data attributed to random experimental error [10].
These objective rating metrics for the platen force transducers compared to both tests and simulations are
summarized in Table I. These values pass both recommended metrics. Consequently, the validation is
considered adequate for the intended purpose of this research.
TABLE I
STATISTICAL TEST SIMULATION VALIDATION USING THE GEERS AND ANOVA METRIC APPROACHES
NHTSA C0139 NHTSA C0140
Sprague Geers
MPC Metric
ANOVA
Metric
Design of Experiments
In order to evaluate the influence of different platen angles on the 2003 Ford Explorer roof structure, the
vehicle was subjected to twelve different loading conditions where the pitch angle was either 5° or 10° and the
roll angle varied from 15° to 65° in increments of 10°. The simulation results were then analyzed towards the
roof resistance forces detected in the loading device and the deformation shape of the roof in order to
determine a measure for the occupant injury risk. The deformation was extended to 254 mm, rather than 127
mm as the regulation specifies, in order to address the roof structure behavior. Based on analysis of these
results, the critical loading cases were selected and these parameters were analyzed in more detail, especially
the evaluation of the roof reinforcements. The connection between the A‐pillars is of crucial interest for this
study as it is believed to play a significant role in transferring the forces from one side to the other side.
Therefore, these parts were changed in order to improve the Explorer’s roof strength. These improvement
methods involve the use of High Strength Steels (HSS) and redesign of the roof header components only. These
improvements were then evaluated using the previously selected load cases and analysis parameters.
III. RESULTS
Baseline Model
As an important measure of the strength and the quality of the roof structure, the forces that are detected in
the loading device (also called rigid wall forces) are of particular interest. These forces are used to determine
the strength‐to‐weight ratio (SWR) of the vehicle. Of particular interest are the forces prior to 127 mm of plate
displacement, as this is where the resistance force of the roof is measured according to the FMVSS 216 test
procedure (see above). The SWR of the vehicle for the different load cases are calculated using the unloaded
vehicle weight (UVW) of 1931 kg from test C0139. The SWR is tabulated in Table II.
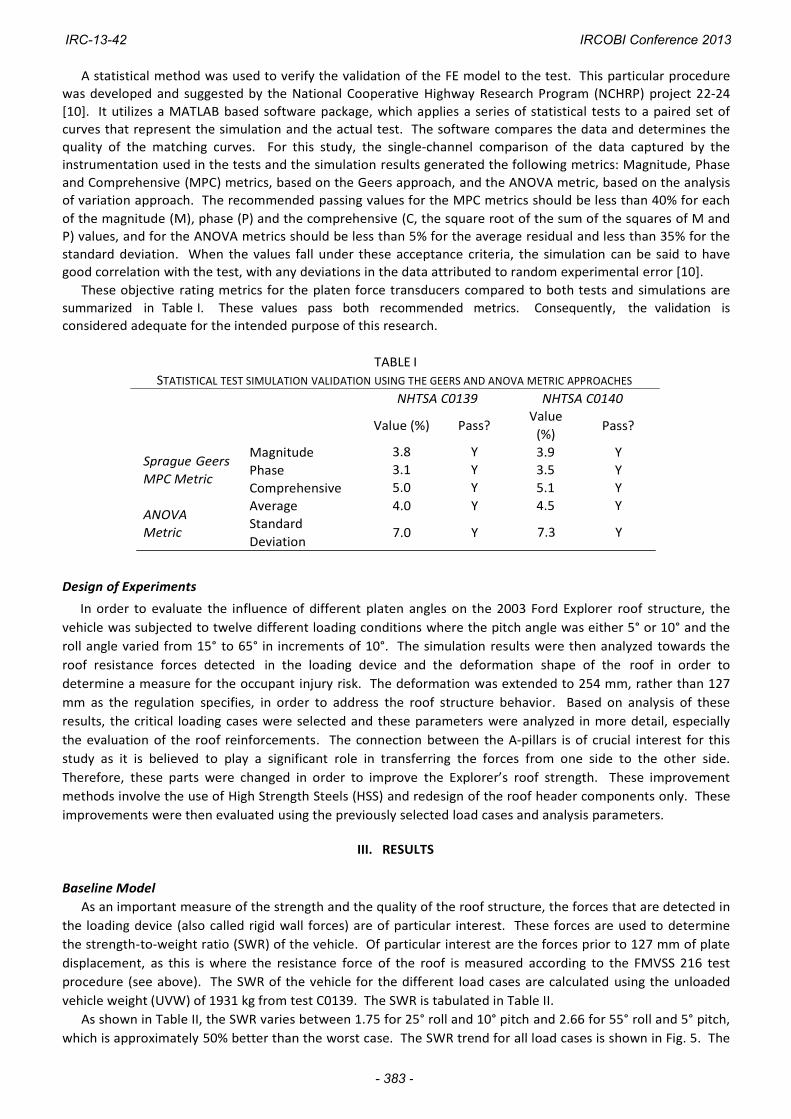
As shown in Table II, the SWR varies between 1.75 for 25° roll and 10° pitch and 2.66 for 55° roll and 5° pitch,
which is approximately 50% better than the worst case. The SWR trend for all load cases is shown in Fig. 5. The
Value
(%)
3.9
3.5
5.1
4.5
7.3
Value (%) Pass?
3.8 Y
3.1 Y
5.0 Y
4.0 Y
7.0 Y
Pass?
Y
Y
Y
Y
Y
Magnitude
Phase
Comprehensive
Average
Standard
Deviation
IRC-13-42 IRCOBI Conference 2013
- 383 -
roof strength for cases with a 10° pitch angle is generally lower than for cases with the 5° pitch angle. The
resistance force for each pitch angle is almost flat for low roll angles, increases when the roll angle reaches 45°
and 55°, and then it drops for the 65° roll angle.
conditions.
TABLE II
STRENGTH‐TO‐WEIGHT RATIO OF THE 2003 FORD EXPLORER FOR ALL SIMULATED LOAD CASES
Pitch angle
Roll angle
15°
25°
35°
45°
55°
65°
60000
50000
40000
30000
20000
10000
0
15 25 35 45 55 65
Roll Angle [°]
Fig. 5. Trend of resistance forces for all simulated load cases
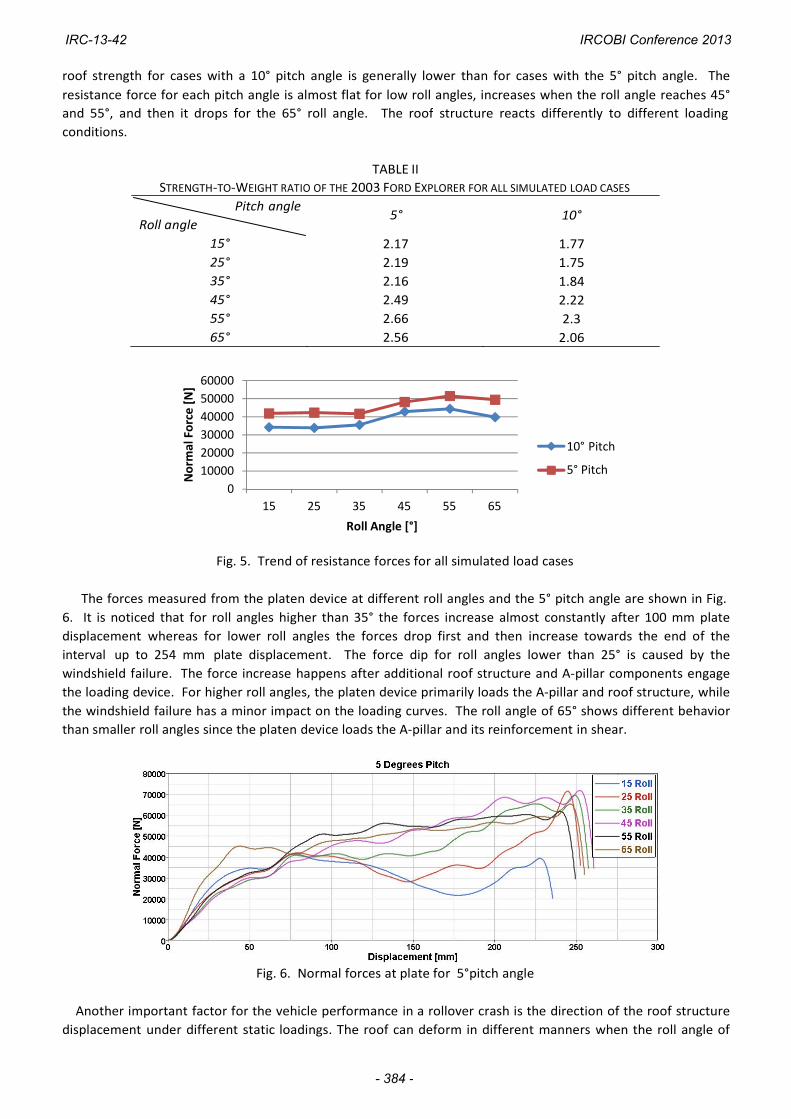
The forces measured from the platen device at different roll angles and the 5° pitch angle are shown in Fig.
6. It is noticed that for roll angles higher than 35° the forces increase almost constantly after 100 mm plate
displacement whereas for lower roll angles the forces drop first and then increase towards the end of the
interval up to 254 mm plate displacement. The force dip for roll angles lower than 25° is caused by the
windshield failure. The force increase happens after additional roof structure and A‐pillar components engage
the loading device. For higher roll angles, the platen device primarily loads the A‐pillar and roof structure, while
the windshield failure has a minor impact on the loading curves. The roll angle of 65° shows different behavior
than smaller roll angles since the platen device loads the A‐pillar and its reinforcement in shear.
Fig. 6. Normal forces at plate for 5°pitch angle
Another important factor for the vehicle performance in a rollover crash is the direction of the roof structure
displacement under different static loadings. The roof can deform in different manners when the roll angle of
10°
1.77
1.75
1.84
2.22
2.3
2.06
10° Pitch
5° Pitch
5°
2.17
2.19
2.16
2.49
2.66
2.56
The roof structure reacts differently to different loading
IRC-13-42 IRCOBI Conference 2013
- 384 -
the loading device is changed. The mode of roof deformation into the passenger compartment reduces the
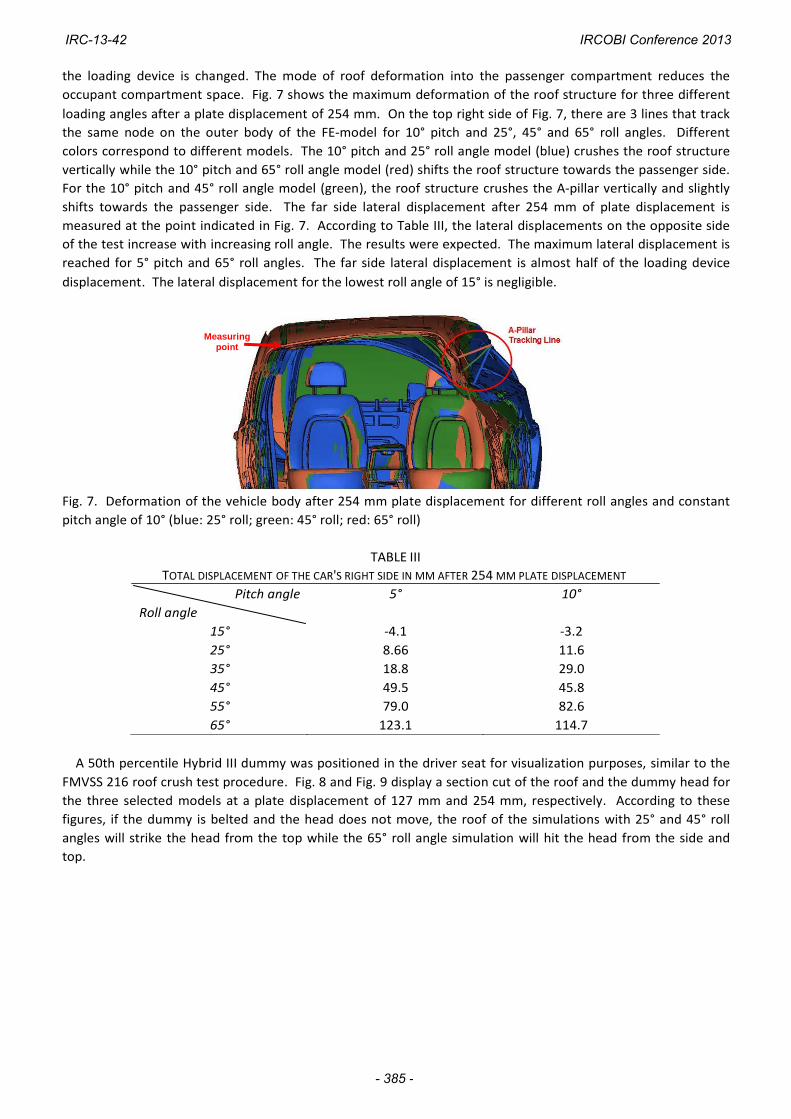
occupant compartment space. Fig. 7 shows the maximum deformation of the roof structure for three different
loading angles after a plate displacement of 254 mm. On the top right side of Fig. 7, there are 3 lines that track
the same node on the outer body of the FE‐model for 10° pitch and 25°, 45° and 65° roll angles. Different
colors correspond to different models. The 10° pitch and 25° roll angle model (blue) crushes the roof structure
vertically while the 10° pitch and 65° roll angle model (red) shifts the roof structure towards the passenger side.
For the 10° pitch and 45° roll angle model (green), the roof structure crushes the A‐pillar vertically and slightly
shifts towards the passenger side. The far side lateral displacement after 254 mm of plate displacement is
measured at the point indicated in Fig. 7. According to Table III, the lateral displacements on the opposite side
of the test increase with increasing roll angle. The results were expected. The maximum lateral displacement is
reached for 5° pitch and 65° roll angles. The far side lateral displacement is almost half of the loading device
displacement. The lateral displacement for the lowest roll angle of 15° is negligible.
Measuring
point
Fig. 7. Deformation of the vehicle body after 254 mm plate displacement for different roll angles and constant
pitch angle of 10° (blue: 25° roll; green: 45° roll; red: 65° roll)
TABLE III
TOTAL DISPLACEMENT OF THE CAR'S RIGHT SIDE IN MM AFTER 254 MM PLATE DISPLACEMENT
Pitch angle 5° 10°
Roll angle
15° ‐4.1 ‐3.2
25° 8.66 11.6
35° 18.8 29.0
45° 49.5 45.8
55° 79.0 82.6
65° 123.1 114.7
A 50th percentile Hybrid III dummy was positioned in the driver seat for visualization purposes, similar to the
FMVSS 216 roof crush test procedure. Fig. 8 and Fig. 9 display a section cut of the roof and the dummy head for
the three selected models at a plate displacement of 127 mm and 254 mm, respectively. According to these
figures, if the dummy is belted and the head does not move, the roof of the simulations with 25° and 45° roll
angles will strike the head from the top while the 65° roll angle simulation will hit the head from the side and
top.
IRC-13-42 IRCOBI Conference 2013
- 385 -
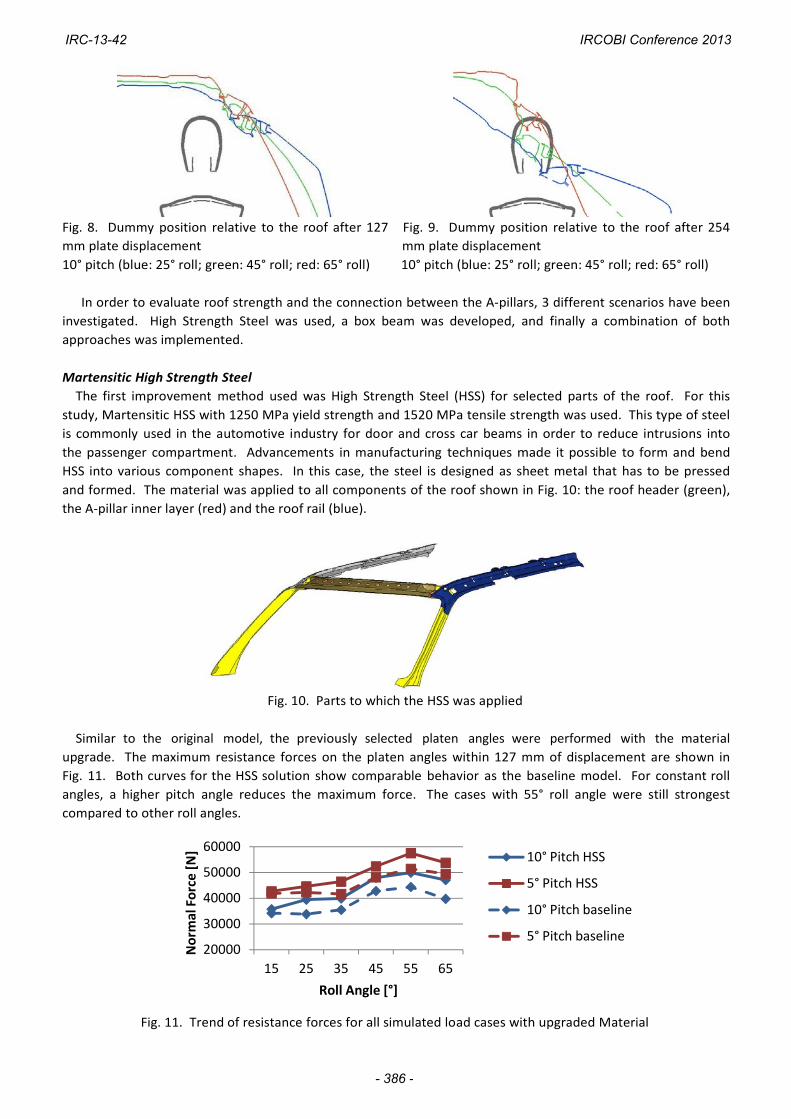
Fig. 8. Dummy position relative to the roof after 127 Fig. 9. Dummy position relative to the roof after 254
mm plate displacement mm plate displacement
10° pitch (blue: 25° roll; green: 45° roll; red: 65° roll) 10° pitch (blue: 25° roll; green: 45° roll; red: 65° roll)
In order to evaluate roof strength and the connection between the A‐pillars, 3 different scenarios have been
investigated. High Strength Steel was used, a box beam was developed, and finally a combination of both
approaches was implemented.
Martensitic High Strength Steel
The first improvement method used was High Strength Steel (HSS) for selected parts of the roof. For this
study, Martensitic HSS with 1250 MPa yield strength and 1520 MPa tensile strength was used. This type of steel
is commonly used in the automotive industry for door and cross car beams in order to reduce intrusions into
the passenger compartment. Advancements in manufacturing techniques made it possible to form and bend
HSS into various component shapes. In this case, the steel is designed as sheet metal that has to be pressed
and formed. The material was applied to all components of the roof shown in Fig. 10: the roof header (green),
the A‐pillar inner layer (red) and the roof rail (blue).
Fig. 10. Parts to which the HSS was applied
Similar to the original model, the previously selected platen angles were performed with the material
upgrade. The maximum resistance forces on the platen angles within 127 mm of displacement are shown in
Fig. 11. Both curves for the HSS solution show comparable behavior as the baseline model. For constant roll
angles, a higher pitch angle reduces the maximum force. The cases with 55° roll angle were still strongest
compared to other roll angles.
80000
60000
40000
10° Pitch 20000
5° Pitch 0
15 25 35 45 55 65
Roll Angle
Fig. 11. Trend of resistance forces for all simulated load cases with upgraded Material
20000
30000
40000
50000
60000
15 25 35 45 55 65
No
rma
l F
orc
e [
N]
Roll Angle [°]
10° Pitch HSS
5° Pitch HSS
10° Pitch baseline
5° Pitch baseline
IRC-13-42 IRCOBI Conference 2013
- 386 -
Tables IV and V show the new SWRs for the FE‐model with upgraded material for the 5° and 10° pitch angles,
respectively. The improvements in percentage over the baseline model are also listed in both tables. The
material upgrade did not help all load cases evenly. However, the maximum improvement was 18.4% for the
load case with the 65° roll angle and 10° pitch angle. Additionally, the vehicle seemed to benefit more from the
material upgrade if it was loaded under the higher pitch angle. This loading applies more loads on the
reinforced components while for low pitch angles, the B‐pillar and other structural components in the rear of
the car contribute more to the plate motion resistance.
Additionally, the lateral structural displacement on the opposite side of the loading plate and its difference
with the original model are shown in Table IV and V. The additional lateral shifting of the whole structure is
expected since the stronger roof header transfers additional loads to the opposite side of the roof structure.
TABLE IV
STRENGTH‐TO‐WEIGHT RATIO (SWR) AND FAR SIDE SHIFTING AND ACCORDING DIFFERENCES OF MATERIAL UPGRADED MODEL TO
BASELINE MODEL FOR CASES WITH 5° PITCH
Relative Far side shifting Difference to
[mm] baseline [mm]
1.4 5.5
16.0 7.34
36.2 17.4
55.0 5.5
91.3 12.3
134.8 11.7
STRENGTH‐TO‐WEIGHT RATIO (SWR) AND FAR SIDE SHIFTING AND ACCORDING DIFFERENCES OF MATERIAL UPGRADED MODEL TO
BASELINE MODEL FOR CASES WITH 10° PITCH
SWR Relative Far side shifting Difference to
improvement [%] [mm] baseline [mm]
1.85 4.57 9.4 12.6
2.04 16.61 17.3 5.7
2.07 12.36 37.2 8.2
2.48 12.03 51.3 5.5
2.59 12.50 87.7 5.1
2.44 18.39 123.5 8.8
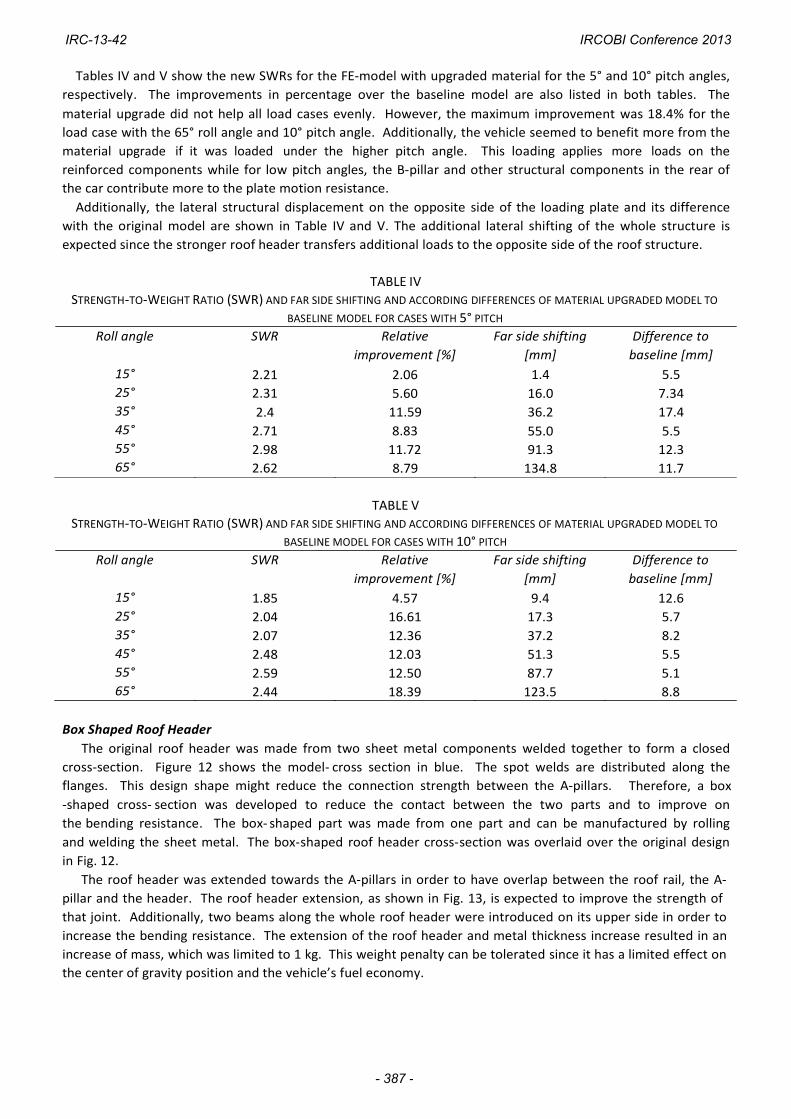
Box Shaped Roof Header
The original roof header was made from two sheet metal components welded together to form a closed
cross‐section. Figure 12 shows the model‐ cross section in blue. The spot welds are distributed along the
flanges. This design shape might reduce the connection strength between the A‐pillars.
‐shaped cross‐ section was developed to reduce the contact between the two parts and to improve on
the bending resistance. The box‐ shaped part was made from one part and can be manufactured by rolling
and welding the sheet metal. The box‐shaped roof header cross‐section was overlaid over the original design
in Fig. 12.
The roof header was extended towards the A‐pillars in order to have overlap between the roof rail, the A‐
pillar and the header. The roof header extension, as shown in Fig. 13, is expected to improve the strength of
that joint. Additionally, two beams along the whole roof header were introduced on its upper side in order to
increase the bending resistance. The extension of the roof header and metal thickness increase resulted in an
increase of mass, which was limited to 1 kg. This weight penalty can be tolerated since it has a limited effect on
the center of gravity position and the vehicle’s fuel economy.
Therefore, a box
Roll angle
15°
25°
35°
45°
55°
65°
SWR
2.21
2.31
2.4
2.71
2.98
2.62
improvement [%]
2.06
5.60
11.59
8.83
11.72
8.79
TABLE V
Roll angle
15°
25°
35°
45°
55°
65°
IRC-13-42 IRCOBI Conference 2013
- 387 -
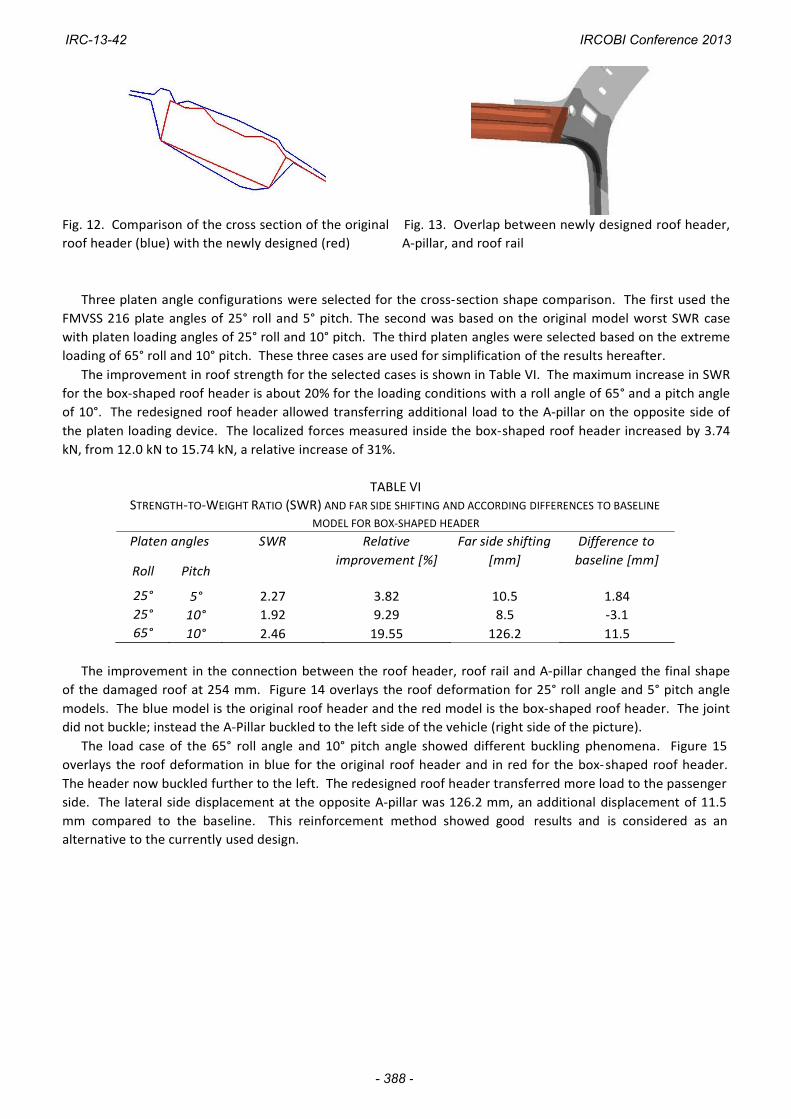
Fig. 12. Comparison of the cross section of the original Fig. 13. Overlap between newly designed roof header,
roof header (blue) with the newly designed (red) A‐pillar, and roof rail
Three platen angle configurations were selected for the cross‐section shape comparison. The first used the
FMVSS 216 plate angles of 25° roll and 5° pitch. The second was based on the original model worst SWR case
with platen loading angles of 25° roll and 10° pitch. The third platen angles were selected based on the extreme
loading of 65° roll and 10° pitch. These three cases are used for simplification of the results hereafter.
The improvement in roof strength for the selected cases is shown in Table VI. The maximum increase in SWR
for the box‐shaped roof header is about 20% for the loading conditions with a roll angle of 65° and a pitch angle
of 10°. The redesigned roof header allowed transferring additional load to the A‐pillar on the opposite side of
the platen loading device. The localized forces measured inside the box‐shaped roof header increased by 3.74
kN, from 12.0 kN to 15.74 kN, a relative increase of 31%.
TABLE VI
STRENGTH‐TO‐WEIGHT RATIO (SWR) AND FAR SIDE SHIFTING AND ACCORDING DIFFERENCES TO BASELINE
MODEL FOR BOX‐SHAPED HEADER
Platen angles SWR Relative Far side shifting Difference to
improvement [%] [mm] baseline [mm]
2.27 3.82 10.5 1.84
1.92 9.29 8.5 ‐3.1
2.46 19.55 126.2 11.5
The improvement in the connection between the roof header, roof rail and A‐pillar changed the final shape
of the damaged roof at 254 mm. Figure 14 overlays the roof deformation for 25° roll angle and 5° pitch angle
models. The blue model is the original roof header and the red model is the box‐shaped roof header. The joint
did not buckle; instead the A‐Pillar buckled to the left side of the vehicle (right side of the picture).
The load case of the 65° roll angle and 10° pitch angle showed different buckling phenomena. Figure 15
overlays the roof deformation in blue for the original roof header and in red for the box‐shaped roof header.
The header now buckled further to the left. The redesigned roof header transferred more load to the passenger
side. The lateral side displacement at the opposite A‐pillar was 126.2 mm, an additional displacement of 11.5
mm compared to the baseline. This reinforcement method showed good results and is considered as an
alternative to the currently used design.
Roll
25°
25°
65°
Pitch
5°
10°
10°
IRC-13-42 IRCOBI Conference 2013
- 388 -
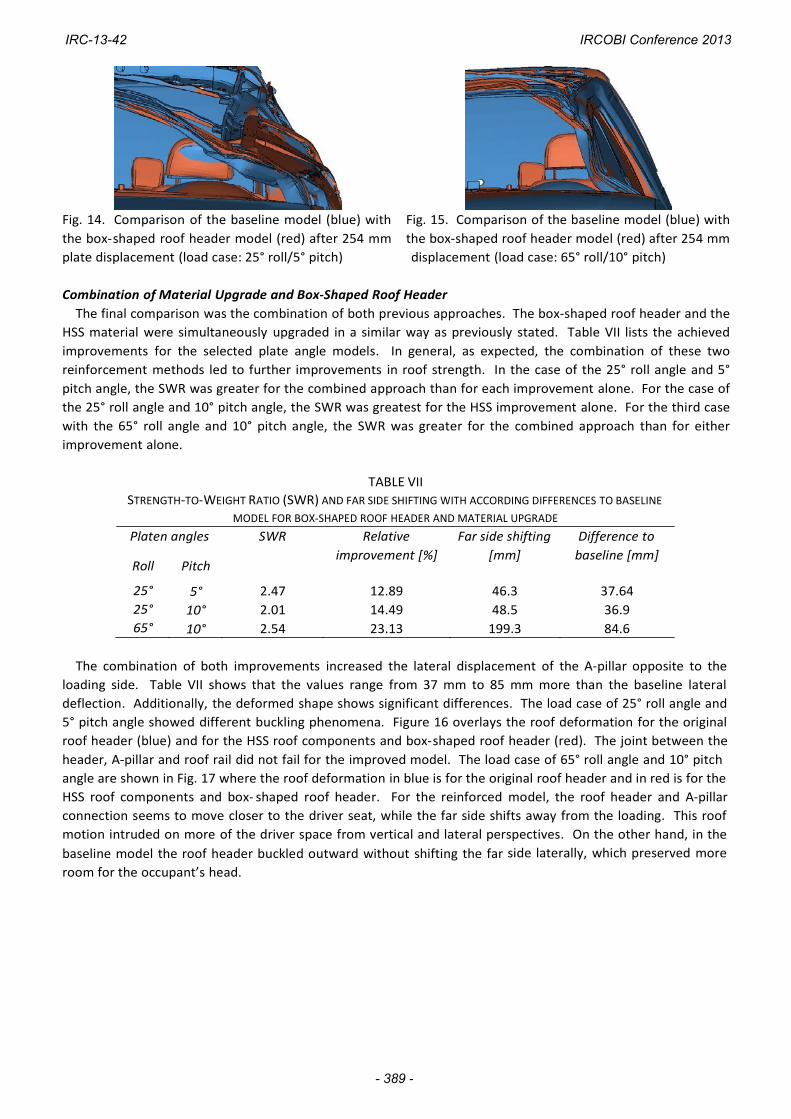
Fig. 14. Comparison of the baseline model (blue) with Fig. 15. Comparison of the baseline model (blue) with
the box‐shaped roof header model (red) after 254 mm the box‐shaped roof header model (red) after 254 mm
plate displacement (load case: 25° roll/5° pitch) displacement (load case: 65° roll/10° pitch)
Combination of Material Upgrade and Box‐Shaped Roof Header
The final comparison was the combination of both previous approaches. The box‐shaped roof header and the
HSS material were simultaneously upgraded in a similar way as previously stated. Table VII lists the achieved
improvements for the selected plate angle models. In general, as expected, the combination of these two
reinforcement methods led to further improvements in roof strength. In the case of the 25° roll angle and 5°
pitch angle, the SWR was greater for the combined approach than for each improvement alone. For the case of
the 25° roll angle and 10° pitch angle, the SWR was greatest for the HSS improvement alone. For the third case
with the 65° roll angle and 10° pitch angle, the SWR was greater for the combined approach than for either
improvement alone.
TABLE VII
STRENGTH‐TO‐WEIGHT RATIO (SWR) AND FAR SIDE SHIFTING WITH ACCORDING DIFFERENCES TO BASELINE
MODEL FOR BOX‐SHAPED ROOF HEADER AND MATERIAL UPGRADE
Platen angles SWR Relative Far side shifting Difference to
improvement [%] [mm] baseline [mm]
2.47 12.89 46.3 37.64
2.01 14.49 48.5 36.9
2.54 23.13 199.3 84.6
The combination of both improvements increased the lateral displacement of the A‐pillar opposite to the
loading side. Table VII shows that the values range from 37 mm to 85 mm more than the baseline lateral
deflection. Additionally, the deformed shape shows significant differences. The load case of 25° roll angle and
5° pitch angle showed different buckling phenomena. Figure 16 overlays the roof deformation for the original
roof header (blue) and for the HSS roof components and box‐shaped roof header (red). The joint between the
header, A‐pillar and roof rail did not fail for the improved model. The load case of 65° roll angle and 10° pitch
angle are shown in Fig. 17 where the roof deformation in blue is for the original roof header and in red is for the
HSS roof components and box‐ shaped roof header. For the reinforced model, the roof header and A‐pillar
connection seems to move closer to the driver seat, while the far side shifts away from the loading. This roof
motion intruded on more of the driver space from vertical and lateral perspectives. On the other hand, in the
baseline model the roof header buckled outward without shifting the far side laterally, which preserved more
room for the occupant’s head.
Roll
25°
25°
65°
Pitch
5°
10°
10°
IRC-13-42 IRCOBI Conference 2013
- 389 -
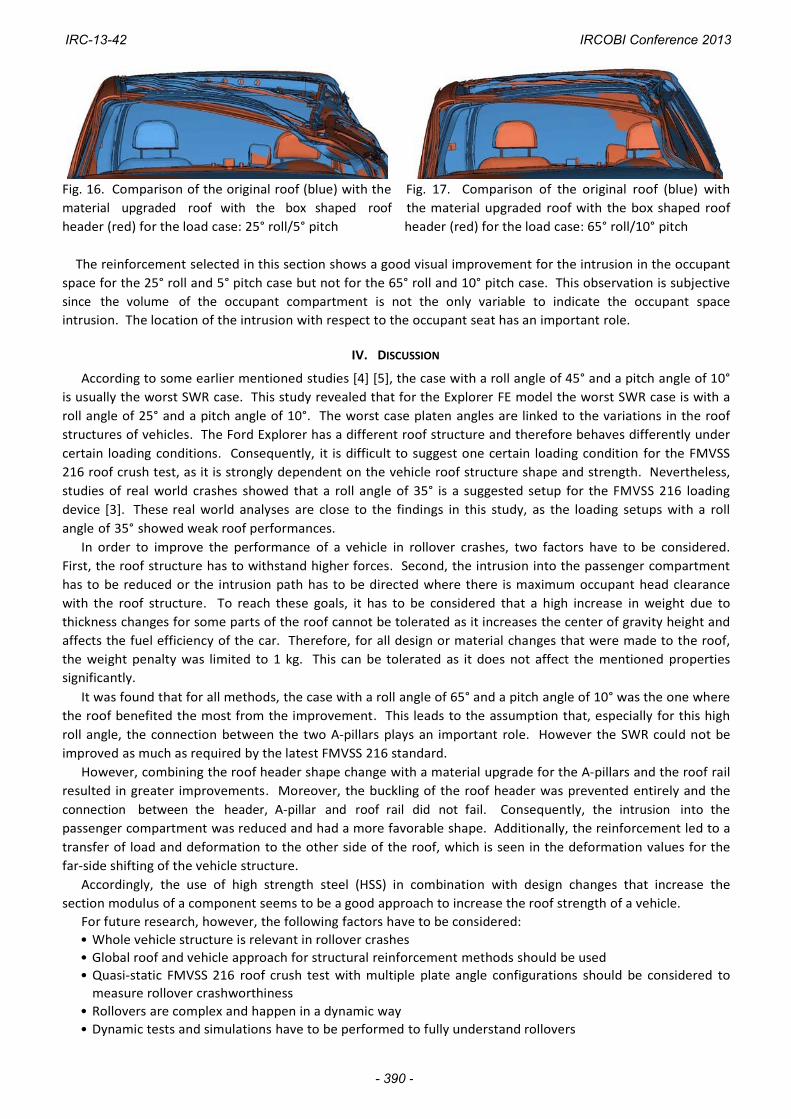
Fig. 16. Comparison of the original roof (blue) with the Fig. 17. Comparison of the original roof (blue) with
material upgraded roof with the box shaped roof the material upgraded roof with the box shaped roof
header (red) for the load case: 25° roll/5° pitch header (red) for the load case: 65° roll/10° pitch
The reinforcement selected in this section shows a good visual improvement for the intrusion in the occupant
space for the 25° roll and 5° pitch case but not for the 65° roll and 10° pitch case. This observation is subjective
since the volume of the occupant compartment is not the only variable to indicate the occupant space
intrusion. The location of the intrusion with respect to the occupant seat has an important role.
IV. DISCUSSION
According to some earlier mentioned studies [4] [5], the case with a roll angle of 45° and a pitch angle of 10°
is usually the worst SWR case. This study revealed that for the Explorer FE model the worst SWR case is with a
roll angle of 25° and a pitch angle of 10°. The worst case platen angles are linked to the variations in the roof
structures of vehicles. The Ford Explorer has a different roof structure and therefore behaves differently under
certain loading conditions. Consequently, it is difficult to suggest one certain loading condition for the FMVSS
216 roof crush test, as it is strongly dependent on the vehicle roof structure shape and strength. Nevertheless,
studies of real world crashes showed that a roll angle of 35° is a suggested setup for the FMVSS 216 loading
device [3]. These real world analyses are close to the findings in this study, as the loading setups with a roll
angle of 35° showed weak roof performances.
In order to improve the performance of a vehicle in rollover crashes, two factors have to be considered.
First, the roof structure has to withstand higher forces. Second, the intrusion into the passenger compartment
has to be reduced or the intrusion path has to be directed where there is maximum occupant head clearance
with the roof structure. To reach these goals, it has to be considered that a high increase in weight due to
thickness changes for some parts of the roof cannot be tolerated as it increases the center of gravity height and
affects the fuel efficiency of the car. Therefore, for all design or material changes that were made to the roof,
the weight penalty was limited to 1 kg. This can be tolerated as it does not affect the mentioned properties
significantly.
It was found that for all methods, the case with a roll angle of 65° and a pitch angle of 10° was the one where
the roof benefited the most from the improvement. This leads to the assumption that, especially for this high
roll angle, the connection between the two A‐pillars plays an important role. However the SWR could not be
improved as much as required by the latest FMVSS 216 standard.
However, combining the roof header shape change with a material upgrade for the A‐pillars and the roof rail
resulted in greater improvements. Moreover, the buckling of the roof header was prevented entirely and the
connection between the header, A‐pillar and roof rail did not fail. Consequently, the intrusion into the
passenger compartment was reduced and had a more favorable shape. Additionally, the reinforcement led to a
transfer of load and deformation to the other side of the roof, which is seen in the deformation values for the
far‐side shifting of the vehicle structure.
Accordingly, the use of high strength steel (HSS) in combination with design changes that increase the
section modulus of a component seems to be a good approach to increase the roof strength of a vehicle.
For future research, however, the following factors have to be considered:
• Whole vehicle structure is relevant in rollover crashes
• Global roof and vehicle approach for structural reinforcement methods should be used
• Quasi‐static FMVSS 216 roof crush test with multiple plate angle configurations should be considered to
measure rollover crashworthiness
• Rollovers are complex and happen in a dynamic way
• Dynamic tests and simulations have to be performed to fully understand rollovers
IRC-13-42 IRCOBI Conference 2013
- 390 -
V. CONCLUSIONS
When the Ford Explorer FE model was loaded by a platen as in the FMVSS 216 test, pitch angle increases
from 5o to 10
o resulted in strength‐to‐weight ratio (SWR) decreases for all roll angles, 15
o to 65
o. The worst case
scenario was the case with a platen angle of 25° roll and 10° pitch.
Once the connection between the A‐pillars was improved by a redesigned header, the SWR increased for
high roll angles. The combination of a redesigned roof header and the use of HSS led to the highest
improvements ranging from 12.9% up to 23.1% in SWR. This study has shown that improving the connection
between the A‐pillars can lead to some improvements in roof strength, especially for the loading cases with
high roll angles.
VI. REFERENCES
[1] National Highway Traffic Safety Administration (NHTSA), safercar.gov, US Department of Transportation,
2010. [Online]. Available: http://www.safercar.gov/Rollover. [Zugriff am 10th August 2012].
[2] National Highway Traffic Safety Administration (NHTSA), Laboratory Test Procedure for FMVSS No. 216,
Roof Crush Resistance, U.S. Department of Transportation, Washington, DC, 2009.
[3] Nash CE and Friedman D, Advanced roof design for rollover protection, 17th
Proceedings of the International
Technical Conference on the Enhanced Safety of Vehicles, 2001.
[4] Mao M, Chirwa EC, Chen T and Latchford J, Static and dynamic roof crush simulation using LS‐
DYNA3D, International Journal of Crashworthiness, 9(5):495‐504, 2004.
[5] Chirwa EC, Peng Q, Yang J and Matsika E, Mechanics of the double‐sided roof crush as a function of
heredity structural design and induced input parameters, Annual Meeting of the Transportation Research
Board, 2012.
[6] National Highway Traffic Safety Administration (NHTSA), Laboratory Test Procedure for FMVSS No. 216,
Roof Crush Resistance, US Department of Transportation, Washington, DC, 1989.
[7] National Crash Analysis Center, Finite Element Model Archive, 2007. [Online]. Available:
http://www.ncac.gwu.edu/vml/models.html.
[8] Transportation Research Center Inc., 2002 Ford Explorer Roof Crush Research with 5° Pitch, 25° Roll TRC
Inc. Test Number F030122, Technical Report, Transportation Research Center Inc., East Liberty, OH, 2003.
[9] Transportation Research Center Inc., 2002 Ford Explorer Roof Crush Research with 10° Pitch, 45° Roll TRC
Inc. Test Number F030129, Technical Report, Transportation Research Center Inc., East Liberty, OH, 2003.
[10] Ray M, Mongiardini M, Atahan A, Plaxico C and Anghileri M, Recommended Procedures for Verification
and Validation of Computer Simulations used for Roadside Safety Applications, NCHRP Project 22‐24,
Revision 1.3, March 2009.
IRC-13-42 IRCOBI Conference 2013
- 391 -