Embed Size (px)
Citation preview
ARL-TR-9121 ● DEC 2020
Influence of Dynamic Multiaxial Transverse Loading on Ultra High Molecular Weight Polyethylene (UHMWPE) Dyneema SK76 Single Fiber Failure by Frank Thomas, Subramani Sockalingam, Stephen L Alexander, and Tusit Weerasooriya
Approved for public release; distribution is unlimited.
NOTICES
Disclaimers
The findings in this report are not to be construed as an official Department of the Army position unless so designated by other authorized documents.
Citation of manufacturer’s or trade names does not constitute an official endorsement or approval of the use thereof.
Destroy this report when it is no longer needed. Do not return it to the originator.
ARL-TR-9121 ● DEC 2020
Influence of Dynamic Multiaxial Transverse Loading on Ultra High Molecular Weight Polyethylene (UHMWPE) Dyneema SK76 Single Fiber Failure Frank Thomas and Subramani Sockalingam Department of Mechanical Engineering, University of South Carolina Stephen L Alexander SURVICE Engineering Company Tusit Weerasooriya Weapons and Materials Research Directorate, DEVCOM Army Research Laboratory Approved for public release; distribution is unlimited.
ii
REPORT DOCUMENTATION PAGE Form Approved OMB No. 0704-0188
Public reporting burden for this collection of information is estimated to average 1 hour per response, including the time for reviewing instructions, searching existing data sources, gathering and maintaining the data needed, and completing and reviewing the collection information. Send comments regarding this burden estimate or any other aspect of this collection of information, including suggestions for reducing the burden, to Department of Defense, Washington Headquarters Services, Directorate for Information Operations and Reports (0704-0188), 1215 Jefferson Davis Highway, Suite 1204, Arlington, VA 22202-4302. Respondents should be aware that notwithstanding any other provision of law, no person shall be subject to any penalty for failing to comply with a collection of information if it does not display a currently valid OMB control number. PLEASE DO NOT RETURN YOUR FORM TO THE ABOVE ADDRESS.
1. REPORT DATE (DD-MM-YYYY)
December 2020 2. REPORT TYPE
Technical Report 3. DATES COVERED (From - To)
January 2018–September 2020 4. TITLE AND SUBTITLE
Influence of Dynamic Multiaxial Transverse Loading on Ultra High Molecular Weight Polyethylene (UHMWPE) Dyneema SK76 Single Fiber Failure
5a. CONTRACT NUMBER
W911NF-18-2-0102, W911NF-20-2-0231 5b. GRANT NUMBER
5c. PROGRAM ELEMENT NUMBER
6. AUTHOR(S)
Frank Thomas, Subramani Sockalingam, Stephen L Alexander, and Tusit Weerasooriya
5d. PROJECT NUMBER
5e. TASK NUMBER
5f. WORK UNIT NUMBER
7. PERFORMING ORGANIZATION NAME(S) AND ADDRESS(ES)
DEVCOM Army Research Laboratory ATTN: FCDD-RLW-PB Aberdeen Proving Ground, MD 21005
8. PERFORMING ORGANIZATION REPORT NUMBER
ARL-TR-9121
9. SPONSORING/MONITORING AGENCY NAME(S) AND ADDRESS(ES)
10. SPONSOR/MONITOR'S ACRONYM(S)
11. SPONSOR/MONITOR'S REPORT NUMBER(S)
12. DISTRIBUTION/AVAILABILITY STATEMENT
Approved for public release; distribution is unlimited. 13. SUPPLEMENTARY NOTES ORCID ID(s): Frank Thomas, 0000-0001-5622-3412; Subramani Sockalingam, 0000-0003-4335-2009; Tusit Weerasooriya, 0000-0003-3299-2166 14. ABSTRACT
A novel methodology for testing microscale single ballistic fibers under transverse impact to induce multiaxial loading is proposed and demonstrated using micron-scale (~18-µm diameter) Dyneema SK76. Fibers are directly gripped to load cells and directly impacted by varying cylindrical loading geometries: razor (~2 µm) to sharp (20 µm) to blunt (200 µm) in a modified Hopkinson bar at velocities of 10 and 20 m/s corresponding to nominal strain rates of 4000–6300 s–1. Compared to high-strain-rate uniaxial tensile loading, failure strain was reduced by 28%, 32%, and 58% for blunt, sharp, and razor indenters, respectively, at strain rates of 4000 s–1. At strain rates of 6300 s–1, reductions were 34%, 39%, and 61% for blunt, sharp, and razor indenters, respectively. Fiber failure surfaces indicate tensile-dominated failure under blunt loading, shear failure under razor loading, and mixed failure under sharp loading. Experiments are modeled in LS-DYNA using a user material model to incorporate nonlinear inelastic transverse compressive behavior. A failure criterion incorporating multiaxial loading effects is applied to predict fiber failure, showing good agreement to the experimental results. 15. SUBJECT TERMS
ballistic fibers; UHMWPE fibers; Dyneema SK76; UMAT; high strain rate loading; multiaxial failure criteria
16. SECURITY CLASSIFICATION OF: 17. LIMITATION OF ABSTRACT
UU
18. NUMBER OF PAGES
44
19a. NAME OF RESPONSIBLE PERSON
Tusit Weerasooriya a. REPORT
Unclassified b. ABSTRACT
Unclassified
c. THIS PAGE
Unclassified
19b. TELEPHONE NUMBER (Include area code)
410-652-9450 Standard Form 298 (Rev. 8/98)
Prescribed by ANSI Std. Z39.18
iii
Contents
List of Figures iv
List of Tables v
Preface vi
Acknowledgments vii
1. Introduction 1
2. Approach and Methodology 2
2.1 Experimental Setup 2
2.2 Modeling Setup 5
3. Analysis 7
3.1 Data Analysis 7
3.2 Model Analysis 10
4. Results and Discussion 12
4.1 Experimental Results 12
4.2 Modeling Results 18
5. Conclusions 23
6. References 25
Appendix. Strain Contours at Time of Failure for Simulations of Dyneema Fiber Transversely Impacted at 6300s–1 27
List of Symbols, Abbreviations, and Acronyms 32
Distribution List 33
iv
List of Figures
Fig. 1 Smith theory of transverse fiber impact ................................................ 1
Fig. 2 Schematic of experimental apparatus for single fiber transverse impact (top) and image of experimental fiber U-frame mount (bottom) .......... 3
Fig. 3 a) Nylon sleeve with indenter. b) Model output for sleeve displacement compared to displacement of incident bar end and strain pulse over the course of a standard test. Striker bar impacts at t = 0 ms and fiber failure occurs at approximately t = 0.7 ms. Compressive strain is shown as negative and is measured from the middle of the incident bar............................................................................................ 4
Fig. 4 a) Photograph of indenter geometries and microscope images of b) blunt, c) sharp, and d) razor indenter tips ............................................. 5
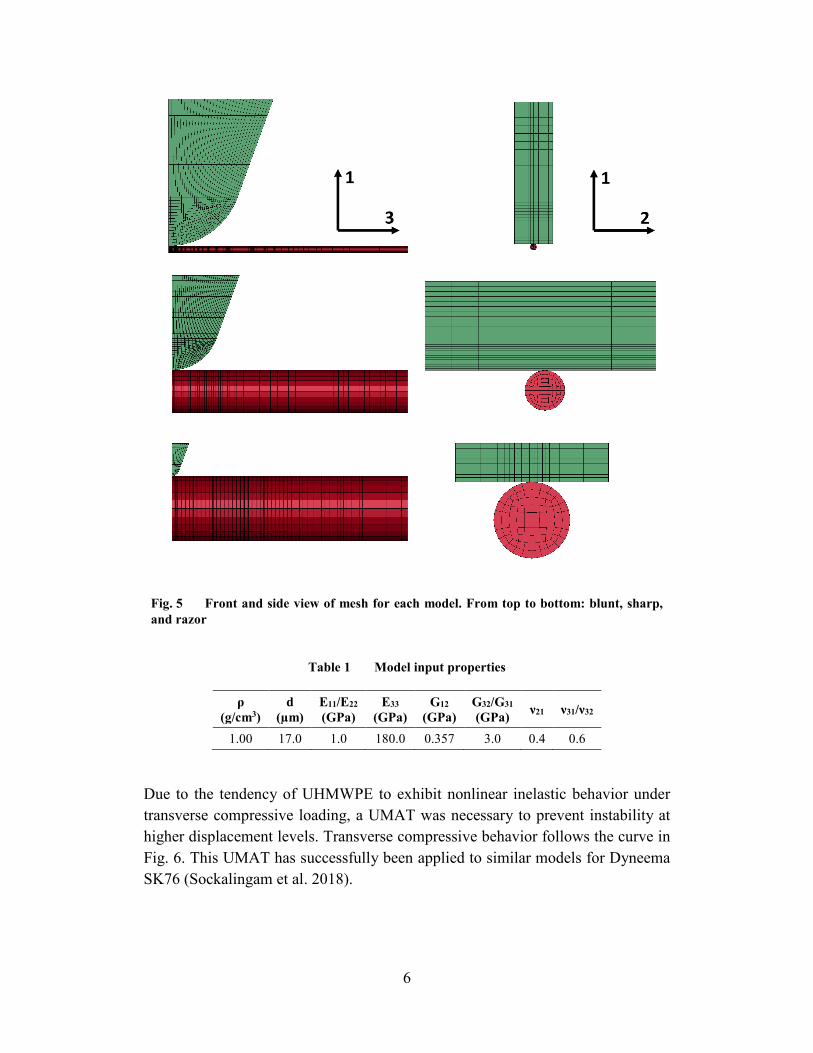
Fig. 5 Front and side view of mesh for each model. From top to bottom: blunt, sharp, and razor ........................................................................... 6
Fig. 6 UMAT behavior under transverse compression ................................... 7
Fig. 7 Representative load cell traces for a) 10-m/s impact velocity (3920–4180 s–1 approximate strain rate range) and b) 20-m/s impact velocity (6250–6400 s–1 approximate strain rate range) ....................... 8
Fig. 8 Experimental image analysis. Indenter diameter in each image is 1.0 mm. Examples are from 10-m/s impact velocity with blunt indenter. a) Progressive loading of single fiber. Images range from undeformed state (far left) to final ultimate tensile strain before failure (far right). b) Angle measurement in final frame before failure. c) Fiber motion post-failure. ..................................................................... 9
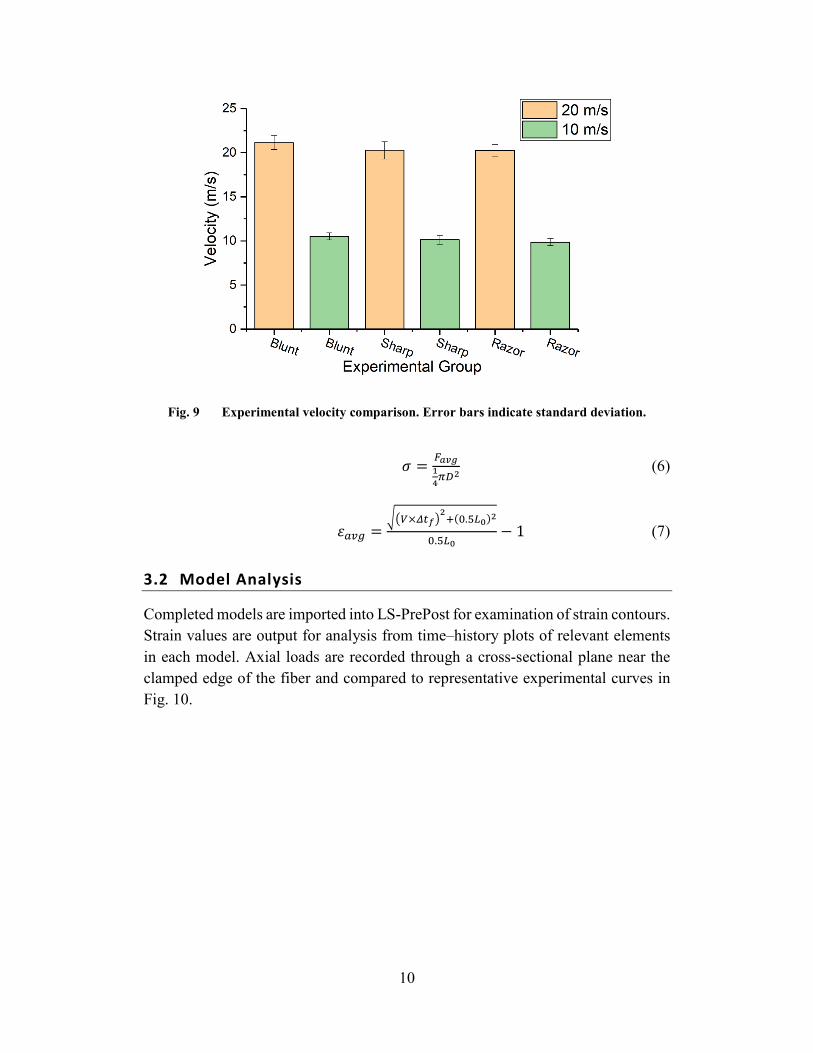
Fig. 9 Experimental velocity comparison. Error bars indicate standard deviation. ............................................................................................. 10
Fig. 10 Load-time curve comparison .............................................................. 11
Fig. 11 Average strength comparison. Error bars indicate 1 standard deviation. Uniaxial tension data are from Sanborn et al. ..................................... 12
Fig. 12 Comparison of average strain (εavg). Error bars indicate one standard deviation. Uniaxial loading data from Sanborn et al.. ........................ 12
Fig. 13 a) Stress–strain curves corresponding to transverse indentation experiments depicted in Fig. 7. b) Representative high-rate stress–strain curves from uniaxial tensile tests in Sanborn et al. ................... 14
Fig. 14 Strain as a function of failure angle. Uniaxial loading (horizontal lines) is from Sanborn et al. and QS transverse loading is from Hudspeth et al. Values in box are from high-rate transverse impact (current study).............................................................................................................. 16
v
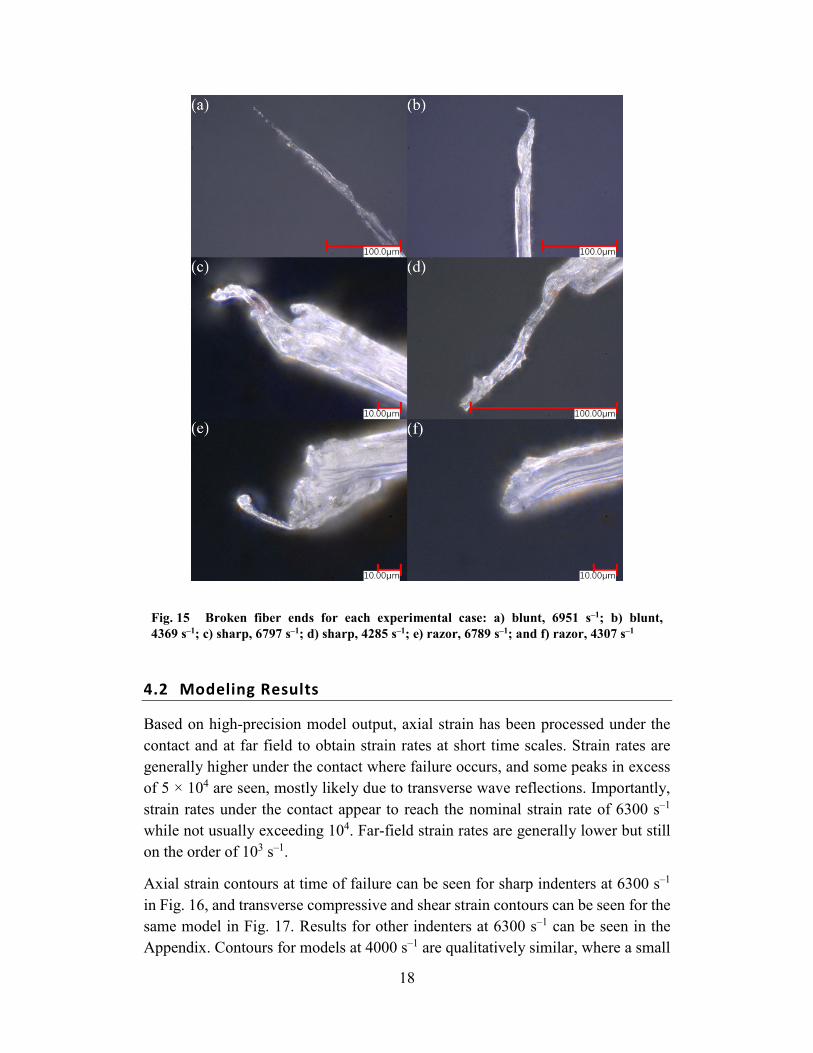
Fig. 15 Broken fiber ends for each experimental case: a) blunt, 6951 s–1; b) blunt, 4369 s–1; c) sharp, 6797 s–1; d) sharp, 4285 s–1; e) razor, 6789 s–1; and f) razor, 4307 s–1 ....................................................................... 18
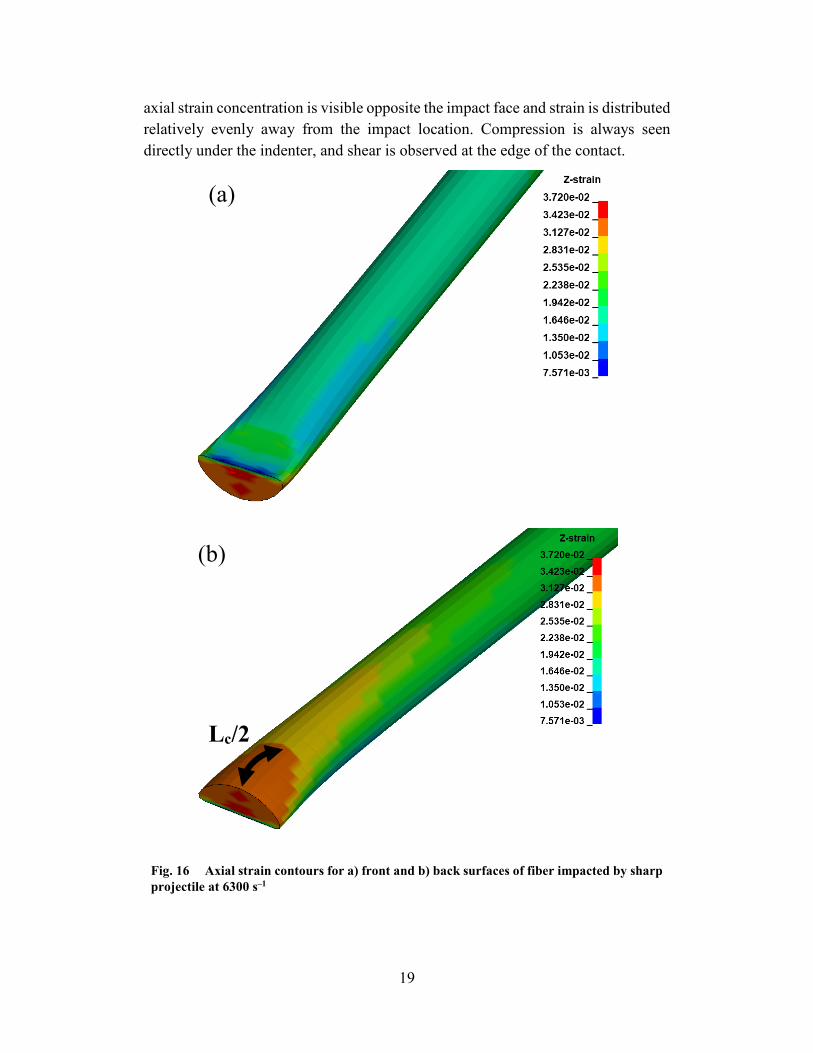
Fig. 16 Axial strain contours for a) front and b) back surfaces of fiber impacted by sharp projectile at 6300 s–1 ............................................. 19
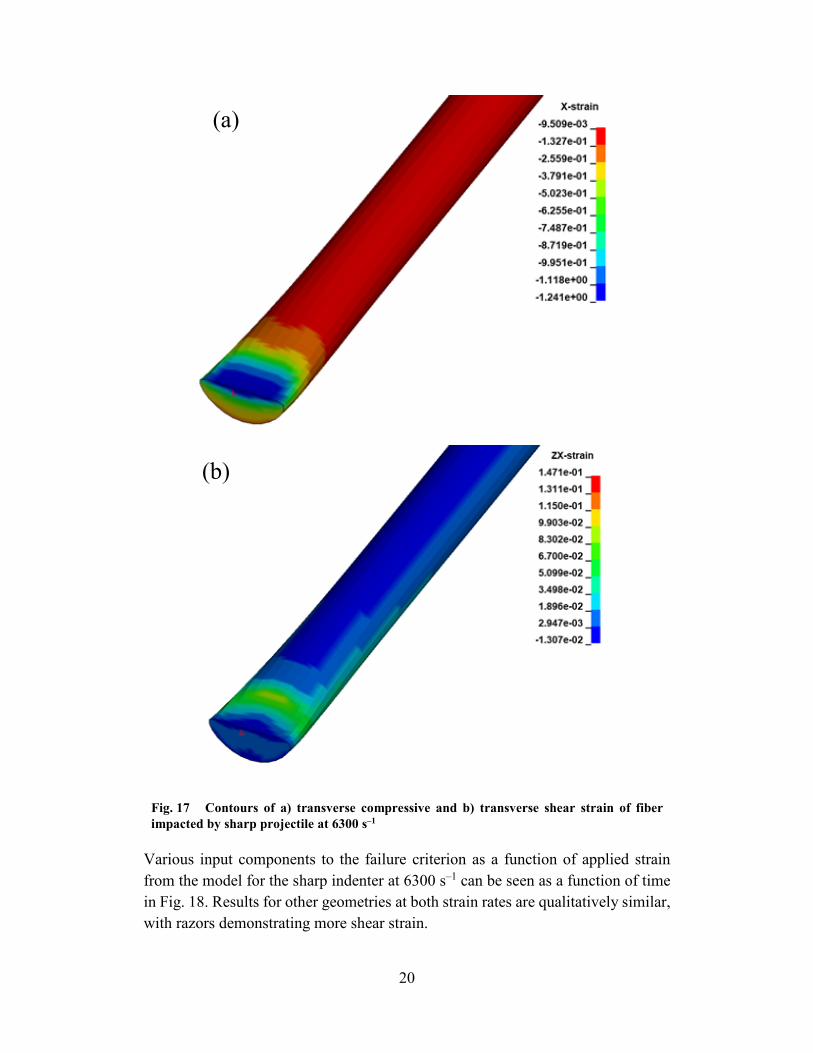
Fig. 17 Contours of a) transverse compressive and b) transverse shear strain of fiber impacted by sharp projectile at 6300 s–1 .................................... 20
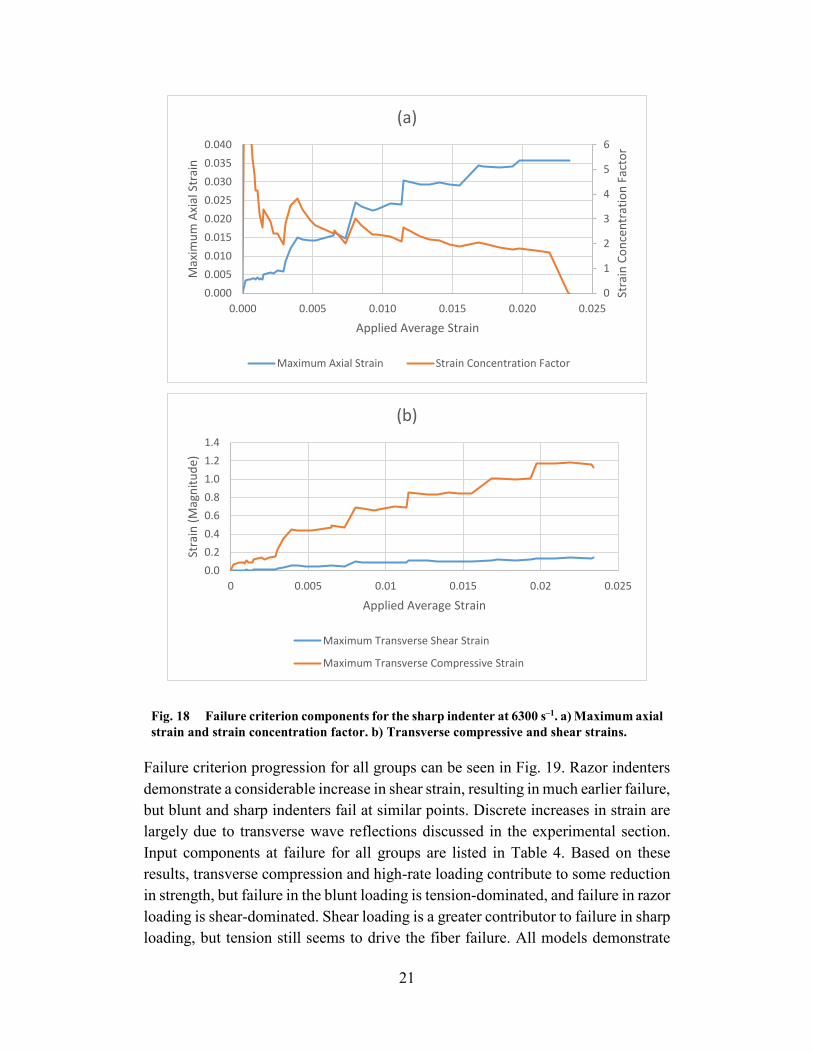
Fig. 18 Failure criterion components for the sharp indenter at 6300 s–1. a) Maximum axial strain and strain concentration factor. b) Transverse compressive and shear strains. ............................................................ 21
Fig. 19 Failure criterion plots for all test groups ............................................. 22
Fig. 20 Axial failure strain compared to model prediction ............................. 23
Fig. A-1 Axial strain contours for a) front and b) back surfaces of fiber impacted by blunt projectile at 6300 s–1 ............................................. 28
Fig. A-2 Axial strain contours for a) front and b) back surfaces of fiber impacted by razor projectile at 6300 s–1 ............................................. 29
Fig. A-3 Transverse compressive strain contours for a) blunt, b) sharp, and c) razor indenters at 6300 s–1 ................................................................... 30
Fig. A-4 Transverse shear strain contours for a) blunt, b) sharp, and c) razor indenters at 6300 s–1 ............................................................................ 31
List of Tables
Table 1 Model input properties .......................................................................... 6
Table 2 Experimental data summary ............................................................... 15
Table 3 Average and analytically determined properties. Transverse wave speeds are based on a nominal axial wave speed of 11,123 m/s......... 17
Table 4 Failure criterion inputs ........................................................................ 22
vi
Preface
This report is based on the master’s thesis by author Frank Thomas.1
A concise version of the content of this report was submitted to the Composites Part A journal. A revised manuscript based on the reviewers’ comments has been resubmitted and is currently under consideration for publication.
1 Thomas FD. Influence of dynamic multiaxial transverse loading on ultrahigh molecular weight polyethylene single fiber failure [master’'s thesis]. University of South Carolina; 2020.
vii
Acknowledgments
Research funding for the author Frank Thomas was sponsored by the Oak Ridge Institute for Science and Education, which is managed by Oak Ridge Associated Universities. Equipment, facilities, and training were provided by the US Army Combat Capabilities Development Command (DEVCOM) Army Research Laboratory at Aberdeen Proving Ground, Maryland. Assistance regarding test setup, component fabrication, and equipment operation by C Allan Gunnarsson is gratefully acknowledged. Preliminary experimentation for single fiber impact was performed by Mr Robert Bass of the University of South Carolina. The views and conclusions contained in this document are those of the authors and should not be interpreted as representing the official policies, either expressed or implied, of the DEVCOM Army Research Laboratory or the US Government. The US government is authorized to reproduce and distribute reprints for government purposes notwithstanding any copyright notation herein. The useful discussions provided by Drs Ulrich Heisserer, Harm van der Werff, and Mark Hazzard of DSM Dyneema are gratefully acknowledged.
1
1. Introduction
High-strength fiber materials such as ultra high molecular weight polyethylene (UHMWPE) are used as the load-bearing component of many ballistic defense systems such as woven fabrics and composite plates due to their superior performance and relatively low weight. Experiments have been performed to quantify material properties such as tensile modulus and various failure characteristics such as strength and ultimate tensile strain at various length scales and strain rates, ranging from quasi-static (QS) to high strain rate (HSR) (Russell et al. 2013; Sanborn et al. 2015). Other experiments have observed the effects of transverse loading on various aspects of failure such as residual tensile strength and strain concentration due to loading geometry (Hudspeth et al. 2015; Thomas et al. 2019). However, the interactions between these properties at HSRs are poorly understood due to a lack of repeatable methodology. Efforts have been made to test the performance of yarns under ballistic impact, but single-filament tests at such strain rates have not been performed (Song et al. 2011; Golovin and Phoenix 2016; Hudspeth et al. 2017; Phoenix et al. 2017).
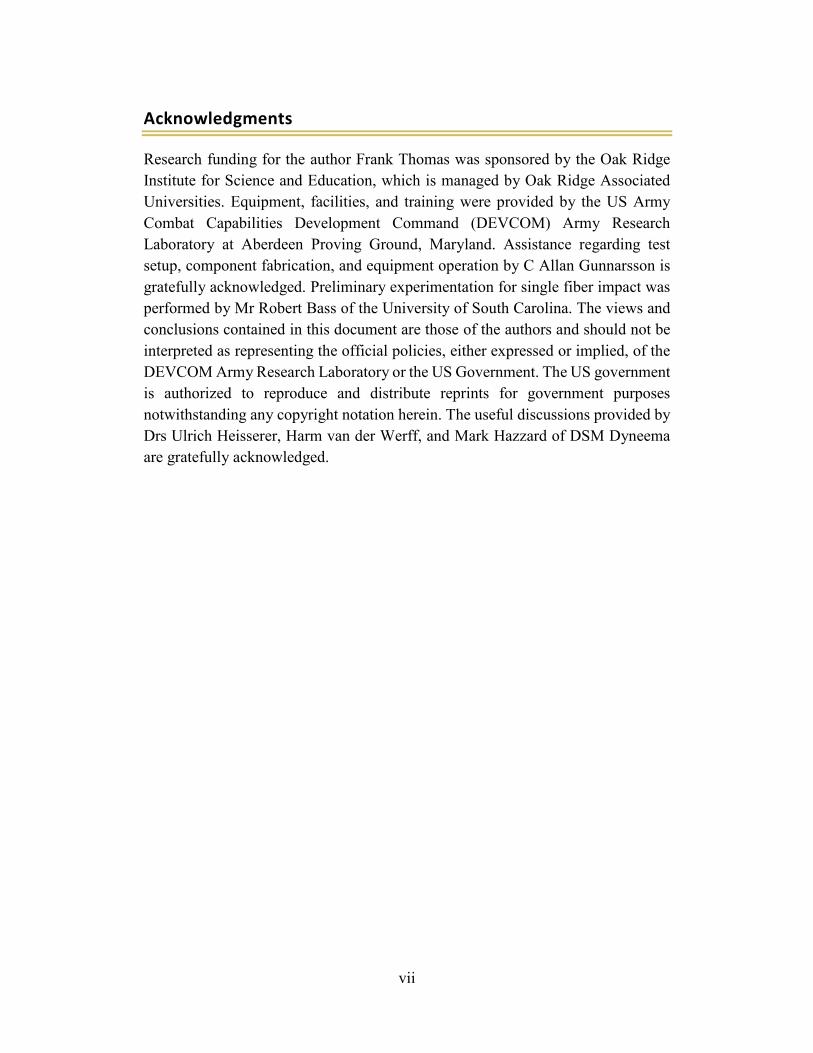
When a yarn or fiber under tension is impacted with a velocity V, axial and transverse waves propagate from the impact site at speeds c and cs, respectively (Cole et al. 1953; Smith et al. 1960). A schematic of this behavior can be seen in Fig. 1. Transverse waves are visible in the form of angular deflection, where the initial deflection angle is γ. Based on the works of Smith and Cole, approximations of c, cs, and γ can be calculated using Eqs. 1–3. For Dyneema SK76, with an approximate QS modulus of 120 GPa and density of 970 kg/m3, the axial wave speed is approximately 11,123 m/s (DSM 2010).
Fig. 1 Smith theory of transverse fiber impact
2
𝑐𝑐 = �𝐸𝐸𝜌𝜌 (1)
𝑐𝑐𝑠𝑠 = �𝑐𝑐2�13 (𝑉𝑉)
23 (2)
γ = tan−1 �2𝑉𝑉𝑐𝑐�1 3⁄
(3)
This study demonstrates a repeatable method for characterizing the effects of impacting geometry on single fiber failure strain and strength through HSR transverse impact onto Dyneema SK76 single fibers at intermediate velocities using a modified small-diameter Hopkinson bar. The experiments are then replicated as finite-element models in LS-DYNA using a user material model (UMAT; Sockalingam et al. 2015, 2018) to develop insights into the multiaxial strain components and mechanisms contributing to failure. These components are then used to predict the average strain at which failure initiates using a failure criterion previously demonstrated in literature.
2. Approach and Methodology
The experimental method is developed for transversely impacting microscale individual single fibers, and finite-element models are developed to replicate the experimental method, outputting strain component data for more detailed analysis.
2.1 Experimental Setup
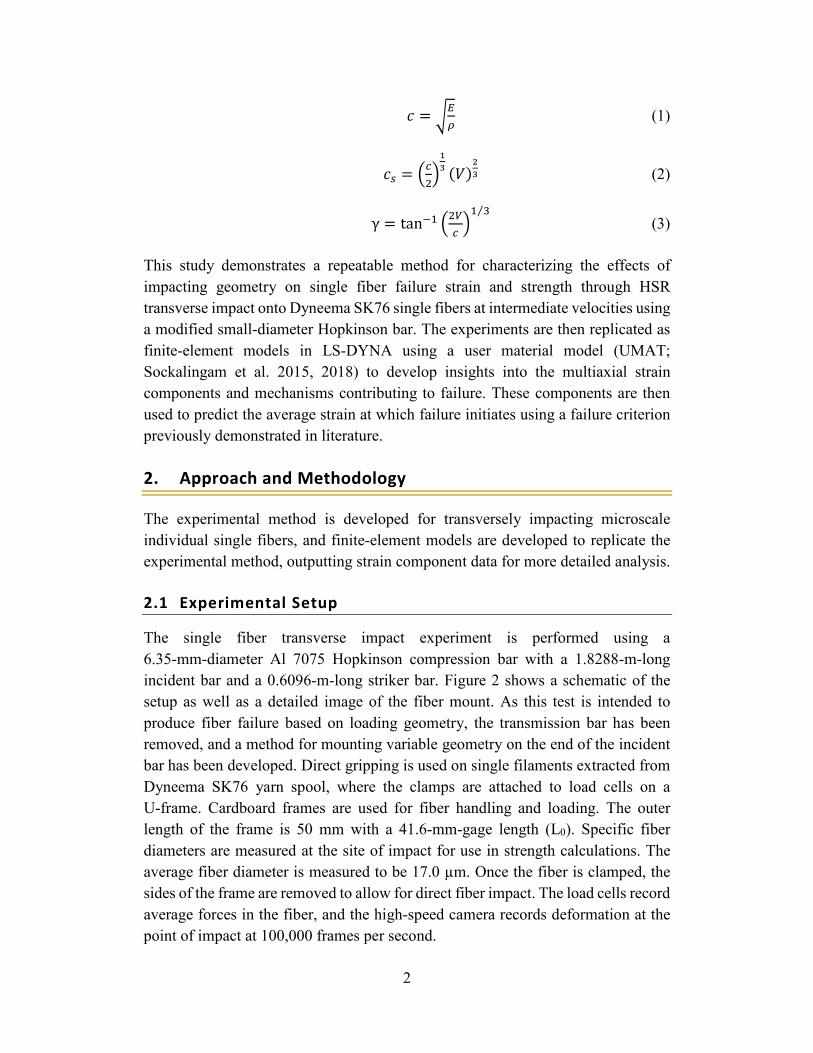
The single fiber transverse impact experiment is performed using a 6.35-mm-diameter Al 7075 Hopkinson compression bar with a 1.8288-m-long incident bar and a 0.6096-m-long striker bar. Figure 2 shows a schematic of the setup as well as a detailed image of the fiber mount. As this test is intended to produce fiber failure based on loading geometry, the transmission bar has been removed, and a method for mounting variable geometry on the end of the incident bar has been developed. Direct gripping is used on single filaments extracted from Dyneema SK76 yarn spool, where the clamps are attached to load cells on a U-frame. Cardboard frames are used for fiber handling and loading. The outer length of the frame is 50 mm with a 41.6-mm-gage length (L0). Specific fiber diameters are measured at the site of impact for use in strength calculations. The average fiber diameter is measured to be 17.0 µm. Once the fiber is clamped, the sides of the frame are removed to allow for direct fiber impact. The load cells record average forces in the fiber, and the high-speed camera records deformation at the point of impact at 100,000 frames per second.
3
Fig. 2 Schematic of experimental apparatus for single fiber transverse impact (top) and image of experimental fiber U-frame mount (bottom)
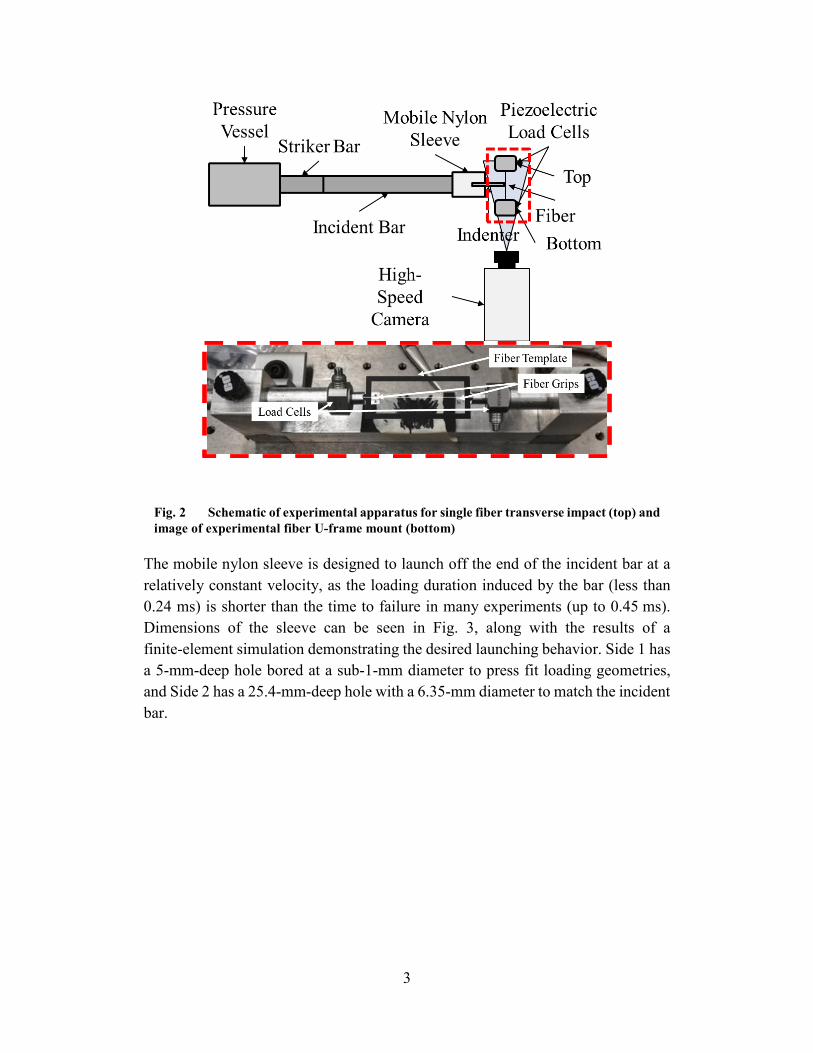
The mobile nylon sleeve is designed to launch off the end of the incident bar at a relatively constant velocity, as the loading duration induced by the bar (less than 0.24 ms) is shorter than the time to failure in many experiments (up to 0.45 ms). Dimensions of the sleeve can be seen in Fig. 3, along with the results of a finite-element simulation demonstrating the desired launching behavior. Side 1 has a 5-mm-deep hole bored at a sub-1-mm diameter to press fit loading geometries, and Side 2 has a 25.4-mm-deep hole with a 6.35-mm diameter to match the incident bar.
4
Fig. 3 a) Nylon sleeve with indenter. b) Model output for sleeve displacement compared to displacement of incident bar end and strain pulse over the course of a standard test. Striker bar impacts at t = 0 ms and fiber failure occurs at approximately t = 0.7 ms. Compressive strain is shown as negative and is measured from the middle of the incident bar.
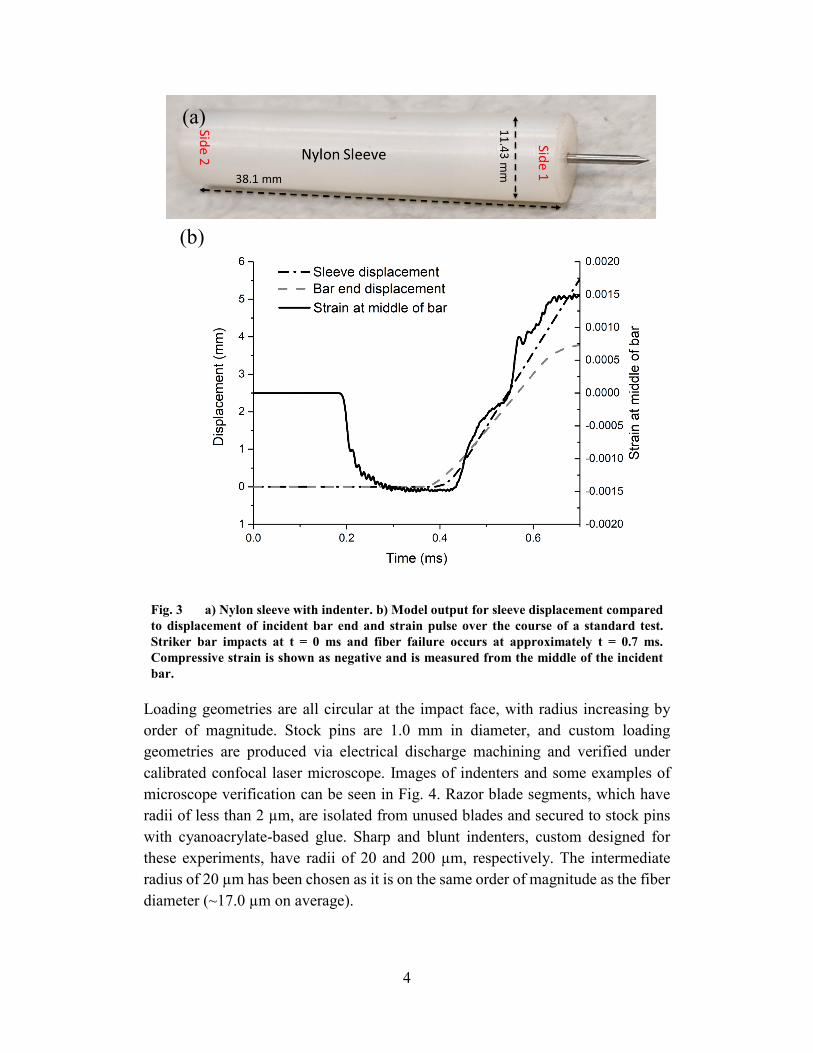
Loading geometries are all circular at the impact face, with radius increasing by order of magnitude. Stock pins are 1.0 mm in diameter, and custom loading geometries are produced via electrical discharge machining and verified under calibrated confocal laser microscope. Images of indenters and some examples of microscope verification can be seen in Fig. 4. Razor blade segments, which have radii of less than 2 µm, are isolated from unused blades and secured to stock pins with cyanoacrylate-based glue. Sharp and blunt indenters, custom designed for these experiments, have radii of 20 and 200 µm, respectively. The intermediate radius of 20 µm has been chosen as it is on the same order of magnitude as the fiber diameter (~17.0 µm on average).
(a)
(b)
5
Fig. 4 a) Photograph of indenter geometries and microscope images of b) blunt, c) sharp, and d) razor indenter tips
2.2 Modeling Setup
Meshes are produced of the fiber using a 17.0-µm diameter and each indenter. Selective refinement is performed to ensure strain concentrations are accurately captured at the impact site and prevent contact-based instability. Images of each model can be seen in Fig. 5. Models are run slightly longer than the average test duration for each group to ensure the full displacement is captured. Direction 1 is normal to the plane of motion, direction 2 is along the line of motion for the indenter, and direction 3 is parallel to the length of the fiber. Input properties for the model can be seen in Table 1. Due to rate-dependent modulus increase, E33 is increased to 180 GPa based on experimental estimations. A G32/G31 value of 3.0 GPa is used based on a sensitivity study that eliminated nonphysical behavior at other values.
(a) (c) (d) (b)
6
Fig. 5 Front and side view of mesh for each model. From top to bottom: blunt, sharp, and razor
Table 1 Model input properties
ρ (g/cm3)
d (µm)
E11/E22 (GPa)
E33 (GPa)
G12 (GPa)
G32/G31 (GPa) ν21 ν31/ν32
1.00 17.0 1.0 180.0 0.357 3.0 0.4 0.6
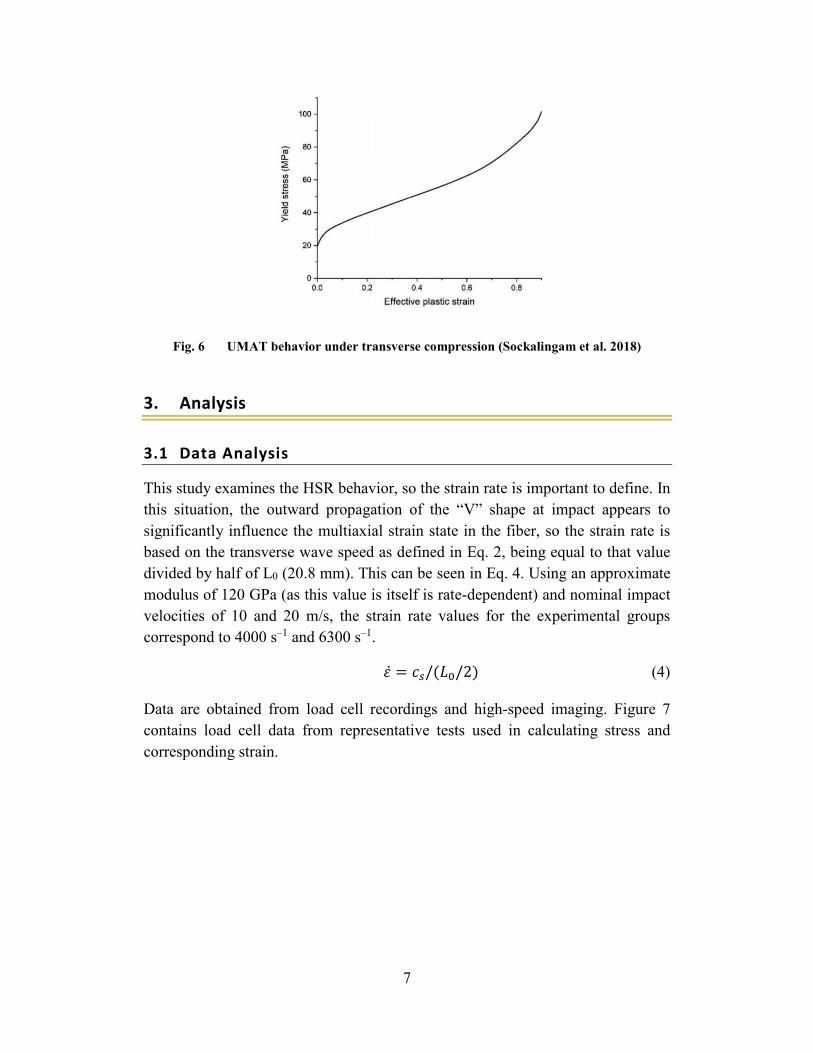
Due to the tendency of UHMWPE to exhibit nonlinear inelastic behavior under transverse compressive loading, a UMAT was necessary to prevent instability at higher displacement levels. Transverse compressive behavior follows the curve in Fig. 6. This UMAT has successfully been applied to similar models for Dyneema SK76 (Sockalingam et al. 2018).
7
Fig. 6 UMAT behavior under transverse compression (Sockalingam et al. 2018)
3. Analysis
3.1 Data Analysis
This study examines the HSR behavior, so the strain rate is important to define. In this situation, the outward propagation of the “V” shape at impact appears to significantly influence the multiaxial strain state in the fiber, so the strain rate is based on the transverse wave speed as defined in Eq. 2, being equal to that value divided by half of L0 (20.8 mm). This can be seen in Eq. 4. Using an approximate modulus of 120 GPa (as this value is itself is rate-dependent) and nominal impact velocities of 10 and 20 m/s, the strain rate values for the experimental groups correspond to 4000 s–1 and 6300 s–1.
𝜀𝜀̇ = 𝑐𝑐𝑠𝑠/(𝐿𝐿0/2) (4)
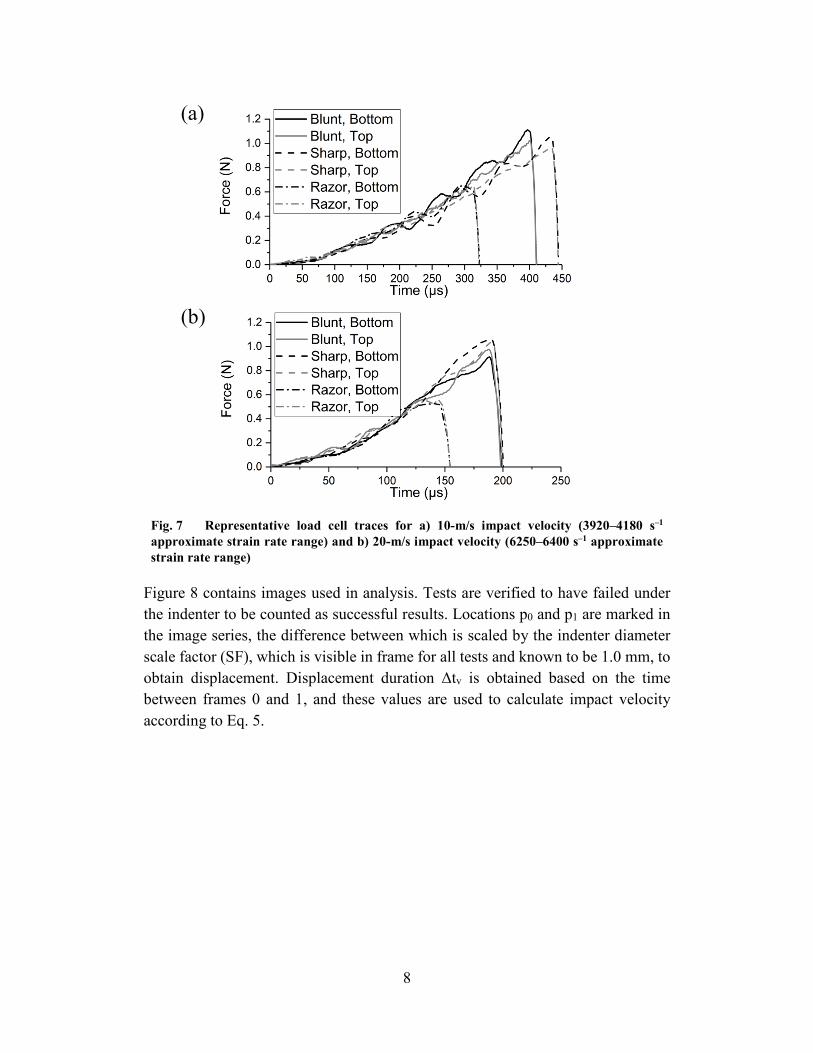
Data are obtained from load cell recordings and high-speed imaging. Figure 7 contains load cell data from representative tests used in calculating stress and corresponding strain.
8
Fig. 7 Representative load cell traces for a) 10-m/s impact velocity (3920–4180 s–1 approximate strain rate range) and b) 20-m/s impact velocity (6250–6400 s–1 approximate strain rate range)
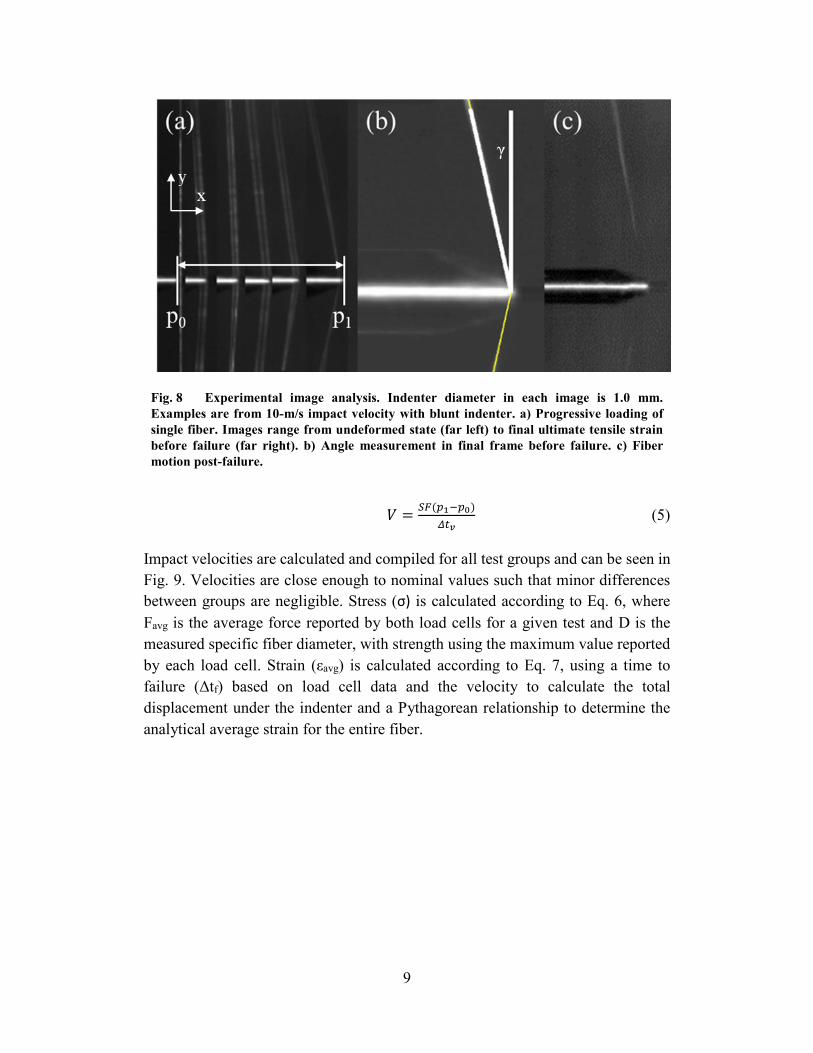
Figure 8 contains images used in analysis. Tests are verified to have failed under the indenter to be counted as successful results. Locations p0 and p1 are marked in the image series, the difference between which is scaled by the indenter diameter scale factor (SF), which is visible in frame for all tests and known to be 1.0 mm, to obtain displacement. Displacement duration Δtv is obtained based on the time between frames 0 and 1, and these values are used to calculate impact velocity according to Eq. 5.
(a)
(b)
9
Fig. 8 Experimental image analysis. Indenter diameter in each image is 1.0 mm. Examples are from 10-m/s impact velocity with blunt indenter. a) Progressive loading of single fiber. Images range from undeformed state (far left) to final ultimate tensile strain before failure (far right). b) Angle measurement in final frame before failure. c) Fiber motion post-failure.
𝑉𝑉 = 𝑆𝑆𝑆𝑆(𝑝𝑝1−𝑝𝑝0)𝛥𝛥𝛥𝛥𝑣𝑣
(5)
Impact velocities are calculated and compiled for all test groups and can be seen in Fig. 9. Velocities are close enough to nominal values such that minor differences between groups are negligible. Stress (σ) is calculated according to Eq. 6, where Favg is the average force reported by both load cells for a given test and D is the measured specific fiber diameter, with strength using the maximum value reported by each load cell. Strain (εavg) is calculated according to Eq. 7, using a time to failure (Δtf) based on load cell data and the velocity to calculate the total displacement under the indenter and a Pythagorean relationship to determine the analytical average strain for the entire fiber.
10
Fig. 9 Experimental velocity comparison. Error bars indicate standard deviation.
𝜎𝜎 = 𝑆𝑆𝑎𝑎𝑣𝑣𝑎𝑎14𝜋𝜋𝐷𝐷
2 (6)
𝜀𝜀𝑎𝑎𝑎𝑎𝑎𝑎 =��𝑉𝑉×𝛥𝛥𝛥𝛥𝑓𝑓�
2+(0.5𝐿𝐿0)2
0.5𝐿𝐿0− 1 (7)
3.2 Model Analysis
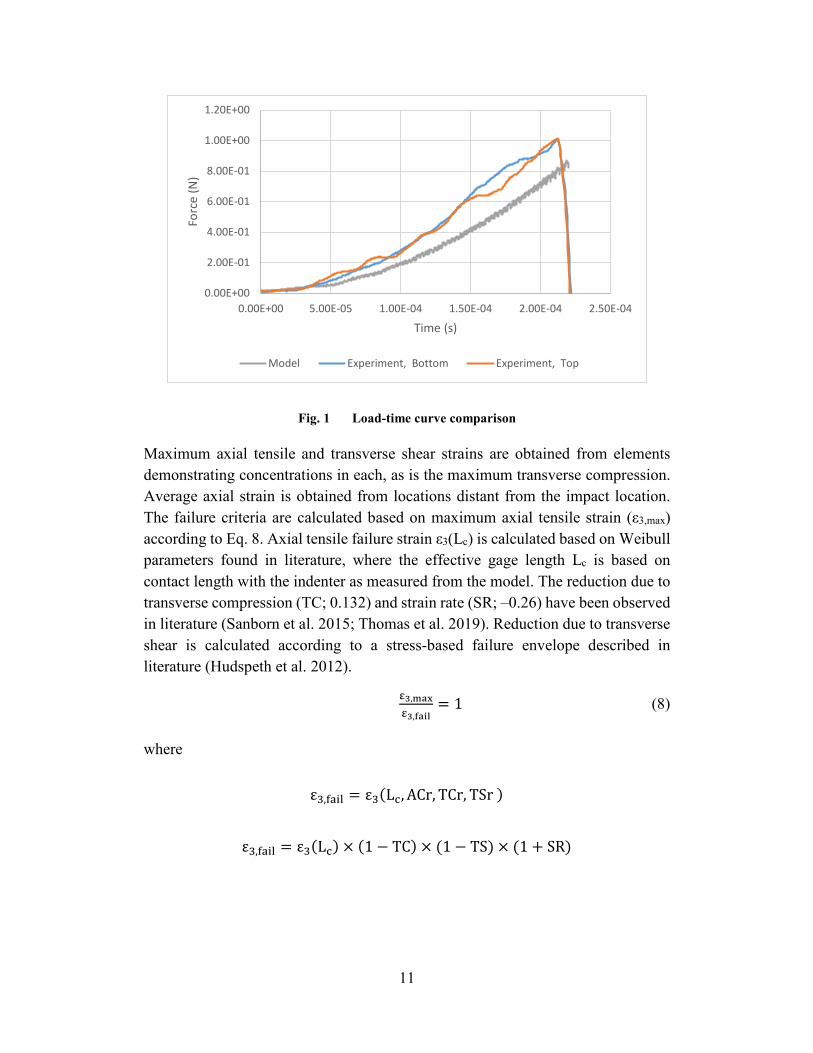
Completed models are imported into LS-PrePost for examination of strain contours. Strain values are output for analysis from time–history plots of relevant elements in each model. Axial loads are recorded through a cross-sectional plane near the clamped edge of the fiber and compared to representative experimental curves in Fig. 10.
11
Fig. 1 Load-time curve comparison
Maximum axial tensile and transverse shear strains are obtained from elements demonstrating concentrations in each, as is the maximum transverse compression. Average axial strain is obtained from locations distant from the impact location. The failure criteria are calculated based on maximum axial tensile strain (ε3,max) according to Eq. 8. Axial tensile failure strain ε3(Lc) is calculated based on Weibull parameters found in literature, where the effective gage length Lc is based on contact length with the indenter as measured from the model. The reduction due to transverse compression (TC; 0.132) and strain rate (SR; –0.26) have been observed in literature (Sanborn et al. 2015; Thomas et al. 2019). Reduction due to transverse shear is calculated according to a stress-based failure envelope described in literature (Hudspeth et al. 2012).
ε3,maxε3,fail
= 1 (8)
where
ε3,fail = ε3(Lc, ACr, TCr, TSr )
ε3,fail = ε3(Lc) × (1 − TC) × (1 − TS) × (1 + SR)
0.00E+00
2.00E-01
4.00E-01
6.00E-01
8.00E-01
1.00E+00
1.20E+00
0.00E+00 5.00E-05 1.00E-04 1.50E-04 2.00E-04 2.50E-04
Forc
e (N
)
Time (s)
Model Experiment, Bottom Experiment, Top
12
4. Results and Discussion
4.1 Experimental Results
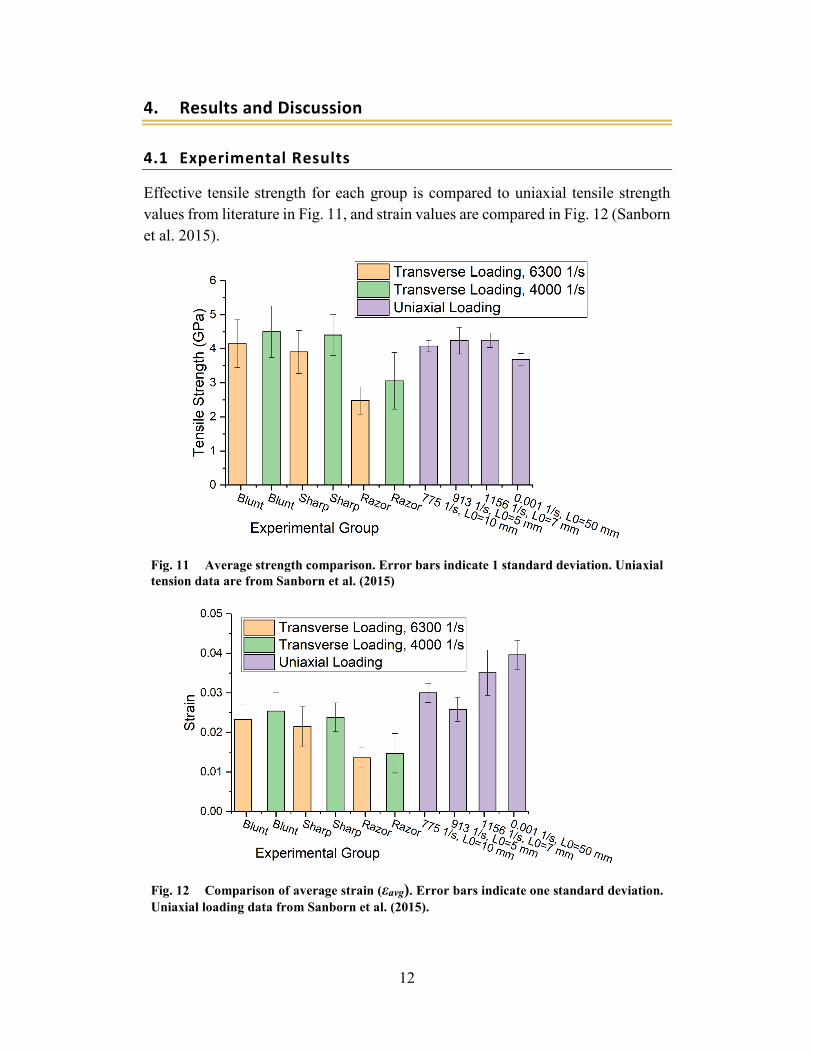
Effective tensile strength for each group is compared to uniaxial tensile strength values from literature in Fig. 11, and strain values are compared in Fig. 12 (Sanborn et al. 2015).
Fig. 11 Average strength comparison. Error bars indicate 1 standard deviation. Uniaxial tension data are from Sanborn et al. (2015)
Fig. 12 Comparison of average strain (εavg). Error bars indicate one standard deviation. Uniaxial loading data from Sanborn et al. (2015).
13
Compared to HSR uniaxial tensile loading, an increase can be seen in the sharp and blunt indenters by 3.5%–6.0% at the lower strain rate and reduction by 2.4%–8.0% is visible at the higher strain rate. Razor loading resulted in an apparent strength reduction by 28.0%–41.5% over uniaxial tensile as a function of increasing strain rate. Based on loading geometry, the results show the strength decreases by about 10% with increase in strain rate for transverse loading with all indenters. Sharp indenters appear to have slightly reduced strength compared to blunt, with a 5.82% reduction at 20 m/s and 2.24% reduction at 10 m/s, and the razor indenters have considerably reduced strength compared to blunt, with a 40% reduction at 20 m/s and 32% reduction at 10 m/s. Most differences are not statistically significant due to relatively high variance, but the reductions due to the razor loading are significant (p < 0.05 for ANOVA and post hoc test).
Failure strain at 10 m/s in the blunt and sharp indenters approaches the HSR uniaxial tensile failure strain for the 5-mm-gage length, while the razor is considerably lower compared to the blunt indenter. Failure strain decreases by about 10% with increase in strain rate for all indenters. Compared to uniaxial tensile failure strain for 7-mm-gage length at 1156 s–1, blunt indenters demonstrate a 28%–34% reduction, sharp indenters show a 32%–39% reduction, and razor indenters have failure strain reduced by 58%–61%. Trends in significance of differences are identical to those observed with strength.
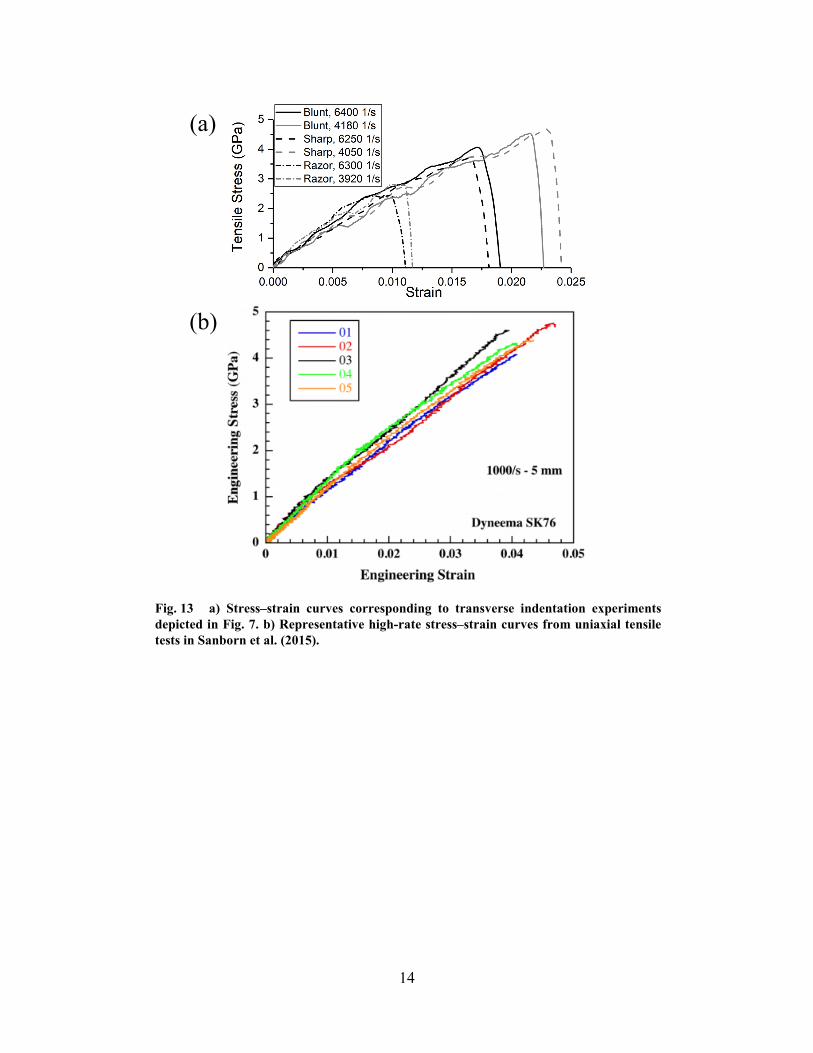
Analytical stress–strain curves of representative tests for each group can be seen in Fig. 13, and numerical results from experiments are included in Table 2.
14
Fig. 13 a) Stress–strain curves corresponding to transverse indentation experiments depicted in Fig. 7. b) Representative high-rate stress–strain curves from uniaxial tensile tests in Sanborn et al. (2015).
(a)
(b)
15
Table 1 Experimental data summary
Transverse impact (current study)
Geometry Speed Sample size
Impact velocity
(m/s)
Strain rate (s–1) Strain (𝜺𝜺𝒂𝒂𝒂𝒂𝒂𝒂,%) Strength
(GPa)
Avg. S.D. Avg. Avg. S.D. Avg. S.D.
Blunt Fast 10 21.14 0.79 6510.7 2.33 0.37 4.15 0.70 Slow 14 10.52 0.40 4089.9 2.54 0.46 4.50 0.75
Sharp Fast 21 20.27 0.99 6330.4 2.15 0.50 3.91 0.63 Slow 15 10.12 0.50 3985.1 2.38 0.36 4.40 0.60
Razor Fast 10 20.24 0.69 6325.1 1.36 0.25 2.48 0.40 Slow 16 9.86 0.41 3915.4 1.48 0.50 3.06 0.83
Uniaxial tensile loadinga
Gage length (mm) Avg.
Strain rate (s–1)
Strain (%)
Strength (GPa)
Avg. Avg. S.D. Avg. S.D. 10 775 3.00 0.24 4.08 0.17 5 913 2.58 0.31 4.54 0.39 7 1156 3.51 0.57 4.25 0.21
50 0.001 3.96 0.36 3.69 0.17 Notes: S.D. = Standard deviation. a Sanborn B, DiLeonardi AM, Weerasooriya T. Tensile properties of Dyneema SK76 single fibers at multiple loading rates using a direct gripping method. Journal of Dynamic Behavior of Materials. 2015;1(1):4–14. https://doi.org/10.1007/s40870-014-0001-3.
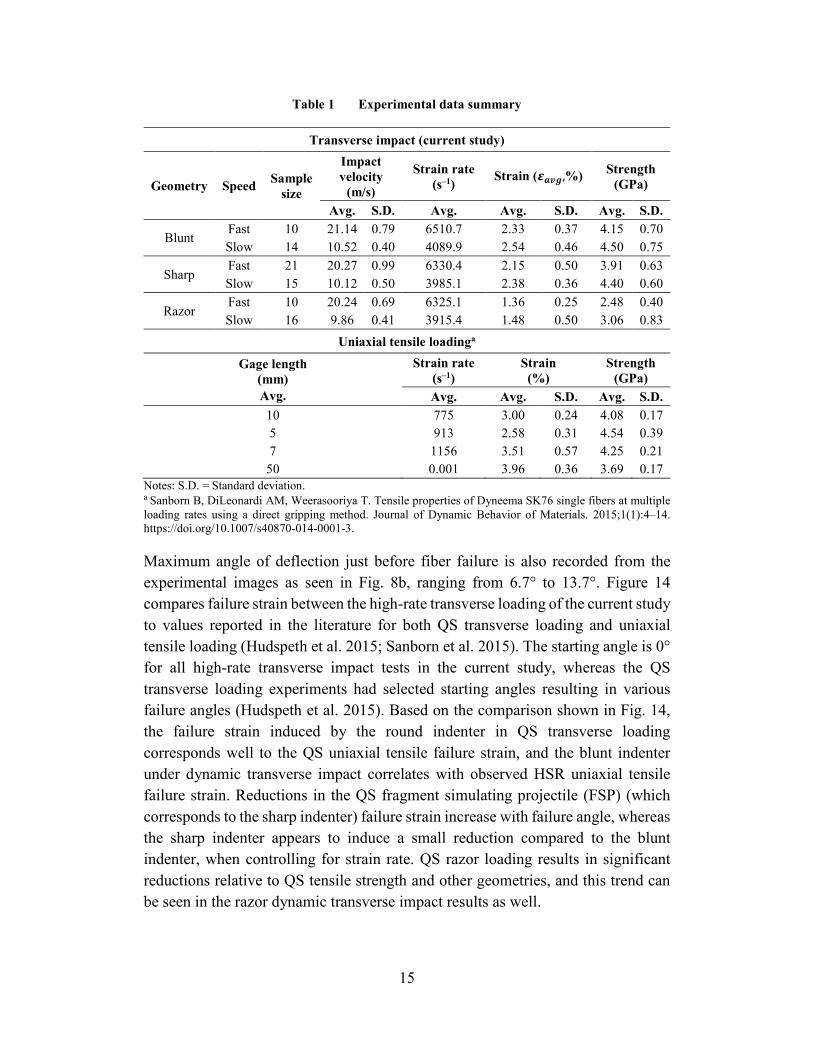
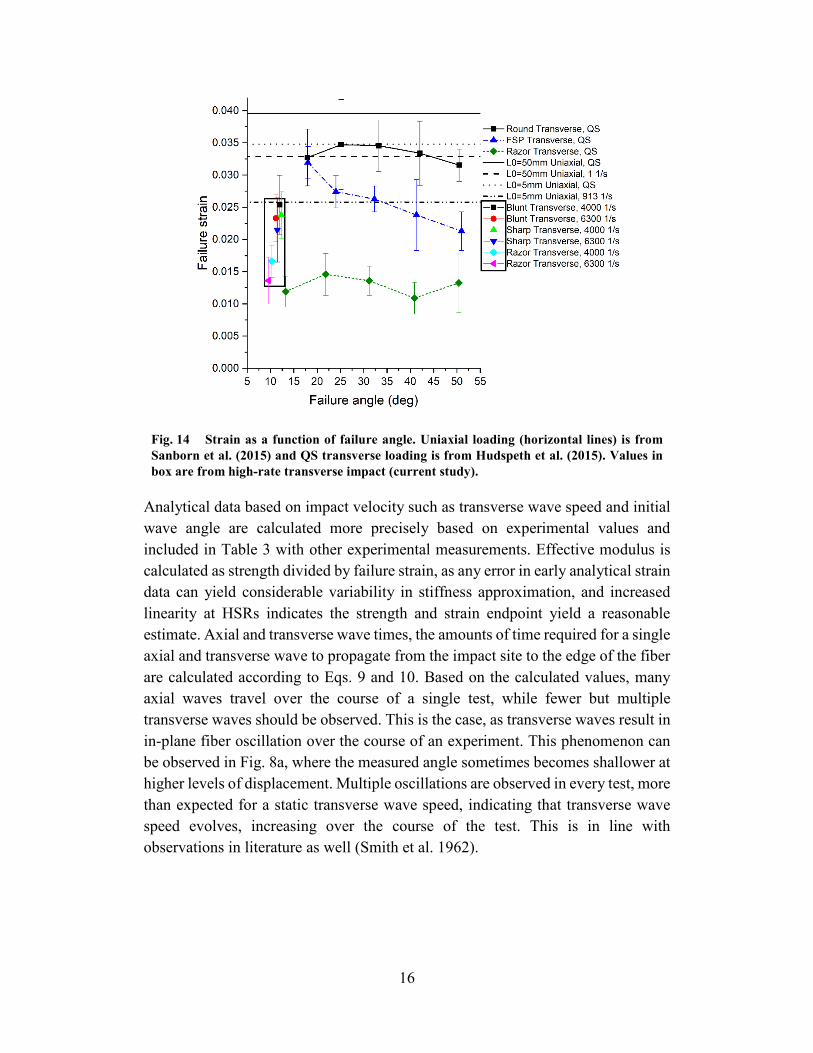
Maximum angle of deflection just before fiber failure is also recorded from the experimental images as seen in Fig. 8b, ranging from 6.7° to 13.7°. Figure 14 compares failure strain between the high-rate transverse loading of the current study to values reported in the literature for both QS transverse loading and uniaxial tensile loading (Hudspeth et al. 2015; Sanborn et al. 2015). The starting angle is 0° for all high-rate transverse impact tests in the current study, whereas the QS transverse loading experiments had selected starting angles resulting in various failure angles (Hudspeth et al. 2015). Based on the comparison shown in Fig. 14, the failure strain induced by the round indenter in QS transverse loading corresponds well to the QS uniaxial tensile failure strain, and the blunt indenter under dynamic transverse impact correlates with observed HSR uniaxial tensile failure strain. Reductions in the QS fragment simulating projectile (FSP) (which corresponds to the sharp indenter) failure strain increase with failure angle, whereas the sharp indenter appears to induce a small reduction compared to the blunt indenter, when controlling for strain rate. QS razor loading results in significant reductions relative to QS tensile strength and other geometries, and this trend can be seen in the razor dynamic transverse impact results as well.
16
Fig. 14 Strain as a function of failure angle. Uniaxial loading (horizontal lines) is from Sanborn et al. (2015) and QS transverse loading is from Hudspeth et al. (2015). Values in box are from high-rate transverse impact (current study).
Analytical data based on impact velocity such as transverse wave speed and initial wave angle are calculated more precisely based on experimental values and included in Table 3 with other experimental measurements. Effective modulus is calculated as strength divided by failure strain, as any error in early analytical strain data can yield considerable variability in stiffness approximation, and increased linearity at HSRs indicates the strength and strain endpoint yield a reasonable estimate. Axial and transverse wave times, the amounts of time required for a single axial and transverse wave to propagate from the impact site to the edge of the fiber are calculated according to Eqs. 9 and 10. Based on the calculated values, many axial waves travel over the course of a single test, while fewer but multiple transverse waves should be observed. This is the case, as transverse waves result in in-plane fiber oscillation over the course of an experiment. This phenomenon can be observed in Fig. 8a, where the measured angle sometimes becomes shallower at higher levels of displacement. Multiple oscillations are observed in every test, more than expected for a static transverse wave speed, indicating that transverse wave speed evolves, increasing over the course of the test. This is in line with observations in literature as well (Smith et al. 1962).
17
Table 3 Average and analytically determined properties. Transverse wave speeds are based on a nominal axial wave speed of 11,123 m/s.
Geometry Blunt Sharp Razor
Fast Slow Fast Slow Fast Slow Impact velocity (m/s) 21.14 10.52 20.27 10.12 20.24 9.86 Transverse wave speed (m/s) 135.42 85.07 131.67 82.89 131.56 81.44 Strain rate (s–1) 6510.7 4089.9 6330.4 3985.1 6325.1 3915.4 Calculated initial wave angle (degrees) 8.32 6.61 8.16 6.48 8.16 6.28
Axial wave time (ms) 0.00153 0.00153 0.00151 0.00150 0.00151 0.00140 Transverse wave time (ms) 0.144 0.229 0.147 0.233 0.147 0.232 Time to failure (ms) 0.213 0.447 0.212 0.451 0.169 0.359 Effective modulus (GPa) 180.1 180.7 186.1 186.1 185.0 215.7 Estimated axial wave speed (m/s) 13581 13594 13811 13835 13780 14851
𝑇𝑇𝑇𝑇𝑇𝑇 = 𝐿𝐿0/2𝑐𝑐𝑠𝑠
(9)
𝐴𝐴𝑇𝑇𝑇𝑇 = 𝐿𝐿0/2𝑐𝑐
(10)
Microscope images of failed fiber ends are observed as well. Figure 15 provides examples for each experimental condition. Elongation and fibrillation indicative of tensile failure are most common in blunt loading, while fibril shearing is more common in razor loading. These failure modes are commonly observed in literature with similar QS transverse loading experiments (Hudspeth et al. 2015). Sharp loading appears to be a mix of the two modes even though performance was not significantly different compared to the blunt loading results.
18
Fig. 15 Broken fiber ends for each experimental case: a) blunt, 6951 s–1; b) blunt, 4369 s–1; c) sharp, 6797 s–1; d) sharp, 4285 s–1; e) razor, 6789 s–1; and f) razor, 4307 s–1
4.2 Modeling Results
Based on high-precision model output, axial strain has been processed under the contact and at far field to obtain strain rates at short time scales. Strain rates are generally higher under the contact where failure occurs, and some peaks in excess of 5 × 10⁴ are seen, mostly likely due to transverse wave reflections. Importantly, strain rates under the contact appear to reach the nominal strain rate of 6300 s–1 while not usually exceeding 104. Far-field strain rates are generally lower but still on the order of 103 s–1.
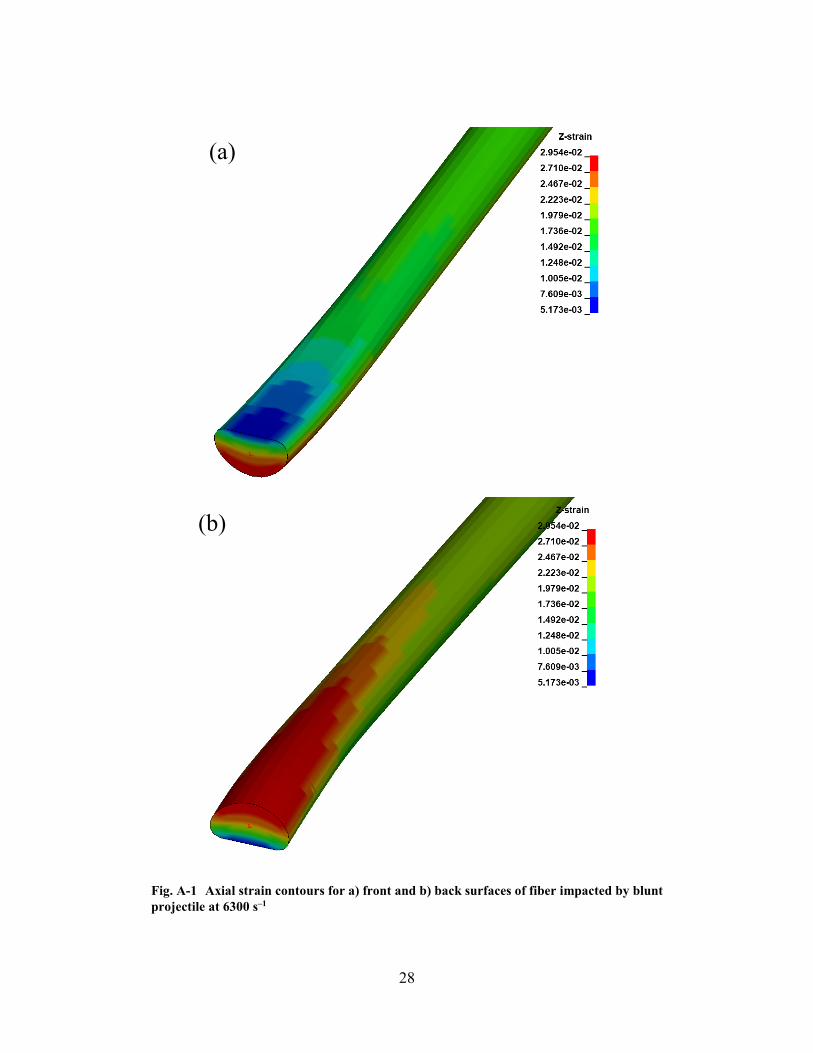
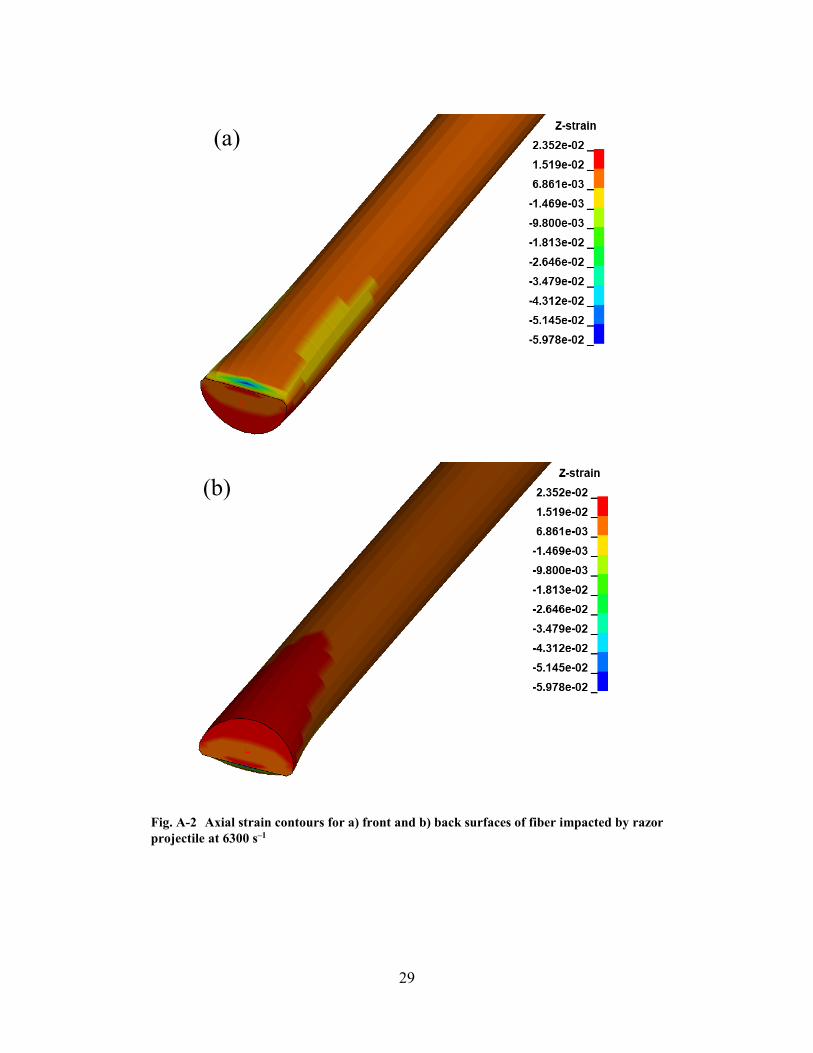
Axial strain contours at time of failure can be seen for sharp indenters at 6300 s–1 in Fig. 16, and transverse compressive and shear strain contours can be seen for the same model in Fig. 17. Results for other indenters at 6300 s–1 can be seen in the Appendix. Contours for models at 4000 s–1 are qualitatively similar, where a small
19
axial strain concentration is visible opposite the impact face and strain is distributed relatively evenly away from the impact location. Compression is always seen directly under the indenter, and shear is observed at the edge of the contact.
Fig. 16 Axial strain contours for a) front and b) back surfaces of fiber impacted by sharp projectile at 6300 s–1
(a)
(b)
Lc/2
20
Fig. 17 Contours of a) transverse compressive and b) transverse shear strain of fiber impacted by sharp projectile at 6300 s–1
Various input components to the failure criterion as a function of applied strain from the model for the sharp indenter at 6300 s–1 can be seen as a function of time in Fig. 18. Results for other geometries at both strain rates are qualitatively similar, with razors demonstrating more shear strain.
(a)
(b)
21
Fig. 18 Failure criterion components for the sharp indenter at 6300 s–1. a) Maximum axial strain and strain concentration factor. b) Transverse compressive and shear strains.
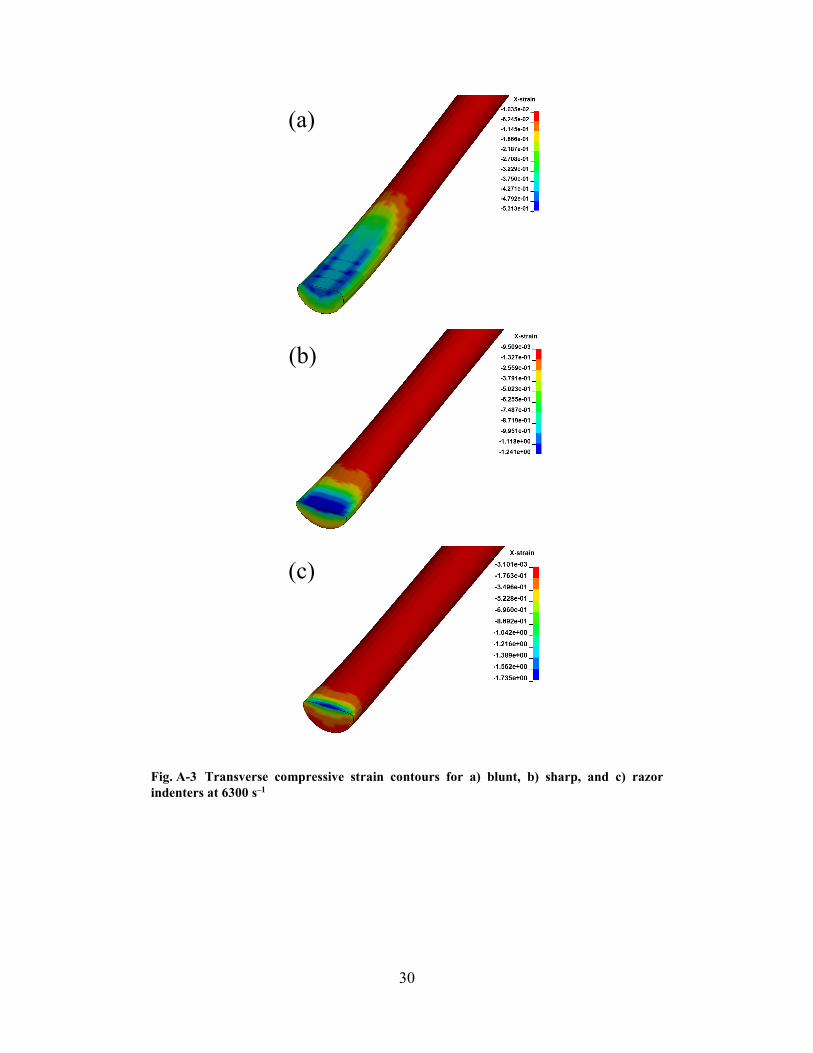
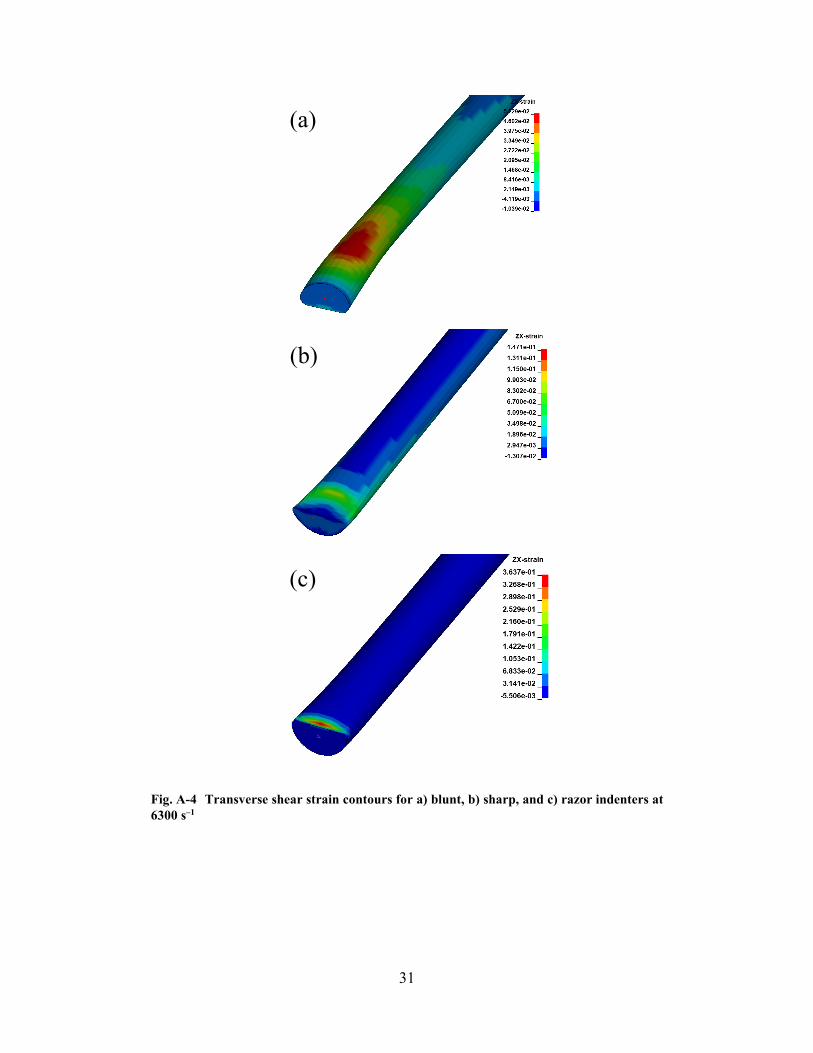
Failure criterion progression for all groups can be seen in Fig. 19. Razor indenters demonstrate a considerable increase in shear strain, resulting in much earlier failure, but blunt and sharp indenters fail at similar points. Discrete increases in strain are largely due to transverse wave reflections discussed in the experimental section. Input components at failure for all groups are listed in Table 4. Based on these results, transverse compression and high-rate loading contribute to some reduction in strength, but failure in the blunt loading is tension-dominated, and failure in razor loading is shear-dominated. Shear loading is a greater contributor to failure in sharp loading, but tension still seems to drive the fiber failure. All models demonstrate
0
1
2
3
4
5
6
0.0000.0050.0100.0150.0200.0250.0300.0350.040
0.000 0.005 0.010 0.015 0.020 0.025
Stra
in C
once
ntra
tion
Fact
or
Max
imum
Axi
al S
trai
n
Applied Average Strain
(a)
Maximum Axial Strain Strain Concentration Factor
0.00.20.40.60.81.01.21.4
0 0.005 0.01 0.015 0.02 0.025
Stra
in (M
agni
tude
)
Applied Average Strain
(b)
Maximum Transverse Shear Strain
Maximum Transverse Compressive Strain
22
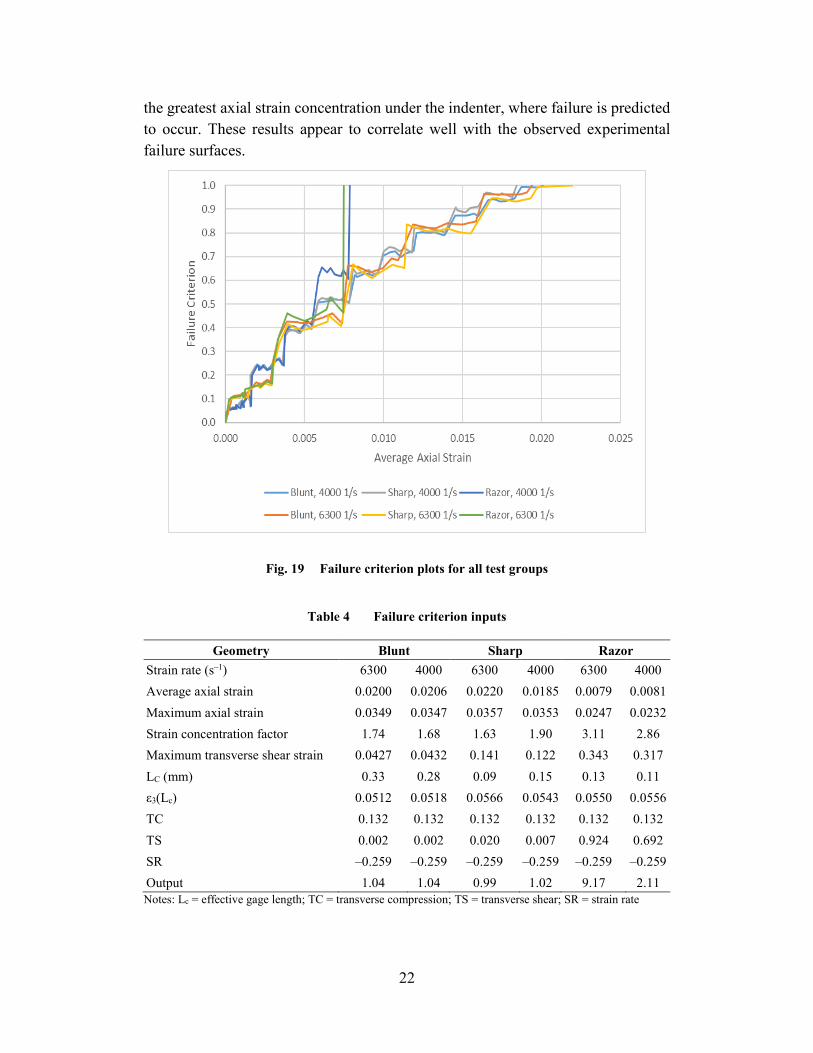
the greatest axial strain concentration under the indenter, where failure is predicted to occur. These results appear to correlate well with the observed experimental failure surfaces.
Fig. 19 Failure criterion plots for all test groups
Table 4 Failure criterion inputs
Geometry Blunt Sharp Razor Strain rate (s–1) 6300 4000 6300 4000 6300 4000 Average axial strain 0.0200 0.0206 0.0220 0.0185 0.0079 0.0081 Maximum axial strain 0.0349 0.0347 0.0357 0.0353 0.0247 0.0232 Strain concentration factor 1.74 1.68 1.63 1.90 3.11 2.86 Maximum transverse shear strain 0.0427 0.0432 0.141 0.122 0.343 0.317 LC (mm) 0.33 0.28 0.09 0.15 0.13 0.11 ε3(Lc) 0.0512 0.0518 0.0566 0.0543 0.0550 0.0556 TC 0.132 0.132 0.132 0.132 0.132 0.132 TS 0.002 0.002 0.020 0.007 0.924 0.692 SR –0.259 –0.259 –0.259 –0.259 –0.259 –0.259 Output 1.04 1.04 0.99 1.02 9.17 2.11 Notes: Lc = effective gage length; TC = transverse compression; TS = transverse shear; SR = strain rate
23
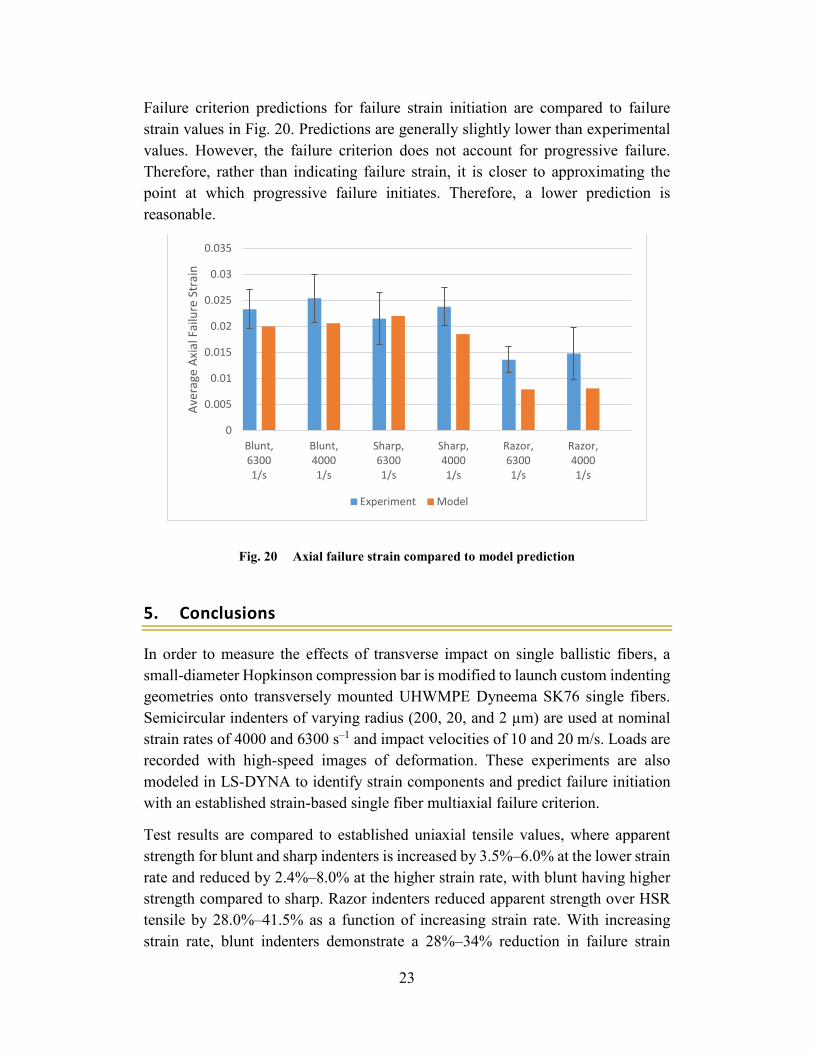
Failure criterion predictions for failure strain initiation are compared to failure strain values in Fig. 20. Predictions are generally slightly lower than experimental values. However, the failure criterion does not account for progressive failure. Therefore, rather than indicating failure strain, it is closer to approximating the point at which progressive failure initiates. Therefore, a lower prediction is reasonable.
Fig. 20 Axial failure strain compared to model prediction
5. Conclusions
In order to measure the effects of transverse impact on single ballistic fibers, a small-diameter Hopkinson compression bar is modified to launch custom indenting geometries onto transversely mounted UHWMPE Dyneema SK76 single fibers. Semicircular indenters of varying radius (200, 20, and 2 µm) are used at nominal strain rates of 4000 and 6300 s–1 and impact velocities of 10 and 20 m/s. Loads are recorded with high-speed images of deformation. These experiments are also modeled in LS-DYNA to identify strain components and predict failure initiation with an established strain-based single fiber multiaxial failure criterion.
Test results are compared to established uniaxial tensile values, where apparent strength for blunt and sharp indenters is increased by 3.5%–6.0% at the lower strain rate and reduced by 2.4%–8.0% at the higher strain rate, with blunt having higher strength compared to sharp. Razor indenters reduced apparent strength over HSR tensile by 28.0%–41.5% as a function of increasing strain rate. With increasing strain rate, blunt indenters demonstrate a 28%–34% reduction in failure strain
0
0.005
0.01
0.015
0.02
0.025
0.03
0.035
Blunt,63001/s
Blunt,40001/s
Sharp,63001/s
Sharp,40001/s
Razor,63001/s
Razor,40001/s
Aver
age
Axia
l Fai
lure
Str
ain
Experiment Model
24
relative to the uniaxial tests with 7-mm-gage length at 1156 s–1. Sharp indenters have a 32%–39% reduction as strain rate increases. Razor indenters demonstrate a 58%–61% reduction as strain rate increases. Imaging of failure surfaces is indicative of tensile and shear failure modes for blunt and razor loading, respectively. Sharp loading appears to a combination of the two, though the effects on strength and strain appear to be small.
Models demonstrate agreement with experimental results, with strain components corresponding well with expected behavior based on indenter geometry. Furthermore, the multiaxial strain states correspond well to experimental failure surfaces. The failure criterion indicates failure initiation for all models at lower average axial strain compared to experimental results.
25
6. References
Cole JD, Dougherty CB, Huth JH. Constant strain waves in strings. J Appl Mech. 1953;20:53-SA-4. https://doi.org/10.1017/CBO9781107415324.004.
DSM. Fact sheet. Ultra High Molecular Weight Polyethylene fiber from DSM Dyneema. Dyneema; 2010 Nov 15 [accessed 2020 Nov 23]. https://issuu.com/eurofibers/docs/name8f0d44.
Golovin K, Phoenix SL. Effects of extreme transverse deformation on the strength of UHMWPE single filaments for ballistic applications. Journal of Materials Science. 2016;51(17):8075–8086. https://doi.org/10.1007/s10853-016-0077-3.
Hudspeth M, Chu JM, Jewell E, Lim BH, Ytuarte E, Tsutsui W, Horner S, Zheng J, Chen W. Effect of projectile nose geometry on the critical velocity and failure of yarn subjected to transverse impact. Textile Research Journal. 2017;87(8):953–972. https://doi.org/10.1177/0040517516646040.
Hudspeth M, Li D, Spatola J, Chen W, Zheng J. The effects of off-axis transverse deflection loading on the failure strain of various high-performance fibers. Textile Research Journal. 2015;86(9):897–910. .
Hudspeth M, Nie X, Chen W. Dynamic failure of Dyneema SK76 single fibers under biaxial shear/tension. Polymer. 2012;53(24):5568–5574. https://doi.org/10.1016/j.polymer.2012.09.020.
Phoenix SL, Heisserer U, van der Werff H, van der Jagt-Deutekom M. Modeling and experiments on ballistic impact into UHMWPE yarns using flat and saddle-nosed projectiles. Fibers. 2017;5(1). https://doi.org/10.3390/fib5010008.
Russell BP, Karthikeyan K, Deshpande VS, Fleck NA. The high strain rate response of ultra high molecular-weight polyethylene: from fibre to laminate. International Journal of Impact Engineering. 2013;60:1–9. https://doi.org/10.1016/j.ijimpeng.2013.03.010.
Sanborn B, DiLeonardi AM, Weerasooriya T. Tensile properties of Dyneema SK76 single fibers at multiple loading rates using a direct gripping method. Journal of Dynamic Behavior of Materials. 2015;1(1):4–14. https://doi.org/10.1007/s40870-014-0001-3.
Smith JC, Blandford JM, Schiefer HF. Stress-strain relationships. in yarns subjected to rapid impact loading: part VI: velocities of strain waves resulting from impact. Textile Research Journal. 1960;30(10):752–760. https://doi.org/10.1177/004051756003001002.
26
Smith JC, Blandford JM, Towne KM. Stress-strain relationships in yarns subjected to rapid impact loading: part VIII: shock waves, limiting breaking velocities, and critical velocities. Textile Research Journal. 1962;32(1):67–76. https://doi.org/10.1177/004051756203200109.
Sockalingam S, Gillespie JW, Keefe M. Dynamic modeling of Kevlar KM2 single fiber subjected to transverse impact. International Journal of Solids and Structures. 2015;67–68:297–310. https://doi.org/10.1016/j.ijsolstr.2015.04.031.
Sockalingam S, Thomas FD, Casem D, Gillespie JW, Weerasooriya T. Failure of Dyneema® SK76 single fiber under multiaxial transverse loading. Textile Research Journal. 2018;004051751879865. https://doi.org/10.1177/0040517518798653.
Song B, Park H, Lu WY, Chen W. Transverse impact response of a linear elastic ballistic fiber yarn. Journal of Applied Mechanics, Transactions ASME. 2011;78(5):1–9. https://doi.org/10.1115/1.4004310.
Thomas FD, Casem D, Weerasooriya T, Sockalingam S, Gillespie JW. Influence of high strain rate transverse compression on the tensile strength of polyethylene ballistic single fibers. In: Conference Proceedings of the Society for Experimental Mechanics Series. 2019(1):339–344. https://doi.org/10.1007/978-3-319-95089-1_62
27
Appendix. Strain Contours at Time of Failure for Simulations of Dyneema Fiber Transversely Impacted at 6300s–1
28
Fig. A-1 Axial strain contours for a) front and b) back surfaces of fiber impacted by blunt projectile at 6300 s–1
(a)
(b)
29
Fig. A-2 Axial strain contours for a) front and b) back surfaces of fiber impacted by razor projectile at 6300 s–1
(a)
(b)
30
Fig. A-3 Transverse compressive strain contours for a) blunt, b) sharp, and c) razor indenters at 6300 s–1
(a)
(b)
(c)
31
Fig. A-4 Transverse shear strain contours for a) blunt, b) sharp, and c) razor indenters at 6300 s–1
(a)
(b)
(c)
32
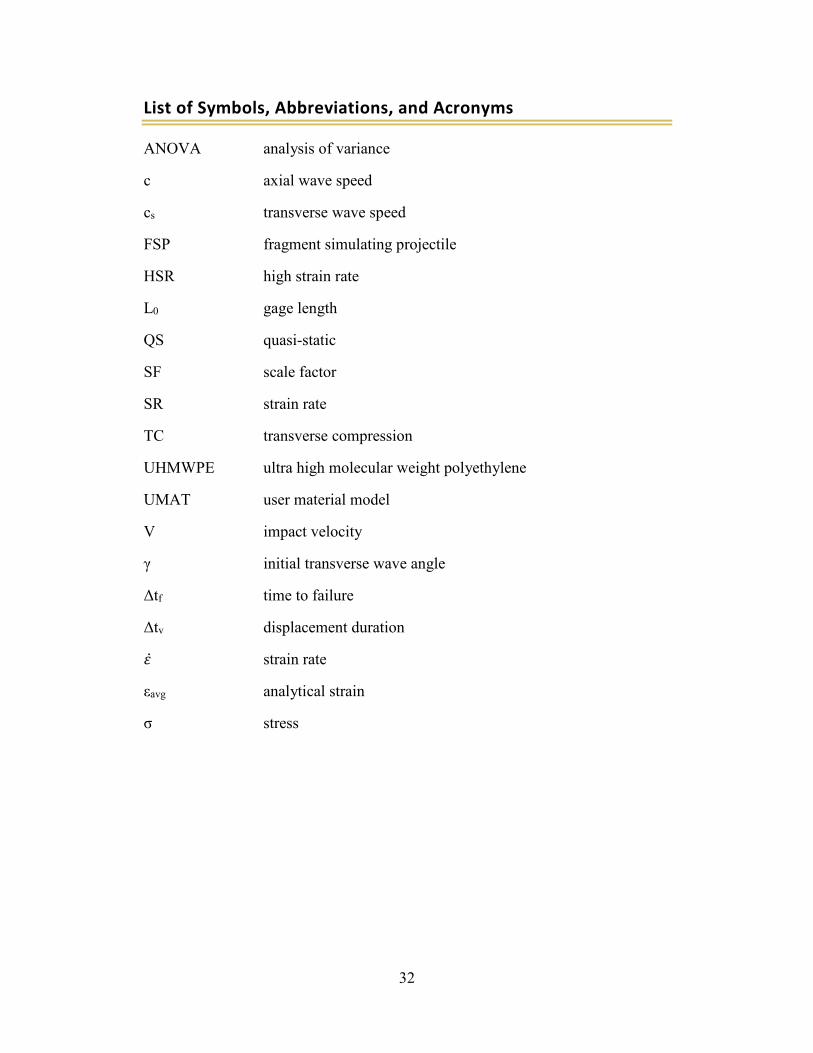
List of Symbols, Abbreviations, and Acronyms
ANOVA analysis of variance
c axial wave speed
cs transverse wave speed
FSP fragment simulating projectile
HSR high strain rate
L0 gage length
QS quasi-static
SF scale factor
SR strain rate
TC transverse compression
UHMWPE ultra high molecular weight polyethylene
UMAT user material model
V impact velocity
γ initial transverse wave angle
Δtf time to failure
Δtv displacement duration
𝜀𝜀̇ strain rate
εavg analytical strain
σ stress
33
1 DEFENSE TECHNICAL (PDF) INFORMATION CTR DTIC OCA 1 DEVCOM ARL (PDF) FCDD RLD DCI TECH LIB 1 DEVCOM ARL ARO (PDF) FCDD RLR D STEPP 11 DEVCOM NATICK SOLDIER (PDF) SYSTEMS CTR M G CARBONI D COLANTO R DILLALLA B FASEL J FONTECCHIO B KIMBALL J KIREJCZYK J PARKER M MAFEO M MARKEY D PHELPS 3 PROG EXECUTIVE OFC (PDF) SOLDIER J HOPPING J MULLENIX D OTTERSON 1 US ARMY TEST AND (PDF) EVALUATION COMMAND A FOURNIER 1 MTRL SCIENCES DIV (PDF) LAWRENCE BERKELY NATL LAB R RITCHIE 5 SOUTHWEST RSRCH INST (PDF) C ANDERSON JR S CHOCRON D NICOLELLA T HOLMQUIST G JOHNSON 2 NIST (PDF) A FORSTER M VANLANDINGHAM 1 INST FOR DEFNS ANLYS (PDF) Y MACHERET
3 MRMC DOD BLAST INJURY (PDF) RSRCH PROGRAM COOR OFC R GUPTA T PIEHLER R SHOGE 2 MRMC JTAPIC PRGM OFC (PDF) W LEI J USCILOWICZ 4 US ARMY AEROMEDICAL (PDF) RSRCH LAB F BROZOSKI V CHANCEY B MCENTYRE D WISE 1 DEVCOM GROUND VEHICLE (PDF) SYSTEMS CENTER R SCHERER 1 DEVCOM (PDF) AMSRD PE D RUSIN 2 DEVCOM CHEMICAL (PDF) BIOLOGICAL CENTER M HORSMON N VINCELLI 1 OSD DOT&E (PDF) J IVANCIK 5 US NAVAL RESEARCH (PDF) LABORATORY A BAGCHI A ILIOPOULOS J MICHOPOULOS K TEFERRA X TAN 4 CCDC DAC (PDF) FCDD DAG G J GURGANUS FCDD DAG S K LOFTIS FCDD DAW W G DIETRICH S SNEAD
34
86 DEVCOM ARL (PDF) FCDD RLW S KARNA J NEWILL A RAWLETT S SCHOENFELD J ZABINSKI FCDD RLW B R BECKER J CAMPBELL P GILLICH C HOPPEL B SCHUSTER A TONGE L VARGAS-GONZALEZ FCDD RLW L A DAGRO C GOOD T V SHEPPARD FCDD RLW LF T G BROWN FCDD RLW LH T EHLERS L MAGNESS C MEYER D SCHEFFLER FCDD RLW M E CHIN FCDD RLW MA T BOGETTI M NEBLETT T PLAISTED F RACINE J SANDS E WETZEL M YEAGER C YEN FCDD RLW MB G GAZONAS B LOVE P MOY D O’BRIEN J SIETINS J SUN T WALTER FCDD RLW MC R JENSEN FCDD RLW MD A BUJANDA S WALSH B CHEESEMAN K CHO J LA SCALA FCDD RLW ME J LASALVIA P PATEL
S SILTON J SWAB FCDD RLW MF K DARLING S GRENDAHL H MURDOCH FCDD RLW MG J ANDZELM J LENHART R MROZEK FCDD RLW O M GALLAGHER FCDD RLW P R FRANCART FCDD RLW PA S BILYK FCDD RLW PB S ALEXANDER T BAUMER A BROWN B FAGAN A GOERTZ A GUNNARSSON C HAMPTON M KLEINBERGER E MATHEIS J MCDONALD P MCKEE K RAFAELS S SATAPATHY M TEGTMEYER T WEERASOORIYA S WOZNIAK T ZHANG FCDD RLW PC J CAZAMIAS D CASEM J CLAYTON C MEREDITH L SHANNAHAN J LLOYD FCDD RLW PD K MASSER R DONEY C RANDOW FCDD RLW PE M LOVE P SWOBODA FCDD RLW PG N GNIAZDOWSKI R GUPTA S KUKUCK
35
4 WHITING SCHOOL OF (PDF) ENG JOHNS HOPKINS UNIV KT RAMESH T D NGUYEN B NOTGHI S BAILOOR 2 COULTER DEPT OF (PDF) BIOMED ENG GEORGIA INST OF TECH S MARGULIES D MCDOWELL 1 DEPT OF ENGRNG SCI AND (PDF) MECHANICS VIRGINIA POLYTECHNIC INST AND STATE UNIV R BATRA 3 MASSACHUSETTS INST OF (PDF) TECHLGY INST FOR SOLDIER NANOTECHNOLOGIES R RADOVITZKY S SOCRATE M J BUEHLER 1 DEPT OF MECHL AND (PDF) NUCLEAR ENGRNG THE PENNSYLVANIA STATE UNIV R KRAFT 1 INDIAN INST OF TECH (PDF) R BHARDWAJ 2 CENTER FOR APPLIED (PDF) BIOMECHANICS UNIV OF VIRGINIA R SALZAR M B PANZER 1 UCSD MAT SCI AND ENG (PDF) MARC MEYERS 1 DUKE UNIV (PDF) BIOMED ENG CR BASS 1 UNIV OF CAPE TOWN (PDF) BLAST IMPACT & SURVIVABILITY UNIT TJ CLOETE
1 UNIV OF OXFORD (PDF) BLAST IMPACT & SURVIVABILITY UNIT C SIVIOUR 1 UNIV OF CAMBRIDGE (PDF) ENG DEPT V DESHPANDE 4 UNIV OF SOUTH CAROLINA (PDF) COL OF ENG S RAJAN M SUTTON S SOCKALINGAM F THOMAS 1 DSM DYNEEMA (PDF) R ROZANSKY 1 IMPERIAL COL LONDON (PDF) DEPT OF PHYSICS W PROUD 1 DIV OF ENG AND APPL SCI (PDF) CALTECH R RAVICHANDRAN
1 DEPT OF AERO ENG AND (PDF) ENG MECH
U TEXAS AUSTIN K RAVI-CHANDAR
1 PURDUE UNIVERSITY (PDF) AERO AND ASTRO ENG
W CHEN


![Crack Propagation with Material Memoryfde.uwaterloo.ca/Fde/Crackgrowth/pdpropPaper2013.pdf · During cyclic loading processes in engineering structures, ... "Reservoir[4] " In multiaxial](https://img.pdfslide.net/doc/110x75/5ab30aae7f8b9a284c8e042d/crack-propagation-with-material-cyclic-loading-processes-in-engineering-structures.jpg)