Embed Size (px)
Citation preview
i
INFLUENCE OF EAR CANAL OCCLUSION AND AIR-CONDUCTION FEEDBACK
ON SPEECH PRODUCTION IN NOISE
by
David C. Byrne
BA in Physics, University of Pittsburgh, 1984
MS in Communication Disorders, The Pennsylvania State University, 1987
Submitted to the Graduate Faculty of
the School of Health and Rehabilitation Sciences in partial fulfillment
of the requirements for the degree of
Doctor of Philosophy
University of Pittsburgh
2013

ii
UNIVERSITY OF PITTSBURGH
School of Health and Rehabilitation Sciences
This dissertation was presented
by
David C. Byrne
It was defended on
September 25, 2013
and approved by
John D. Durrant, PhD, Professor Emeritus, Department of Communication Science and
Disorders
Susan Shaiman, PhD, Associate Professor, Communication Science and Disorders
Jeffrey S. Vipperman, PhD, Associate Professor of Mechanical Engineering / Associate
Professor of BioEngineering, Department of Mechanical Engineering & Materials Science
William J. Murphy, PhD, Research Physicist, National Institute for Occupational Safety and
Health, Cincinnati, Ohio
Dissertation Advisor: Catherine V. Palmer, PhD, Associate Professor, Communication
Science and Disorders

iii
Copyright © by David C. Byrne
2013
iv
Millions of workers are exposed to high noise levels on a daily basis. The primary concern for
these individuals is the prevention of noise-induced hearing loss, which is typically
accomplished by wearing of some type of personal hearing protector. However, many workers
complain they cannot adequately hear their co-workers when hearing protectors are worn. There
are many aspects related to fully understanding verbal communication between noise-exposed
workers that are wearing hearing protection. One topic that has received limited attention is the
overall voice level a person uses to communicate in a noisy environment. Quantifying this
component provides a starting point for understanding how communication may be improved in
such situations.
While blocking out external sounds, hearing protectors also induce changes in the
wearer’s self-perception of his/her own voice, which is known as the occlusion effect. The
occlusion effect and attenuation provided by hearing protectors generally produce opposite
effects on that individual’s vocal output. A controlled laboratory study was devised to
systematically examine the effect on a talker’s voice level caused by wearing a hearing protector
and while being subjected to high noise levels. To test whether differences between occluded
and unoccluded vocal characteristics are due solely to the occlusion effect, speech produced
while subjects’ ear canals were occluded was measured without the subject effectively receiving
any attenuation from the hearing protectors. To test whether vocal output differences are due to
INFLUENCE OF EAR CANAL OCCLUSION AND AIR-CONDUCTION FEEDBACK
ON SPEECH PRODUCTION IN NOISE
David C. Byrne, PhD
University of Pittsburgh, 2013
v
the reduction in the talker’s self-perceived voice level, the amount of occlusion was held
constant while varying the effective hearing protector attenuation.
Results show the occlusion effect, hearing protector attenuation, and ambient noise level
all to have an effect on the talker’s voice output level, and all three must be known to fully
understand and/or predict the effect in a particular situation. The results of this study may be
used to begin an effort to quantify metrics in addition to the basic noise reduction rating that may
be used to evaluate a hearing protector’s practical usability/wearability. By developing such
performance metrics, workers will have information to make informed decisions about which
hearing protector they should use for their particular work environment.

vi
TABLE OF CONTENTS
1.0 INTRODUCTION ........................................................................................................ 1
2.0 BACKGROUND .......................................................................................................... 3
2.1 SPEECH ACOUSTICS ....................................................................................... 3
2.1.1 Basics of speech production ............................................................................ 3
2.1.2 Long-term average speech spectrum ............................................................. 5
2.2 SPEECH PRODUCTION IN NOISE ................................................................ 7
2.2.1 The Lombard effect ......................................................................................... 7
2.2.2 Other vocal characteristics ........................................................................... 10
2.2.3 Summary ........................................................................................................ 12
2.3 EFFECT OF “LOUD SPEECH” AND NOISE ON INTELLIGIBILITY ... 15
2.4 MEASUREMENT OF SPEECH INTELLIGIBILITY ................................. 23
2.4.1 Word tests ....................................................................................................... 23
2.4.2 Sentence tests.................................................................................................. 29
2.5 EFFECTS OF HEARING PROTECTION ON INTELLIGIBILITY ......... 34
2.5.1 Mechanisms of performance ......................................................................... 34
2.5.2 Listener effects ............................................................................................... 37
2.5.3 Talker effects .................................................................................................. 44

vii
2.6 ADDITIONAL CONSIDERATIONS FOR SPEECH INTELLIGIBILITY 51
2.6.1 Self-hearing .................................................................................................... 51
2.6.2 Prediction techniques .................................................................................... 55
2.6.3 Clear speech/Speech training ....................................................................... 56
2.7 ANALYSIS AND SUMMARY OF THE EXISTING RESEARCH ............. 59
3.0 RESEARCH QUESTION AND METHODS .......................................................... 65
3.1 OBJECTIVE ...................................................................................................... 65
3.1.1 Hypotheses ...................................................................................................... 66
3.2 STUDY PLAN .................................................................................................... 67
3.2.1 Approach ........................................................................................................ 67
3.2.1.1 Voice feedback system instrumentation ............................................ 68
3.2.1.2 Evaluation of voice feedback instrumentation ................................. 69
3.2.2 Ear canal occlusion conditions ..................................................................... 73
3.2.3 Hearing protector attenuation conditions ................................................... 74
3.2.3.1 Attenuation measurements ................................................................. 74
3.2.3.2 Setting the voice feedback system ...................................................... 76
3.2.4 Background noise levels ................................................................................ 77
3.2.5 Speech measurements.................................................................................... 77
3.3 STUDY PARTICIPANTS ................................................................................. 80
3.3.1 Protection of human subjects ....................................................................... 80
3.3.2 Qualification procedures ............................................................................... 82
3.4 TEST PROCEDURE ......................................................................................... 83
3.5 EXPERIMENTAL DESIGN ............................................................................ 84
viii
4.0 RESULTS ................................................................................................................... 89
4.1 PRELIMINARY MEASURES ......................................................................... 89
4.1.1 Occlusion effect measurements .................................................................... 89
4.1.2 Hearing protector attenuation measurements ............................................ 90
4.2 EFFECT OF OCCLUSION TYPE, ATTENUATION, AND NOISE .......... 92
4.2.1 WAV file analysis........................................................................................... 92
4.2.2 Linear mixed model ....................................................................................... 94
4.2.3 Occlusion type ................................................................................................ 96
4.2.4 Attenuation level ............................................................................................ 98
4.2.5 Interaction effects ........................................................................................ 100
5.0 DISCUSSION ........................................................................................................... 105
5.1 EFFECT OF OCCLUSION TYPE, ATTENUATION, AND NOISE ........ 105
5.2 PRACTICAL IMPLICATIONS .................................................................... 108
5.3 LIMITATIONS OF THE STUDY ................................................................. 110
5.4 CONCLUSIONS .............................................................................................. 112
APPENDIX A. PHONETICALLY BALANCED PHRASE LISTS TYPICAL OF
COMMUNICATION IN NOISY WORK ENVIRONMENTS ............................................ 114
APPENDIX B. PHRASE LIST USED IN THIS STUDY ...................................................... 116
APPENDIX C. RANDOMIZED SUBJECT TESTING SCHEDULE ................................. 117
APPENDIX D. GENERAL LINEAR MODEL - MARGINAL MEANS ............................ 119
APPENDIX E. DIFFERENCES OF MARGINAL MEANS FOR DIFFERENT
OCCLUSION TYPES AND NOISE LEVELS ...................................................................... 123

ix
APPENDIX F. DIFFERENCES OF MARGINAL MEANS FOR DIFFERENT LEVELS
OF ATTENUATION AND NOISE ......................................................................................... 126
APPENDIX G. DIFFERENCES OF MARGINAL MEANS FOR DIFFERENT
ATTENUATION LEVELS AND OCCLUSION TYPES ..................................................... 130
BIBLIOGRAPHY ..................................................................................................................... 133
x
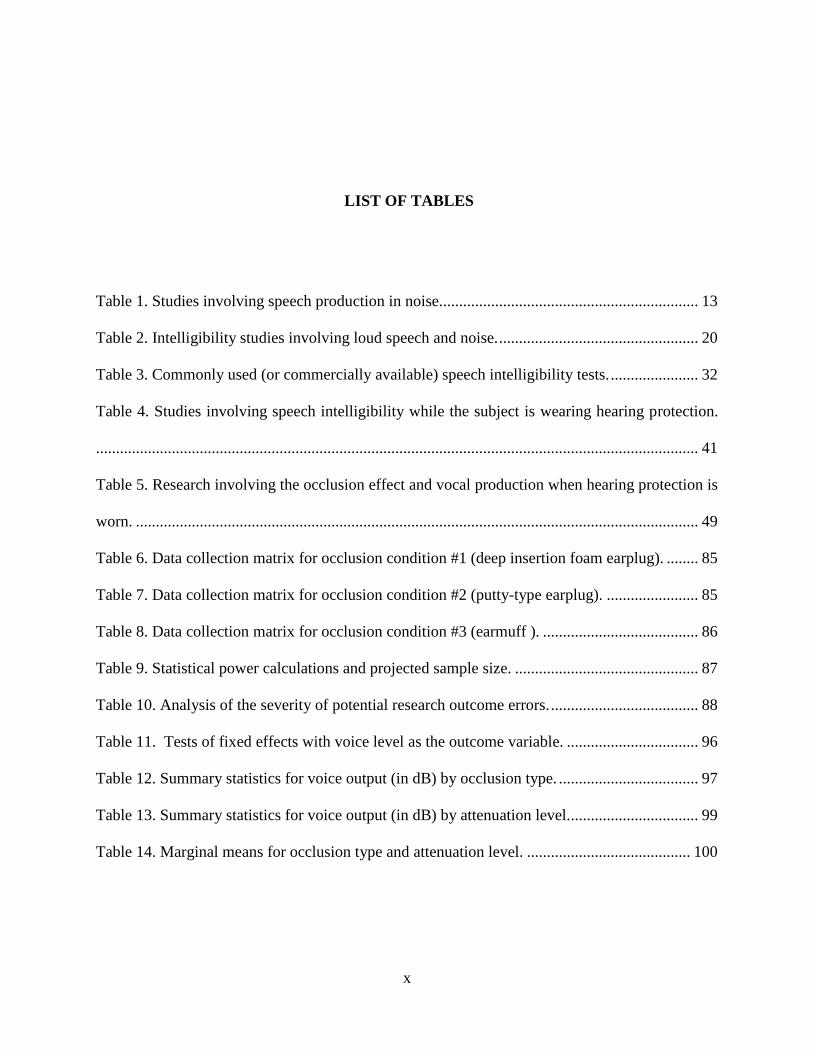
LIST OF TABLES
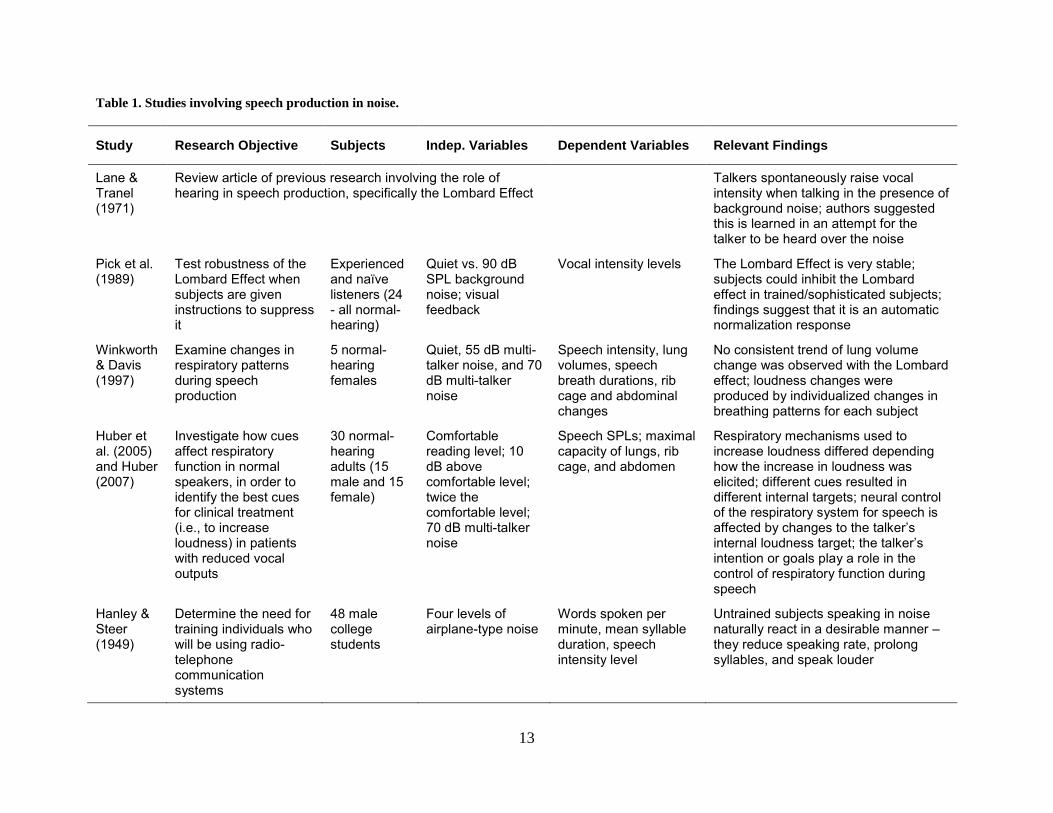
Table 1. Studies involving speech production in noise................................................................. 13
Table 2. Intelligibility studies involving loud speech and noise. .................................................. 20
Table 3. Commonly used (or commercially available) speech intelligibility tests. ...................... 32
Table 4. Studies involving speech intelligibility while the subject is wearing hearing protection.
....................................................................................................................................................... 41
Table 5. Research involving the occlusion effect and vocal production when hearing protection is
worn. ............................................................................................................................................. 49
Table 6. Data collection matrix for occlusion condition #1 (deep insertion foam earplug). ........ 85
Table 7. Data collection matrix for occlusion condition #2 (putty-type earplug). ....................... 85
Table 8. Data collection matrix for occlusion condition #3 (earmuff ). ....................................... 86
Table 9. Statistical power calculations and projected sample size. .............................................. 87
Table 10. Analysis of the severity of potential research outcome errors. ..................................... 88
Table 11. Tests of fixed effects with voice level as the outcome variable. ................................. 96
Table 12. Summary statistics for voice output (in dB) by occlusion type. ................................... 97
Table 13. Summary statistics for voice output (in dB) by attenuation level................................. 99
Table 14. Marginal means for occlusion type and attenuation level. ......................................... 100

xi
Table 15. Average differences in voice output level between the minimum occlusion effect
conditions (foam earplug and earmuff) and the maximum occlusion effect condition (putty
earplug). ...................................................................................................................................... 107
xii
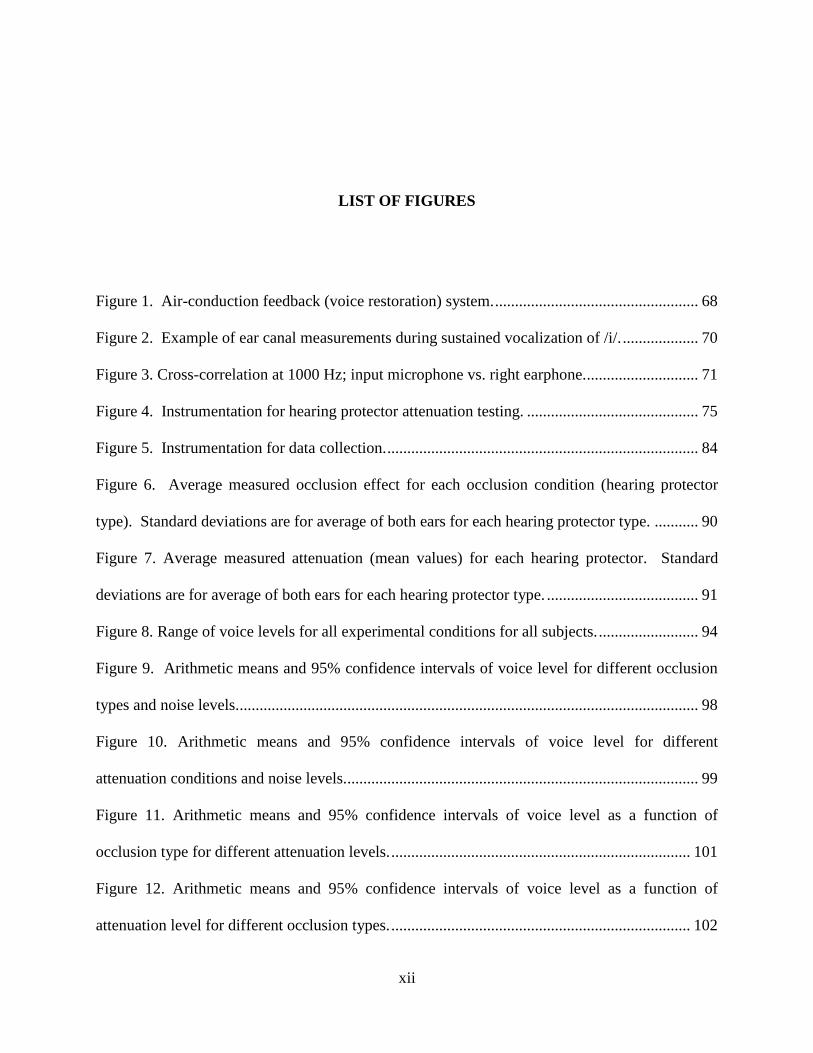
LIST OF FIGURES
Figure 1. Air-conduction feedback (voice restoration) system. ................................................... 68
Figure 2. Example of ear canal measurements during sustained vocalization of /i/. ................... 70
Figure 3. Cross-correlation at 1000 Hz; input microphone vs. right earphone. ............................ 71
Figure 4. Instrumentation for hearing protector attenuation testing. ........................................... 75
Figure 5. Instrumentation for data collection. .............................................................................. 84
Figure 6. Average measured occlusion effect for each occlusion condition (hearing protector
type). Standard deviations are for average of both ears for each hearing protector type. ........... 90
Figure 7. Average measured attenuation (mean values) for each hearing protector. Standard
deviations are for average of both ears for each hearing protector type. ...................................... 91
Figure 8. Range of voice levels for all experimental conditions for all subjects. ......................... 94
Figure 9. Arithmetic means and 95% confidence intervals of voice level for different occlusion
types and noise levels.................................................................................................................... 98
Figure 10. Arithmetic means and 95% confidence intervals of voice level for different
attenuation conditions and noise levels. ........................................................................................ 99
Figure 11. Arithmetic means and 95% confidence intervals of voice level as a function of
occlusion type for different attenuation levels. ........................................................................... 101
Figure 12. Arithmetic means and 95% confidence intervals of voice level as a function of
attenuation level for different occlusion types. ........................................................................... 102

xiii
Figure 13. Arithmetic means of voice output level as a function of occlusion site for different
attenuation and noise levels (error bars = standard error of the mean). ...................................... 103
Figure 14. Arithmetic means of voice output level as a function of attenuation level for different
occlusion types and noise levels (error bars = standard error of the mean). ............................... 104

1
1.0 INTRODUCTION
The discrimination of different speech sounds (i.e., the ability to understand what someone is
saying) is one of the most important functions of the human auditory system. As everyone has
experienced numerous times in their everyday lives, it is easier to hear and understand what is
being said in some situations, while listening is much harder in other circumstances. For the
approximately 22 million Americans who are occupationally exposed to hazardous noise (Tak,
Davis, & Calvert, 2009), speech interference is a particularly bothersome effect of a noisy work
environment.
Current occupational safety and health standards/regulations are primarily concerned
with protecting workers from the harmful effects of high noise levels, and do not specifically
mention communication issues (OSHA, 1983). Much of the scientific research involving speech
intelligibility focuses on the acoustical environment, the hearing ability of the listener, and to a
lesser extent, whether hearing protectors were worn. Some research also has been conducted to
investigate the influence of background noise or hearing protection on the vocal output of an
individual. Although the results are inconclusive, these studies have shown that occluding a
person’s ears can have an effect on how that person produces and perceives his/her own speech.
Therefore, understanding speech communication issues that industrial workers face requires
investigation of the effects of background noise and hearing protectors for both the talker as well
as the listener.
2
Many workers require good speech intelligibility for the safe performance of their jobs.
Identification or development of suitable strategies for communicating under difficult listening
conditions would be useful for occupationally noise-exposed individuals. It would be helpful to
accurately assess a worker’s communication ability with an appropriate and easily administered
speech intelligibility test. A review of the literature contained herein reveals that none of the
existing commercially available tests were recorded while the talker was exposed to noise and
was wearing hearing protectors. Test materials recorded under these conditions are needed to
develop a valid speech intelligibility test for use with noise-exposed workers. However, not all
of the underlying factors that would go into constructing such a test are completely understood.
For example, the interaction between the occlusion effect, the amount of attenuation provided by
a hearing protector, and their effects on speech produced in a noisy workplace has not been
adequately explained in the literature. Herein is outlined a laboratory-based experiment in which
these issues are investigated in order to provide a foundation for future research in this area. The
intent was to develop a better understanding of how workers communicate while wearing
hearing protection in a noise-hazardous environment, with the ultimate goal of optimizing
workers’ communication abilities while preserving their hearing ability.

3
2.0 BACKGROUND
Studying speech intelligibility under hazardous noise conditions includes elements from several
related disciplines such as acoustics, audiology, and speech science. Beginning with the basic
acoustical characteristics of speech production, several variables must be identified and
understood. When high noise levels are present, these variables include changes in vocal output,
the influence of hearing protective devices, and inter-relationships between the different
variables. Identifying the specific tests/techniques appropriate for investigating these factors
becomes an important issue.
2.1 SPEECH ACOUSTICS
2.1.1 Basics of speech production
Speech sounds are perhaps the most complex sounds an individual encounters on a daily basis,
due to their rapidly changing acoustical characteristics. The speech-generating mechanism must
therefore be a complex system capable of many modes of operation. The source-filter theory of
speech production describes the basic mechanisms of speech production and examines
articulatory-acoustic relationships (Stevens & House, 1961; Stevens, 1989). This theory
analyzes speech outputs as a linear and time-invariant system of an acoustical energy source as
4
modified by the response of a filter. The larynx is the primary source and the pharynx, mouth,
and nose – together comprising the vocal tract – acts as the filter. Over the past 50 years, the
source-filter theory has been thoroughly described in numerous texts (e.g., Fry, 1979; Picket,
1980; Kent, 1997; Kent & Read, 2002).
As air is exhaled from the lungs, it passes through the vocal folds, which can be thought
of as an adjustable barrier across the air passage. A “voiced” sound is generated as the vocal
folds vibrate in an essentially periodic manner. These sounds have a fundamental frequency (F0)
equal to the repetition rate of vocal fold vibration. They include all vowels, the nasal consonants
/m n ng/, the liquid consonants /r l/, and glide consonants /w j/. Other speech sounds (e.g., /h
f s p k t/) are produced when the vocal folds are open and not vibrating, or when the glottis is
only momentarily blocked. In these cases, the sound source is aperiodic turbulence occurring
either at the glottis or higher up in the vocal tract. A few speech sounds (e.g., /v z/) are
generated by both a voiced source and a turbulent noise source being activated simultaneously.
After the source has been activated, the remaining length of the vocal tract alters the
acoustic signal to form a speech sound. Similar to any other acoustic filter, the size, shape, and
surface lining of the vocal tract dictate its acoustical properties. Although a complex acoustical
system, in acoustic terms the vocal tract may be treated for simplicity as a lumped-parameter
circuit. As such, it may be thought of as a resonator, meaning that it naturally enhances certain
frequencies (or reduces them through anti-resonances). Resonant frequencies of the vocal tract
are called formants, and these resonance patterns form the basis of most speech sounds.
Continually adjusting the size and shape of the vocal tract filter system enables the different
speech sounds to be produced. A listener learns to recognize the different speech sounds by
distinguishing among the different patterns of formant frequencies and other sounds present in a

5
speech sample. Diehl (2008) provides a review of the source–filter theory of speech production
while addressing how acoustic and auditory properties of commonly occurring speech sounds
ensure that speech is intelligible.
2.1.2 Long-term average speech spectrum
When analyzing speech, it is necessary to understand how individual sounds combine to form an
overall acoustic spectrum. In this kind of analysis, a long sequence of connected speech (i.e.,
long enough for every sound to occur many times) is analyzed. The intensity level at each
frequency is measured and summed to produce what is known as the long-term average speech
spectrum (LTASS). Normally, the LTASS is plotted on a graph as decibel level (on the vertical
axis) versus frequency (on the horizontal axis). The resulting curve shows the range of
frequencies contained in the speech signal, and illustrates where the energy content is the
greatest. Knowing the “normal” LTASS is essential to provide a basis for comparison when
speech acoustics are applied to analyze different communication problems/situations.
Some of the earliest measurements of the LTASS were conducted at the Bell Telephone
Laboratories. Dunn and White (1940) asked eleven subjects to read aloud continuously at a
normal voice level while filters were used to analyze the speech spectrum. These data were used
to help solve telephone transmission and/or speech reproduction problems. Due to equipment
limitations, only one frequency band could be measured at a time, and the subject had to repeat
the same passage several times in order to obtain a measurement for each frequency band of
interest. Nevertheless, the overall level and distribution of speech energy was determined. In a
later paper, French and Steinberg (1947) summarized the factors of speech (e.g., spectrum,
levels) which had been identified by the end of World War II.
6
Several studies involving measurement of the LTASS have been performed since the
pioneering work conducted before 1950. Many of these studies were conducted to provide
hearing aid fitting information (Olsen, Hawkins, & Van Tasell, 1987; Cox & Moore, 1988;
Cornelisse, Gagne, & Seewald, 1991; Stelmachowicz, Mace, Kopun, & Carney, 1993; Pittman,
Stelmachowicz, Lewis, & Hoover, 2003; Holube, Fredelake, Vlaming, & Kollmeier, 2010).
Others were intended for the assessment of voice pathologies or other vocal characteristics
(Wendler, Doherty, & Hollien, 1980; Kitzing, 1986; Lofqvist & Mandersson, 1987; Mendoza,
Valencia, Munoz, & Trujillo, 1996; Linville, 2002).
A comprehensive study involving measurement of the LTASS was conducted by a large
group of researchers from several different countries (Byrne et al., 1994). The intent of this
study was to develop a standard LTASS that would represent a wide range of languages, or to
identify any significant differences that exist among languages. Toward this goal, the LTASS
and dynamic range of speech were measured for 12 languages. The overall finding was that the
LTASS was essentially similar across all languages included in the study. Most language/dialect
differences yielded less than 3 dB differences in spectral levels, and the authors did not find any
obvious explanations even for the few statistically significant differences. Males had higher
intensities at 160 Hz and below, which is expected due to a lower fundamental frequency of the
male voice. Males and female vocal levels were virtually identical from 250 Hz to 5000 Hz, and
female voices contained more energy at 6300 Hz and higher. The authors concluded that a
“universal LTASS” would be representative of most languages, due to the similarity found
across all speech samples. More recently, Holube, Fredelake, Vlaming, and Kollmeier, (2010)
published a report on the development of an International Speech Test Signal (ISTS) for
analyzing how a hearing aid processes speech signals. The ISTS was developed using
7
recordings of real speech in six different languages. The intent was to develop a test signal that
contained all relevant characteristics of natural speech, but was predominantly unintelligible.
2.2 SPEECH PRODUCTION IN NOISE
2.2.1 The Lombard effect
First described by Etienne Lombard in 1911 (as cited in Lane and Tranel, 1971), the Lombard
effect is usually described as the spontaneous tendency to increase one’s vocal intensity when
talking in the presence of strong background noise. The original use of “Lombard Masking” was
to uncover phonation in patients with functional aphonia. It was observed that for some patients
with weak voices, masking often seemed to “energize” the voice (i.e., masking was used to
uncover a better, louder voice). The Lombard effect also has reportedly been used to assist in the
treatment of stuttering (e.g., Howell, 1990), since some stutterers reduce the frequency of
stuttering under noisy conditions. Additional research using the Lombard effect has involved
voice disorders resulting from other conditions such as Parkinson’s disease (e.g., Ho, Bradshaw,
Inasek, & Alfredson, 1999) and spasmodic dysphonia (e.g., McColl & McCaffrey, 2006).
Audiologists typically learn about the Lombard effect when studying tests for patients
with non-organic hearing loss (Newby, 1979). Theoretically, an individual should not change
vocal intensity unless the background noise is well above his/her hearing threshold. Therefore,
the Lombard test is performed by having the patient read a passage aloud while masking noise is
played through headphones, and the clinician monitors the patient’s voice level. The masking
noise is gradually increased, and a corresponding increase in vocal level should only occur when

8
the masking noise exceeds the patient’s admitted hearing threshold level. Unfortunately, the
Lombard test has limited diagnostic value because even if the Lombard effect is observed, this
only proves that the person heard the masking noise -- it does not provide an estimate of the
person’s true hearing thresholds. Hanley and Harvey (1965) worked on a technique to
objectively score the Lombard test; however, their method was never fully developed and it
never gained widespread clinical acceptance.
Pick, Siegel, Fox, Garber, and Kearney (1989) investigated a person’s ability to suppress
the Lombard effect in a three-part experiment. First, they observed a stable and robust Lombard
effect over repeated exposures to quiet and noise conditions, which suggested that the increased
vocal level in noise is automatic and difficult to suppress. Next, they found that when given
instructions to resist talking louder, experienced/sophisticated subjects were better able to
maintain a constant vocal level than naïve subjects; however, none of the subjects were able to
suppress the Lombard effect completely, even when instructions were combined with a visual
feedback display. The final component of their experiment used a single-subject format
involving more intensive training and instructions in the use of visual feedback. Visual feedback
was successful in teaching the subjects to lower their vocal output, and the lower vocal
intensities were still observed when the feedback was removed. However, the subjects
essentially “overcompensated” and carried over the tendency to speak more softly in a quiet
environment. Therefore, rather than learning to talk softly (i.e., suppress the Lombard effect) the
subjects may have just shifted their overall vocal level downward in both noise and in quiet.
Although these results generally suggest a non-voluntary origin, it is still not clear whether the
Lombard effect is the result of an “automatic” regulating mechanism (i.e., the talker cannot
simply ignore the background noise) or whether speakers learn to increase their vocal intensity to

9
avoid a communication breakdown (i.e., the talker knows that he/she will be misunderstood if
his/her voice is not raised). The Lombard effect varies with the social context and speaker task,
which would indicate that regulation of speech amplitude is not just a simple auditory feedback
mechanism (Amazi & Garber, 1982; Garnier, Henrich, & Dubois, 2010).
Winkworth and Davis (1997) studied the Lombard effect to examine whether respiratory
patterns during speech changed according to the level of background noise. They used five
healthy women subjects and measured respiratory function with two pairs of linearized
magnetometers placed on the rib cage and abdomen. A multi-talker babble played through
headphones was used as the background noise. Two speech tasks (a 30 second reading and a 2-3
minute spontaneous monologue) were recorded under three noise conditions (quiet, 55 dBA, and
70 dBA) for a total of six speech samples per subject. A robust Lombard effect was found for
these subjects, while no consistent trend of lung volume change was observed with the linear
increases in speech level. The authors concluded that since the subjects increased their speaking
level without being specifically instructed to do so, the loudness changes were produced by
individualized changes in breathing patterns for each subject.
Huber, Chandrasekaran, and Wolstencroft (2005) conducted a study to determine whether
speaking louder resulted in different respiratory kinematic patterns while reciting a 6-syllable
and a 12-syllable sentence. This investigation was prompted by the findings of Winkworth and
Davis (1997) that showed that an individual’s respiratory kinematics might change, based on the
cue used to illicit the louder speech. The Huber et al. (2005) study investigated the differences if
the subject was asked to speak louder or if he/she automatically spoke louder due to noise in the
background. They found that asking subjects to target a specific sound level 10 dB above
comfortable, asking them to speak twice as loud as is comfortable, and asking them to speak in

10
70 dBA multi-talker babble all resulted in the same sound pressure level output. The respiratory
kinematic measurements revealed that different mechanisms were responsible in each condition.
Subjects used a combination of increased recoil pressures and increased expiratory muscle
tension when asked to speak in the background noise. A slower speech rate also was observed in
this condition.
A follow-on study was reported by Huber (2007) where she used the same basic
procedures as in Huber et al. (2005) using a connected speech task as opposed to the two
sentences from the earlier study. A second purpose was to examine whether the type of speech
task affected respiratory kinematics at a comfortable speaking level and in 70 dBA multi-talker
babble. The same differences in respiratory strategies for the different test conditions (as seen in
the previous study) were observed. Huber (2007) suggested that different cues to increase
loudness – i.e., the intention/goal of the talker – play a role in the control of respiratory kinematic
movements.
2.2.2 Other vocal characteristics
In addition to investigating overall sound pressure level changes caused by high ambient noise
levels, other studies involving Lombard speech have examined vocal characteristics such as
changes in fundamental frequency, spectrum content, and speaking rate. In general, a talker’s
fundamental frequency increases, the spectrum content shifts to higher frequencies, and the
speaking rate decreases in the presence of background noise. An earlier study involving
communication in noise found that a subject will perform such changes without having been
trained to do so (Hanley & Steer, 1949).
11
Rivers and Rastatter (1985) examined how white noise and multi-talker babble (both
presented at 90 dB SPL) influenced the fundamental frequency of children and adults. All
subjects increased their mean fundamental frequency under both masking conditions. With a
few exceptions, larger standard deviations were found when subjects spoke in the noise
conditions as compared to speaking in quiet. A follow-on study (Loren, Colcord, & Rastatter,
1986) was conducted to further assess the effects of speaking against a background of white
noise on the variability of an individual’s fundamental frequency. Consistent with the earlier
study, the mean fundamental frequency increased when subjects spoke while listening to the
white noise.
Summers, Pisoni, Bernacki, Pedlow, and Stokes (1988) reported on a study that was
intended to specify the gross acoustic-phonetic changes that take place when speech is produced
in high levels of noise (e.g., in an aircraft cockpit). In the first part of this study, two male
subjects read aloud words from the Air Force speech recognition vocabulary under four
background noise conditions (quiet, 80 dB, 90 dB, and 100 dB of broadband masking noise).
The subjects were instructed to read each word as clearly as possible while the experimenter
listened and recorded their speech. Reliable and consistent differences were found between the
quiet and noise conditions. As expected, results were consistent with earlier studies reporting
changes in prosodic features (e.g., increases in word duration, vocal intensity, and high
frequency content). Additionally, the authors reported changes in the pattern of vowel formant
frequencies.
An experiment was performed a few years later (Tartter, Gomes, & Litwin, 1993) to
replicate and expand upon the 1988 Air Force study. As found in earlier studies, their frequency
analysis indicated a flatter tilt in speech spectrums obtained for subjects talking in the high noise

12
condition, which means that there was an increase in the amplitude of high frequencies. This
study also replicated the effect of talking in noise on speech duration and amplitude, both of
which increased with higher background noise levels. Significant changes in F1 and F2 were
observed for some words but not others.
Bond, Moore, and Gable (1989) studied several prosodic and acoustic properties of
speech in four subjects listening to 95 dB pink noise under headphones. In addition to increased
amplitude (the Lombard effect), they found increases in fundamental frequency, vowel duration,
and a shift in the F1-F2 vowel quadrilateral. The differences in vowel production were attributed
to adjustments in lower jaw position and mouth opening when speaking in the presence of noise.
Another study was conducted to determine the speech rate, vocal pitch, overall sound
pressure level, and spectral characteristics of connected Lombard speech (Letowski, Frank, &
Caravella, 1993). These researchers used multi-talker babble, traffic noise, and a wideband (flat
spectrum) noise presented at 70 dB and 90 dB. They investigated the differences among talkers
in the different noise conditions as compared to their speech produced in quiet. Consistent with
other studies, they found an increase in overall sound pressure level and higher vocal pitch in
Lombard speech as compared to speech produced in quiet. Unlike other studies, they did not
find significant differences in overall voice level for the three noise types or decreased speech
rate.
2.2.3 Summary
Table 1 summarizes the pertinent findings of the most significant studies reviewed in this
section.
13
Table 1. Studies involving speech production in noise.
Study Research Objective Subjects Indep. Variables Dependent Variables Relevant Findings
Lane & Tranel (1971)
Review article of previous research involving the role of hearing in speech production, specifically the Lombard Effect
Talkers spontaneously raise vocal intensity when talking in the presence of background noise; authors suggested this is learned in an attempt for the talker to be heard over the noise
Pick et al. (1989)
Test robustness of the Lombard Effect when subjects are given instructions to suppress it
Experienced and naïve listeners (24 - all normal-hearing)
Quiet vs. 90 dB SPL background noise; visual feedback
Vocal intensity levels The Lombard Effect is very stable; subjects could inhibit the Lombard effect in trained/sophisticated subjects; findings suggest that it is an automatic normalization response
Winkworth & Davis (1997)
Examine changes in respiratory patterns during speech production
5 normal-hearing females
Quiet, 55 dB multi-talker noise, and 70 dB multi-talker noise
Speech intensity, lung volumes, speech breath durations, rib cage and abdominal changes
No consistent trend of lung volume change was observed with the Lombard effect; loudness changes were produced by individualized changes in breathing patterns for each subject
Huber et al. (2005) and Huber (2007)
Investigate how cues affect respiratory function in normal speakers, in order to identify the best cues for clinical treatment (i.e., to increase loudness) in patients with reduced vocal outputs
30 normal-hearing adults (15 male and 15 female)
Comfortable reading level; 10 dB above comfortable level; twice the comfortable level; 70 dB multi-talker noise
Speech SPLs; maximal capacity of lungs, rib cage, and abdomen
Respiratory mechanisms used to increase loudness differed depending how the increase in loudness was elicited; different cues resulted in different internal targets; neural control of the respiratory system for speech is affected by changes to the talker’s internal loudness target; the talker’s intention or goals play a role in the control of respiratory function during speech
Hanley & Steer (1949)
Determine the need for training individuals who will be using radio-telephone communication systems
48 male college students
Four levels of airplane-type noise
Words spoken per minute, mean syllable duration, speech intensity level
Untrained subjects speaking in noise naturally react in a desirable manner – they reduce speaking rate, prolong syllables, and speak louder
14
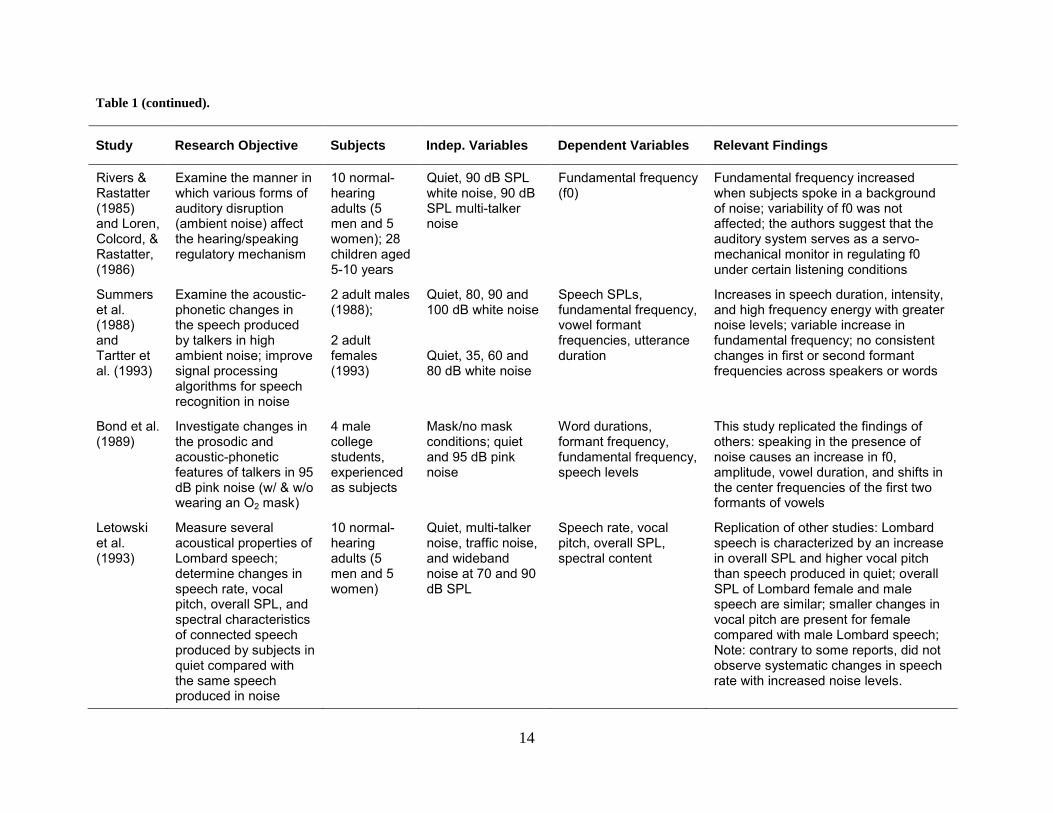
Table 1 (continued).
Study Research Objective Subjects Indep. Variables Dependent Variables Relevant Findings
Rivers & Rastatter (1985) and Loren, Colcord, & Rastatter, (1986)
Examine the manner in which various forms of auditory disruption (ambient noise) affect the hearing/speaking regulatory mechanism
10 normal-hearing adults (5 men and 5 women); 28 children aged 5-10 years
Quiet, 90 dB SPL white noise, 90 dB SPL multi-talker noise
Fundamental frequency (f0)
Fundamental frequency increased when subjects spoke in a background of noise; variability of f0 was not affected; the authors suggest that the auditory system serves as a servo-mechanical monitor in regulating f0 under certain listening conditions
Summers et al. (1988) and Tartter et al. (1993)
Examine the acoustic-phonetic changes in the speech produced by talkers in high ambient noise; improve signal processing algorithms for speech recognition in noise
2 adult males (1988); 2 adult females (1993)
Quiet, 80, 90 and 100 dB white noise Quiet, 35, 60 and 80 dB white noise
Speech SPLs, fundamental frequency, vowel formant frequencies, utterance duration
Increases in speech duration, intensity, and high frequency energy with greater noise levels; variable increase in fundamental frequency; no consistent changes in first or second formant frequencies across speakers or words
Bond et al. (1989)
Investigate changes in the prosodic and acoustic-phonetic features of talkers in 95 dB pink noise (w/ & w/o wearing an O2 mask)
4 male college students, experienced as subjects
Mask/no mask conditions; quiet and 95 dB pink noise
Word durations, formant frequency, fundamental frequency, speech levels
This study replicated the findings of others: speaking in the presence of noise causes an increase in f0, amplitude, vowel duration, and shifts in the center frequencies of the first two formants of vowels
Letowski et al. (1993)
Measure several acoustical properties of Lombard speech; determine changes in speech rate, vocal pitch, overall SPL, and spectral characteristics of connected speech produced by subjects in quiet compared with the same speech produced in noise
10 normal-hearing adults (5 men and 5 women)
Quiet, multi-talker noise, traffic noise, and wideband noise at 70 and 90 dB SPL
Speech rate, vocal pitch, overall SPL, spectral content
Replication of other studies: Lombard speech is characterized by an increase in overall SPL and higher vocal pitch than speech produced in quiet; overall SPL of Lombard female and male speech are similar; smaller changes in vocal pitch are present for female compared with male Lombard speech; Note: contrary to some reports, did not observe systematic changes in speech rate with increased noise levels.

15
2.3 EFFECT OF “LOUD SPEECH” AND NOISE ON INTELLIGIBILITY
A few of the earliest studies found a linear relationship between speech presentation level and
recognition performance. Hawkins and Stevens (1950) reported that speech intelligibility
thresholds were raised by 10 dB by each 10 dB increase in noise level. However, most of the
subsequent studies have found an inverse relation between presentation level and recognition
performance. Pickett (1956) found that speech intelligibility scores dropped significantly when
phonetically balanced test words were recorded with a strong vocal force. In this study, speech
was elicited from subjects at eight levels ranging from very soft to loud shouting. Intelligibility
dropped off significantly as the vocal effort increased from “very loud” (78 dB) to “maximum
shout” (90 dB). Data for specific voice parameters were not collected, although shouting
degraded the initial and final parts of a syllable rather than the middle section. When produced
with a shouted voice, the intelligibility of vowels with higher first formant frequencies was less
than for vowels with lower first formant frequencies (Pickett, 1956).
Studies have demonstrated that intelligibility suffers when speech is presented at higher-
than-normal levels. Intelligibility also decreases when loud speech is produced in quiet
conditions but is not as affected when spoken in background noise. French and Steinberg (1947)
reported decreases in intelligibility when the presentation level was much higher than a normal
vocal level, without any background noise. Dreher and O’Neill (1957) reported that a talker
producing speech while listening to masking noise is more intelligible than when his speech is
produced in quiet. Pollack and Pickett (1958) found decreases in intelligibility when speech was
presented at very high levels (up to 130 dB) without background noise.
16
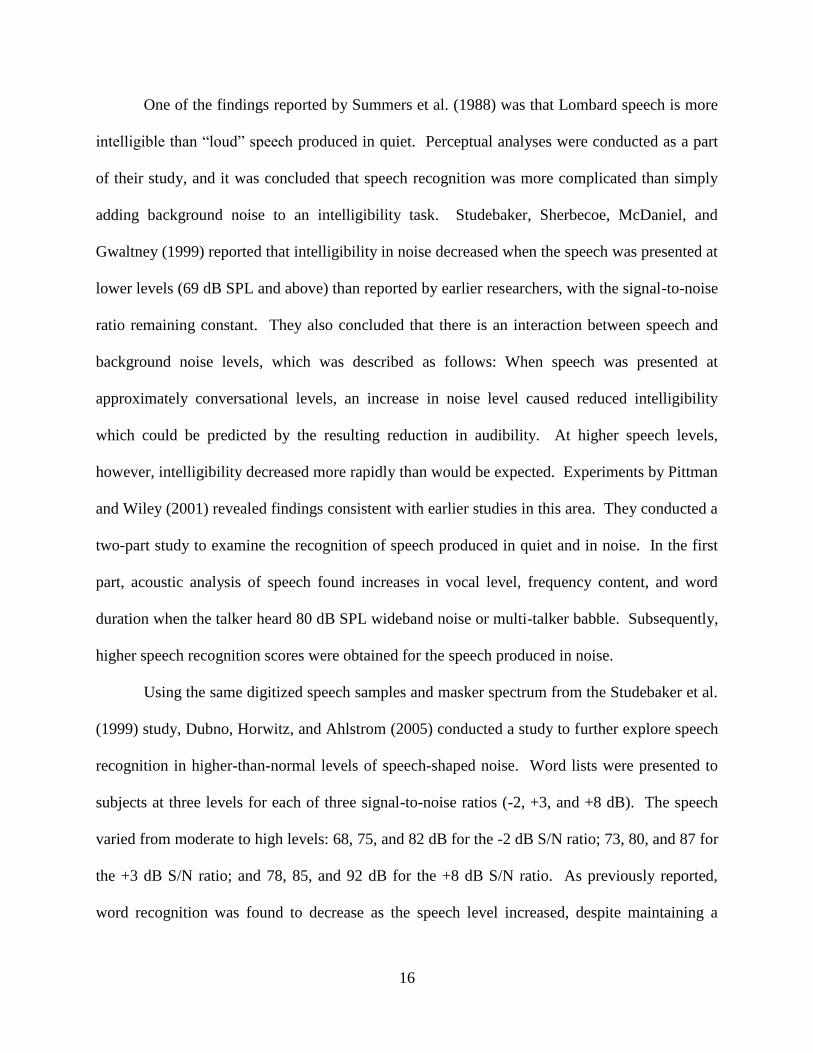
One of the findings reported by Summers et al. (1988) was that Lombard speech is more
intelligible than “loud” speech produced in quiet. Perceptual analyses were conducted as a part
of their study, and it was concluded that speech recognition was more complicated than simply
adding background noise to an intelligibility task. Studebaker, Sherbecoe, McDaniel, and
Gwaltney (1999) reported that intelligibility in noise decreased when the speech was presented at
lower levels (69 dB SPL and above) than reported by earlier researchers, with the signal-to-noise
ratio remaining constant. They also concluded that there is an interaction between speech and
background noise levels, which was described as follows: When speech was presented at
approximately conversational levels, an increase in noise level caused reduced intelligibility
which could be predicted by the resulting reduction in audibility. At higher speech levels,
however, intelligibility decreased more rapidly than would be expected. Experiments by Pittman
and Wiley (2001) revealed findings consistent with earlier studies in this area. They conducted a
two-part study to examine the recognition of speech produced in quiet and in noise. In the first
part, acoustic analysis of speech found increases in vocal level, frequency content, and word
duration when the talker heard 80 dB SPL wideband noise or multi-talker babble. Subsequently,
higher speech recognition scores were obtained for the speech produced in noise.
Using the same digitized speech samples and masker spectrum from the Studebaker et al.
(1999) study, Dubno, Horwitz, and Ahlstrom (2005) conducted a study to further explore speech
recognition in higher-than-normal levels of speech-shaped noise. Word lists were presented to
subjects at three levels for each of three signal-to-noise ratios (-2, +3, and +8 dB). The speech
varied from moderate to high levels: 68, 75, and 82 dB for the -2 dB S/N ratio; 73, 80, and 87 for
the +3 dB S/N ratio; and 78, 85, and 92 dB for the +8 dB S/N ratio. As previously reported,
word recognition was found to decrease as the speech level increased, despite maintaining a

17
constant signal-to-noise ratio. The authors attributed this finding to a non-linear growth in
masking and a reduced effective signal-to-noise ratio with the higher masker levels.
Not all studies reported the same findings as discussed so far. While studying the
Lombard effect as it relates to automatic speech recognition systems, Junqua (1993) reported that
the type of masking noise, the test materials, and the talker’s gender were found to influence
speech intelligibility. Using single digits (i.e., the numbers 0 to 9) as the test stimuli,
intelligibility scores were lower against a multi-talker babble, as compared to the scores when
white noise was used as the masker. Conversely, intelligibility was higher for the multi-talker
babble condition when the test stimuli were an easily confusable letter/number list (b, c, d, e, g,
p, t, v, z, and the number 3), as compared to the white noise masking condition. He observed
that a white noise spectrum affected consonant sounds more than multi-talker babble did, while
the multi-talker babble affected the vowel sounds to a greater extent. Females were found to be
more intelligible than males when evaluating speech production in noise, which was the opposite
for speech produced in quiet. Junqua (1993) also concluded that the Lombard effect is highly
variable among different talkers. The findings in this study differ from the previously discussed
studies in that intelligibility decreased for speech produced in 85 dB SPL white noise as
compared to the same speech produced in quiet.
A related concern for speech communication in high noise environments is the potential
adverse effect on the talker’s vocal mechanism. Pickett (1956) reported that the maximum
shouting level was 100-105 dB SPL, while the loudest level that could be sustained without
painful voice fatigue was 90 dB. Newer research found similar voice levels (Olsen, 1998;
Cushing, Li, Cox, Worrall, & Jackson, 2011). Most individuals are unlikely to continue talking
at such a high level for more than a brief period of time. Voice problems are common among

18
teachers, singers, and other occupations that involve public speaking (e.g., Verdolini & Ramig,
2001), although little has been reported specifically on vocal pathology in noise-exposed
workers. An example of research applicable to this issue involves a project supported by the
Swedish Council for Working Life and Social Research that investigated health risks caused by
overly loud phonation. Sodersten, Ternstrom, and Bohman (2005) used a method to prevent the
competing noise from contaminating the recorded speech signal during speech-production-in-
noise voice analysis to study voice production in four different types/levels of environmental
noise. They found the same types of acoustic changes as reported previously, and also reported
on a subjective perceptual analysis including vocal fry, strain, press, instability, and roughness.
The same subjects participated in a companion experiment to develop an acoustic description of
overloaded voice (Ternstrom, Bohman, & Sodersten, 2006). This study found that high
frequency content will reach a maximum as the overall SPL of an individual’s voice is increased.
A later article on this subject (Aronsson, Bohman, Ternstrom,& Sodersten, 2007) verified that
speaking in background noise may lead to voice disorders (e.g., vocal nodules). They also noted
that mechanical stress on the vocal folds may occur when speaking in background noise levels
that are several decibels less than those considered as hazardous to an individual’s hearing.
More recently, a project conducted by the Technical University of Denmark and the
Voice Research Group at the Department of Logopedics, Phoniatrics and Audiology at Lund
University investigated how teachers use their voices in relation to the acoustic properties of the
classroom and whether speakers take auditory cues into account to regulate their voice levels
(Brunskog, Gade, Bellester, & Calbo, 2009; Pelegrin-Garcia, 2011; Pelegrin-Garcia, Fuentes-
Mendizabal, Brunskog, & Jeong, 2011). Among other findings, this line of research developed
new acoustic measures (i.e., voice support and room gain) that are well correlated with the

19
changes in voice level observed in rooms with differing acoustical attributes. Their findings also
support the idea that a room’s acoustics has an effect on voice production, most notably that high
background noise levels induce an increase in vocal effort.
Table 2 summarizes the pertinent findings of the most significant journal articles
regarding the effect of loud speech and noise on speech intelligibility.
20
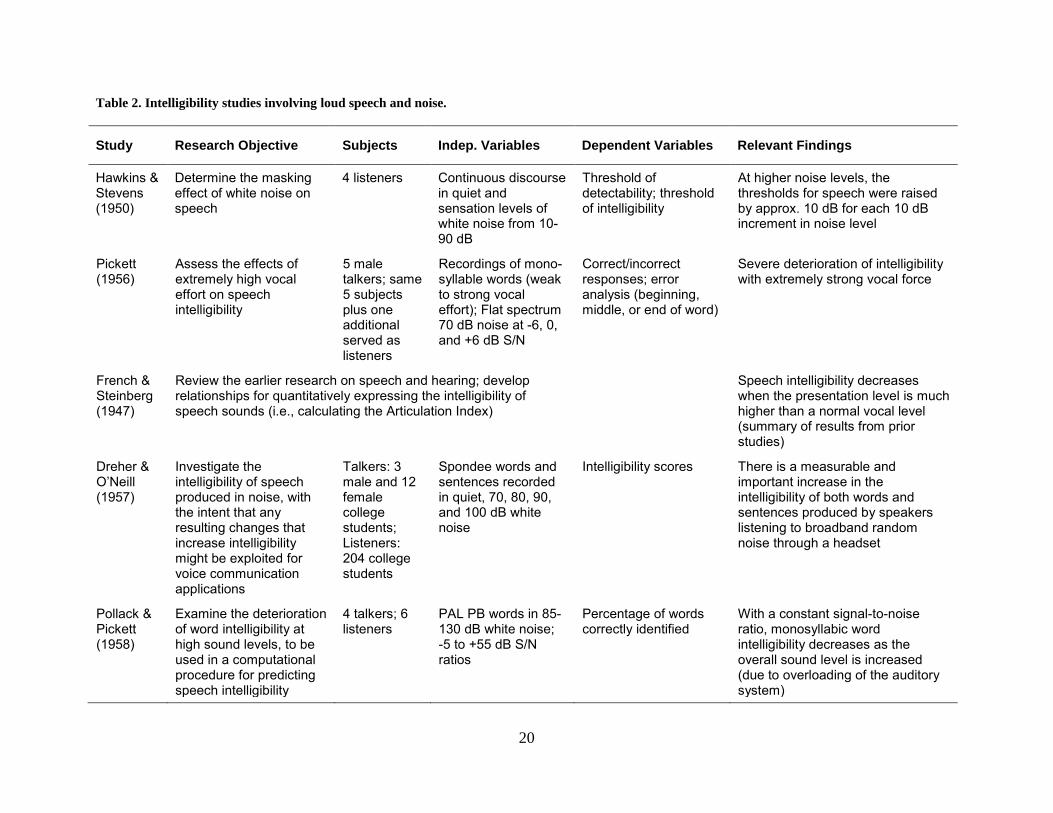
Table 2. Intelligibility studies involving loud speech and noise.
Study Research Objective Subjects Indep. Variables Dependent Variables Relevant Findings
Hawkins & Stevens (1950)
Determine the masking effect of white noise on speech
4 listeners Continuous discourse in quiet and sensation levels of white noise from 10-90 dB
Threshold of detectability; threshold of intelligibility
At higher noise levels, the thresholds for speech were raised by approx. 10 dB for each 10 dB increment in noise level
Pickett (1956)
Assess the effects of extremely high vocal effort on speech intelligibility
5 male talkers; same 5 subjects plus one additional served as listeners
Recordings of mono-syllable words (weak to strong vocal effort); Flat spectrum 70 dB noise at -6, 0, and +6 dB S/N
Correct/incorrect responses; error analysis (beginning, middle, or end of word)
Severe deterioration of intelligibility with extremely strong vocal force
French & Steinberg (1947)
Review the earlier research on speech and hearing; develop relationships for quantitatively expressing the intelligibility of speech sounds (i.e., calculating the Articulation Index)
Speech intelligibility decreases when the presentation level is much higher than a normal vocal level (summary of results from prior studies)
Dreher & O’Neill (1957)
Investigate the intelligibility of speech produced in noise, with the intent that any resulting changes that increase intelligibility might be exploited for voice communication applications
Talkers: 3 male and 12 female college students; Listeners: 204 college students
Spondee words and sentences recorded in quiet, 70, 80, 90, and 100 dB white noise
Intelligibility scores There is a measurable and important increase in the intelligibility of both words and sentences produced by speakers listening to broadband random noise through a headset
Pollack & Pickett (1958)
Examine the deterioration of word intelligibility at high sound levels, to be used in a computational procedure for predicting speech intelligibility
4 talkers; 6 listeners
PAL PB words in 85-130 dB white noise; -5 to +55 dB S/N ratios
Percentage of words correctly identified
With a constant signal-to-noise ratio, monosyllabic word intelligibility decreases as the overall sound level is increased (due to overloading of the auditory system)
21
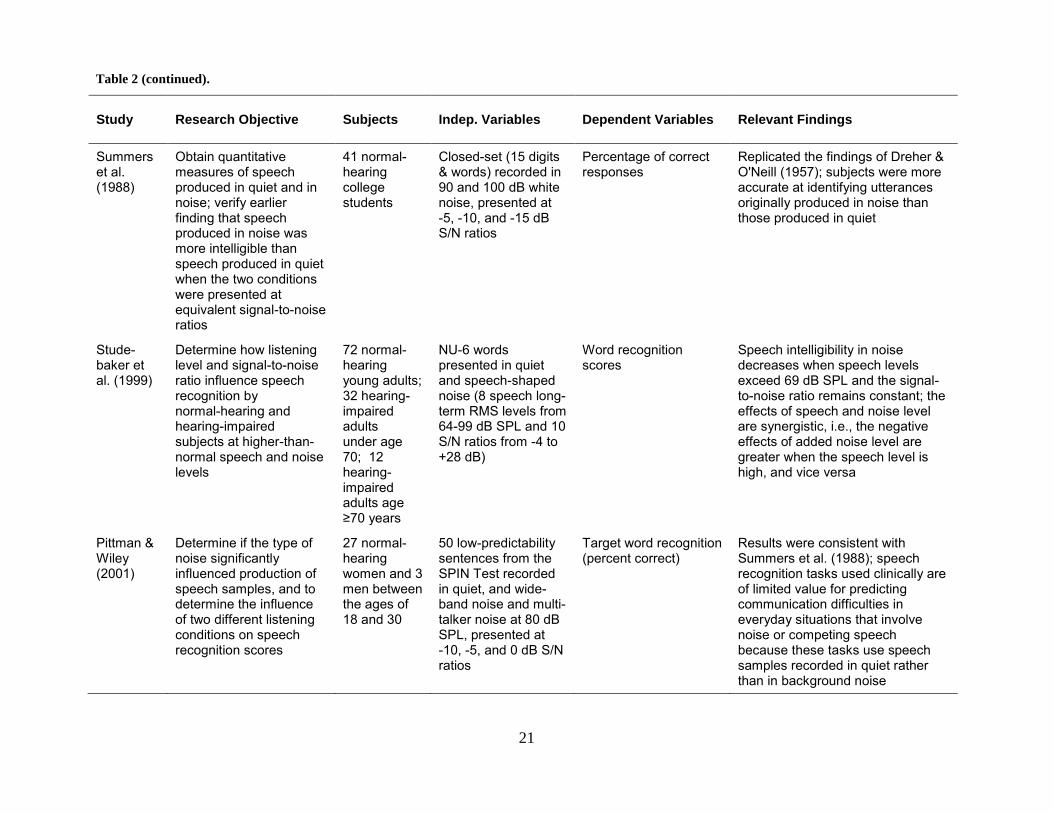
Study Research Objective Subjects Indep. Variables Dependent Variables Relevant Findings
Summers et al. (1988)
Obtain quantitative measures of speech produced in quiet and in noise; verify earlier finding that speech produced in noise was more intelligible than speech produced in quiet when the two conditions were presented at equivalent signal-to-noise ratios
41 normal-hearing college students
Closed-set (15 digits & words) recorded in 90 and 100 dB white noise, presented at -5, -10, and -15 dB S/N ratios
Percentage of correct responses
Replicated the findings of Dreher & O'Neill (1957); subjects were more accurate at identifying utterances originally produced in noise than those produced in quiet
Stude-baker et al. (1999)
Determine how listening level and signal-to-noise ratio influence speech recognition by normal-hearing and hearing-impaired subjects at higher-than-normal speech and noise levels
72 normal-hearing young adults; 32 hearing-impaired adults under age 70; 12 hearing-impaired adults age ≥70 years
NU-6 words presented in quiet and speech-shaped noise (8 speech long-term RMS levels from 64-99 dB SPL and 10 S/N ratios from -4 to +28 dB)
Word recognition scores
Speech intelligibility in noise decreases when speech levels exceed 69 dB SPL and the signal-to-noise ratio remains constant; the effects of speech and noise level are synergistic, i.e., the negative effects of added noise level are greater when the speech level is high, and vice versa
Pittman & Wiley (2001)
Determine if the type of noise significantly influenced production of speech samples, and to determine the influence of two different listening conditions on speech recognition scores
27 normal-hearing women and 3 men between the ages of 18 and 30
50 low-predictability sentences from the SPIN Test recorded in quiet, and wide-band noise and multi-talker noise at 80 dB SPL, presented at -10, -5, and 0 dB S/N ratios
Target word recognition (percent correct)
Results were consistent with Summers et al. (1988); speech recognition tasks used clinically are of limited value for predicting communication difficulties in everyday situations that involve noise or competing speech because these tasks use speech samples recorded in quiet rather than in background noise
Table 2 (continued).
22
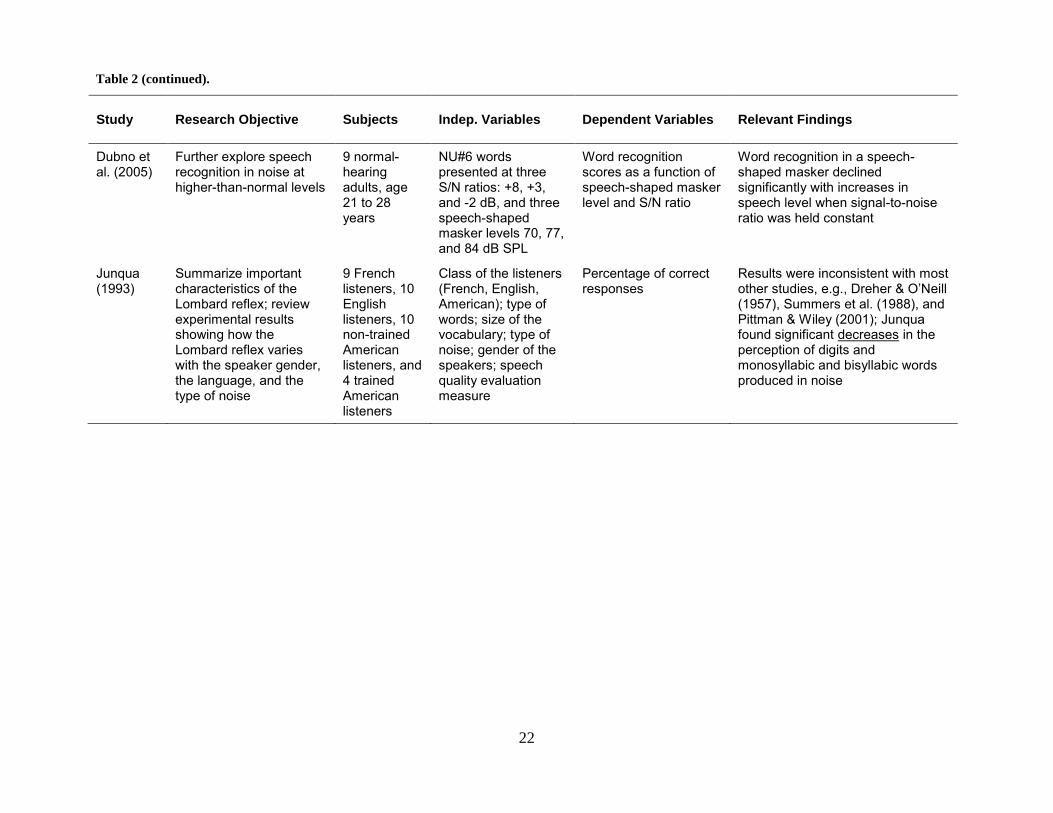
Study Research Objective Subjects Indep. Variables Dependent Variables Relevant Findings
Dubno et al. (2005)
Further explore speech recognition in noise at higher-than-normal levels
9 normal-hearing adults, age 21 to 28 years
NU#6 words presented at three S/N ratios: +8, +3, and -2 dB, and three speech-shaped masker levels 70, 77, and 84 dB SPL
Word recognition scores as a function of speech-shaped masker level and S/N ratio
Word recognition in a speech-shaped masker declined significantly with increases in speech level when signal-to-noise ratio was held constant
Junqua (1993)
Summarize important characteristics of the Lombard reflex; review experimental results showing how the Lombard reflex varies with the speaker gender, the language, and the type of noise
9 French listeners, 10 English listeners, 10 non-trained American listeners, and 4 trained American listeners
Class of the listeners (French, English, American); type of words; size of the vocabulary; type of noise; gender of the speakers; speech quality evaluation measure
Percentage of correct responses
Results were inconsistent with most other studies, e.g., Dreher & O’Neill (1957), Summers et al. (1988), and Pittman & Wiley (2001); Junqua found significant decreases in the perception of digits and monosyllabic and bisyllabic words produced in noise
Table 2 (continued).
23
2.4 MEASUREMENT OF SPEECH INTELLIGIBILITY
2.4.1 Word tests
As an extension of the previous section, the type of test is another potentially important factor to
consider when evaluating/conducting speech intelligibility studies. Speech intelligibility can be
measured using various methodologies. Test protocols may contain varying types, numbers, and
levels of independent variables including hearing status of the subjects, signal presentation level,
speech-to-noise ratio, test methods (linguistic unit, cultural sophistication of listeners, response
set, and/or psychophysical procedure), background noise masker, reverberation time, and
whether hearing protection is being worn. Although numerous tests have been developed over
the years, only the most commonly used tests are included in this review, and the (generally)
commercially available tests are summarized in Table 3 at the end of this section.
The earliest tests were typically called articulation tests, and essentially described the
relationship between the percentage of speech units correctly understood and the presentation
level. This work was initiated by the need to develop specifications for speech transmission
systems such as the telephone, interphones, and two-way radios. Working at the Bell Telephone
Laboratories, Fletcher and Steinberg (1929, 1930) first summarized the development of lists of
consonant-vowel-consonant (CVC) nonsense words and lists of discrete sentences. They noted
that syllable discrimination scores compared well with sentence intelligibility scores, although
when syllable discrimination was low the score for discrete sentences would be higher.
24
Egan (1948) reported on the development of speech test materials at the Harvard Psycho-
Acoustic Laboratories (PAL) during World War II. Syllable lists consisting of VC, CV, and
CVC words were created by pairing of consonants and vowels, with care taken to remove
syllables that sounded like undesirable words and those that were difficult to pronounce. After
much revision, 20 lists of 50 phonetically balanced monosyllabic words (PAL PB-50) were
created. These lists were used to test for speech intelligibility and syllable recognition over
various communication systems. The first American Standard Method for Measurement of
Monosyllabic Word Intelligibility (American Standards Association, S3.2-1960) contained the
PAL PB-50 word lists as test materials. After World War II, these lists would be used to
evaluate the speech understanding ability of hearing-impaired soldiers and veterans.
Problems with the PB-50 word lists were identified as they were used clinically. Hirsh et
al. (1952) attempted to improve on these clinical deficiencies, particularly to develop lists with
more familiar words and produce suitably standardized recordings. A total of 200 words (four
lists of 50 each) were used – 120 words from the original PB-50 lists plus an additional 80
words. Construction of the word lists was constrained by ensuring only monosyllabic words
were used, no words were repeated in different lists, the words must be commonly used to
minimize the effects of educational background of test subjects, and the phonetic composition of
each list must correspond with the English language as closely as possible. This work was
performed at the Central Institute for the Deaf, and the refinement of the PB-50 word lists
became known as the CID Auditory Test W-22.
In an effort to eliminate the need for word familiarity and to reduce the influence of
linguistic factors, Fairbanks (1958) and his colleagues developed the closed-set Rhyme Test.
Testing in this manner evaluates phonemic differentiation rather than word recognition. Fifty

25
sets of five monosyllabic rhyming words each were compiled. Within each set, the five words
differed in initial consonant phoneme and spelling. Subjects were given a response sheet with 50
word “stems” (i.e., the rhyming portion), and the task was to enter the first letter to complete the
spelling of the word that was heard. For example, for the “__ot” word stem, the listener might
expect to hear hot, got, not, pot, or lot. The concepts of phonetic balancing and use of common
words were carried over from the PB-50 and CID W-22 word lists.
Lehiste and Peterson (1959) developed 10 new lists of 50 monosyllabic words, which
were referred to as consonant-nucleus-consonant (CNC) words since the middle vowel sound
was called the “syllable nucleus.” Instead of using the term phonetically balanced, they
introduced “perceptual phonetics” or “phonemics,” and asserted that the word lists should be
described as being phonemically balanced. This is based on the concept that individual speech
sounds will vary depending on the surrounding speech sounds. A few years later the CNC lists
were revised to eliminate some rare and so-called literary words as well as two proper names that
were in the original lists (Peterson & Lehiste, 1962).
Tillman and Carhart (1966) developed a new test using consonant-nucleus-consonant
(CNC) monosyllabic words from Peterson and Lehiste (1962). This new test was called the
Northwestern University (NU) Auditory Test No.6, which was an expansion of their earlier NU
Test No.4. The NU-4 list was deemed to be too restricted since it only had 100 words, so the
NU-6 test was constructed with 200 words divided into four phonemically equivalent 50-word
lists. Since their development, the NU-6 and CID W-22 word lists have been routinely used in
clinical audiologic testing. Audiologists commonly use only half lists (i.e., 25 words) to cut
down the administration time. However, reducing the number of test items increases the

26
variability and decreases test/re-test reliability (Thornton & Raffin, 1978; Walden, Schwartz,
Williams, Holum-Hardegen, & Crowley, 1983; Cherry & Rubinstein, 2005).
House, Williams, Hecker, and Kryter, (1965) were interested in using tests of speech
intelligibility to evaluate voice-communication systems. These authors cite problems with
earlier speech intelligibility and articulation tests, such as their time-consuming nature and the
requirement for listeners to be thoroughly trained on the word lists. To avoid these issues, they
developed a closed-response-set test that has become known as the Modified Rhyme Test
(MRT). The test format is similar to the Fairbanks (1958) Rhyme Test; however, word
familiarity and phonetic balancing were not included in the MRT. Listeners are given an answer
sheet that contains a set of six possible word alternatives for each test item. When taking the
test, the listener indicates which one of the six choices was heard. Kreul et al. (1968) revised the
MRT specifically for conducting speech discrimination testing in audiology clinics. Some words
were replaced to eliminate potentially objectionable words and to reduce the number of times a
particular word appeared among the response options. The revised recordings included a
background noise so patients could be rank-ordered by their ability to discriminate speech under
“everyday listening conditions.” A relatively recent adaptation of the MRT was the addition of
response time measures and using a word-monitoring paradigm rather than the original closed-
set identification task (Mackersie, Neuman, & Levitt, 1999a, 1999b).
Another variation of a rhyming test called the Diagnostic Rhyme Test (DRT) was
developed by Voiers (1977, 1983). The DRT is similar to the MRT in that it employs a closed
response set of rhyming words, although the DRT uses a two-alternative forced-choice paradigm
whereas the MRT provides six alternatives from which to choose. The DRT provides an analysis
of the features of speech by providing possible response words that differ only by one distinctive

27
feature. For example, /d/ differs from /t/ only by voicing, so the words dense and tense are
paired as minimally contrasting response options for one test item. Test scores can therefore be
analyzed separately for listeners’ performance (understanding) for each feature of interest.
In 1989, the American Standard Method for Measurement of Monosyllabic Word
Intelligibility (American Standards Association, S3.2-1960) was revised and renamed as the
American National Standard Method for Measuring the Intelligibility of Speech Over
Communication Systems (ANSI S3.2-1989). This Standard (which was revised in 2009)
retained the original 1,000 PB-50 words (Egan, 1948) and added the Modified Rhyme Test
(House et al., 1965) and the Diagnostic Rhyme Test (Voiers, 1977). The MRT in ANSI S3.2 has
become the de facto standard test for much research-based (not clinical) speech intelligibility
testing, since it is required in many military research and testing applications.
Although no new tests have been added to ANSI S3.2 since 1989, other word recognition
tests have been developed in the past 24 years. In the early 1990s, the US Army used words
from Form C of the NU-6 test to develop the Speech Recognition in Noise Test (SPRINT;
described in Army Regulation 40-501, December 14, 2007). This test is administered to soldiers
with a significant hearing loss in order to provide a recommendation to Military Medical
Retention Boards regarding fitness for duty, assignment limitations, or discharge from the
service. The SPRINT words are pre-recorded in a background of multi-talker babble at a 9 dB
signal-to-noise ratio. Normal-hearing soldiers identify 95-100% of the words, whereas the
performance of soldiers with hearing loss was found to vary considerably. Also using words
from the NU-6 lists, Wilson (2003) developed the Words-in-Noise (WIN) test as a word-
recognition task in multi-talker babble. Intended for clinical use, the test presents words at seven
signal-to-noise ratios from 0 to 24 dB in 4-dB steps. Listener performance may be quantified by

28
a percent correct score at each signal-to-noise ratio, the overall percent correct, and the 50%
correct point on the signal-to-noise function. The 90th percentile (upper boundary of normal
performance) for normal-hearing listeners was defined as a 6 dB signal-to-noise ratio (Wilson &
McArdle, 2007).
Within the past decade or so, software-based word recognition tests such as the
Computer-Assisted Speech Perception Assessment (CASPA) Test have been developed and
evaluated (Mackersie, Boothroyd, & Minniear, 2001). The CASPA allows multi-level testing in
quiet and noise, and was originally designed to assess hearing aid outcome. Separate scoring by
words, phonemes, consonants, and vowels is provided. Phoneme scoring is desirable since it
effectively increases the number of test items, whereas a full-word test with the same number of
stimuli would require more time to administer. Computer-assisted tests such as the CASPA are
intended to facilitate easy scoring by individual phonemes.
One of the newest word tests designed for assessing speech intelligibility in noise is the
Callsign Acquisition Test (CAT; Blue, Ntuen, & Letowski, 2004; Rao & Letowski, 2006). This
test was developed at the Army Research Laboratory specifically for evaluating the capabilities
of various military communication systems in adverse listening environments. The CAT uses
the military phonetic alphabet (i.e., a two-syllable alphabet code) and single-syllable numbers to
form a three-syllable calling phrase (e.g., alpha-one, bravo-two, delta-six, etc.). Phonetic
alphabets are used to reduce between-letter confusions and improve performance for
interpersonal and radio communications.

29
2.4.2 Sentence tests
In addition to the numerous single-word tests that have been developed, sentence tests also have
been devised. Intuitively, using sentences as test materials makes sense since listening to
connected speech is a more realistic situation. Harris, Haines, Kelsey, and Clack (1961)
published an article that investigated the dependence of intelligibility on some electro-acoustic
characteristics of hearing aids. To conduct their experiments, they first had to decide the type of
speech material that should be used. They began with 100 sentences (10 sets of 10) developed
previously at the Central Institute for the Deaf, then revised the lists to make them all of equal
length, and added some additional sentences using the 500 key words from the original CID lists.
This new set became known as the revised CID (R-CID) sentence lists. Using low-pass filtering
at 420 Hz, an experiment conducted by Giolas and Duffy (1973) did not find equivalent test
scores for any of the original CID or R-CID sentence lists, and they concluded that the lists were
not appropriate for clinical use.
The Speech Intelligibility in Noise (SPIN) Test (Kalikow, Stevens, & Elliott, 1977) was
designed to examine linguistic-situational information in addition to the acoustic-phonetic
components of speech. Test sentences are presented in 12-talker babble, and the last word of the
sentence is the stimulus item, which is always a monosyllabic noun. Half of the sentences are
termed high predictability where the key word is somewhat predictable from the context, and
half are considered to be low predictability because the final word cannot be predicted from the
context. This test was later evaluated using hearing-impaired subjects in an attempt at
standardization and determination of list equivalence (Bilger, Neutzel, Rabinowitz, &
Rzeckowski, 1984).

30
The Connected Speech Test (CST) is a test of everyday speech that was developed for
use as a criterion measure when assessing hearing aid benefit (Cox, Alexander, & Gilmore,
1987). This test consists of passages of conversationally produced speech, where each passage
contains 25 key words. The goal was to develop a test with high content validity, a large number
of equivalent forms, and an acceptably small error of measurement. The inability of the SPIN
test to provide these last two items was cited as incentive for developing a new test.
Nilsson, Soli, and Sullivan (1994) developed the Hearing in Noise Test (HINT) for
measuring speech reception thresholds for sentences. Test materials were derived from the
Bamford-Kowal-Bench (BKB) sentences which were designed for use with British children.
The HINT consists of 24 equivalent 10-sentence lists that may be presented with speech-shaped
background noise. Operating instructions indicate that a fixed-level protocol and percent-correct
scoring may be used; however, this procedure may be subject to floor and ceiling effects on the
psychometric function. A preferred alternative is to administer the HINT using a modified
adaptive procedure and obtaining the speech reception threshold (i.e., 50% recognition point)
instead of recording the absolute number of correctly repeated sentences. When speech-shaped
noise is simultaneously played to the listener, test results are presented in terms of the signal-to-
noise ratio required to obtain the speech reception threshold.
The QuickSIN™ is another sentence-in-noise test that is scored as the signal-to-noise
ratio (in dB) required to achieve 50% recognition (Killion, Niquette, Gudmundsen, Revit, &
Banjerjee, 2004). This test is a modification of the original Speech-In-Noise (SIN) test
developed by Killion and Villchur (1993), which was later revised and renamed the RSIN test
(Cox, Gray, & Alexander, 2001). Sentences for the SIN, RSIN, and QuickSIN were obtained
from the Institute of Electrical and Electronics Engineers Recommended Practice for Speech
31
Quality Measurements (IEEE, 1969) which were derived from phonetically balanced sentences
developed at Harvard University during World War II. The IEEE sentences are syntactically
correct although they do not provide many contextual clues, so the listener is unlikely to
correctly guess the entire sentence if only a few words are accurately heard. The QuickSIN
contains six sentences with five key words per sentence pre-recorded in four-talker babble. The
sentences are presented in 5-dB steps from a signal-to-noise ratio of 25 dB down to 0 dB,
representing easy to difficult listening situations. In an effort to produce a test that was suitable
for evaluating children and cochlear implant users, the developers of the QuickSIN used the
same test paradigm to develop the Bamford-Kowal-Bench Speech-In-Noise (BKB-SIN) test
using the BKB sentences as used in the HINT (Etymotic Research, 2005).

32
Table 3. Commonly used (or commercially available) speech intelligibility tests.
Name Stimuli Background Condition Relevant Characteristics
CV, VC, and CVC
Syllable lists; nonsense words
Quiet Earliest tests performed; used to assess intelligibility over the telephone (not commercially available)
PAL PB-50 Monosyllabic words Quiet Word lists were intended to satisfy these criteria: equal average difficulty; equal range of difficulty; equal phonetic composition; representative of English speech; words in common usage
CID W-22 Monosyllabic words Quiet Modification of PAL PB-50; easier and more homogeneous word lists due to improved phonetic balancing and test item familiarity; recorded on magnetic tape which permitted construction of several versions (word orders) where all occurrences of the same word were identical
NU-6 Monosyllabic words Quiet Based primarily on the CNC words from Lehiste & Peterson (1959) and Peterson & Lehiste (1962); commonly used in audiology clinics; commercially available recordings by both male and female talkers
MRT Closed-set rhyme test
Quiet/noise Six-alternative forced-choice scoring; less time-consuming to administer than monosyllabic word lists; subjects not required to be trained on test materials
DRT Closed-set rhyme test
Quiet Similar to MRT using a two-alternative forced choice paradigm; can obtain a feature analysis of errors
SPRINT Monosyllabic words Multi-talker babble Used by the US Army to assess fitness-for-duty; words are pre-recorded in multi-talker babble at a 9 dB S/N ratio
WIN Monosyllabic words Multi-talker babble Intended for clinical use; words presented in multi-talker babble at different S/N ratios
CASPA CVC test stimuli Quiet/noise Designed to assess hearing aid outcome; computer-based; provides separate scores for words, phonemes, consonants, and vowels
CAT 3-syllable phrases Pink noise; white noise; multi-talker babble
Developed by the US Army; based on military-specific language
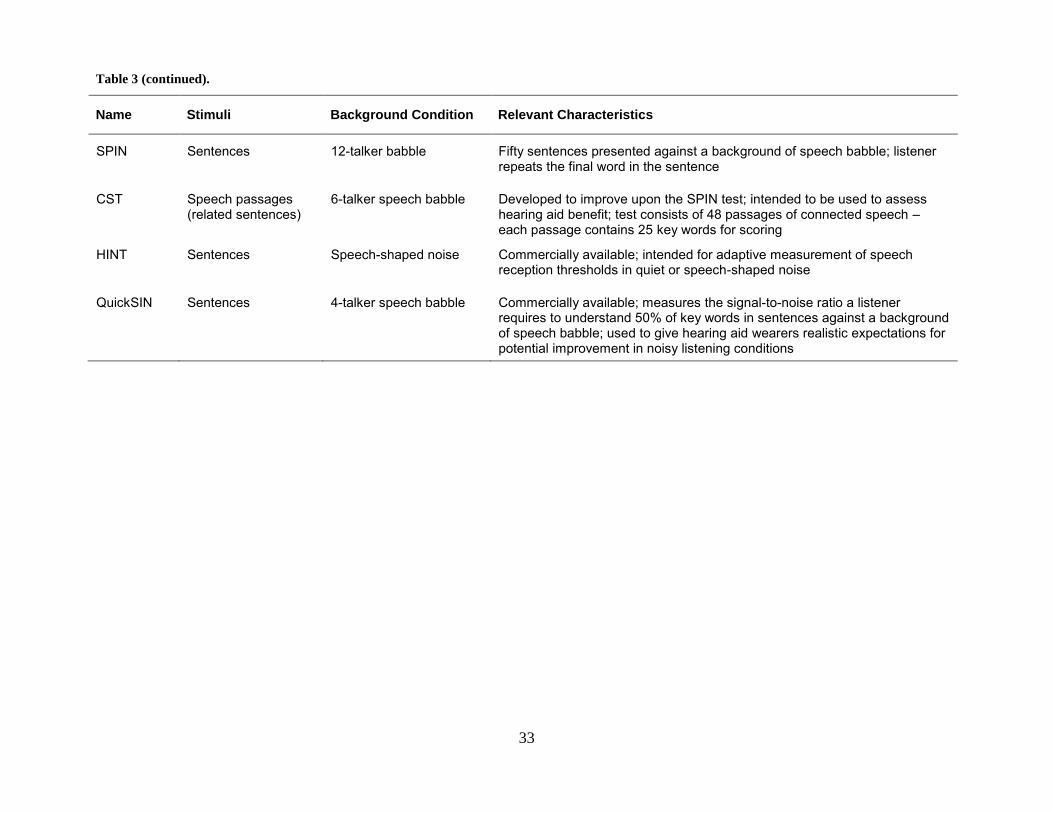
33
Name Stimuli Background Condition Relevant Characteristics
SPIN Sentences 12-talker babble Fifty sentences presented against a background of speech babble; listener repeats the final word in the sentence
CST Speech passages (related sentences)
6-talker speech babble Developed to improve upon the SPIN test; intended to be used to assess hearing aid benefit; test consists of 48 passages of connected speech – each passage contains 25 key words for scoring
HINT Sentences Speech-shaped noise Commercially available; intended for adaptive measurement of speech reception thresholds in quiet or speech-shaped noise
QuickSIN Sentences 4-talker speech babble Commercially available; measures the signal-to-noise ratio a listener requires to understand 50% of key words in sentences against a background of speech babble; used to give hearing aid wearers realistic expectations for potential improvement in noisy listening conditions
Table 3 (continued).
34
2.5 EFFECTS OF HEARING PROTECTION ON INTELLIGIBILITY
2.5.1 Mechanisms of performance
Over 50 manufacturers have developed and sold at least 241 different hearing protection devices,
many with quite high attenuation characteristics (NIOSH, 1994; updated information now
maintained online at http://www.cdc.gov/niosh/topics/noise/hpcomp.html). A hearing protector
that provides a high level of sound attenuation can greatly reduce the risk to the hearing
mechanism, although it could increase the risk of accident or injury by creating an inability to
hear important speech or warning signals. Hearing protectors that provide lesser amounts of
attenuation might affect speech intelligibility differently, depending on the spectral and temporal
characteristics of the noise as well as its overall level. Unfortunately, standard passive (non-
electronic) and currently available electronically enhanced hearing protectors cannot selectively
attenuate noise while leaving the speech unaffected. The effects of wearing hearing protectors
extend both to the listener as well as the wearer of these devices.
Shaw (1982) and von Gierke (1954) provided detailed descriptions and acoustical models
of passive hearing protector performance. These types of models may be presented as analogous
electrical circuits or mechanical equivalents to aid in describing the acoustical concepts.
Important parameters include the exposed surface area and mass of the protector, and enclosed
volume under the earcup/earplug. For earmuffs, additional considerations include headband
tension, earcup cushion/seal compliance, and acoustic absorption within the earcup. When
numerical values are assigned to these variables, mathematical formulas may be used to calculate
35
their typical transmission loss characteristics. Consistent with the acoustical properties of many
materials, hearing protector attenuation is frequency dependent. Less attenuation is usually
achieved at the lower frequencies as compared to higher frequencies. Generally, earplugs
attenuate more than earmuffs at frequencies below 500 Hz, while both types of protectors
perform much better above 2000 Hz. Research in this area is ongoing, and continues to provide
additional insight into issues such as the effects of mass, clamping force, and earcup volume.
Increasing these properties tends to increase earmuff attenuation (Zera & Mlynski, 2007;
Pekkarinen, Starck, & Ylikoski, 1992; Williams, Seeto, & Dillon, 2012).
Conventional passive hearing protectors provide the same amount of attenuation,
regardless of the incident sound level. However, specially designed passive protectors have been
developed for specific noise environments. Although they are not necessary in most industrial
noise situations, passive amplitude-sensitive devices are available that contain a non-linear
component such as a very small orifice/duct opening (Allen & Berger, 1990). These non-linear
protectors provide reduced attenuation at low sound levels (typically below 120 dB), with
increasing protection at high levels, and are typically used for protection from gunshot or other
impulsive noise sources.
The amount of protection afforded by a hearing protector depends on the way it is fitted
and worn. Performance limitations may be imposed depending upon a hearing protector’s
construction and on the physiological and anatomical characteristics of the wearer. Sound
energy may reach the inner ears of persons wearing protectors by four different pathways (von
Gierke, 1954). Leaks around the protector are the primary concern, unless an air-tight seal is
made with the ear canal walls (earplugs) or the side of the head (earmuffs). Second, the ambient
sound pressure will cause the protector to vibrate, which in turn generates sound into the ear
36
canal. Transmission of the sound directly through the protector itself may be another path,
depending on the physical properties of the material. Finally, even with an optimally designed
and properly fit hearing protector, sound may still pass through bone and tissue around the
protector. Even if there are no acoustic leaks through or around a hearing protector, some noise
will reach the inner ear by bone and tissue conduction if noise levels are sufficiently high
(Zwislocki, 1957). The practical limits set by the bone- and tissue-conduction threshold vary
significantly among individuals and among protector types, generally from about 40 to 60 dB
(Berger, Kieper, & Gauger, 2003).
Hearing protector attenuation is determined either by conducting listening tests on human
subjects or by direct acoustical measurement (Berger, 1986). Human subject testing is
conducted by administering hearing tests to a panel of listeners with and without the protector in
place. This test method is referred to as real-ear attenuation at threshold; the decibel difference
between the open-ear threshold and the occluded-ear threshold indicates the amount of sound
attenuation provided. Objective measurements are conducted using a microphone-in-real-ear
technique, where the sound level in the ear canal or under the hearing protector is subtracted
from the level in the open ear or outside the protector. Several attenuation rating methods have
been developed (NIOSH, 1994), although the US Environmental Protection Agency requires the
single-number noise reduction rating (NRR) to be shown on the label of each hearing protector
sold in the United States (EPA, 1979). The NRR should be used cautiously because of its
inherent lack of precision. A fundamental weakness of the NRR is that it can end up being
controlled by just one or two of the nine one-third octave-band test signals used in its calculation.
Generally, the controlling test signals are at or below 1000 Hz, and performance levels for other
test signals may have little or no effect on the NRR. Another limitation of the NRR is that
37
attenuation values obtained from laboratory testing tend to overestimate the amount of protection
received by individuals during everyday use (Berger, Franks, & Lindgren, 1996). This is not
surprising, considering that well-trained and highly motivated individuals are normally used in
the laboratory as subjects, while the typical noise-exposed worker may not receive the necessary
training or assistance with fitting his/her protectors. Despite the lack of real-world applicability,
many hearing protector manufacturers have benefitted from relatively high laboratory-generated
NRR values to sell more products than their competitors. The NRR, however, may be used as a
general indication of how much noise reduction a particular hearing protector is capable of
providing.
2.5.2 Listener effects
Kryter (1946) was one of the first researchers to investigate the effects of hearing protectors on
speech intelligibility in noise. In his experiment, PAL phonetically balanced word lists were
presented over a public address system while simulated submarine engine-room noise was
played through loudspeakers in a reverberant test chamber. Normal-hearing subjects were tested
both with and without earplugs in noise levels ranging from 65 to 115 dB. As the noise level
increased, higher scores were obtained while wearing the earplugs as compared to the open-ear
condition. Pollack (1957) also evaluated the effect of earplugs on speech intelligibility in
normal-hearing listeners. He found little difference between the protected and unprotected
speech intelligibility scores in broadband noise up to 100 dB. Better scores were obtained at
even higher noise levels when the subjects wore earplugs. Howell and Martin (1975) reported on
two experiments involving speech intelligibility, hearing protection, and noise. The results of the
first experiment indicated that wearing hearing protection in noise levels above 85 dB will not
38
cause degradation in intelligibility for the listener, and might even improve it. (The results of
their second experiment will be discussed in the next section.)
A study of 537 Dutch industrial workers by Lindeman (1976) found that normal-hearing
listeners (or those with only a slight high frequency hearing loss) demonstrated improved speech
intelligibility while wearing earmuffs and listening to monosyllabic words presented at 90 dB
with an 80 dB white noise background. Deterioration of intelligibility was found for subjects
with a 30 dB or greater high frequency hearing loss. Rink (1979) also reported improvement in
noise for normal-hearing listeners wearing hearing protection; however, his hearing-impaired
subjects did not perform differently in noise whether or not hearing protection was worn. A
possible explanation for this finding is that the hearing-impaired subjects did not have significant
hearing losses; these subjects were described simply as having a minimum threshold of 30 dB for
at least two audiometric test frequencies from 250 through 8000 Hz.
Chung and Gannon (1979) obtained results comparable to previous studies when testing
normal-hearing and hearing-impaired subjects in pink noise at sensation levels of 40 and 65 dB.
For the normal-hearing subjects, these levels would equate to approximately 65 and 90 dB SPL;
the levels for the hearing-impaired subjects would have been higher, depending on their speech
reception thresholds. Recognition of CID W-22 word lists was worse with earmuffs except for
the normal-hearing listeners at high presentation levels. A distinct difference in responses
between the protected and unprotected results was observed at a -5 dB signal-to-noise ratio,
where most of the discrimination scores were below 50%. With the earmuffs on, most of the
incorrect responses were actually “no response,” whereas most of the incorrect responses while
not wearing the earmuffs were due to wrong answers. The authors suggested that the hearing
39
protection attenuated the test stimuli below the level of audibility, and the speech became
distorted by the loud noise if hearing protection was not worn.
A large study of speech intelligibility involving normal-hearing subjects, individuals with
bilateral noise-induced high-frequency hearing loss, and individuals with bilateral flat hearing
loss was conducted by Abel, Alberti, Haythornthwaite, and Riko (1982). Subjects listened to
PAL PB-50 words presented at 80 or 90 dBA against an 85 dBA white or “crowd” noise while
wearing five different types of hearing protectors. Results for normal-hearing listeners revealed
essentially no effect, while subjects with both types of hearing losses performed significantly
worse with the hearing protectors. No substantial differences between protector types were
observed, although one of the two earmuffs used in this experiment caused somewhat lower
scores than the rest of the devices. Other findings were that the crowd noise was a more
effective masker than white noise, and individuals with flat hearing losses wearing hearing
protection achieved the worst speech recognition scores.
Bauman and Marston (1986) conducted another study to investigate the effects of hearing
protection on speech intelligibility, using a 0 dB signal-to-noise ratio in 85 dBA speech noise.
Subjects with high frequency hearing loss had significantly worse scores than normal-hearing
subjects. All subjects had poorer scores while wearing hearing protection, although the decrease
was only a few percentage points for the normal-hearing group and the protected-unprotected
difference was much more pronounced for the hearing-impaired subjects. Pekkarinen, Viljanen,
Salmivalli, and Suonpaa (1990) also tested normal-hearing subjects at a 0 dB signal-to-noise
ratio in 85 dBA noise (using broadband instead of speech noise). Their results were consistent
with other studies that found significantly better intelligibility with earmuffs than without them.
Similar results were found by Fernandes (2003), who conducted a study using Portuguese

40
monosyllabic words in a pink noise background. In an evaluation of flat-attenuation earplugs,
Plyler and Klumpp (2003) found improved HINT scores relative to the open-ear condition when
the speech level was fixed at 90 dB SPL. The most recent study of this type did not find a
difference between protected and unprotected HINT scores when a flat-attenuation earmuff was
worn in a background of 85 dBA industrial noise (Dolan & O’Loughlin, 2005).
To summarize, several research studies have investigated the effect of hearing protectors
on speech intelligibility over the past 67 years. Several types of background noises have been
used in these studies including white noise, pink noise, and recordings of actual worksite noise.
Some listening experiments were conducted using speech spectrum noise or multi-talker babble
since they are the most efficient maskers of speech. Initial studies established that wearing
hearing protectors in high ambient noise levels did not impair speech intelligibility. Actually, for
some acoustic environments speech intelligibility can be improved by wearing hearing
protection. Subsequent investigations confirmed these findings in normal hearing subjects, while
discovering that hearing-impaired subjects performed worse on speech intelligibility tests while
using hearing protection. Table 4 summarizes the studies reviewed in this section.

41
Table 4. Studies involving speech intelligibility while the subject is wearing hearing protection.
Study Research Objective Subjects Indep. Variables Dependent Variables Relevant Findings
Kryter (1946)
Assess speech intelligibility in noise while wearing earplugs
8 college-age men
Speech over a PA system and direct person-to-person speech; noise at 65–115 dB, with and without earplugs
Percentage of PAL PB words correctly understood
Wearing earplugs does not impair, and in some cases improves the reception of speech in noise
Pollack (1957)
Examine the effect of hearing protection on speech intelligibility
(composition of the “testing crew” was not specified)
White noise (low-pass filtered at 1kHz) at 70–130 dB SPL, with and without earplugs
Percentage of words correctly understood
Hearing protectors provided large significant improvements in word intelligibility
Howell & Martin (1975)
Investigate the effect of wearing hearing protection on speech intelligibility
12 normal-hearing male university students
Ears open, earplugs, earmuffs; broadband noise at 65, 80, and 95 dB SPL
Intelligibility score (percent of monosyllabic words correct)
At low noise levels, listeners perform worse on intelligibility tests when hearing protectors are worn; when the noise is above 85 dB a slight improvement was seen
Lindeman (1976)
Study the effect of hearing protectors on normal-hearing and hearing-impaired workers
537 industrial workers with and without hearing loss
Ears open, earmuffs; quiet and 80 dB SPL white noise (word lists at +10 dB S/N ratio)
Percentage of monosyllabic words correct
Improvement in speech intelligibility was seen in normal or mildly hearing-impaired workers wearing earmuffs in noise; reduced intelligibility was seen in workers with more severe hearing losses
Rink (1979) Evaluate the effect of hearing protectors on normal-hearing and hearing-impaired subjects
10 normal-hearing and 30 hearing-impaired adults
Quiet, 90 dBA broad-band noise; with/without earmuffs
Correct responses on the Modified Rhyme Test
Hearing protectors improve speech discrimination in noise for normal-hearing listeners; hearing protectors did not affect speech discrimination performance in noise for hearing-impaired listeners
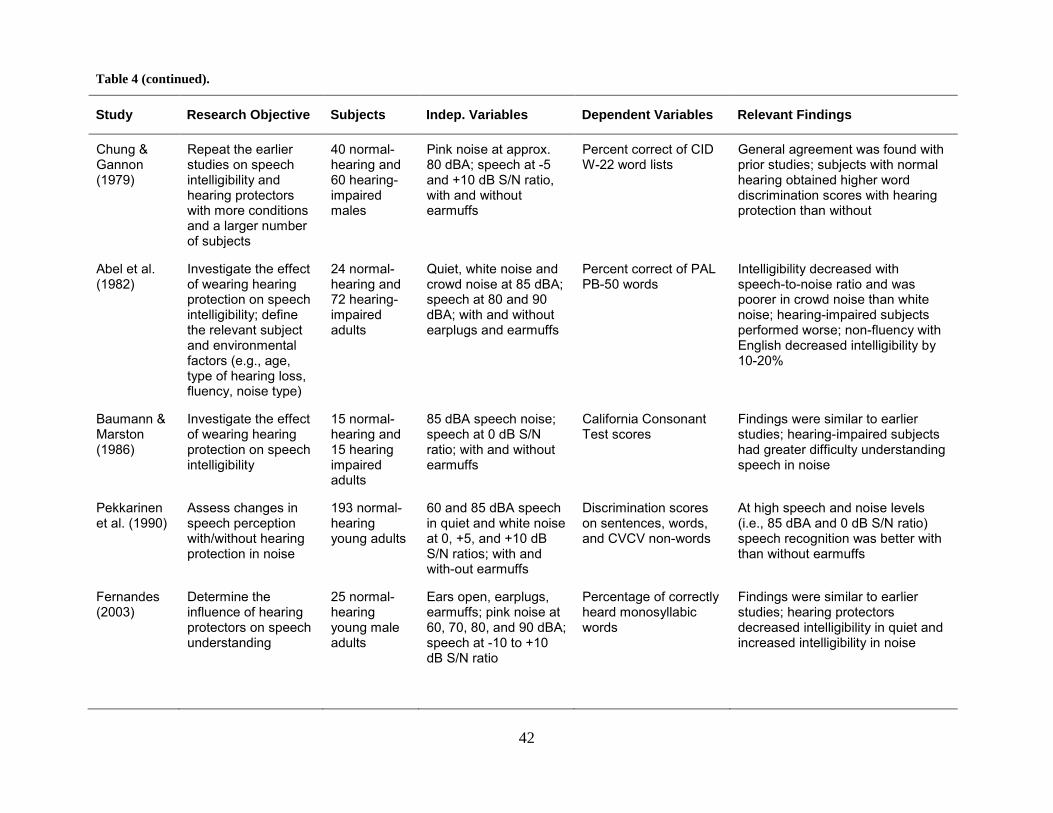
42
Study Research Objective Subjects Indep. Variables Dependent Variables Relevant Findings
Chung & Gannon (1979)
Repeat the earlier studies on speech intelligibility and hearing protectors with more conditions and a larger number of subjects
40 normal-hearing and 60 hearing-impaired males
Pink noise at approx. 80 dBA; speech at -5 and +10 dB S/N ratio, with and without earmuffs
Percent correct of CID W-22 word lists
General agreement was found with prior studies; subjects with normal hearing obtained higher word discrimination scores with hearing protection than without
Abel et al. (1982)
Investigate the effect of wearing hearing protection on speech intelligibility; define the relevant subject and environmental factors (e.g., age, type of hearing loss, fluency, noise type)
24 normal-hearing and 72 hearing-impaired adults
Quiet, white noise and crowd noise at 85 dBA; speech at 80 and 90 dBA; with and without earplugs and earmuffs
Percent correct of PAL PB-50 words
Intelligibility decreased with speech-to-noise ratio and was poorer in crowd noise than white noise; hearing-impaired subjects performed worse; non-fluency with English decreased intelligibility by 10-20%
Baumann & Marston (1986)
Investigate the effect of wearing hearing protection on speech intelligibility
15 normal-hearing and 15 hearing impaired adults
85 dBA speech noise; speech at 0 dB S/N ratio; with and without earmuffs
California Consonant Test scores
Findings were similar to earlier studies; hearing-impaired subjects had greater difficulty understanding speech in noise
Pekkarinen et al. (1990)
Assess changes in speech perception with/without hearing protection in noise
193 normal-hearing young adults
60 and 85 dBA speech in quiet and white noise at 0, +5, and +10 dB S/N ratios; with and with-out earmuffs
Discrimination scores on sentences, words, and CVCV non-words
At high speech and noise levels (i.e., 85 dBA and 0 dB S/N ratio) speech recognition was better with than without earmuffs
Fernandes (2003)
Determine the influence of hearing protectors on speech understanding
25 normal-hearing young male adults
Ears open, earplugs, earmuffs; pink noise at 60, 70, 80, and 90 dBA; speech at -10 to +10 dB S/N ratio
Percentage of correctly heard monosyllabic words
Findings were similar to earlier studies; hearing protectors decreased intelligibility in quiet and increased intelligibility in noise
Table 4 (continued).

43
Study Research Objective Subjects Indep. Variables Dependent Variables Relevant Findings
Plyler & Klumpp (2003)
Evaluate communication ability in noise using hearing protection
14 normal-hearing young female adults
Speech at 75 and 90 dB SPL; ears open and earplugs
HINT test results (sentence SRT in terms of S/N ratio)
Communication ability was significantly better with hearing protection compared to the un-occluded condition
Dolan & O’Loughlin (2005)
Determine how different brands of earmuffs compare in terms of speech intelligibility for hearing-impaired listeners
10 adults with bilateral hearing loss
85 dBA industrial noise; ears open and with earmuffs
HINT test results (sentence SRT in terms of S/N ratio)
No difference between occluded and un-occluded with hearing-impaired subjects – these findings were similar to Rink (1979), but other studies indicated that hearing-impaired subjects performed worse
Table 4 (continued).
44
2.5.3 Talker effects
As previously discussed, most of the existing studies focused on the hearing protection user
listening to speech; however, even some of the earliest research mentioned the fact that wearing
earplugs may cause the person talking to change his/her speaking patterns. For example, Kryter
(1946) pointed out that plugging the talker’s ears caused a drop of one to two decibels in voice
level. He reported slightly lower speech recognition scores when the talkers wore earplugs, and
the previously mentioned advantage gained when listeners wore hearing protection in noise did
not occur (when both the talker and listener wore earplugs) until the noise levels were higher.
These findings can be attributed to how speech is produced and how sound waves behave in the
external ear canal. When a person is speaking, the vibration of the vocal folds (as filtered by the
oral and nasal cavities) produces very high levels within the vocal tract, and causes the tissue and
bone of the skull to vibrate. When unoccluded, the ear canal acts as a high-pass filter, so sound
generated from vibration of the ear canal walls is allowed to radiate out of the ear. When the ear
canal is sealed, bone-conducted sound below 2000 Hz is more efficiently transmitted to the
eardrum. Therefore, lower frequency sounds will be heard louder, and the intensity required to
find bone-conduction thresholds is lowered when the ear canal is occluded (Watson & Gales,
1943). Zwislocki (1957) referred to this as the earplug effect, although it is usually called the
occlusion effect by audiologists.
The occlusion effect causes a perceived change in one’s own voice quality. It is often
used as a subjective test to verify the fit of a hearing protector. The wearer is told that his/her
own voice should sound deeper, hollow, or muffled when the hearing protector is seated
properly. Zwislocki (1953) showed that a deeply inserted earplug occluding the bony part of the

45
ear canal will reduce the occlusion effect. Berger and Kerivan (1983) fully describe how the
occlusion effect changes as a function of the occluded volume. This effect is greatest when the
ear canal is sealed right at the entrance. Less occlusion effect occurs with deep insertion of an
earplug or, at the other extreme, when there is a large space around the auricle enclosed by a
circum-aural earmuff. The occlusion effect is especially prominent when producing closed
vowels such as /i/ and /u/, which can cause very intense low-frequency noise levels in the ear
canal when an earplug is worn (Killion, Wilber, & Gudmundsen, 1988).
When discussing conductive hearing loss, textbooks (e.g., Sataloff, 1966, p.26) mention
that the resulting occlusion effect affects vocal production exactly opposite from the Lombard
effect, since one of the most noticeable consequences of a conductive hearing loss is that people
tend to talk softer since they hear their own voices louder than usual. However, people are
usually heard speaking louder when wearing hearing protection in a quiet environment. A theory
to explain this is that the talker is monitoring his/her voice primarily via air-conduction and is
attempting to overcome the attenuation of the air-conducted sound reaching his/her own ears,
despite the fact that the bone-conducted speech is still amplified by the occlusion effect (Berger,
1988). No scientific studies have been reported in the literature that directly tests this theory.
As mentioned earlier, the first of two experiments reported by Howell and Martin (1975)
suggested that a listener wearing hearing protection in noise levels above 85 dB will hear speech
as well as or possibly better than without wearing hearing protection. They described the results
from their second experiment as “…detracting somewhat from the optimism…” generated by the
results of the first experiment. This comment was made in reference to the finding that talkers
lowered their voices by 2.7 dB when wearing earplugs and by 4.2 dB when wearing earmuffs in
a 93 dB broadband noise, and the listeners’ average intelligibility scores decreased by 15% when

46
the talkers wore earplugs and decreased by 25% when the talkers wore earmuffs. The authors
indicated that the scores appeared to be lower than would be expected solely from a reduction in
voice level. They suggested that persons wearing hearing protection speak less distinctly in
addition to lowering their overall voice level.
In the following year, Martin, Howell, and Lower (1976) reported on another set of
experiments designed to investigate the effect of hearing protection on communication, including
the effects on the talker’s voice. They observed a 2-3 dB reduction in voice level when the talker
wore hearing protection, but did not find any significant differences in frequency content. Subtle
changes in voice quality (which were not detected in their frequency analysis) were suspected to
be the cause, so they conducted a final experiment to investigate this finding. This was
accomplished by using recordings of eight talkers with and without earplugs in a background of
87 dBA. Noise was mixed in to produce a 3 dB signal-to-noise ratio, and the recordings were
played to a panel of four subjects at approximately 70 dB SPL. No significant difference in
intelligibility between the protected and un-protected talkers’ speech was found, which they
explained as no significant change in voice quality due to the talker wearing earplugs.
Hormann, Lazarus-Mainka, Schubeius, and Lazarus (1984) used 180 talker/listener pairs
of normal-hearing subjects to test four different conditions: talkers with/without hearing
protection and listeners with/without hearing protection. They were interested most in
evaluating what happens when a talker and listener are sitting face-to-face and trying to carry on
a conversation against a pink noise masker while both individuals are wearing hearing
protection. When the background noise level was 92 dBA talkers spoke 4 dB softer while
wearing foam earplugs. The authors also measured speaking time and found that words were
spoken approximately 20% faster when earplugs were worn. Speech intelligibility results

47
indicated significantly less was understood when both talkers and listeners were wearing
earplugs.
Casali, Horylev, and Grenell (1987) reported on a pilot study designed to set speech
levels for a large-scale study on speech communication with hearing protection in noisy
environments. Eight subjects with normal hearing were instructed to read a list of words so that
they would be intelligible to a listener seated in the same environment. In addition to testing in
quiet, two industrial-type noises were played through loudspeakers at 60 and 83 dBA. The
authors found that as the ambient noise level increased, the talkers’ voice levels also increased at
one-half the rate of the noise level increase, both with and without hearing protection. They also
found that the talkers’ voices increased while wearing hearing protectors in the no-noise
condition, and the occlusion effect caused their speech levels to decrease in the highest noise
condition (as compared to the unoccluded condition). To counteract the occlusion effect, the
authors noted that individuals would have to make a conscious and unnatural effort to speak loud
enough to be understood in high background noise levels, and suggested that training workers to
do so would be difficult.
The next study reported in the literature (Navarro, 1996) found little or no difference
between vocal output with ears covered versus ears uncovered. This study was conducted to
examine the effect of ear canal occlusion and masking noise on several acoustical parameters of
voice. Using 12 normal-hearing adult subjects, the fundamental frequency and overall sound
pressure level were measured with the subjects’ ear canals open and while occluded with foam
earplugs. An average decrease of 0.73 dB was observed in the occluded condition, which
represented a statistically (but not practically) significant change. These findings suggest that
wearing earplugs does not have an effect on vocal production; however, the amount of occlusion
48
(in this case, as defined by the attenuation) provided by the earplugs was extremely variable
across subjects in this study, with some subjects receiving 0 dB at one or more test frequencies.
A more recent study by Tufts and Frank (2003) was conducted to obtain sound pressure
level measurements of connected speech produced by talkers with ears open and while wearing
two types of earplugs. The underlying factors in this experiment were to help evaluate the
validity of noise-exposed workers’ complaints and provide some information regarding the
optimal selection of a hearing protector for a particular work environment. Similar to the
Navarro (1996) study, Tufts and Frank (2003) found a 0.6 dB decrease in speaking level when
earplugs were worn in quiet. Overall, the findings of this study suggest that wearing earplugs
caused the undesirable effect of lowered overall vocal levels and speech-to-noise ratios as
compared to the ears-open condition. Therefore, less speech information would be provided to
listeners when the talkers wore hearing protection, and speech communication would be
negatively affected.
Table 5 summarizes the studies reporting on the effects of ear canal occlusion and/or
noise on a talker’s voice production when hearing protection is worn.

49
Table 5. Research involving the occlusion effect and vocal production when hearing protection is worn.
Study Research Objective Subjects Indep. Variables Dependent Variables Relevant Findings
Kryter (1946)
Assess speech intelligibility in noise while wearing earplugs
8 males Quiet, 75, 85, 95, and 105 dB submarine engine room noise; earplugs, ears open
Speech output level In quiet, talkers’ voice level was raised 3-4 dB; in noise, voice levels dropped 1-2 dB
Zwislocki (1957)
Determine free-field bone-conduction thresholds
6 adults MAF testing with and without earplugs
Hearing thresholds When not inserted too deeply, earplugs increase bone conducted sound; referred to as the earplug effect
Zwislocki (1953)
Investigate the mechanisms for inter-aural attenuation
3 (no details provided)
Testing with and without an earplug in one ear
Inter-aural hearing threshold differences
A deeply inserted earplug occluding the bony part of the ear canal will reduce the occlusion effect
Berger & Kerivan (1983)
Determine the influence of the occlusion effect during hearing protector attenuation testing
4 male and 2 female normal-hearing adults
6 hearing protectors causing low to high occluded volumes
Microphone-in-real-ear measurements; bone conduction thresholds
Maximum occlusion effect occurred when ear canal is closed at the entrance; minimum occlusion effect at lowest or highest occluded volumes
Howell & Martin (1975) and Martin et al. (1976)
Investigate the effect of wearing hearing protection on speech intelligibility
4 normal-hearing male university students
Quiet, 67-95 dB SPL broadband noise; ears open, earplugs, and earmuffs
Speech output level Wearing hearing protection in noise caused the talker to lower his/her voice level and possibly speak less distinctly
Hormann et al. (1984)
Investigate the effect on speech intelligibility when both the talker and the listener are exposed to the same noise level and are wearing hearing protection
360 normal-hearing university students
Pink noise at 76, 84, and 92 dBA; all combinations of talker and listener with/without earplugs
Speech output level; speaking rate; pause length
Results were similar to Kryter (1946) and Howell & Martin (1975); talkers spoke softer when earplugs were worn
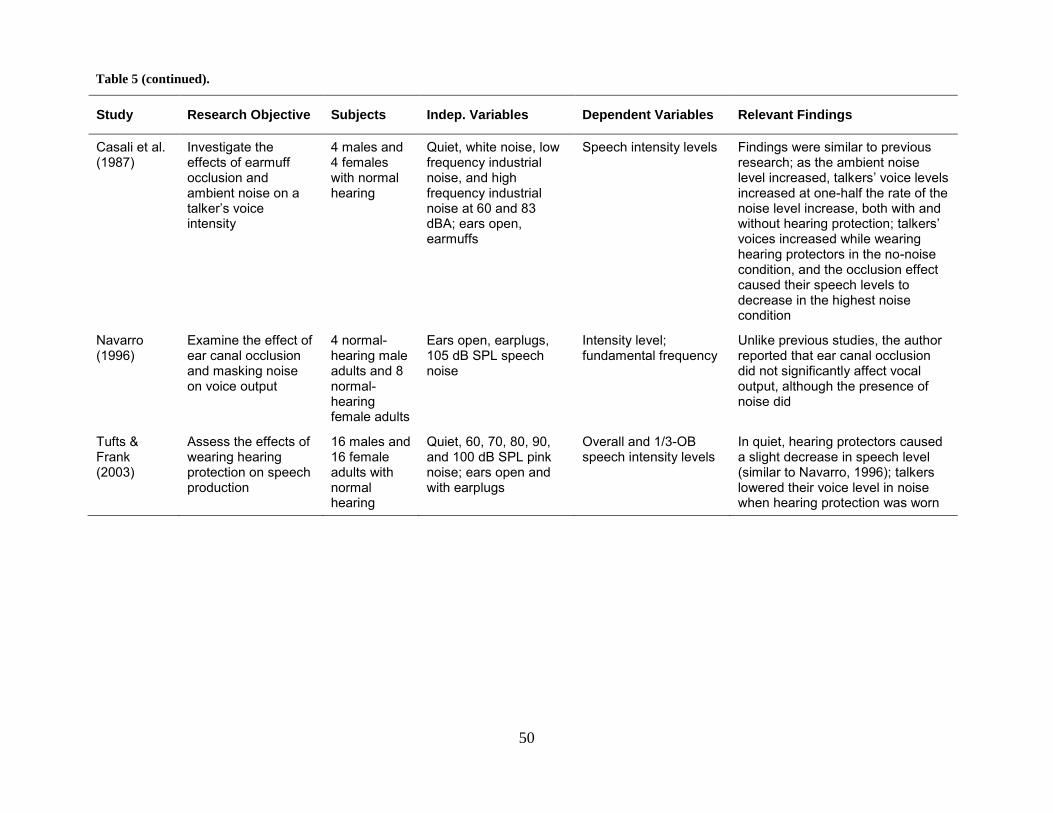
50
Study Research Objective Subjects Indep. Variables Dependent Variables Relevant Findings
Casali et al. (1987)
Investigate the effects of earmuff occlusion and ambient noise on a talker’s voice intensity
4 males and 4 females with normal hearing
Quiet, white noise, low frequency industrial noise, and high frequency industrial noise at 60 and 83 dBA; ears open, earmuffs
Speech intensity levels Findings were similar to previous research; as the ambient noise level increased, talkers’ voice levels increased at one-half the rate of the noise level increase, both with and without hearing protection; talkers’ voices increased while wearing hearing protectors in the no-noise condition, and the occlusion effect caused their speech levels to decrease in the highest noise condition
Navarro (1996)
Examine the effect of ear canal occlusion and masking noise on voice output
4 normal-hearing male adults and 8 normal-hearing female adults
Ears open, earplugs, 105 dB SPL speech noise
Intensity level; fundamental frequency
Unlike previous studies, the author reported that ear canal occlusion did not significantly affect vocal output, although the presence of noise did
Tufts & Frank (2003)
Assess the effects of wearing hearing protection on speech production
16 males and 16 female adults with normal hearing
Quiet, 60, 70, 80, 90, and 100 dB SPL pink noise; ears open and with earplugs
Overall and 1/3-OB speech intensity levels
In quiet, hearing protectors caused a slight decrease in speech level (similar to Navarro, 1996); talkers lowered their voice level in noise when hearing protection was worn
Table 5 (continued).

51
2.6 ADDITIONAL CONSIDERATIONS FOR SPEECH INTELLIGIBILITY
2.6.1 Self-hearing
The ability to hear one’s self is an essential component of successful speech communication.
One of the earliest investigations into the phenomenon of self-hearing was described by von
Bekesy in 1949. He was interested in the physical characteristics of the middle ear that
permitted a listener to hear external environmental sounds while minimizing the perception of
any self-generated sounds such as chewing, swallowing, etc. When a person speaks, that
individual hears him/herself both via air conduction and bone conduction. Through his
experiments, von Bekesy (1949) determined that the air and bone conduction pathways produced
sensations of approximately the same order of magnitude. During his years of extensive study of
bone conduction, Tonndorf (1972) discovered that the bone conduction route was less effective
at high frequencies than for lower frequencies. Therefore, a person would hear more of the low
frequency components of his/her self-generated speech. This provides an explanation for the
common observation that an individual’s voice does not sound normal when a person listens to a
recording of his/her own speech.
Other studies have supported the conclusion that bone conduction causes talkers to hear
the lower frequencies of their own speech with more emphasis than what an external listener is
hearing. Shearer (1978) conducted tests of subjects’ hearing in the presence of the vowels /a/, /i/,
and /u/ which were either vocalized by the subject during the test or were recorded and played
back to the subject while the audiogram was taken. Overall, the amount of masking by the
52
recorded vowels was greater than the amount produced by the vowel sounds vocalized by the
subjects during the test. More specifically, the recorded vowels had a greater masking effect on
the higher audiometric test frequencies while the lower audiometric frequencies were more
effectively masked when the vowel sounds were produced live. The work by Porschmann
(2000) agreed with the results of the earlier studies and suggested that bone conduction
dominated the self-perception of a person’s voice at frequencies between 700 and 1200 Hz.
Much more recently, Reinfeldt, Ostli, Hakansson, and Stenfelt (2010) conducted a study to
determine the bone-conduction relative to the air-conduction sensitivity for ten different
phonemes. Their findings agreed with the earlier studies regarding the air and bone components
being of equal importance, and also found the relative contributions of each pathway to be
frequency dependent.
The term autophonic response has been used to describe the perceived loudness of a
person’s own voice (Lane, Catania, & Stevens, 1961). These authors assert that there is a
significant difference between the perceived level of a self-produced sound and a sound that is
generated by an external source. Essentially, this means that if a talker doubles his/her voice
output, it will not necessarily sound twice as loud to a listener. Hearing acuity is primarily
responsible for judging the loudness of external sounds, while vocal effort and other internal
proprioceptive mechanisms influence how loud one’s own voice sounds.
Maurer and Landis (1990) further explored the role of bone conduction on the self-
perception of speech. They asked their study participants to mix their own separately recorded
air- and bone-conducted speech until they recognized the voice as sounding the most familiar.
Although most subjects added bone-conducted speech to the mixture, no significant correlation
was found in the chosen mixture of bone/air-conducted speech, and there was a great deal of

53
variability among subjects. These findings were reviewed by Shuster and Durrant (2003) who
suggested that the bone vibration measurement techniques employed by Maurer and Landis
(1990) were not sufficient to describe the transfer function involved in self-hearing.
Subsequently, Shuster and Durrant (2003) reported on a two-part study in an effort to determine
whether multi-band filtering of tape-recorded speech could be perceived as more natural
sounding, and also to determine the overall frequency response of the self-monitoring of speech.
First, they used a delayed auditory feedback paradigm and asked their participants to rate how
much the delayed speech sounded like their actual voice. The delayed speech was processed
through a 2/3 octave-band equalizer, and a variety of equalizer settings was used to produce
differing amounts of low-pass filtering. This task was conducted twice; once with the researcher
adjusting the equalizer, and again with the subject making his/her own adjustments. As
expected, the subjects preferred some low frequency emphasis; however, no statistically
significant differences in the ratings of the settings were found. In the second part of the study,
subjects were instructed to identify whether recorded speech samples were produced either by
themselves or by another speaker. Each of the subjects’ recorded speech samples were played
twice: first unfiltered and again with low-pass filtering using the same equalizer settings
determined from the first part of the experiment to be in the middle of the preferred range. Thus,
the participants had three response choices when listening to the recordings: (1) Me, but not as I
sound to myself; (2) Me, as I sound to myself; and (3) Not me. The results showed that low-pass
filtered speech sounded more like an individual’s own speech (when produced live) than
unfiltered speech. Unfortunately, the exact transfer function of self-hearing was not able to be
determined. Shuster and Durrant (2003) suggested that more sophisticated digital filtering and a
better computerized adaptive adjustment procedure might enable characterization of the transfer
54
function. No further work on the mechanisms of self-hearing has been reported in the literature;
however, several studies have recognized its applicability (e.g., Sugimori, Tomohisa, & Tanno,
2013; Heinks-Maldonado, Srikantan, & Houde, 2006; Ford & Mathalon, 2005). Such studies
were primarily concerned with understanding auditory cortical responses, cognitive processes,
auditory hallucinations, etc. In each case, the researchers employed low-pass filtering to render
the auditory feedback closer to how the subjects’ own voices would sound, or they at least
recognized the potential effect this could have on their experimental design.
Another related consideration is the effect of the acoustic or middle ear muscle reflex.
This refers to the contraction of the stapedius and tensor tympani muscles located within the
middle ear space. The stapedius is attached to the head of the stapes, and the tensor tympani is
attached to the manubrium of the malleus (Zemlin, 1981). When contracted, these muscles
increase the middle ear impedance, thereby decreasing the efficiency of vibratory energy
transmission through the ossicular chain (Borg, Nilsson, & Engstrom, 1983). The tensor
tympani muscle has long been thought of as providing a protective role, although its general
function in humans is still not completely understood (Mukerji & Lee, 2010). The tensor
tympani muscle responds primarily to non-auditory events such as tactile stimulation of the face
and eyes, or it may be activated as a part of the startle response (Klockhoff, 1961). It also may
prevent overstimulation from self-generated noise, such as swallowing or vocalization (Stach,
Jerger, & Jenkins, 1984). In humans, the stapedius muscle is more responsive to acoustic stimuli
than the tensor tympani (Neergard, Andersen, Hansen, & Jepsen, 1964; Djupesland, 1964;
Liberman & Guinan, 1998). Contraction of the stapedius muscle may enhance speech
intelligibility by preventing the upward spread of masking, specifically the masking of speech by
intense low-frequency environmental noise (Borg & Zakrisson, 1974, 1975; Phillips et al, 2002).
55
The stapedius muscle also may attenuate self-produced sound, which could reduce interference
between self-produced sounds and external sounds (Shearer & Simmons 1965; Borg &
Zakrisson, 1975). Regardless of the activation mechanism, the acoustic reflex results in
attenuation of low-frequency ossicular chain vibration (Gelfand, 1981). This occurs because the
middle ear muscles serve to stiffen the middle ear system; since stiffness is inversely related to
frequency, the effect is most prominent at low frequencies (below 1000 Hz) and essentially
negligible at the higher frequencies.
2.6.2 Prediction techniques
In addition to developing tests of speech intelligibility, early researchers were interested in
developing techniques to predict the intelligibility of speech by analyzing its spectrum. French
and Steinberg (1947) reported on the development of a method they called the Articulation Index
(AI) which was based on physical and acoustical measurements of the communication
environment. The basic concept of the AI was that the range of speech frequencies could be
divided into 20 increments (bands) that provided equal contributions to the overall intelligibility.
The range of possible AI values is from zero to one. Calculated AI values will not necessarily
match the score obtained from any particular speech intelligibility test; instead, the AI may be
considered as the proportion of the total number of speech cues available to the listener. An AI
value of 0.0 indicates that none (i.e., 0%) of the speech cues reach the listener, while an AI value
of 1.0 indicates that all (i.e., 100%) of the speech cues are available to the listener. Similarly, a
value of 0.5 represents half (50%) of the speech cues reaching the listener. Kryter (1962a,b)
reported on usage and validation studies of the AI, which was subsequently issued as the
American National Standard Methods for the Calculation of the Articulation Index (ANSI,

56
1969). A few studies were conducted specifically to investigate the validity of using the AI as a
predictive method for speech intelligibility while wearing hearing protection with varying
degrees of success (e.g., Wilde & Humes, 1990; Gower & Casali, 1994).
The Articulation Index was revised and renamed the Speech Intelligibility Index (SII;
ANSI S3.5-1997, R2012). Several factors in the model were updated to reflect research findings
since the AI was first developed. Currently, the SII methodology accounts for variables such as
external masking noise, differences in vocal effort, reverberation, monaural/binaural listening,
hearing loss, varying message content, and the effect of wearing hearing protection. While the
SII is adaptable to different listening conditions, it is important to remember that speech
intelligibility predictions are correct only for an average group of talkers/listeners, and not
individual persons.
Research is still being conducted to improve existing speech intelligibility prediction
methods as well as to develop new techniques. Rhebergen, Versfeld, and Dreschler (2006, 2008)
have developed an extension to the SII, which they call the Extended Speech Intelligibility Index
(ESII) model. This was introduced to account for the fact that the SII cannot predict
intelligibility in fluctuating noise. A new model was proposed by Musch and Buus (2001a,b)
that uses statistical decision theory to predict speech intelligibility. Their model is called the
Speech Recognition Sensitivity (SRS) model, and is intended to account for synergistic
interactions between speech bands that are not adequately explained by the SII.
2.6.3 Clear speech/Speech training
Another talker-related characteristic that can affect speech intelligibility is whether the person
talking correctly enunciates his/her speech. Picheny, Durlach, and Braida (1985) studied the

57
effects of conversational versus clear speech on hearing-impaired listeners. Conversational
speech samples were obtained by instructing the talker to recite a list of sentences in the same
manner in which he spoke in ordinary conversation. Clear speech recordings were made by
having the talker speak “…as clearly as possible, as if he were trying to communicate in a noisy
environment or with an impaired listener.” An average improvement in intelligibility scores of
17% was found with the clear speech sentences. A follow-on article (Picheny, Durlach, &
Braida, 1986) indicated that clear speech was spoken more slowly, stop bursts and word-final
consonants are released, and obstruents were produced louder, although changes in the long-term
spectrum were small. The authors noted that speaking clearly was not equivalent to simply
increasing the high frequency speech sounds. More recent research shows that speaking slowly
is not solely responsible for better intelligibility with clear speech and talkers may employ
different strategies to produce clear speech (Krause & Braida, 2004; Liu & Zeng, 2006).
Clear speech is similar to hyper-articulated speech, which is purposely spoken to ensure
intelligibility. By contrast, hypo-articulated speech is similar to conversational speech, where
context or message familiarity is relied upon for complete understanding, possibly at the expense
of accurate pronunciation. Together, hyperspeech and hypospeech comprise the H & H theory,
which suggests that speaking styles are adjusted to match the particular communication situation
(Lindblom, 1990). Kain, Amano-Kusumoto, and Hosom (2008) reported on work that will lead
to a better understanding of which specific acoustic features are relevant for the improved
intelligibility of clear speech. These efforts will enable the development of a model that
quantifies the inter-relationships between acoustic features of speech and resulting intelligibility.
Their intent is to apply this knowledge to hearing aids and other assistive listening devices,

58
enabling the outputs of these devices to transform ordinary conversational speech into an
approximation of clear speech.
Individuals with Parkinson’s disease are difficult to understand due to their dysarthric
speech patterns. Treatment for dysarthria typically focuses on increasing vocal loudness, rate
control, and prosody/suprasegmental aspects (Yorkston, Hakel, Beukelman, & Fager 2007). The
Lee Silverman Voice Treatment (LSVT) is an intensive behavioral speech treatment designed to
improve the perceptual characteristics of voice by increasing respiratory/phonatory effort,
thereby increasing loudness (Ramig, Countryman, Thompson, & Horii, 1995; Fox, Ramig,
Ciucci, Sapir, McFarland, & Farley, 2006; Sapir, Spielman, Ramig, Story, & Fox, 2007). Goals
of LSVT interventions are to increase phonatory effort, vocal fold adduction, and respiratory
support. Changes in loudness as well as other aspects of speech production such as articulatory
precision have been demonstrated with LSVT treatments.
Listener-related characteristics other than hearing ability may have an effect on speech
intelligibility in noise while wearing hearing protection. For example, auditory training has been
used to improve the communication performance of hearing aid and cochlear implant users
(Sweetow & Palmer, 2005; Burk, Humes, Amos, & Strauser, 2006; Burk & Humes, 2007).
Application of these types of techniques specifically for use by noise-exposed industrial workers
has not been reported in the literature.
A well-known but perhaps subconscious method to increase speech intelligibility in noisy
conditions is simply allowing the listener to see the talker’s face (Sumby & Pollack, 1954; Miller
& D’Esposito, 2005; Ross, Saint-Amour, Leavitt, Javitt, & Foxe, 2007). Face-to-face
communication permits speech/lip-reading, and integrating the visual and auditory information
will generally aid a listener’s understanding ability. The most recent research in this area
59
indicates that improvement is not necessarily the greatest when auditory input is weakest; instead
the maximal benefit provided by visual cues occurs at intermediate signal-to-noise ratios (Ross,
et al., 2007). One situation where the auditory and visual cues together do not combine to
provide increased intelligibility is described by the McGurk effect (McGurk & MacDonald,
1976). In laboratory experiments, these investigators demonstrated that the interference of a
phoneme and an incongruent viseme can be strong enough to create an illusory percept.
2.7 ANALYSIS AND SUMMARY OF THE EXISTING RESEARCH
Noise-induced hearing loss is virtually always preventable if suitable hearing protection is used.
However, many individuals refuse to wear hearing protection because they say it interferes with
normal speech communication (Svensson, Morata, Nylén, Krieg, & Johnson, 2004; Helmkamp,
1986). This is somewhat perplexing, since research has shown that wearing hearing protection
does not prevent normal-hearing individuals from understanding speech in noise levels above 85
dBA, and normal-hearing workers may actually hear speech better when wearing earmuffs or
earplugs in a noisy work environment (Kryter, 1946; Howell & Martin, 1975; Lindeman, 1976;
Rink, 1979; Chung & Gannon, 1979; Abel et al., 1982; Bauman & Marston, 1986; Pekkarinen et
al., 1990; Nixon & Berger, 1991; Klumpp, 2003; Fernandes, 2003). Nevertheless, workers will
often remove their hearing protectors to communicate with co-workers. In some cases, this may
be explained by research that shows speech intelligibility in noise (while wearing hearing
protection) to be worse for hearing-impaired persons than for normal-hearing individuals (Chung
& Gannon, 1979; Bauman & Marston, 1986). Other explanations/rationalizations for these
communication complaints must exist. Alternatively, there may be a different reason for

60
rejecting hearing protectors, such as hearing protectors are uncomfortable to wear (for a review
see Davis, 2008), or some other physiological or psychological factor.
Data regarding the effects of a particular hearing protector on speech intelligibility are
not available from the manufacturer, and on-site safety or hearing conservation program
managers typically do not have access to the necessary instrumentation for the measurement of
speech intelligibility. Currently, hearing protectors are selected according to the labeled Noise
Reduction Rating (NRR) or worker preference (likely related to the degree of comfort), or they
are simply chosen from the available supply of employer-provided earplugs. Speech
intelligibility has been identified as an important issue among hearing conservation professionals
(Stephenson, 2009), but without the benefit of knowing to what extent each device affects speech
intelligibility for a given acoustic environment (and employee’s hearing status), potential
communication issues cannot be identified when hearing protectors are selected.
The Lombard effect is known to influence the way people talk when background noise is
present. Intuitively, it may seem plausible to assume that the acoustical properties of Lombard
speech are identical to loud speech produced in a quiet setting. However, research has shown
that Lombard speech is more intelligible than loud speech intentionally produced in quiet
conditions (e.g., Summers et al., 1988). Additionally, the results of studies such as Letowski et
al. (1993) suggest that Lombard speech is acoustically different from loud speech produced in
quiet. Effects of these vocal changes on speech intelligibility (and potential vocal stress/strain)
as experienced by noise-exposed workers in their everyday working environments remain largely
unexplored. The actual effects – whether beneficial or detrimental to effective communication –
are unknown, since the majority of the studies of Lombard speech were carried out in controlled
laboratory conditions which did not involve spontaneous speech. A study by Patel and Schell
61
(2008) used relatively spontaneous speech, and found that linguistic content influenced the
extent of the Lombard effect. In 90-dB multi-talker noise, information-bearing words were
elongated more than other less important words. The implication would be that it may not be
valid to generalize the results of speech intelligibility tests when the speech (i.e., recorded stimuli
or spoken by a live talker) was produced in quiet or under a different background noise level
than the subject’s listening condition. None of the commercially available pre-recorded tests use
speech from talkers while they were in a background of noise or while wearing hearing
protection.
Numerous studies involving speech intelligibility in noisy conditions have been
conducted, primarily to investigate the effects of hearing impairment or the acoustical
characteristics and performance of hearing aids. The majority of these studies focused on non-
hazardous background noise levels, i.e., those that are sufficient to interfere with speech
communication but not so loud as to cause noise-induced hearing loss. Workers would not be
wearing hearing protection in those situations; therefore, the findings may not be applicable or
transferable to actual hazardous noise working conditions. Unfortunately, some of the studies
specifically conducted to evaluate hearing protection did not use realistic (i.e., above 85 dBA)
background noise levels. For example, Reeves (1998) attempted to develop a hearing protector
selection method where speech intelligibility would be a selection parameter. He performed
listening experiments with speech at different signal-to-noise ratios using low-, mid-, and high-
frequency emphasis noises. Presentation levels were chosen to prevent ceiling effects in the
normal-hearing listeners’ data, thereby creating a more sensitive test of speech intelligibility.
However, the maximum noise levels (62 dBA for low- and 67 dBA for mid/high-frequency
emphasis noise) were well below the level at which hearing protectors would typically be worn.

62
Several other studies suffered from this same limitation and were not included in this review
(e.g., Kjukaanniemi & Sorri, 1988; Abel, Armstrong, & Gigure, 1993; Abel & Spencer, 1997).
As reviewed above in sections 2.2 through 2.6, several studies involving the effect of
hearing protectors on speech intelligibility have been conducted. In each case, one or more
devices were evaluated by some type of speech recognition test. Clinical audiologists are most
familiar with word discrimination testing in quiet, which is not likely to be indicative of an
individual’s performance on a speech test while wearing hearing protectors and being subjected
to high levels of background noise. Widening the choice of test material to sentences or
connected discourse seems like a reasonable approach. This opens up numerous additional
concerns, such as the effect of semantic/contextual cues that can enhance the recognition of a
particular word in one context while preventing the same word from being heard correctly when
presented in another context. Miller, Heise, and Lichten (1951) were among the first researchers
to study these issues. One of their findings was that the signal-to-noise ratio (SNR) for 50%
recognition (i.e., threshold testing) changed depending on whether digits, words, or nonsense
syllables were used in the test. The concept of scoring in terms of SNR loss rather than the
traditional percent correct has been incorporated into the newer speech tests. Unfortunately, the
relationship between scores on the various types of speech intelligibility tests is unknown, since
only a few studies have been conducted specifically to compare different speech-in-noise tests
(McArdle, Wilson, & Burks, 2005; Wilson, McArdle, & Smith, 2007).
Even if all existing speech-in-noise tests were found to yield equivalent results, they do
not necessarily provide insight into identifying which hearing protectors might be better for a
particular individual in a given noise/communication situation. Cluff, Pavlovic, and Overson
(1993) recognized two important limitations with existing speech intelligibility tests. First, the
63
acoustical characteristics of speech produced in a noisy work environment will be different from
the recorded speech material found on commercially available tests. Second, non-acoustic
factors such as linguistic structure and message content/predictability are quite different between
pre-recorded tests and actual workplace communications. In their article, the authors primarily
addressed the second issue, and reported on the development of a speech intelligibility test
designed for use in an industrial workplace. They solicited 3- to 5-syllable phrases from
individuals employed in noisy workplaces, and created eight 20-phrase phonetically balanced
lists of phrases that were “loosely assumed” to be typical of on-the-job communication in various
industries. Regarding the first issue of acoustical differences, the phrases were recorded by a
talker speaking at near-maximum vocal effort without wearing hearing protection in a quiet
audiometric booth. Unfortunately, studies that used this test or further research into its
underlying concepts were not found in the literature.
The presence of an occlusion effect and the Lombard effect for talkers wearing hearing
protection has yielded conflicting results between studies. Kryter (1946) and Casali et al. (1987)
reported that talkers raised the level of their voices by approximately 4 dB when they wore
hearing protection in quiet. Conversely, Navarro (1996) and Tufts and Frank (2003) reported
slight (less than 1 dB) decreases in voice level in the same condition. The explanation for these
different findings is unknown. It appears that the magnitude of either the occlusion effect and/or
the hearing protector attenuation must have been different to cause the different findings.
Navarro (1996) indicated that the earplugs worn by his subjects provided adequate protection
since the average attenuation values were consistent with data reported elsewhere. However, his
data show that the range of attenuation values was 0-35 dB for two of the frequencies (250 and
2000 Hz), and the measured attenuation at 500 and 1000 Hz was also extremely variable (10-30

64
dB and 5-35 dB, respectively). Thus, some of the subjects did not receive any attenuation (at
least at the lower frequencies), and their data were not actually representative of someone
wearing hearing protectors. In the case of little or no difference between occluded and un-
occluded speech levels in quiet, Tufts and Frank (2003) suggested that shallow insertion of the
earplugs caused the attenuation of the air-conduction component and the enhancement of the
bone-conduction component of the subjects’ speech to offset one another. No further
experiments were conducted to isolate the contributions of ear canal occlusion and reduction of
the airborne sound.
To summarize, there are many aspects related to fully understanding verbal
communication between noise-exposed workers that are wearing hearing protection. The extent
of the effects caused by wearing a hearing protector and while being subjected to high noise
levels has not been fully explained in the literature. One part of this discussion centers around
how the occlusion effect and attenuating the sound of a person’s voice reaching his/her ears
generally produce opposite effects on that individual’s vocal output. As described in the
following sections, a carefully controlled laboratory study was devised to systematically examine
these issues. Although overall voice level alone does not provide all of the necessary clues,
quantifying this component will provide insight into one aspect of the problems encountered
when attempting to communicate in hazardous noise conditions.

65
3.0 RESEARCH QUESTION AND METHODS
3.1 OBJECTIVE
The intent of this project was to investigate acoustic changes in speech characteristics that occur
when producing speech while wearing hearing protection in noisy environments. As indicated
above, the primary factors are the occlusion effect and the attenuation provided by hearing
protectors.
Based on an analysis of the gaps and inconsistencies in the knowledge in this area, the
following research questions were posed: What is the effect on voice output level when the
attenuation provided by a hearing protective device worn by an individual is carefully
controlled? Next, if changes in speech output are observed when hearing protection is worn,
which mechanism – ear canal occlusion or hearing protector attenuation – has a greater effect on
an individual’s voice output level?
In addition to providing a basis for future work involving speech intelligibility testing,
this project has other practical implications. Speaking with a lowered voice level could have an
adverse effect on the intelligibility (i.e., understanding) experienced by the intended listener in a
background of noise. If a talker consistently lowers his/her speech level due to the occlusion
effect, then individuals that must be heard and understood in a noisy environment should be
instructed to wear hearing protectors that reduce/minimize this effect. If the attenuation provided
66
by the hearing protector is what causes an individual to change his/her vocal output, then very
careful selection of the best hearing protector for a particular noise environment is necessary, in
order to provide adequate attenuation (protection) while promoting optimal speech production.
3.1.1 Hypotheses
The hypotheses to be tested were derived from previous studies described in the literature that
revealed conflicting results. The following null hypotheses were tested in an effort to advance
the knowledge base and provide information to better understand how speech production is
influenced by wearing hearing protection:
Hypothesis #1 Ear canal occlusion does not produce a change in a person’s voice output
level when hearing protectors are worn and background noise is present.
Hypothesis #2 The attenuation provided by a hearing protector does not produce a
change in a person’s voice output levels when hearing protectors are worn and background noise
is present.

67
3.2 STUDY PLAN
3.2.1 Approach
The purpose of this study was to assess the effect of ear canal occlusion and hearing protector
attenuation (in different background noise levels) on the overall level of a talker’s vocal output.
To test whether differences in vocal characteristics are due solely to the occlusion effect, speech
produced while subjects’ ear canals were occluded was measured without the subject receiving
any attenuation from the hearing protectors. To achieve this condition, the subject’s own voice
was reproduced (in real-time) through a set of headphones, essentially restoring the same sound
level reaching his/her ears as when the hearing protectors are not worn (i.e., the attenuation of
the protectors is being offset). To test whether vocal output differences are due to the reduction
in the talker’s self-perceived voice level, the amount of occlusion was held constant while
changing the effective hearing protector attenuation.
The study design relied on independently controlling the amount of effective attenuation
for different occlusion effect conditions. This was accomplished by assembling an “air-
conduction voice feedback restoration system” that consists of a microphone, a graphic
equalizer, an amplifier (headphone driver), and a set of stereo headphones. The purpose of the
air-conduction feedback restoration system was to offset the attenuation of the hearing
protectors. Subjects’ own voices were picked up by the microphone, amplified by a specified
amount, and played back through the headphones to simulate different amounts of effective
attenuation, including 0 dB.

68
3.2.1.1 Voice feedback system instrumentation
A schematic diagram of the air-conduction restoration system is shown in Figure 1.
Instrumentation for this system consisted of an Earthworks SR78 hypercardioid microphone
connected through its companion LAB 101 preamplifier to an Ashly NE4400 digital signal
processor.
Figure 1. Air-conduction feedback (voice restoration) system.
The signal processor was configured as a dual-channel 31-band graphic equalizer running at a 96
kHz sampling rate and 24-bit resolution. Individual adjustments of ±15 dB in each one-third
octave-band can be made with the graphic equalizer function. Overall performance
characteristics include a frequency response of 20 Hz to 20 kHz (±0.25 dB), a dynamic range of
>114 dB, and total harmonic distortion of <0.002%. An Ethernet connection to a laptop
computer was used to change settings on the signal processor.
Graphic EqualizerHeadphone Driver
Microphone (located in front of subject’s mouth)

69
The output of the signal processor was directed to a Rane HC-6S headphone amplifier
and Sennheiser model HDA 200 audiometric headphones. These headphones are routinely used
for extended high-frequency audiometric testing, and have a frequency response of 20 Hz to 20
kHz. The headphones were modified slightly by inserting a custom-molded one-half inch thick
solid plastic spacer between each earcup shell and cushion. This modification extends the earcup
further away from the wearer’s head and eliminates any possibility of the headphone interfering
with an earplug when one is worn underneath. Additionally, the added room under the earcup
effectively increases the volume of enclosed air, thereby partially offsetting the space taken up
by the transducer.
As an aside, the initial plan was to use Sennheiser model HD 800 headphones instead of
the HDA 200 headphones. The HD 800 headphones employ an “open-back” design to lessen the
feeling of isolation (and the occlusion effect) to the wearer. As illustrated in the next section,
using the HDA 200 “closed-back” headphones for the voice feedback system was a necessary
compromise when earplugs were used to occlude the subjects’ ear canals.
3.2.1.2 Evaluation of voice feedback instrumentation
Preliminary testing found that an open-back headphone was not feasible, and the HDA 200’s
hard earcup shells and snug fit were necessary to reduce the leakage of sound from the
headphones and avoid an acoustic feedback loop. Figure 2 confirms that this was not an
unrealistic compromise. This graph illustrates that the occlusion effect did not change when
measured with the earplugs alone and then measured again with the HDA 200 headphones
covering the subject’s ears. The occlusion effect produced by the earplug was far more dominant
than any effect of the headphone. This finding is consistent with previous research that indicated
if the volume of trapped air under an earmuff is large enough, then the occlusion effect is

70
negligible (Stenfelt & Reinfeldt, 2007). This was verified on each subject by repeating the
occlusion effect measurement (described later in section 3.2.2) while wearing the HDA 200
headphones over the earplugs (with the headphones unplugged).
Figure 2. Example of ear canal measurements during sustained vocalization of /i/.
The air-conduction feedback system also was tested to determine the amount of delay
between the arrival of a signal at the microphone and the delivery of the signal through the
headphones. A delay of more than 15 msec would likely be perceived by the subject as an
annoying echo, and would interfere with conducting the experiment (Stone & Moore, 2002). An
evaluation was conducted by placing the input microphone into a hearing aid test chamber and
playing one-third octave-bands of noise from 125 Hz to 8000 Hz through the chamber’s
loudspeaker. A KEMAR manikin was used to measure the headphone output. The cross-
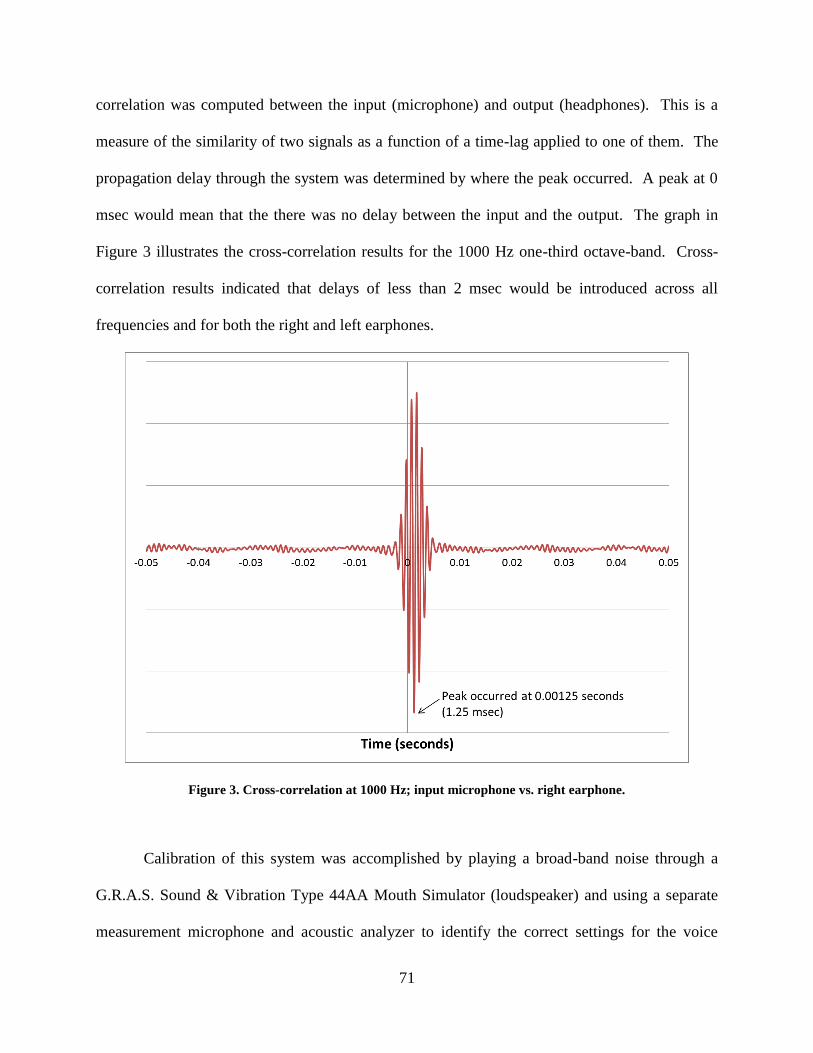
71
correlation was computed between the input (microphone) and output (headphones). This is a
measure of the similarity of two signals as a function of a time-lag applied to one of them. The
propagation delay through the system was determined by where the peak occurred. A peak at 0
msec would mean that the there was no delay between the input and the output. The graph in
Figure 3 illustrates the cross-correlation results for the 1000 Hz one-third octave-band. Cross-
correlation results indicated that delays of less than 2 msec would be introduced across all
frequencies and for both the right and left earphones.
Figure 3. Cross-correlation at 1000 Hz; input microphone vs. right earphone.
Calibration of this system was accomplished by playing a broad-band noise through a
G.R.A.S. Sound & Vibration Type 44AA Mouth Simulator (loudspeaker) and using a separate
measurement microphone and acoustic analyzer to identify the correct settings for the voice
72
feedback system. The mouth simulator was placed on a stand in a quiet room, adjacent to a
double-walled audiometric booth. White noise was played at 65 dB through the mouth simulator
with the measurement microphone and voice feedback microphone placed side-by-side five
inches away. The voice feedback headphones were worn by a KEMAR manikin located inside
the booth. Acoustically separating the KEMAR measurement system from the mouth simulator
was necessary to prevent the manikin from directly picking up the sound from the mouth
simulator. The overall level of the voice feedback system was adjusted until the KEMAR
reading matched the measurement microphone level. This defined the unity gain setting, i.e.,
where the level was exactly the same under the voice feedback system headphones as it was
directly in front of the mouth simulator. This established the reference point or 0 dB attenuation
condition. From here, the overall level of the voice feedback system could be varied by a precise
amount (e.g., 10, 20, or 30 dB) to simulate different amounts of hearing protector attenuation.
Ideally, the voice feedback system’s microphone should be placed as close as possible to
the subjects’ ear. This would ensure that the input to the microphone would be virtually identical
to the amount of the self-generated speech signal reaching the subjects’ ear canal via air-
conduction. However, this was not practically possible because the high level of the subject’s
amplified speech would cause acoustic feedback. That is, a high frequency squeal occurred
when the amplified signal from the headphone was picked up by the ear-level microphone, re-
amplified, and played back through the headphone. This problem was solved by placing the
microphone in front of the subject’s mouth instead of adjacent to the ear. This required an
adjustment to be made in the headphone output to account for head diffraction effects, because
the sound radiated from the mouth changes somewhat as it travels around a person’s head to
his/her own ear (Dunn & Farnsworth, 1939; Porschmann, 2000). This mouth-to-ear transfer

73
function is gently sloping from the low to high frequencies, except for slight dips at 900 and
2700 Hz, and then drops off significantly above 6000 Hz. A final adjustment of the graphic
equalizer was performed to simulate this effect.
3.2.2 Ear canal occlusion conditions
To study the influence of the occlusion effect, speech produced by a subject was recorded under
three occlusion conditions, i.e., while his/her ear canals were occluded with three different
hearing protectors. The maximum occlusion effect is known to be produced by occluding the ear
canal right at the entrance. A hand-formed putty-type earplug (Mack’s silicone putty earplugs)
that does not extend into the ear canal was used for this condition. Minimum occlusion effects
are known to be produced either by a deeply inserted earplug or by earmuffs with a large earcup
volume. The first of these minimum occlusion conditions was tested using a fully inserted foam
earplug (E·A·R® Classic
®) and the second was assessed by using a set of earmuffs. The
Sennheiser HDA 200 audiometric headphones that were used are actually Peltor H7 earmuffs
(intended for protection from hazardous noise) with built-in earphone transducers. Thus, the
Sennheiser HDA 200 headphones provided both the earmuff-induced occlusion effect also while
acting as the headphones for the subject’s voice feedback system.
The occlusion effect for each hearing protector fitting was quantified by measuring the
sound level in each ear canal with and without the hearing protectors, while the subject vocalized
the vowel /i/. IntriCon Tibbetts 151 Series sub-miniature microphones (0.10 inch diameter
cylinder; 0.132 inches long) were used to simultaneously measure the level in both ear canals.
These microphones were connected to a computer-based signal analysis system using a National
Instruments 9234 compact data acquisition module (24-bit resolution; 51.2 kHz sampling rate).

74
The subject was instructed to watch the display on a hand-held sound level meter, and to sustain
the vocalization at a comfortable level (e.g., 65 dB) for a few seconds until the measurement was
made. The exact level was not important; however, it was critical for the subject to produce the
same level when the vocalization was repeated when the protector was worn. The occlusion
effect is represented by the difference (in decibels) between the level in the ear canal with and
without the hearing protector in place.
3.2.3 Hearing protector attenuation conditions
Four attenuation conditions were evaluated: 0, 10, 20, and 30 dB. The 0 dB attenuation condition
was used to evaluate the outcome solely due to the occlusion effect. This is an artificial listening
situation that must be created where the subject is (in effect) not receiving attenuation from the
particular hearing protectors being worn. Each of the four attenuation conditions was created by
re-introducing the subject’s own voice (at different levels) through the air-conduction restoration
headphones worn in combination with the hearing protectors. Different amounts of attenuation
were simulated by changing the headphone output. For example, the attenuation (insertion loss)
provided by a 30 dB hearing protector would be completely offset by raising the headphone
output by 30 dB.
3.2.3.1 Attenuation measurements
Figure 4 illustrates the test set-up for the hearing protector attenuation (insertion loss)
measurements. For the two earplug test conditions, an IntriCon Tibbetts 151 Series sub-
miniature microphone was positioned in each ear canal at a point that would be medial to the
earplug when it was inserted, and temporarily held in place with adhesive tape. White noise was

75
played at a level of 80 dBA through two stand-mounted loudspeakers located at 45-degree angles
to the subject while the microphones measured the level in each ear canal, with the subject not
wearing any earplugs.
Figure 4. Instrumentation for hearing protector attenuation testing.
Next, earplugs were inserted into the subject’s ear canals by the investigator. The
microphone wires were inserted through the earplug, enabling the microphone to be located in
the ear canal at the same position as in the previous step. For the disposable foam earplugs, a
small hole was made through the center (without removing any of the foam material) to route the
microphone wires. The expandable foam collapsed around the lower portion of the microphone
where the wires attached and sealed the hole. The hand-formed putty-type earplugs were molded
around the microphone wires when the ear canal was occluded at the entrance.

76
Finally, the white noise was raised to 90 dBA to ensure the level in the ear canal was
above the noise floor of the microphones, and played again while the attenuated sound level in
both ear canals was measured. The attenuation (insertion loss) of the earplug was determined by
subtracting the occluded from the unoccluded measurement, minus the extra 10 dB.
Attenuation measurements of the earmuffs were made by a similar procedure as
described above for the earplug condition. The microphone wires (29 AWG; 0.019-inch outside
diameter) were thin enough to be routed under the headphone cushions without significantly
interfering with the earcup seal.
As mentioned earlier in Section 2.5, the NRR is the manufacturer’s rating for the amount
of sound attenuation provided by a hearing protector. Due to the known issues surrounding the
NRR’s validity, it was used solely as a general guide for the amount of attenuation expected.
Slight deviations from the labeled attenuation were anticipated and did not pose a problem for
this study; however, the earplug was re-seated if the measured attenuation was substantially
below the expected amount.
3.2.3.2 Setting the voice feedback system
After the attenuation measurements were obtained, overall amplification level and graphic
equalizer adjustments were made to offset the attenuation of the earplugs. The occluded and
unoccluded measurements were saved into a spreadsheet that was pre-configured to perform the
necessary calculations. First, each one-third octave-band in the graphic equalizer was
individually adjusted to make the frequency spectrum match the shape of the measured
attenuation for each ear. Then the overall headphone amplifier gain level was used to set the
correct level.
77
It is important to note that although none of the three hearing protectors exhibited
uniform (flat) attenuation characteristics, the range of the lowest to the highest amount of
attenuation for each one was less than 30 dB, which was the maximum range of the graphic
equalizer (i.e., ±15 dB). The four attenuation level conditions (0, 10, 20, and 30 dB) were
obtained by adjusting the master headphone output in 10-dB increments.
3.2.4 Background noise levels
Pink noise (i.e., constant energy per octave band; downward slope of 3 dB per octave) was used
for this study, since it represents a well-defined spectrum and has a predominantly low frequency
emphasis, which is typical of many industrial environments (Johnson & Nixon, 1974). A pink
noise generator function on the Ashly NE4400 digital signal processor was internally routed to
the subject’s headphones through a signal mixer function within the same signal processor. Four
different noise level conditions were used: quiet, 75, 85, and 95 dBA. The quiet condition was
used to evaluate the occlusion effect in isolation. The 95 dBA level was chosen as the maximum
since most industrial noise environments do not exceed this level, and unaided speech
communication in higher ambient noise levels is usually impractical (Franks, 1988). All noise
levels were calibrated and periodically confirmed by measurements conducted on the KEMAR
manikin, and did not change throughout the course of the study.
3.2.5 Speech measurements
Several different options exist for choosing speech material for this experiment, each of which
has certain benefits and drawbacks. Examples include: production of a sustained vowel sound;
78
repeating words or sentences from a list; reading an excerpt such as the commonly used Rainbow
Passage; or simply providing a spontaneous speech sample. The overarching goal is to identify
any speech differences found in real-life industrial working situations; however, this must be
done within the context of a controlled experimental condition.
Instructing the subject to sustain a single phoneme/vowel sound for several seconds
would create an ideal speech sample for subsequent acoustical analysis. Unfortunately, the
subject cannot be expected to make such a vocalization understandable to a listener. Reciting a
short passage would solve this problem, but only if all subjects had memorized it to avoid
sounding like they were reading. Eliciting a spontaneous conversational speech sample would
address both the understanding and natural-sounding issues, but this would introduce too much
variability among the subjects’ responses to be suitably analyzed.
Considering the above-mentioned constraints, short sentences/phrases developed as a
speech test for industrial workplaces by Cluff et al. (1993) were chosen for this study. This test
material comprises eight lists of phrases with twenty 3- to 5-syllable phrases in each set (see
Appendix A). Most of the phrases are short commands, instructions, or questions. Each list was
created to be phonetically balanced and of approximately equal difficulty. To enable direct
comparison among the different experimental conditions, only one of the eight lists (List #1) was
used in this study. To avoid differences caused by intonation, for this study four of the phrases
(Nos. 1, 11, 14, and 20) were changed to be declarative rather than interrogative. This involved
reversing the order of a few words and substituting two of the original words (see Appendix B).
The test materials spoken by each subject were recorded for later analysis. Recordings
were obtained in a double-wall audiometric booth at the NIOSH Robert A. Taft laboratory
building in Cincinnati, Ohio. A G.R.A.S. Sound & Vibration Type 40HF 1-inch low-noise
79
measurement microphone system and a computer-based data acquisition system using a National
Instruments 9234 compact data acquisition module (24-bit resolution; 51.2 kHz sampling rate)
were used. The 1-inch microphone was connected to the manufacturer-recommended Type
26HF preamplifier and Type 12HF power supply. Together, this system has a measured
sensitivity of 1,157 mV/Pa and a frequency response of ±2 dB from 10 Hz to 10 kHz. A
G.R.A.S. Type 42AP pistonphone was used to record a calibration tone (250 Hz; 94 dB SPL) at
the beginning of each WAV file, to enable precise scaling and subsequent analysis of the speech
samples. All measurement instrumentation used in this study is sent to an accredited laboratory
for annual calibrations.
Subjects were instructed to speak as if they were trying to be heard and understood by a
person seated one meter away (i.e., at the measurement microphone location). A KEMAR
manikin head/torso was positioned at the subjects’ eye level behind the measurement
microphone for this experiment. Subjects were told that the manikin represented an intended
human listener.
The Cluff et al. (1993) phrases lend themselves to being recited in a way that closely
resembles speech spoken in a noisy environment. To facilitate this, the phrases were projected
sequentially onto a wall-mounted computer monitor located directly above the manikin’s head.
Subjects were prevented from simply “reading” the test materials by a MATLAB routine that
controlled the display. Each phrase was shown on the computer screen for 1.5 seconds (in black
colored block letters on a light gray background), and then the words were removed and a solid
green color was shown for 2.5 seconds. The subjects were instructed to wait until the screen
turned green before speaking. In order to maintain consistency across all measurement trials, the
following instructions were read to the subject:
80
You will be wearing different hearing protectors and will be hearing different
amounts of noise. Please watch for words to appear on the screen and say each
phrase in such a way that your conversation partner (the manikin) will be able to
understand what you said. Don’t just read the words; wait until the screen turns
green before speaking. There are 20 phrases, and it will take you about 80-90
seconds for the whole list. Don’t worry if you make a mistake – just wait until the
next phrase appears and keep going. After each set of 20 phrases, there will be a
10-15 second pause while I make a few adjustments, and then you will go right
into the next list. There will be total of 16 lists before we need to change hearing
protectors. Please let me know if you need a break or a drink of water before you
are ready to continue.
3.3 STUDY PARTICIPANTS
3.3.1 Protection of human subjects
This study was non-exempt according to 45 CFR 46.110 (Department of Health and Human
Services, 2005). The study protocol was submitted both to the University of Pittsburgh Human
Subjects Review Board as well as the CDC/NIOSH Human Subjects Review Board for an
expedited review. This study qualified for an expedited review because the proposed research
methods presented no more than minimal risk to human subjects, and data collection was
accomplished through noninvasive procedures that are routinely employed in clinical/research
settings.
81
Study participants were paid volunteers recruited via personal contacts. Only individuals
over 18 years old were eligible for participation in this study because the hearing protectors that
were used are designed for working-age adults. No exclusions were made based on
race/ethnicity, gender, or HIV status. Since participation in this study did not involve a risk of
physical harm, women of childbearing potential were not queried as to pregnancy status nor
tested for pregnancy. No other special subject populations (e.g., prisoners, mentally disabled
persons) were enrolled in this study. Potential subjects were fully informed of the nature of the
research project, the risks and potential benefits of study participation, and their rights as a
research subject. A standard Informed Consent form was signed by the participant and the
researcher prior to performing any screening/testing procedures.
All subject testing was conducted in an ambient environment of 95 dBA or less. Levels
above 85 dBA are considered to be hazardous to unprotected ears; however, it is important to
note that the hearing protectors worn during this study reduced the amount of noise exposure
each subject received to a non-hazardous level. Even if a high noise level temporarily reached a
subject’s ears, the unprotected exposure time added up to significantly less than 48 minutes,
which is the time required for a subject to receive a daily noise dose of 100% based on exposure
to 95 dBA as computed according to the NIOSH recommended occupational noise exposure
criteria (NIOSH, 1998). Using the NIOSH recommended criteria is more protective than the
OSHA noise exposure regulation, which permits a 4-hour unprotected exposure to 95 dBA
(OSHA, 1983).
82
3.3.2 Qualification procedures
Individuals eligible for participation in this study included only working-age adults (18 - 65
years old) who were able to successfully wear hearing protectors. Exclusion criteria included
non-native speakers of English, the inability to read, and certain medical conditions that could
invalidate the testing. Each subject’s ear canals were examined with an otoscope; subjects were
ineligible for participation in the study if there was excessive cerumen present, e.g., an amount
that prohibited visualization of the eardrum and/or would interfere with ear canal microphone
placement and earplug fitting. Potential participants were asked about the presence/absence of
cognitive impairment, a motor speech disorder, or any related physical condition. While none of
the subjects noted a positive history, participants would have been dismissed for any abnormal
conditions.
To eliminate the potentially confounding effects a pre-existing hearing loss might have
on speech production measures, subjects were required to have normal hearing sensitivity (i.e.,
hearing thresholds ≤20 dB HTL) at all audiometric test frequencies from 125 to 8000 Hz in each
ear. An air-conduction pure-tone audiogram (using supra-aural earphones) was obtained on each
participant. Testing was conducted in a double-wall sound-treated booth having ambient noise
levels in accordance with ANSI S3.1-1999 (R2008), Table 1 (ears covered, supra-aural
earphones) using an audiometer calibrated to ANSI S3.6-2010 specifications. Although this did
not occur, if a subject were to volunteer for this study but be disqualified due to a pre-existing
hearing loss, he/she would have been referred to his/her personal physician for follow-up. No
medical diagnosis was offered by the researcher; only a description of the audiogram was
provided.
83
3.4 TEST PROCEDURE
Subjects were seated in a double-wall audiometric booth facing the corner where the KEMAR
manikin and computer monitor were located. The measurement microphone was located 1-meter
away from the subject, directly in front of the manikin’s mouth. The manikin, measurement
microphone, and subject’s head were located approximately on the same horizontal plane. To
familiarize the subject with the test procedure and to establish a control condition, the subject
was instructed to recite the first list of test phrases without wearing any earplugs/earmuffs (and
no background noise). A second practice list was recorded with the subject wearing the HDA
200 headphones, without any voice feedback or background noise (the headphones were not
plugged in for this test). The subject was then fitted with the first set of hearing protectors and
the occlusion effect and insertion loss were measured according to the procedures outlined
above.
For the actual testing, subjects were instructed to speak the test materials under the four
attenuation conditions (0 dB, 10 dB, 20 dB, and 30 dB) and background noise levels (quiet, 75
dBA, 85 dBA, and 95 dBA) for that set of hearing protection. The pink background noise (along
with the subject’s voice) was delivered in real-time via the air-conduction restoration headphone
system described above. Figure 5 depicts how the subjects and instrumentation were positioned
for data collection. Note that the pink noise generator, graphic equalizer, and mixer are shown as
three separate devices; however, the Ashly NE4400 signal processor actually performs all of
these functions.

84
Figure 5. Instrumentation for data collection.
The same procedure was repeated for the other two hearing protectors (occlusion
conditions). Testing for each occlusion condition took approximately one hour. Some subjects
only completed one or two conditions on a particular day, while most of them stayed and
completed all three hours of testing during one visit to the laboratory.
3.5 EXPERIMENTAL DESIGN
This study employed a split-plot design with complete blocks in which a subject represents a
block. Dean and Voss (1999, p. 675) indicate that a split-plot design is useful when some factors
are more inconvenient to change than others. In this study, the occlusion condition (i.e.,
continually removing/reinserting the earplugs) would be considerably more difficult to change
than the other two factors. If the time slot of measurement is viewed as the experimental unit,
Graphic
Equalizer
Headphone Driver
Mixer
Pink Noise Generator
Spectrum
Analyzer/Waveform
Recorder
Measurement microphone
Feedback microphone

85
the occlusion condition may be considered the whole plot and the split-plots are the 16
combinations of background noise and hearing protector attenuation. The order of occlusion
conditions for each subject were randomized; however, after each occlusion condition (i.e., type
of hearing protector) was set, all 16 combinations of hearing protector attenuation and
background noise levels were run (in a randomized order) before changing the type of occlusion.
Tables 6, 7, and 8 illustrate the matrices used for data collection. Appendix C contains the actual
randomized subject testing schedule used.
Table 6. Data collection matrix for occlusion condition #1 (deep insertion foam earplug).
Table 7. Data collection matrix for occlusion condition #2 (putty-type earplug).
Background: quiet Background: 75 dB Background: 85 dB0 dB 10 dB 20 dB 30 dB 0 dB 10 dB 20 dB 30 dB 0 dB 10 dB 20 dB 30 dB 0 dB 10 dB 20 dB 30 dB
S1S2S3S4
S17S18
Occlusion Condition: Deep insertion earplug (Minimum occlusion effect)Background: 95 dB
Background: quiet Background: 75 dB Background: 85 dB0 dB 10 dB 20 dB 30 dB 0 dB 10 dB 20 dB 30 dB 0 dB 10 dB 20 dB 30 dB 0 dB 10 dB 20 dB 30 dB
S1S2S3S4
S17S18
Occlusion Condition: At earcanal entrance (Putty-type HPD, Maximum occlusion effect)Background: 95 dB
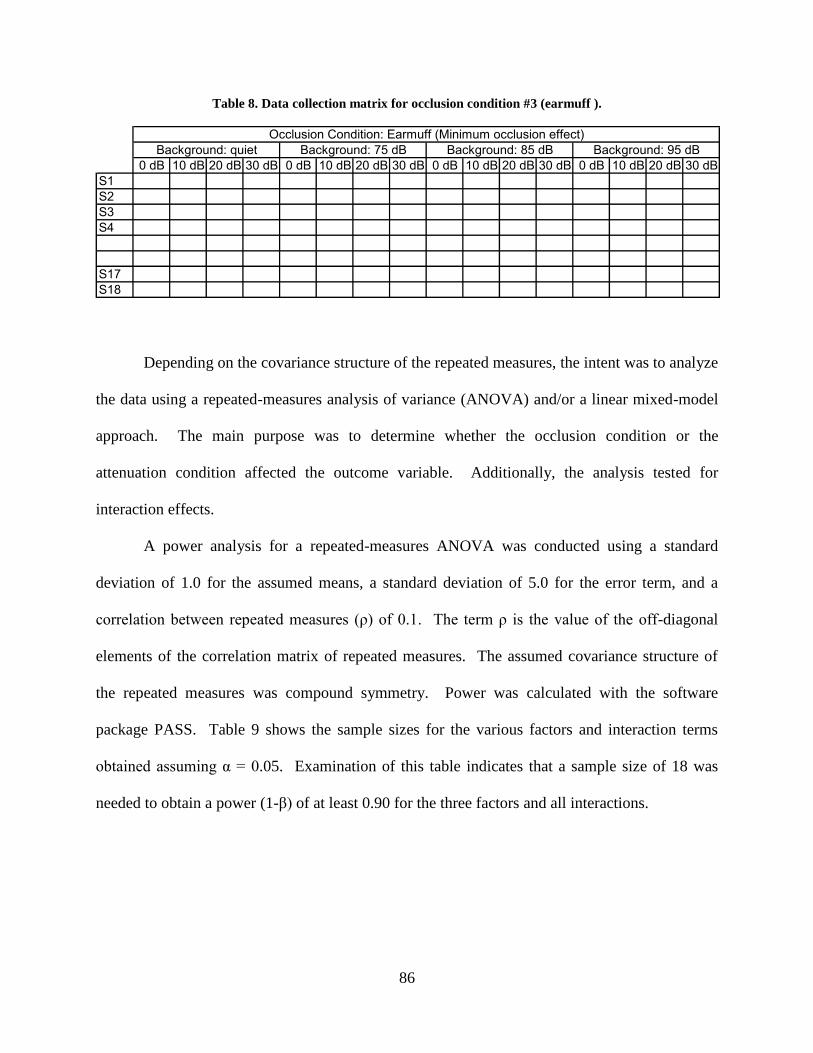
86
Table 8. Data collection matrix for occlusion condition #3 (earmuff ).
Depending on the covariance structure of the repeated measures, the intent was to analyze
the data using a repeated-measures analysis of variance (ANOVA) and/or a linear mixed-model
approach. The main purpose was to determine whether the occlusion condition or the
attenuation condition affected the outcome variable. Additionally, the analysis tested for
interaction effects.
A power analysis for a repeated-measures ANOVA was conducted using a standard
deviation of 1.0 for the assumed means, a standard deviation of 5.0 for the error term, and a
correlation between repeated measures (ρ) of 0.1. The term ρ is the value of the off-diagonal
elements of the correlation matrix of repeated measures. The assumed covariance structure of
the repeated measures was compound symmetry. Power was calculated with the software
package PASS. Table 9 shows the sample sizes for the various factors and interaction terms
obtained assuming α = 0.05. Examination of this table indicates that a sample size of 18 was
needed to obtain a power (1-β) of at least 0.90 for the three factors and all interactions.
Background: quiet Background: 75 dB Background: 85 dB0 dB 10 dB 20 dB 30 dB 0 dB 10 dB 20 dB 30 dB 0 dB 10 dB 20 dB 30 dB 0 dB 10 dB 20 dB 30 dB
S1S2S3S4
S17S18
Background: 95 dBOcclusion Condition: Earmuff (Minimum occlusion effect)
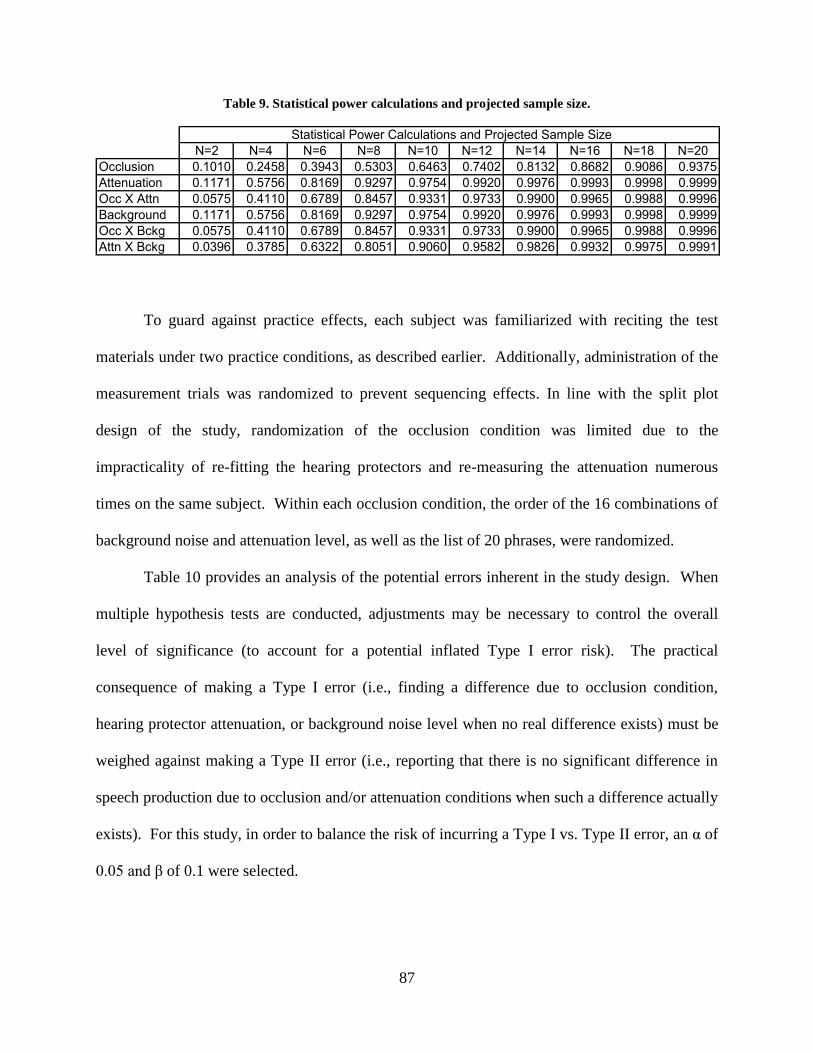
87
Table 9. Statistical power calculations and projected sample size.
To guard against practice effects, each subject was familiarized with reciting the test
materials under two practice conditions, as described earlier. Additionally, administration of the
measurement trials was randomized to prevent sequencing effects. In line with the split plot
design of the study, randomization of the occlusion condition was limited due to the
impracticality of re-fitting the hearing protectors and re-measuring the attenuation numerous
times on the same subject. Within each occlusion condition, the order of the 16 combinations of
background noise and attenuation level, as well as the list of 20 phrases, were randomized.
Table 10 provides an analysis of the potential errors inherent in the study design. When
multiple hypothesis tests are conducted, adjustments may be necessary to control the overall
level of significance (to account for a potential inflated Type I error risk). The practical
consequence of making a Type I error (i.e., finding a difference due to occlusion condition,
hearing protector attenuation, or background noise level when no real difference exists) must be
weighed against making a Type II error (i.e., reporting that there is no significant difference in
speech production due to occlusion and/or attenuation conditions when such a difference actually
exists). For this study, in order to balance the risk of incurring a Type I vs. Type II error, an α of
0.05 and β of 0.1 were selected.
Statistical Power Calculations and Projected Sample SizeN=2 N=4 N=6 N=8 N=10 N=12 N=14 N=16 N=18 N=20
Occlusion 0.1010 0.2458 0.3943 0.5303 0.6463 0.7402 0.8132 0.8682 0.9086 0.9375Attenuation 0.1171 0.5756 0.8169 0.9297 0.9754 0.9920 0.9976 0.9993 0.9998 0.9999Occ X Attn 0.0575 0.4110 0.6789 0.8457 0.9331 0.9733 0.9900 0.9965 0.9988 0.9996Background 0.1171 0.5756 0.8169 0.9297 0.9754 0.9920 0.9976 0.9993 0.9998 0.9999Occ X Bckg 0.0575 0.4110 0.6789 0.8457 0.9331 0.9733 0.9900 0.9965 0.9988 0.9996Attn X Bckg 0.0396 0.3785 0.6322 0.8051 0.9060 0.9582 0.9826 0.9932 0.9975 0.9991

88
Table 10. Analysis of the severity of potential research outcome errors.
Erroneous finding: Consequence:
Error
type: Practical significance:
Severity
of error:
Occlusion condition shows an effect
Recommend that noise-exposed workers wear HPDs that produce a
Type I If the occlusion effect is small, the talker's voice is more natural-sounding
Low
certain occlusion effect A large occlusion effect causes one's own voice to sound unnatural
High
Occlusion condition does not show an effect
No specific recommendations regarding the occlusion effect are given
Type II Missed opportunity to recommend a method to increase speech level (by not recommending a particular occlusion effect)
High
Attenuation condition shows an effect
Recommend the HPD that provides a specified amount of attenuation for a particular noise environment
Type I Although the HPD's attenuation is not affecting speech production, selecting the minimum necessary attenuation will prevent the feeling of isolation
Low
If a high attenuation device is used, it could interfere with speech communication
High
Attenuation condition does not show an effect
No specific recommendations regarding HPD attenuation (at least for speech intelligibility) are given
Type II Missed opportunity to recommend a method to increase speech level (by not recommending that the HPD with a certain amount of attenuation be selected)
High
Background noise level shows an effect
The Lombard Effect is already known. No specific recommendations can be given regarding HPD selection.
Type I HPDs will be selected according to some criteria (other than speech intelligibility)
Low
Background noise level does not show an effect
No specific recommendations will be given regarding HPD selection
Type II HPDs will be selected according to some criteria (other than speech intelligibility)
Low
There is an interaction between the occlusion and attenuation conditions
Recommend that both the occlusion effect and attenuation must be considered when selecting an HPD
Type I Although both the occlusion effect and HPD attenuation are not affecting speech level, the particular combination of these two variables used could cause the talker's voice to be very unnatural sounding
High
There is no interaction between the occlusion and attenuation conditions
Recommend that only the main effect of occlusion or attenuation (if any) needs to be considered when selecting an HPD
Type II Missed opportunity to recommend a method to increase speech intelligibility (by not recommending that both the occlusion effect and HPD attenuation be optimized)
High
There is an interaction between the occlusion condition and background noise level
Cannot change the background noise level; can only make a recommendation that a specific occlusion effect be obtained
Type I If the occlusion effect is small, the talker's voice is more natural-sounding
Low
A large occlusion effect causes one's own voice to sound unnatural
High
There is no interaction between the occlusion condition and background noise level
Recommend that only the main effect of occlusion (if there is one) needs to be considered when selecting an HPD (see above)
Type II Missed opportunity to recommend a method to increase speech intelligibility (by not considering the interaction between the occlusion effect and background noise level)
High
There is an interaction between the attenuation condition and background noise level
Cannot change the background noise level; can only make recommendations regarding HPD attenuation (see above)
Type I Although both the HPD attenuation and background noise level are not affecting speech production, minimizing the HPD attenuation is less likely to cause the feeling of isolation
Low
If a high attenuation device is used, it could interfere with speech communication
High
There is no interaction between the attenuation condition and background noise level
Only the main effect of attenuation (if any) needs to be considered when selecting an HPD (see above)
Type II Missed opportunity to recommend a method to increase speech intelligibility (by not considering the interaction between the HPD attenuation and background noise level)
High

89
4.0 RESULTS
4.1 PRELIMINARY MEASURES
4.1.1 Occlusion effect measurements
The occlusion effect produced by each hearing protector was obtained by measuring the sound
level in each ear canal while the subject vocalized the vowel /i/ first without the hearing protector
and again with the protectors in place. As described earlier, Figure 2 provides an example of
these measurements. A value for the occlusion effect in each ear was obtained by subtracting the
level measured with the hearing protectors being worn from the level measured without any
hearing protectors.
Figure 6 contains the average values of the occlusion effect for each of the three
occlusion conditions (as produced by the three different hearing protectors) for all 18 subjects.
As expected, the occlusion effect occurred at 2000 Hz and below, and the largest occlusion effect
was seen with the putty-type earplugs because they block the ear canal right at the entrance. The
earmuffs produced the least occlusion effect, while the effect of the foam earplugs was between
the other two occlusion conditions. These results follow the occlusion effect patterns found by
other researchers (e.g., Stenfelt & Reinfeldt, 2007).

90
Figure 6. Average measured occlusion effect for each occlusion condition (hearing protector type). Standard
deviations are for average of both ears for each hearing protector type.
4.1.2 Hearing protector attenuation measurements
A microphone-in-real-ear technique was used to measure the attenuation of each hearing
protector on both ears of each subject. The graph in Figure 7 depicts the average attenuation
results across all 18 subjects for each of the three hearing protectors. As expected, all three
protectors provided the most attenuation at the higher frequencies and the least attenuation at the
lower frequencies. The foam earplugs attained the highest attenuation; the earmuffs provided
somewhat less attenuation than the foam earplugs; and the putty-type plugs provided the least

91
amount. Comparisons were made between the measured attenuation at each one-third octave-
band from 125 Hz to 8000 Hz and the manufacturers’ reported data. Average attenuation results
were less than the manufacturer’s labeled values as well as the overall NRR reported for each
protector, which was not unexpected. The manufacturer’s attenuation data were used only as a
rough guide when fitting each individual subject with the earplugs. For the purposes of this
study, it was not necessary to achieve the labeled NRR value; the exact amount of attenuation
provided by each protector just had to be known in order for it to be offset by the voice feedback
system.
Figure 7. Average measured attenuation (mean values) for each hearing protector. Standard deviations are
for average of both ears for each hearing protector type.

92
4.2 EFFECT OF OCCLUSION TYPE, ATTENUATION, AND NOISE
The specific aims of this research included two questions: 1.) What is the effect on voice output
level when the attenuation provided by a hearing protective device worn by an individual is
carefully controlled? and 2.) If changes in speech production are observed when hearing
protection is worn, which mechanism – ear canal occlusion or hearing protection attenuation –
has a greater effect on an individual’s voice output level? The purpose of the analysis was to
determine the effects of occlusion, attenuation, and noise level on the voice level of the speaker
in order to address these questions.
4.2.1 WAV file analysis
Four of the twenty phrases (Appendix B) were chosen for analysis: “Block the door,” “Fill this
out,” “Block the road,” and “Crack the lid.” These phrases were selected primarily for their
consistency in pronunciation across the 16 test conditions for each subject. One reason for not
selecting certain phrases for analysis was that subjects tended to emphasize different syllables
depending on what the preceding phrase was, seemingly in an attempt to connect the individual
phrases together in a conversational manner. Thus, there were noticeable differences in the way
a particular phrase was spoken depending on the phrase that came immediately before it.
Likewise, despite being randomized, phrases that appeared often at the beginning of a list were
not included in the analysis because they were obviously spoken either softer or louder than the
remainder of the list, apparently as a carry-over from the noise/attenuation condition that had just
been completed.

93
A WAV file analyzer software program (Nelson Acoustic Software) was used to post-
process the audio recordings. Using an on-screen level vs. time plot, the start/stop times of each
utterance were able to be accurately identified. One-third octave-band sound pressure levels
obtained at each 5-msec time interval were summed to provide the overall sound pressure level
of each individual phrase.
A priori, one might wonder if the voice output levels would cover a large enough range to
suggest that differences might be meaningful between the conditions examined in this
experiment. In order to view the range of voice output levels measured in this experiment,
boxplots of all the responses for each subject for all occlusion, attenuation, and noise conditions
are shown in Figure 8. For each subject, the boxplot represents 192 data points, with the minor
exception of three subjects who had missing data (i.e., failed to respond) for one of the test
conditions. The range of voice level was quite pronounced for some subjects (e.g., subjects 3
and 11) and not for others (e.g., subjects 12 and 14). It appears that at least for many subjects a
meaningful difference in voice output levels may be achieved under the varying conditions
included in this experiment.
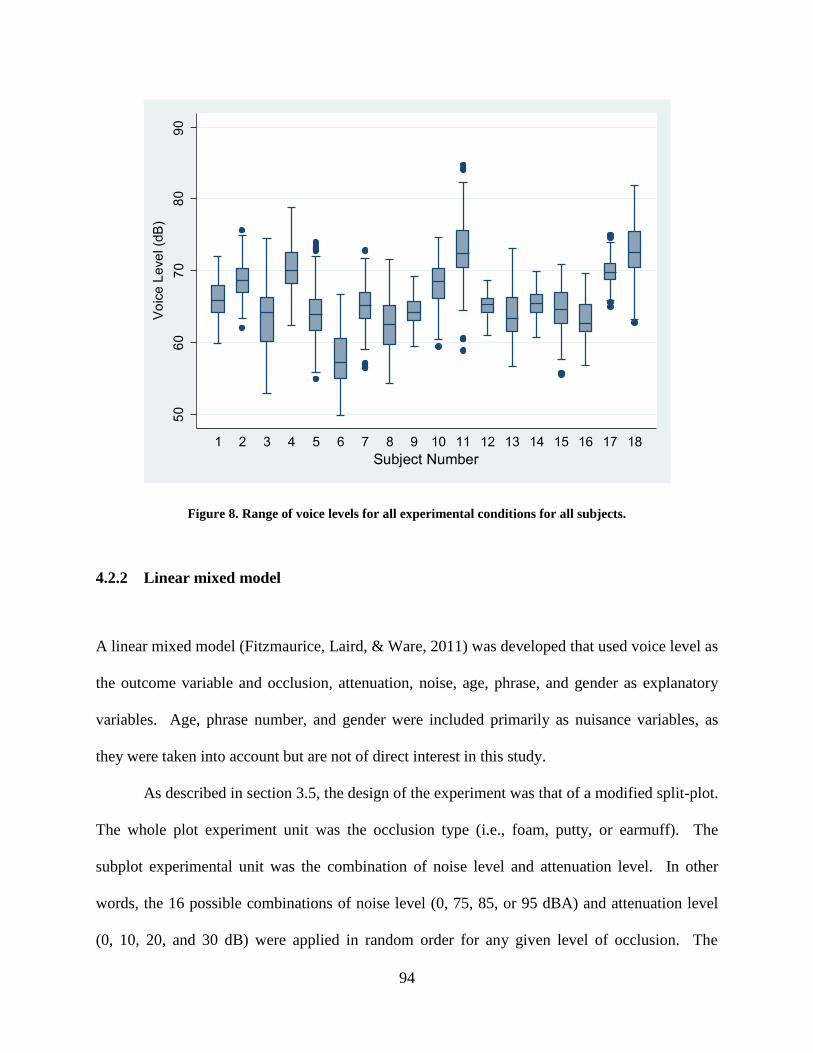
94
Figure 8. Range of voice levels for all experimental conditions for all subjects.
4.2.2 Linear mixed model
A linear mixed model (Fitzmaurice, Laird, & Ware, 2011) was developed that used voice level as
the outcome variable and occlusion, attenuation, noise, age, phrase, and gender as explanatory
variables. Age, phrase number, and gender were included primarily as nuisance variables, as
they were taken into account but are not of direct interest in this study.
As described in section 3.5, the design of the experiment was that of a modified split-plot.
The whole plot experiment unit was the occlusion type (i.e., foam, putty, or earmuff). The
subplot experimental unit was the combination of noise level and attenuation level. In other
words, the 16 possible combinations of noise level (0, 75, 85, or 95 dBA) and attenuation level
(0, 10, 20, and 30 dB) were applied in random order for any given level of occlusion. The
5060
7080
Voi
ce L
evel
(dB
)
1 2 3 4 5 6 7 8 9 10 11 12 13 14 15 16 17 18Subject Number
90

95
subject was treated as a random effect, as was the effect of occlusion. Thus, the overall linear
mixed model for the analysis was:
ijklmn i j k l ln iln m ijklmnij ik jk ijky s a x e
where ijklmny = voice level of talker, n = 1, 2, 3,…, 17, 18
µ = overall mean
i = fixed effect of occlusion type, i = 1, 2, 3 [foam, putty, earmuff]
j = fixed effect of noise, j = 1, 2, 3, 4 [0, 75, 85, 95 dBA]
k = fixed effect of attenuation, k = 1, 2, 3, 4 [0, 10, 20, 30 dB]
ij
= fixed effect of interaction of occlusion type and noise
ik
= fixed effect of interaction of occlusion type and attenuation
jk
= fixed effect of interaction of noise and attenuation
ijk
= fixed effect of interaction of occlusion type, noise, and attenuation
l = fixed effect of gender, i = 1, 2 [male, female]
m = fixed effect of phrase, m = 1, 2, 3, 4 [four phrases used in the analysis]
= regression parameter characterizing effect of age (x)
lns = random effect of subject with 20,ln ss N
ilna = random effect of occlusion type with 20,iln aa N
ijklmne = random error with 20,ijklmn ee N
The results of fitting the above model to the data are shown in Table 11. All of the fixed effects
of interest (occlusion, noise, and attenuation) had significant effects, as did their interactions.
Appendix D contains the marginal means, which are referred to as least squares means as
calculated in Statistical Analysis System (SAS Institute, Inc.) software, as well as model
diagnostics (using measured voice level as the outcome variable). In addition, “slice” tests are
included. These are tests that show – for one variable – for which levels of another variable
there is a significant difference.

96
Table 11. Tests of fixed effects with voice level as the outcome variable.
Effect
Numerator
Degrees of
Freedom
Denominator
Degrees of
Freedom F Value Pr > F
Occlusion type 2 35 4.23 0.0227
Noise 3 3343 1131.35 <.0001
Occlusion type × Noise 6 3343 78.71 <.0001
Attenuation 3 3343 292.58 <.0001
Attenuation × Occlusion type 6 3343 6.84 <.0001
Attenuation × Noise 9 3343 3.06 0.0012
Attenuation × Occlusion × Noise 18 3343 1.91 0.0114
4.2.3 Occlusion type
Table 12 contains the summary statistics by occlusion type, as defined by which hearing
protector was being worn. Of the three occlusion conditions evaluated, the foam earplug
occluded the ear closest to the tympanic membrane, while the earmuff occluded the ear external
to the head (surrounding the pinna). The putty earplug occluded the ear canal midway between,
at the entrance to the ear canal. The baseline results in the first row of Table 12 were from
measurements of the control condition, where no earplugs or earmuffs were worn, and no
background noise was present. In the following rows, the means of all voice level measurements
for each of the three occlusion types are shown. For each occlusion type there are 18 values –
each calculated from 64 data points (4 attenuation levels × 4 noise levels × 4 phrases). Based on
the linear mixed model results in Table 11 (F = 4.23, p = 0.0227), the evidence is to reject the
null hypothesis that the effects due to the three occlusion types are all equal.
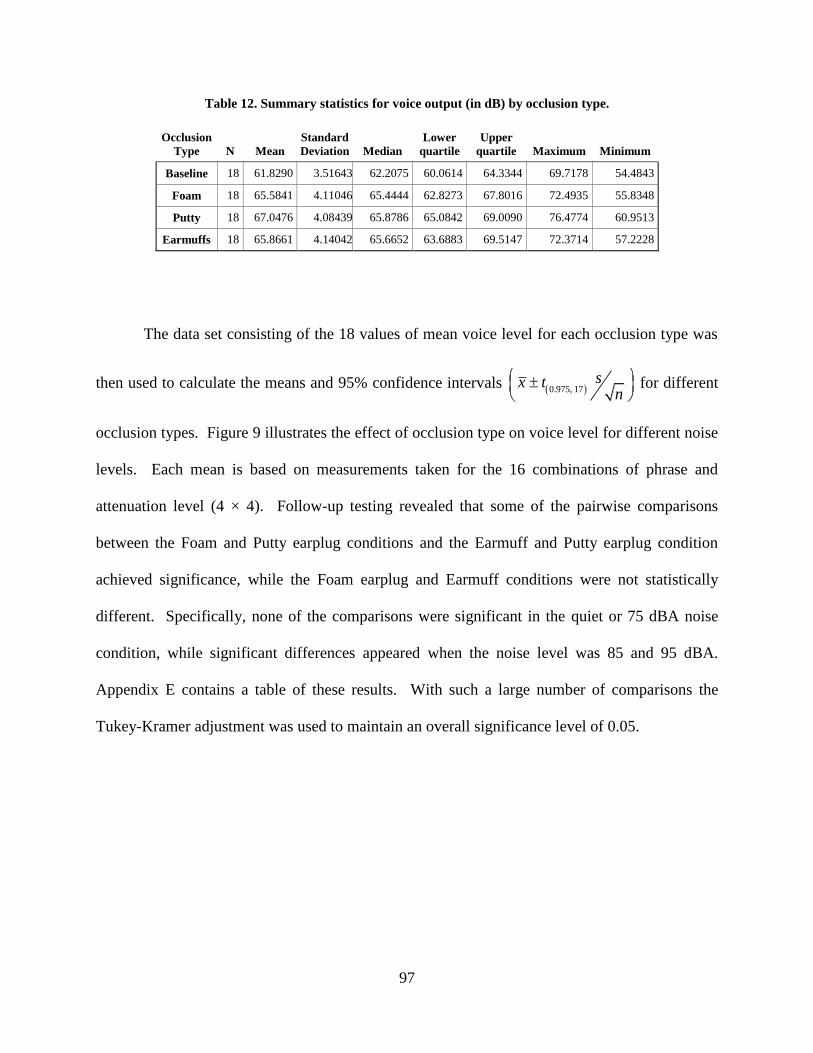
97
Table 12. Summary statistics for voice output (in dB) by occlusion type.
Occlusion
Type N Mean
Standard
Deviation Median
Lower
quartile
Upper
quartile Maximum Minimum
Baseline 18 61.8290 3.51643 62.2075 60.0614 64.3344 69.7178 54.4843
Foam 18 65.5841 4.11046 65.4444 62.8273 67.8016 72.4935 55.8348
Putty 18 67.0476 4.08439 65.8786 65.0842 69.0090 76.4774 60.9513
Earmuffs 18 65.8661 4.14042 65.6652 63.6883 69.5147 72.3714 57.2228
The data set consisting of the 18 values of mean voice level for each occlusion type was
then used to calculate the means and 95% confidence intervals 0.975, 17sx t
n
for different
occlusion types. Figure 9 illustrates the effect of occlusion type on voice level for different noise
levels. Each mean is based on measurements taken for the 16 combinations of phrase and
attenuation level (4 × 4). Follow-up testing revealed that some of the pairwise comparisons
between the Foam and Putty earplug conditions and the Earmuff and Putty earplug condition
achieved significance, while the Foam earplug and Earmuff conditions were not statistically
different. Specifically, none of the comparisons were significant in the quiet or 75 dBA noise
condition, while significant differences appeared when the noise level was 85 and 95 dBA.
Appendix E contains a table of these results. With such a large number of comparisons the
Tukey-Kramer adjustment was used to maintain an overall significance level of 0.05.

98
Figure 9. Arithmetic means and 95% confidence intervals of voice level for different occlusion types and
noise levels.
4.2.4 Attenuation level
The summary statistics for the four attenuation conditions are shown in Table 13. To look at the
effect of attenuation alone, the mean for each subject and attenuation level was calculated. Each
mean was based on 48 data points (except in the case of missing data), covering all combinations
of occlusion type, noise level, and phrase (3 × 4 × 4). The 18 means (one for each subject) for
each attenuation level were then used to calculate the summary statistics shown in Table 13. The
linear mixed model results in Table 11 (F = 292.58, p < 0.0001) provide evidence against the
hypothesis of equal effects with different attenuation levels.
62
64
66
68
70
Voi
ce L
evel
(dB
)
Foam Putty EarmuffOcclusion Type
Noise=0 Noise=75Noise=85Noise=95
72

99
Table 13. Summary statistics for voice output (in dB) by attenuation level.
Attenuation N Mean
Standard
Deviation Median
Lower
quartile
Upper
quartile Maximum Minimum
0 dB 18 64.7515 4.05355 64.6313 62.2874 67.9124 72.6002 56.5702
10 dB 18 66.1471 3.94139 65.5787 63.4898 68.6660 73.4947 58.2396
20 dB 18 66.7761 3.96621 65.4075 64.7176 69.8965 74.0758 58.3734
30 dB 18 66.9828 3.77871 65.7495 65.1103 69.9824 74.0120 58.8287
The mean values of voice level and corresponding 95% confidence intervals over the
range of attenuation conditions for the four different noise levels are shown in Figure 10. The
mean voice level for each subject for each combination of attenuation and noise level was based
on 12 data points (from all combinations of the three occlusion types and the four phrases) and
are presented in this graph.
Figure 10. Arithmetic means and 95% confidence intervals of voice level for different attenuation conditions
and noise levels.
62
64
66
68
70
2
Voi
ce L
evel
(dB
)
0 10 20 30Attenuation Level (dB)
Noise=0 Noise=75Noise=85Noise=95
72

100
Pairwise comparisons for the different attenuation amounts and noise levels are contained
in Appendix F. For all noise levels the increase in voice level is highly significant as the
attenuation increased from 0 to 10 dB. The voice level also increased significantly as attenuation
increased from 10 to 20 dB for all noise levels except the quiet (0 dBA) condition. Conversely,
the voice level did not increase significantly as the amount of attenuation increased from 20 to 30
dB for any of the noise levels.
4.2.5 Interaction effects
Table 14 contains the marginal means for the different combinations of occlusion types and
attenuation levels.
Table 14. Marginal means for occlusion type and attenuation level.
Attenuation Occlusion Estimate
Standard
Error DF t Value Pr > |t|
30 dB Earmuffs 66.9862 0.8521 3343 78.61 <.0001
30 dB Putty 67.7201 0.8521 3343 79.48 <.0001
30 dB Foam 66.2468 0.8521 3343 77.75 <.0001
20 dB Earmuffs 66.6185 0.8521 3343 78.19 <.0001
20 dB Putty 67.4895 0.8521 3343 79.21 <.0001
20 dB Foam 66.2210 0.8521 3343 77.72 <.0001
10 dB Earmuffs 65.7456 0.8523 3343 77.14 <.0001
10 dB Putty 67.1868 0.8521 3343 78.85 <.0001
10 dB Foam 65.4936 0.8521 3343 76.86 <.0001
0 dB Earmuffs 64.0962 0.8521 3343 75.23 <.0001
0 dB Putty 65.8051 0.8521 3343 77.23 <.0001
0 dB Foam 64.3761 0.8521 3343 75.55 <.0001
The results may be graphed as a function of occlusion type for different attenuation levels
(Figure 11) or as a function of attenuation level for different occlusion type (Figure 12). All
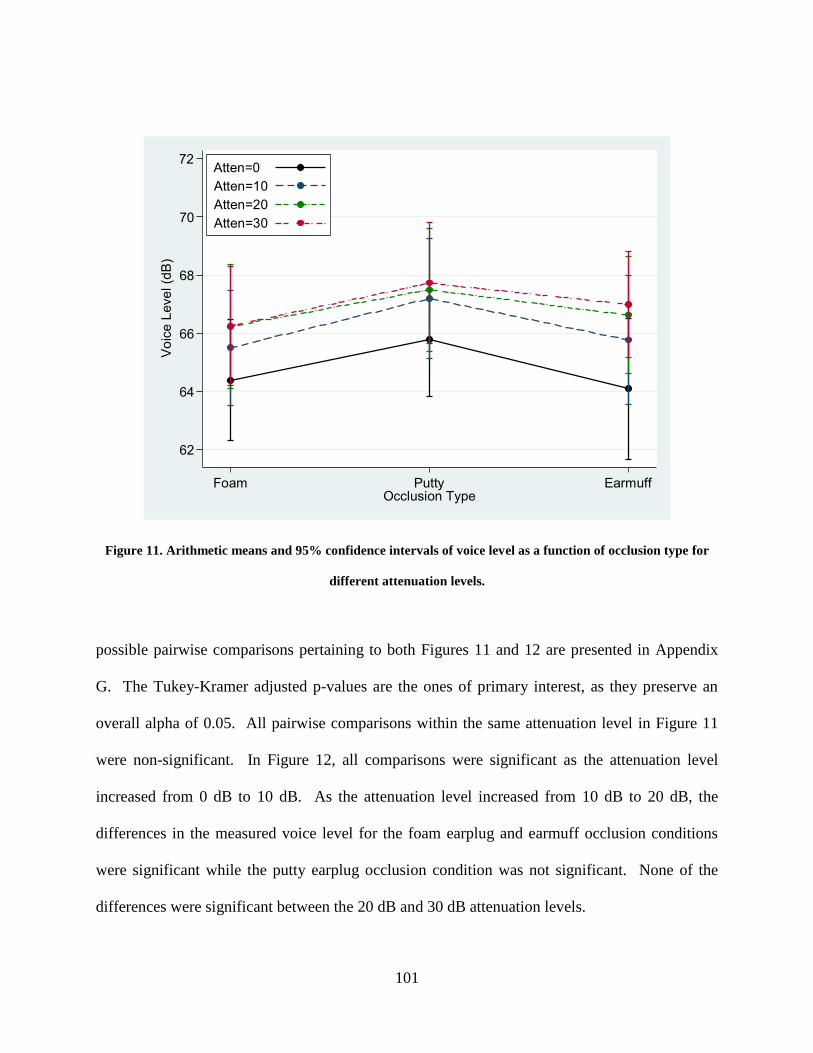
101
Figure 11. Arithmetic means and 95% confidence intervals of voice level as a function of occlusion type for
different attenuation levels.
possible pairwise comparisons pertaining to both Figures 11 and 12 are presented in Appendix
G. The Tukey-Kramer adjusted p-values are the ones of primary interest, as they preserve an
overall alpha of 0.05. All pairwise comparisons within the same attenuation level in Figure 11
were non-significant. In Figure 12, all comparisons were significant as the attenuation level
increased from 0 dB to 10 dB. As the attenuation level increased from 10 dB to 20 dB, the
differences in the measured voice level for the foam earplug and earmuff occlusion conditions
were significant while the putty earplug occlusion condition was not significant. None of the
differences were significant between the 20 dB and 30 dB attenuation levels.
62
64
66
68
70
Voi
ce L
evel
(dB
)
Foam Putty EarmuffOcclusion Type
Atten=0 Atten=10Atten=20Atten=30
72

102
Figure 12. Arithmetic means and 95% confidence intervals of voice level as a function of attenuation level for
different occlusion types.
Interaction effects were further explored by simultaneously graphing all three variables of
interest: occlusion type, amount of attenuation, and noise level. Voice output levels as a function
of occlusion site, as broken down by noise level are shown in Figure 13. This graph expands
upon the information presented in Figure 9. The foam earplug created the deep canal occlusion
condition, the putty earplug occluded the ear canal at the entrance, and the earmuff effectively
occluded the ear externally around the pinna. The trend reversal between the quiet condition
(bottom curve in each pane) and all three background noise conditions (upper three curves in
each pane) illustrates how the occlusion site differentially affects the voice level, depending on
whether or not background noise is present.
62
64
66
68
70V
oice
Lev
el (d
B)
0 10 20 30Attenuation Level (dB)
Foam Putty Earmuff
72

103
Figure 13. Arithmetic means of voice output level as a function of occlusion site for different attenuation and
noise levels (error bars = standard error of the mean).
Voice output levels as a function of attenuation level, broken down by each background
noise condition, are shown in Figure 14. This graph expands upon the information presented in
Figure 10 by illustrating how attenuation provided by the hearing protector has a different effect
depending on the occlusion condition. While voice output increases with increasing attenuation
for all hearing protector types, the increase is substantially greater with the largest occlusion
effect produced by putty earplug, which sealed the ear canal at the entrance.

104
Figure 14. Arithmetic means of voice output level as a function of attenuation level for different occlusion
types and noise levels (error bars = standard error of the mean).

105
5.0 DISCUSSION
5.1 EFFECT OF OCCLUSION TYPE, ATTENUATION, AND NOISE
This investigation had two specific aims. The first was to determine the effect on voice output
level when the attenuation provided by a hearing protective device worn by an individual was
carefully controlled. If changes in vocal output are observed when hearing protection is worn,
the second goal was to determine which mechanism – ear canal occlusion or hearing protector
attenuation – has a greater effect on an individual’s speech output. The data suggest that the
answers to these questions are dependent on the level of background noise, with the pattern of
results being different for the quiet condition as compared to all three noise conditions. There is
evidence to suggest that changes in a person’s voice output levels when hearing protectors are
worn and background noise is present are due to how the ear canal is occluded. Additionally,
changes in a person’s voice levels when hearing protectors are worn and background noise is
present are affected by the attenuation provided by a hearing protector. Therefore, both of the
null hypotheses stated in Section 3.1.1 were rejected.
Figures 9 and 13 show that the occlusion effect acted as would be expected in the quiet
condition (Kryter, 1946; Zwislocki, 1953; Berger & Kerivan, 1983). Without being exposed to
any background noise, voice levels were lower when the subjects wore the putty earplugs (i.e.,
when the occlusion effect was greatest) as compared to the other two types of hearing protectors.

106
This would be predicted by the increase in self-perceived voice level induced by occluding the
ear canal right at the entrance. Measured voice levels were lowest when the hearing protector
attenuation was experimentally removed (i.e., the 0 dB attenuation condition), although the
speech levels only increased 1-2 dB for any of the three levels of attenuation.
Interestingly, the occlusion effect caused the exact opposite effect when any amount of
background noise was added. In the three levels of noise (75, 85, and 95 dBA) that were tested,
occluding the ear canal at the entrance with the putty plug (largest occlusion effect) caused the
talker to raise his/her voice level substantially more than it was raised when the occlusion
occurred deeper inside the ear canal (in the case of the foam earplug) or farther out (when the
earmuff was worn) which are both conditions of least occlusion effect. This effect was observed
regardless of the amount of attenuation the hearing protector was providing. Similar to what was
found in the quiet condition, all three noise conditions caused the measured voice level to
increase slightly from the 0 dB to 10 dB attenuation conditions; however increasing the amount
of attenuation from 10 dB to 30 dB did not significantly increase vocal output.
Mentioned earlier as one of the reasons for conducting this study, an adequate description
for the combination of the occlusion effect and the Lombard effect for talkers wearing hearing
protection has not been published in the literature. For example, Kryter (1946) and Casali et al.
(1987) reported that talkers raised the level of their voices by approximately 4 dB when they
wore hearing protection in quiet, while Navarro (1996) and Tufts and Frank (2003) reported
slight decreases in voice level in the same condition. All previous attempts to explain this
discrepancy presumed that differences in the magnitude of either the occlusion effect and/or the
hearing protector attenuation were the underlying cause(s). A comprehensive understanding was
not previously possible because the underlying quantities were unknown (i.e., not measured or

107
not reported in earlier research). In the case of little or no difference between occluded and
unoccluded speech levels in quiet, Tufts and Frank (2003) speculated that shallow insertion of
the earplugs provided an acoustic seal, although such incomplete insertion caused the attenuation
of the air-conduction component and enhancement of the bone-conduction component of the
subjects’ speech to offset each other. The results of the present study provides evidence to show
how this is a plausible explanation. For any given level of hearing protector attenuation, a
talker’s voice output level will change depending on the ear canal occlusion site, which can be
manipulated by altering the earplug insertion depth.
Based on the findings in this study, the question of which mechanism has a greater
influence on vocal output – the occlusion effect or the hearing protector attenuation – can only be
accurately answered by knowing the ambient noise level. Increasing the noise level always
caused an increase in voice level. Furthermore, increasing the noise level also causes the
primary influencing factor to switch from the hearing protector’s attenuation to the occlusion
effect. This is illustrated in Table 15, which shows the differences in voice level as produced by
the different occlusion and attenuation conditions for each of the four noise levels, which were
computed from the values plotted in Figures 13 and 14.
Table 15. Average differences in voice output level between the minimum occlusion effect conditions (foam
earplug and earmuff) and the maximum occlusion effect condition (putty earplug).
Occlusion effect only
(0 dB attenuation) 10 dB atten. 20 dB atten. 30 dB atten.
Quiet -0.72 dB 1.23 dB 1.65 dB 1.91 dB
75 dBA noise 1.42 dB 1.11 dB 1.99 dB 2.03 dB
85 dBA noise 2.02 dB 1.41 dB 2.45 dB 2.71 dB
95 dBA noise 3.56 dB 1.68 dB 2.65 dB 2.88 dB
108
The quiet condition is contained in the first row of Table 15, where it can be seen that the
change produced by any amount of attenuation was greater than the change produced solely by
the occlusion effect. In the 75 dBA and 85 dBA noise conditions, the occlusion effect made a
larger difference than 10 dB of attenuation did, while 20 dB and 30 dB of attenuation produced
greater changes than brought about by the occlusion effect. In the 95 dBA noise condition, the
occlusion effect alone was the dominant factor. Thus, the characteristic of a hearing protector
that is more likely to cause the wearer to raise his/her voice level may be predicted for any set of
occlusion and attenuation conditions; however, it will change depending on the noise level in
which the protector will be used.
5.2 PRACTICAL IMPLICATIONS
When examining the results of this study and comparing the findings to previous research, it is
important to point out that many of the comparisons between speech levels when wearing/not
wearing hearing protectors reported in other studies were performed in unrealistic situations.
Most notably, many of the earliest studies subjected their participants to unprotected sound levels
that are known to be hazardous. Obviously, much larger differences would have been found in
the present study if one of the conditions was for the subjects to NOT wear hearing protectors.
Predictably, the Lombard effect would have been more pronounced, but nobody should be
exposed to high noise levels without wearing hearing protection, so it would not have any
practical applicability.
Howell and Martin (1975) found that listeners’ average intelligibility scores decreased by
as much as 25% when talkers wore hearing protection. Hormann, Lazarus-Mainka, Schubeius,

109
and Lazarus (1984) reported that speech intelligibility results indicated significantly less was
understood when both talkers and listeners were wearing earplugs. Unfortunately, as Casali,
Horylev, and Grenell (1987) concluded, individuals would have to make a conscious and
unnatural effort to speak loud enough to be understood in high background noise levels. A
possible solution to this dilemma that has not been previously suggested is to select a particular
type/style of hearing protector with appropriate attenuation characteristics that would
subconsciously enhance a talker’s voice level. Raising one’s voice level will increase the signal-
to-noise ratio for the listener, thereby increasing the chances of correctly hearing and
understanding the spoken message.
The findings in the present study suggest that choosing hearing protectors to maximize
the occlusion effect will aid verbal communication in a noisy environment. This is because a
large occlusion effect was shown to significantly increase a person’s voice level in background
noise. An important caveat is that the distinct change in self-perceived voice quality induced by
the occlusion effect is often found to be objectionable by hearing protection users, and must be
acknowledged and appropriately managed. A simple way to alleviate this issue would be to
have the individual don the hearing protector in the presence of background noise, because
talking in a quiet environment while wearing hearing protection accentuates the resulting low
frequency or resonant quality of one’s own voice. Otherwise, the wearer may want to choose a
different type/style of hearing protector with a smaller occlusion effect, which should be
discouraged when optimal speech communication is desired.
Attenuation provided by the hearing protector also increases the talker’s voice level, with
the first 10 dB of attenuation having the most effect. Increasing the attenuation beyond 20 dB
did not cause any additional increase in voice output level. Therefore, a hearing protector that
110
provides the minimum amount of attenuation necessary for the particular noise environment
should always be selected. Fortunately, 10 dB of attenuation generally is sufficient to reduce
exposures to a safe level of 85 dBA because the vast majority of industrial noise environments
do not exceed 95 dBA (Franks, 1988). Another advantage for wanting the lowest possible
attenuation is that it avoids the problems created by overprotection, such as feelings of isolation
when too much of the environmental sounds are removed (European Committee for
Standardization, 2004).
Although the largest occlusion effect in this study was attained by using a putty-type
earplug, as mentioned previously, a partially inserted foam earplug could also induce a large
occlusion effect. Therefore, as long as a person receives enough attenuation from a foam
earplug, a less-than-full insertion depth may actually be desirable. This is obviously
counterintuitive to common thinking about insert-type earplugs, yet may be recommended based
on what is now known about the interaction of the occlusion effect, earplug attenuation, and
ambient noise level. One remaining unknown is whether the annoyance caused by the occlusion
effect in quiet also holds true when the talker is in a noisy environment. If subsequent research
determines that the change in one’s self-perceived voice does not bother an individual when
he/she is wearing earplugs and is talking in a high noise area, then it would be beneficial to
increase the occlusion effect for all hearing protector types.
5.3 LIMITATIONS OF THE STUDY
The primary strength of this study is that it was the first experiment to simultaneously examine
the effects of hearing protector attenuation and occlusion effect on voice output level, in several
111
background noise conditions. The data are subject to at least two limitations, however. First,
due to the increased time commitment that would be required for each subject, only one type of
test material (3-5 syllable phrases) was used in this study. The effect of other types of test
materials and/or spontaneous (i.e., unscripted) conversation was not evaluated. Similarly, the
effects of talker motivation/intent or visual/verbal feedback from a conversation partner were not
addressed in this study. These are all elements of normal conversation that could influence a
talker’s voice level.
Second, none of the more advanced types of hearing protectors, such as flat or uniformly
attenuating devices with a moderate amount of attenuation, were evaluated. A flat attenuation
protector distorts the incoming sound less than a conventional device because approximately
equal attenuation is provided across all frequencies. This is in contrast to the conventional
protectors that were used, which provided more high frequency attenuation and, consequently,
the balance between the low and high frequencies was altered. Flat attenuation earplugs are
typically sold as hearing protection for musicians, as they are intended to maintain the music’s
spectral balance while providing a moderate amount of sound attenuation. Industrial workers
also can benefit from these types of hearing protectors, since machine/equipment sounds can
essentially be heard undistorted; however, their effects on vocal output in a noisy situation have
not been studied.
Additionally, the data produced in this study were not sufficient to explain why occluding
the canal right at the entrance produced different responses between the quiet and noise
conditions. The exact underlying mechanism is unknown which caused a complete opposite
effect whereby the earplug producing the largest occlusion effect (putty type) caused the

112
subjects’ to lower their voice levels in quiet and raise them in all background noise levels, as
compared to the other two occlusion conditions.
5.4 CONCLUSIONS
This study answers the theoretical question of which aspect/characteristic of a hearing protector
has the most influence on a talker’s voice level. It also provides some practical information for
hearing protector users regarding wearing techniques that potentially could provide some benefit
in terms of better speech communication in noise.
Previous research studies often reported different effects, e.g., sometimes the talker’s
voice level changed slightly and other times the changes were quite large. No general rules have
been developed to account for these differences. Because none of the previous studies tested the
full range of hearing protector attenuation levels or carefully controlled the occlusion effect
while examining the effects of different levels of noise, is it not surprising that the findings of
some studies conflicted with others. All three dependent variables – occlusion type, amount of
attenuation, and noise level – have an effect on the talker’s voice output level, and all three must
be known to fully understand and/or predict the resultant effect.
This issue is part of a larger dilemma. Workers will not consistently wear hearing
protectors that are perceived to be uncomfortable or interfere with their ability to hear important
sounds (Stephenson, Shaw, Stephenson, & Graydon, 2011). Although studies have demonstrated
that training can effectively teach workers to properly fit and use earplugs (Joseph, Punch,
Stephenson, Wolfe, Paneth, & Murphy, 2007; Murphy, Stephenson, Byrne, Witt, & Duran,
2011), there is a paucity of data regarding descriptors other than the Noise Reduction Rating

113
(NRR) that can be used to rate hearing protector performance. The NRR is a single-number
metric representing a hearing protector’s attenuation, but it does not provide any other
performance characteristics of the device. The hearing health of workers may be substantially
improved by providing practical information that can be used to select a protector that is
comfortable and that will minimally impact their ability to hear important sounds. Differences in
voice output were found among various hearing protector attenuation/occlusion conditions and
background noise levels, suggesting that further investigation should be pursued. The results of
this study may be used to begin an effort to quantify metrics for other aspects of a hearing
protector’s practical usability/wearability. By developing these performance metrics, workers
will have information to make informed decisions about which hearing protector they should use
for their particular work environment.
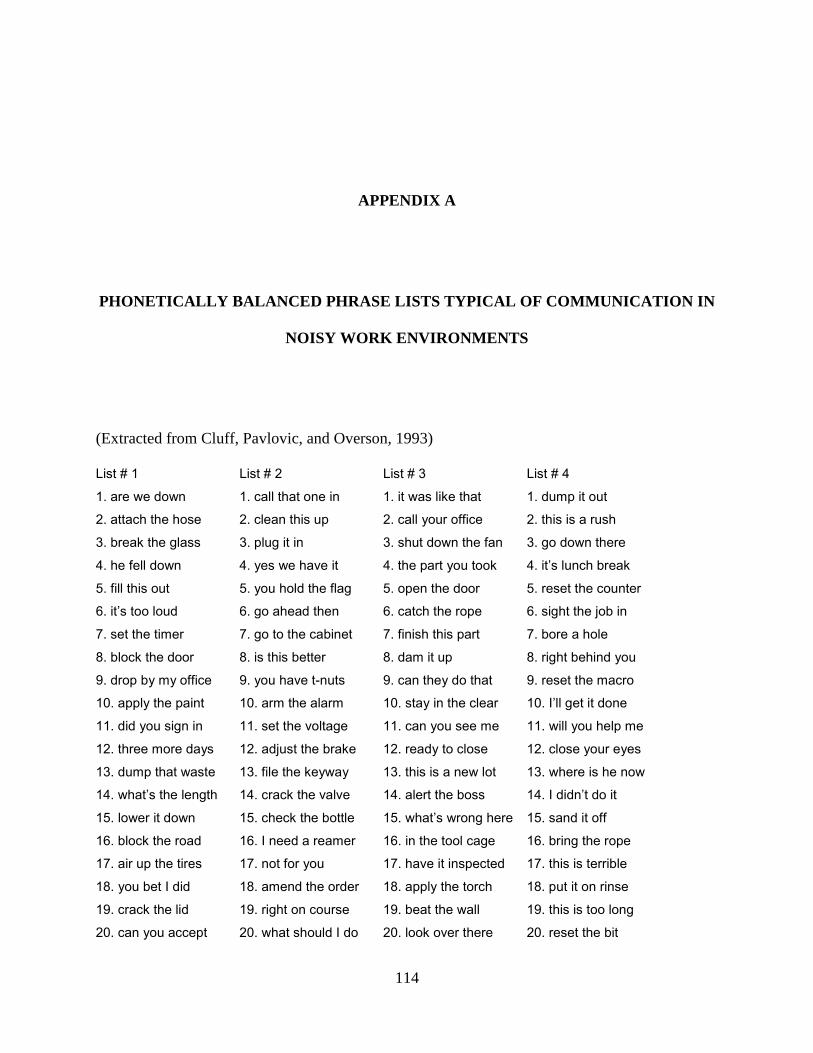
114
APPENDIX A
PHONETICALLY BALANCED PHRASE LISTS TYPICAL OF COMMUNICATION IN
NOISY WORK ENVIRONMENTS
(Extracted from Cluff, Pavlovic, and Overson, 1993)
List # 1 List # 2 List # 3 List # 4
1. are we down 1. call that one in 1. it was like that 1. dump it out
2. attach the hose 2. clean this up 2. call your office 2. this is a rush
3. break the glass 3. plug it in 3. shut down the fan 3. go down there
4. he fell down 4. yes we have it 4. the part you took 4. it’s lunch break
5. fill this out 5. you hold the flag 5. open the door 5. reset the counter
6. it’s too loud 6. go ahead then 6. catch the rope 6. sight the job in
7. set the timer 7. go to the cabinet 7. finish this part 7. bore a hole
8. block the door 8. is this better 8. dam it up 8. right behind you
9. drop by my office 9. you have t-nuts 9. can they do that 9. reset the macro
10. apply the paint 10. arm the alarm 10. stay in the clear 10. I’ll get it done
11. did you sign in 11. set the voltage 11. can you see me 11. will you help me
12. three more days 12. adjust the brake 12. ready to close 12. close your eyes
13. dump that waste 13. file the keyway 13. this is a new lot 13. where is he now
14. what’s the length 14. crack the valve 14. alert the boss 14. I didn’t do it
15. lower it down 15. check the bottle 15. what’s wrong here 15. sand it off
16. block the road 16. I need a reamer 16. in the tool cage 16. bring the rope
17. air up the tires 17. not for you 17. have it inspected 17. this is terrible
18. you bet I did 18. amend the order 18. apply the torch 18. put it on rinse
19. crack the lid 19. right on course 19. beat the wall 19. this is too long
20. can you accept 20. what should I do 20. look over there 20. reset the bit
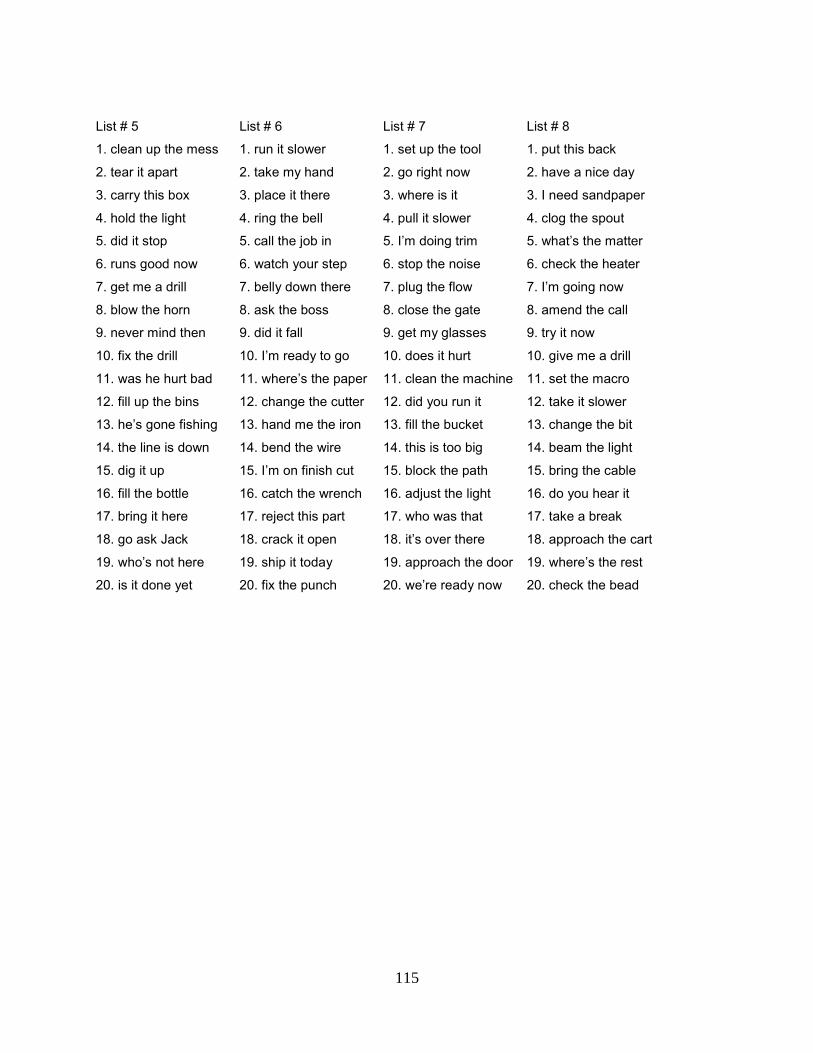
115
List # 5 List # 6 List # 7 List # 8
1. clean up the mess 1. run it slower 1. set up the tool 1. put this back
2. tear it apart 2. take my hand 2. go right now 2. have a nice day
3. carry this box 3. place it there 3. where is it 3. I need sandpaper
4. hold the light 4. ring the bell 4. pull it slower 4. clog the spout
5. did it stop 5. call the job in 5. I’m doing trim 5. what’s the matter
6. runs good now 6. watch your step 6. stop the noise 6. check the heater
7. get me a drill 7. belly down there 7. plug the flow 7. I’m going now
8. blow the horn 8. ask the boss 8. close the gate 8. amend the call
9. never mind then 9. did it fall 9. get my glasses 9. try it now
10. fix the drill 10. I’m ready to go 10. does it hurt 10. give me a drill
11. was he hurt bad 11. where’s the paper 11. clean the machine 11. set the macro
12. fill up the bins 12. change the cutter 12. did you run it 12. take it slower
13. he’s gone fishing 13. hand me the iron 13. fill the bucket 13. change the bit
14. the line is down 14. bend the wire 14. this is too big 14. beam the light
15. dig it up 15. I’m on finish cut 15. block the path 15. bring the cable
16. fill the bottle 16. catch the wrench 16. adjust the light 16. do you hear it
17. bring it here 17. reject this part 17. who was that 17. take a break
18. go ask Jack 18. crack it open 18. it’s over there 18. approach the cart
19. who’s not here 19. ship it today 19. approach the door 19. where’s the rest
20. is it done yet 20. fix the punch 20. we’re ready now 20. check the bead
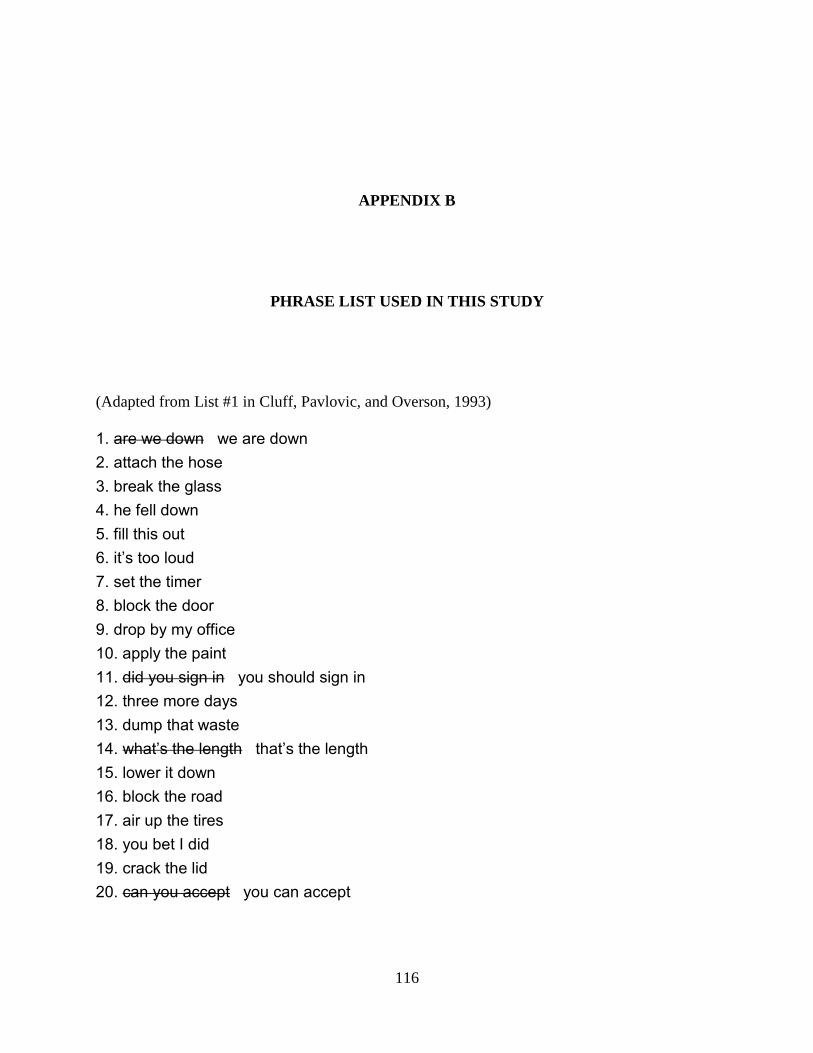
116
APPENDIX B
PHRASE LIST USED IN THIS STUDY
(Adapted from List #1 in Cluff, Pavlovic, and Overson, 1993)
1. are we down we are down 2. attach the hose 3. break the glass 4. he fell down 5. fill this out 6. it’s too loud 7. set the timer 8. block the door 9. drop by my office 10. apply the paint 11. did you sign in you should sign in 12. three more days 13. dump that waste 14. what’s the length that’s the length 15. lower it down 16. block the road 17. air up the tires 18. you bet I did 19. crack the lid 20. can you accept you can accept
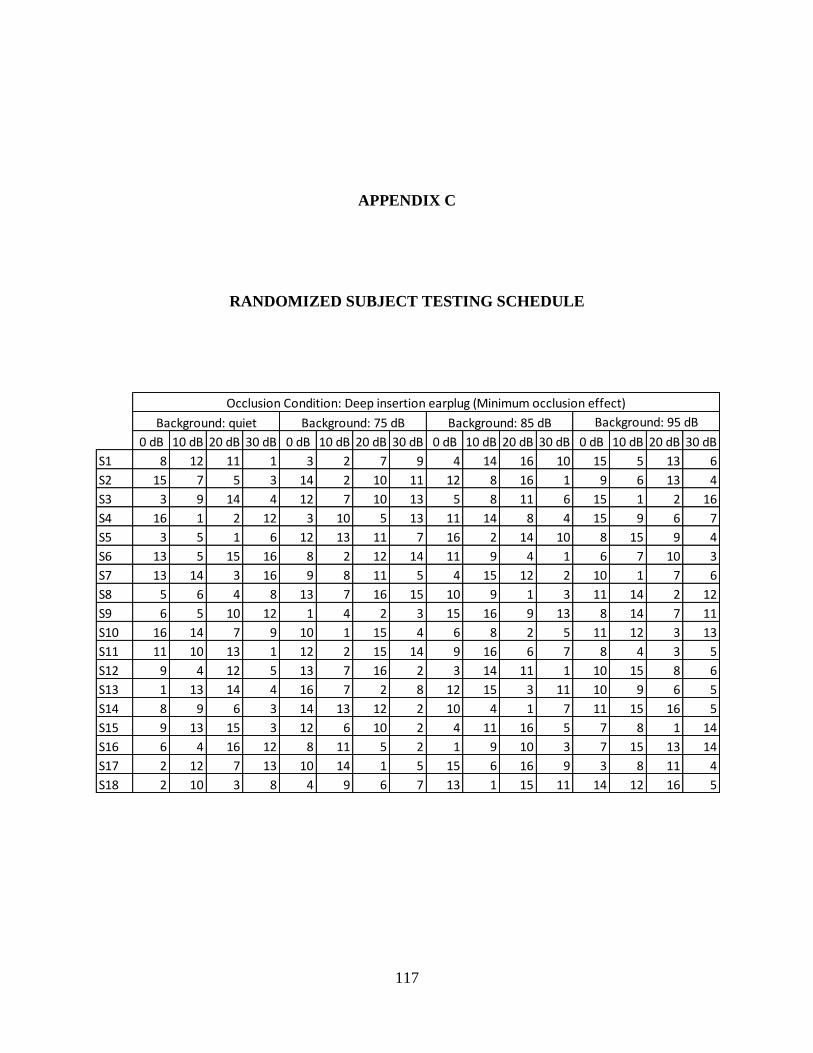
117
APPENDIX C
RANDOMIZED SUBJECT TESTING SCHEDULE
Background: quiet Background: 75 dB Background: 85 dB
0 dB 10 dB 20 dB 30 dB 0 dB 10 dB 20 dB 30 dB 0 dB 10 dB 20 dB 30 dB 0 dB 10 dB 20 dB 30 dB
S1 8 12 11 1 3 2 7 9 4 14 16 10 15 5 13 6
S2 15 7 5 3 14 2 10 11 12 8 16 1 9 6 13 4
S3 3 9 14 4 12 7 10 13 5 8 11 6 15 1 2 16
S4 16 1 2 12 3 10 5 13 11 14 8 4 15 9 6 7
S5 3 5 1 6 12 13 11 7 16 2 14 10 8 15 9 4
S6 13 5 15 16 8 2 12 14 11 9 4 1 6 7 10 3
S7 13 14 3 16 9 8 11 5 4 15 12 2 10 1 7 6
S8 5 6 4 8 13 7 16 15 10 9 1 3 11 14 2 12
S9 6 5 10 12 1 4 2 3 15 16 9 13 8 14 7 11
S10 16 14 7 9 10 1 15 4 6 8 2 5 11 12 3 13
S11 11 10 13 1 12 2 15 14 9 16 6 7 8 4 3 5
S12 9 4 12 5 13 7 16 2 3 14 11 1 10 15 8 6
S13 1 13 14 4 16 7 2 8 12 15 3 11 10 9 6 5
S14 8 9 6 3 14 13 12 2 10 4 1 7 11 15 16 5
S15 9 13 15 3 12 6 10 2 4 11 16 5 7 8 1 14
S16 6 4 16 12 8 11 5 2 1 9 10 3 7 15 13 14
S17 2 12 7 13 10 14 1 5 15 6 16 9 3 8 11 4
S18 2 10 3 8 4 9 6 7 13 1 15 11 14 12 16 5
Occlusion Condition: Deep insertion earplug (Minimum occlusion effect)
Background: 95 dB
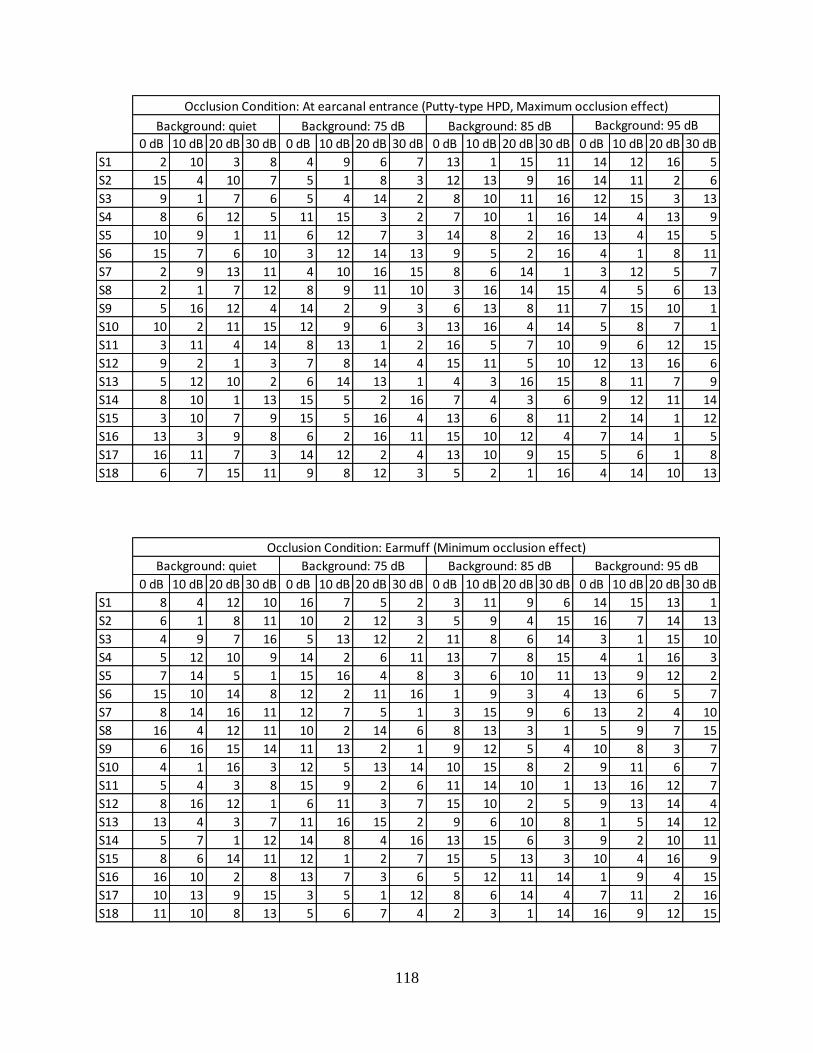
118
Background: quiet Background: 75 dB Background: 85 dB
0 dB 10 dB 20 dB 30 dB 0 dB 10 dB 20 dB 30 dB 0 dB 10 dB 20 dB 30 dB 0 dB 10 dB 20 dB 30 dB
S1 2 10 3 8 4 9 6 7 13 1 15 11 14 12 16 5
S2 15 4 10 7 5 1 8 3 12 13 9 16 14 11 2 6
S3 9 1 7 6 5 4 14 2 8 10 11 16 12 15 3 13
S4 8 6 12 5 11 15 3 2 7 10 1 16 14 4 13 9
S5 10 9 1 11 6 12 7 3 14 8 2 16 13 4 15 5
S6 15 7 6 10 3 12 14 13 9 5 2 16 4 1 8 11
S7 2 9 13 11 4 10 16 15 8 6 14 1 3 12 5 7
S8 2 1 7 12 8 9 11 10 3 16 14 15 4 5 6 13
S9 5 16 12 4 14 2 9 3 6 13 8 11 7 15 10 1
S10 10 2 11 15 12 9 6 3 13 16 4 14 5 8 7 1
S11 3 11 4 14 8 13 1 2 16 5 7 10 9 6 12 15
S12 9 2 1 3 7 8 14 4 15 11 5 10 12 13 16 6
S13 5 12 10 2 6 14 13 1 4 3 16 15 8 11 7 9
S14 8 10 1 13 15 5 2 16 7 4 3 6 9 12 11 14
S15 3 10 7 9 15 5 16 4 13 6 8 11 2 14 1 12
S16 13 3 9 8 6 2 16 11 15 10 12 4 7 14 1 5
S17 16 11 7 3 14 12 2 4 13 10 9 15 5 6 1 8
S18 6 7 15 11 9 8 12 3 5 2 1 16 4 14 10 13
Occlusion Condition: At earcanal entrance (Putty-type HPD, Maximum occlusion effect)
Background: 95 dB
Background: quiet Background: 75 dB Background: 85 dB
0 dB 10 dB 20 dB 30 dB 0 dB 10 dB 20 dB 30 dB 0 dB 10 dB 20 dB 30 dB 0 dB 10 dB 20 dB 30 dB
S1 8 4 12 10 16 7 5 2 3 11 9 6 14 15 13 1
S2 6 1 8 11 10 2 12 3 5 9 4 15 16 7 14 13
S3 4 9 7 16 5 13 12 2 11 8 6 14 3 1 15 10
S4 5 12 10 9 14 2 6 11 13 7 8 15 4 1 16 3
S5 7 14 5 1 15 16 4 8 3 6 10 11 13 9 12 2
S6 15 10 14 8 12 2 11 16 1 9 3 4 13 6 5 7
S7 8 14 16 11 12 7 5 1 3 15 9 6 13 2 4 10
S8 16 4 12 11 10 2 14 6 8 13 3 1 5 9 7 15
S9 6 16 15 14 11 13 2 1 9 12 5 4 10 8 3 7
S10 4 1 16 3 12 5 13 14 10 15 8 2 9 11 6 7
S11 5 4 3 8 15 9 2 6 11 14 10 1 13 16 12 7
S12 8 16 12 1 6 11 3 7 15 10 2 5 9 13 14 4
S13 13 4 3 7 11 16 15 2 9 6 10 8 1 5 14 12
S14 5 7 1 12 14 8 4 16 13 15 6 3 9 2 10 11
S15 8 6 14 11 12 1 2 7 15 5 13 3 10 4 16 9
S16 16 10 2 8 13 7 3 6 5 12 11 14 1 9 4 15
S17 10 13 9 15 3 5 1 12 8 6 14 4 7 11 2 16
S18 11 10 8 13 5 6 7 4 2 3 1 14 16 9 12 15
Background: 95 dB
Occlusion Condition: Earmuff (Minimum occlusion effect)
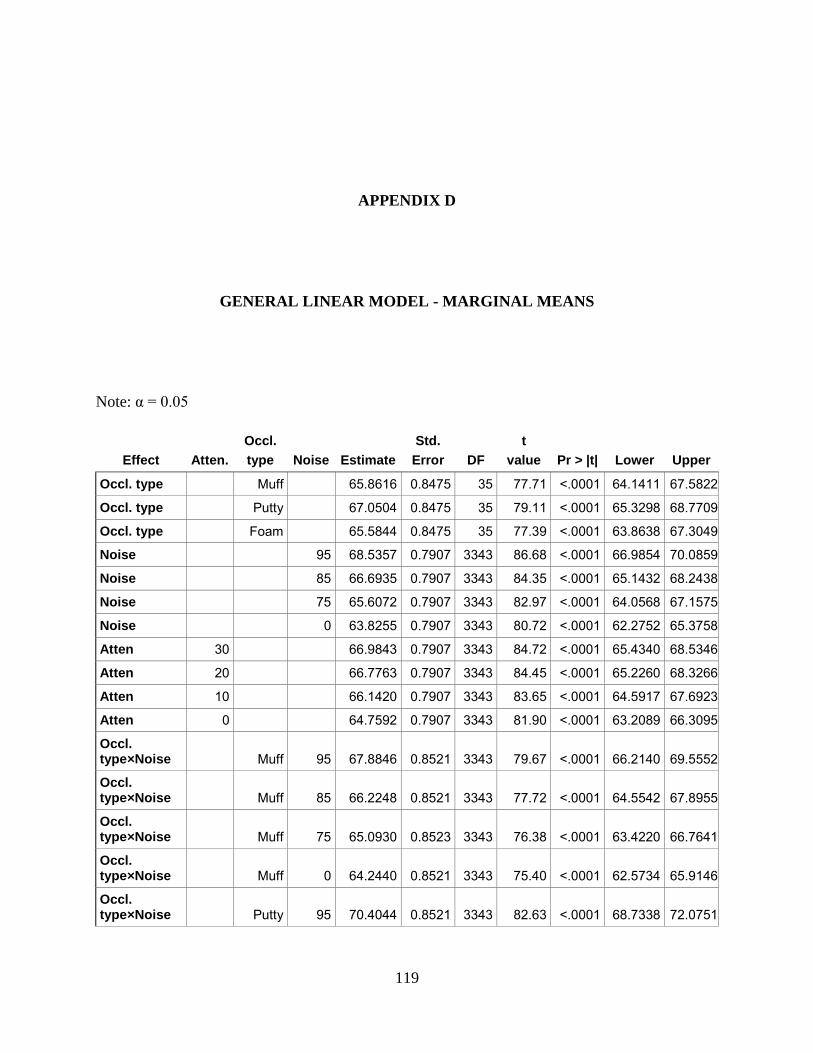
119
APPENDIX D
GENERAL LINEAR MODEL - MARGINAL MEANS
Note: α = 0.05
Effect Atten.
Occl.
type Noise Estimate
Std.
Error DF
t
value Pr > |t| Lower Upper
Occl. type Muff 65.8616 0.8475 35 77.71 <.0001 64.1411 67.5822
Occl. type Putty 67.0504 0.8475 35 79.11 <.0001 65.3298 68.7709
Occl. type Foam 65.5844 0.8475 35 77.39 <.0001 63.8638 67.3049
Noise 95 68.5357 0.7907 3343 86.68 <.0001 66.9854 70.0859
Noise 85 66.6935 0.7907 3343 84.35 <.0001 65.1432 68.2438
Noise 75 65.6072 0.7907 3343 82.97 <.0001 64.0568 67.1575
Noise 0 63.8255 0.7907 3343 80.72 <.0001 62.2752 65.3758
Atten 30 66.9843 0.7907 3343 84.72 <.0001 65.4340 68.5346
Atten 20 66.7763 0.7907 3343 84.45 <.0001 65.2260 68.3266
Atten 10 66.1420 0.7907 3343 83.65 <.0001 64.5917 67.6923
Atten 0 64.7592 0.7907 3343 81.90 <.0001 63.2089 66.3095
Occl. type×Noise Muff 95 67.8846 0.8521 3343 79.67 <.0001 66.2140 69.5552
Occl. type×Noise Muff 85 66.2248 0.8521 3343 77.72 <.0001 64.5542 67.8955
Occl. type×Noise Muff 75 65.0930 0.8523 3343 76.38 <.0001 63.4220 66.7641
Occl. type×Noise Muff 0 64.2440 0.8521 3343 75.40 <.0001 62.5734 65.9146
Occl. type×Noise Putty 95 70.4044 0.8521 3343 82.63 <.0001 68.7338 72.0751

120
Effect Atten.
Occl.
type Noise Estimate
Std.
Error DF
t
value Pr > |t| Lower Upper
Occl. type×Noise Putty 85 67.9803 0.8521 3343 79.78 <.0001 66.3097 69.6509
Occl. type×Noise Putty 75 66.5359 0.8521 3343 78.09 <.0001 64.8653 68.2065
Occl. type×Noise Putty 0 63.2809 0.8521 3343 74.27 <.0001 61.6103 64.9515
Occl. type×Noise Foam 95 67.3180 0.8521 3343 79.01 <.0001 65.6473 68.9886
Occl. type×Noise Foam 85 65.8754 0.8521 3343 77.31 <.0001 64.2048 67.5460
Occl. type×Noise Foam 75 65.1926 0.8521 3343 76.51 <.0001 63.5220 66.8632
Occl. type×Noise Foam 0 63.9516 0.8521 3343 75.06 <.0001 62.2810 65.6222
Atten×Occl. type 30 Muff 66.9862 0.8521 3343 78.61 <.0001 65.3155 68.6568
Atten×Occl. type 30 Putty 67.7201 0.8521 3343 79.48 <.0001 66.0494 69.3907
Atten×Occl. type 30 Foam 66.2468 0.8521 3343 77.75 <.0001 64.5762 67.9174
Atten×Occl. type 20 Muff 66.6185 0.8521 3343 78.19 <.0001 64.9478 68.2891
Atten×Occl. type 20 Putty 67.4895 0.8521 3343 79.21 <.0001 65.8189 69.1601
Atten×Occl. type 20 Foam 66.2210 0.8521 3343 77.72 <.0001 64.5504 67.8916
Atten×Occl. type 10 Muff 65.7456 0.8523 3343 77.14 <.0001 64.0746 67.4166
Atten×Occl. type 10 Putty 67.1868 0.8521 3343 78.85 <.0001 65.5162 68.8574
Atten×Occl. type 10 Foam 65.4936 0.8521 3343 76.86 <.0001 63.8230 67.1642
Atten×Occl. type 0 Muff 64.0962 0.8521 3343 75.23 <.0001 62.4256 65.7668
Atten×Occl. type 0 Putty 65.8051 0.8521 3343 77.23 <.0001 64.1345 67.4758
Atten×Occl. type 0 Foam 64.3761 0.8521 3343 75.55 <.0001 62.7055 66.0467
Atten×Noise 30 95 69.3339 0.7972 3343 86.97 <.0001 67.7708 70.8969
Atten×Noise 30 85 67.7365 0.7972 3343 84.96 <.0001 66.1734 69.2996
Atten×Noise 30 75 66.3509 0.7972 3343 83.23 <.0001 64.7879 67.9139

121
Effect Atten.
Occl.
type Noise Estimate
Std.
Error DF
t
value Pr > |t| Lower Upper
Atten×Noise 30 0 64.5160 0.7972 3343 80.93 <.0001 62.9530 66.0791
Atten×Noise 20 95 69.2496 0.7972 3343 86.87 <.0001 67.6865 70.8126
Atten×Noise 20 85 67.4795 0.7972 3343 84.65 <.0001 65.9164 69.0425
Atten×Noise 20 75 66.2022 0.7972 3343 83.04 <.0001 64.6392 67.7653
Atten×Noise 20 0 64.1741 0.7972 3343 80.50 <.0001 62.6111 65.7371
Atten×Noise 10 95 68.5751 0.7972 3343 86.02 <.0001 67.0121 70.1381
Atten×Noise 10 85 66.4726 0.7972 3343 83.38 <.0001 64.9096 68.0356
Atten×Noise 10 75 65.5725 0.7976 3343 82.22 <.0001 64.0087 67.1363
Atten×Noise 10 0 63.9478 0.7972 3343 80.22 <.0001 62.3848 65.5109
Atten×Noise 0 95 66.9841 0.7972 3343 84.02 <.0001 65.4210 68.5472
Atten×Noise 0 85 65.0855 0.7972 3343 81.64 <.0001 63.5224 66.6485
Atten×Noise 0 75 64.3030 0.7972 3343 80.66 <.0001 62.7400 65.8660
Atten×Noise 0 0 62.6640 0.7972 3343 78.61 <.0001 61.1010 64.2271

122
D.1 TESTS OF EFFECT SLICES
Effect Occl. type Noise
Numerator Degrees of Freedom
Denominator Degrees of Freedom F Value Pr > F
Occl. type×Noise Muff 3 3343 239.45 <.0001
Occl. type×Noise Putty 3 3343 857.65 <.0001
Occl. type×Noise Foam 3 3343 190.91 <.0001
Atten×Occl. type Muff 3 3343 160.32 <.0001
Atten×Occl. type Putty 3 3343 71.24 <.0001
Atten×Occl. type Foam 3 3343 74.70 <.0001
Occl. type×Noise 95 2 3343 17.85 <.0001
Occl. type×Noise 85 2 3343 8.41 0.0002
Occl. type×Noise 75 2 3343 4.29 0.0138
Occl. type×Noise 0 2 3343 1.61 0.1996
Atten×Noise 95 3 3343 85.87 <.0001
Atten×Noise 85 3 3343 105.03 <.0001
Atten×Noise 75 3 3343 63.22 <.0001
Atten×Noise 0 3 3343 47.55 <.0001

123
APPENDIX E
DIFFERENCES OF MARGINAL MEANS FOR DIFFERENT OCCLUSION TYPES
AND NOISE LEVELS
Occlusion
Type Noise
Occlusion
Type Noise Estimate
Standard
Error DF t Value Pr > |t|
Tukey-Kramer
adjusted p-value
Muff 95 Muff 85 1.6597 0.1438 3343 11.54 <.0001 <.0001
Muff 95 Muff 75 2.7915 0.1448 3343 19.27 <.0001 <.0001
Muff 95 Muff 0 3.6406 0.1437 3343 25.34 <.0001 <.0001
Muff 95 Putty 95 -2.5198 0.5500 3343 -4.58 <.0001 0.0003
Muff 95 Putty 85 -0.09573 0.5499 3343 -0.17 0.8618 1.0000
Muff 95 Putty 75 1.3487 0.5499 3343 2.45 0.0142 0.3708
Muff 95 Putty 0 4.6037 0.5499 3343 8.37 <.0001 <.0001
Muff 95 Foam 95 0.5666 0.5499 3343 1.03 0.3029 0.9970
Muff 95 Foam 85 2.0092 0.5499 3343 3.65 0.0003 0.0139
Muff 95 Foam 75 2.6920 0.5499 3343 4.90 <.0001 <.0001
Muff 95 Foam 0 3.9330 0.5499 3343 7.15 <.0001 <.0001
Muff 85 Muff 75 1.1318 0.1450 3343 7.81 <.0001 <.0001
Muff 85 Muff 0 1.9808 0.1438 3343 13.78 <.0001 <.0001
Muff 85 Putty 95 -4.1796 0.5500 3343 -7.60 <.0001 <.0001
Muff 85 Putty 85 -1.7555 0.5500 3343 -3.19 0.0014 0.0634
Muff 85 Putty 75 -0.3110 0.5500 3343 -0.57 0.5718 1.0000
Muff 85 Putty 0 2.9439 0.5500 3343 5.35 <.0001 <.0001
Muff 85 Foam 95 -1.0931 0.5500 3343 -1.99 0.0469 0.7021
Muff 85 Foam 85 0.3495 0.5500 3343 0.64 0.5252 1.0000
Muff 85 Foam 75 1.0323 0.5500 3343 1.88 0.0606 0.7737
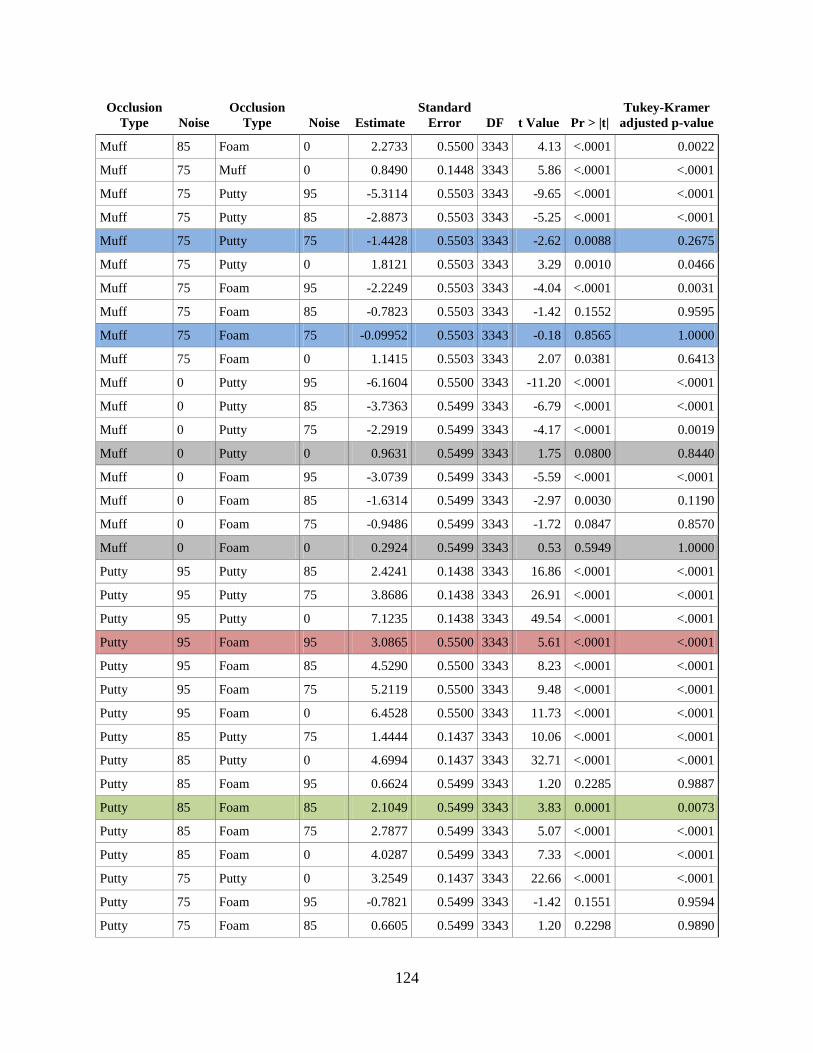
124
Occlusion
Type Noise
Occlusion
Type Noise Estimate
Standard
Error DF t Value Pr > |t|
Tukey-Kramer
adjusted p-value
Muff 85 Foam 0 2.2733 0.5500 3343 4.13 <.0001 0.0022
Muff 75 Muff 0 0.8490 0.1448 3343 5.86 <.0001 <.0001
Muff 75 Putty 95 -5.3114 0.5503 3343 -9.65 <.0001 <.0001
Muff 75 Putty 85 -2.8873 0.5503 3343 -5.25 <.0001 <.0001
Muff 75 Putty 75 -1.4428 0.5503 3343 -2.62 0.0088 0.2675
Muff 75 Putty 0 1.8121 0.5503 3343 3.29 0.0010 0.0466
Muff 75 Foam 95 -2.2249 0.5503 3343 -4.04 <.0001 0.0031
Muff 75 Foam 85 -0.7823 0.5503 3343 -1.42 0.1552 0.9595
Muff 75 Foam 75 -0.09952 0.5503 3343 -0.18 0.8565 1.0000
Muff 75 Foam 0 1.1415 0.5503 3343 2.07 0.0381 0.6413
Muff 0 Putty 95 -6.1604 0.5500 3343 -11.20 <.0001 <.0001
Muff 0 Putty 85 -3.7363 0.5499 3343 -6.79 <.0001 <.0001
Muff 0 Putty 75 -2.2919 0.5499 3343 -4.17 <.0001 0.0019
Muff 0 Putty 0 0.9631 0.5499 3343 1.75 0.0800 0.8440
Muff 0 Foam 95 -3.0739 0.5499 3343 -5.59 <.0001 <.0001
Muff 0 Foam 85 -1.6314 0.5499 3343 -2.97 0.0030 0.1190
Muff 0 Foam 75 -0.9486 0.5499 3343 -1.72 0.0847 0.8570
Muff 0 Foam 0 0.2924 0.5499 3343 0.53 0.5949 1.0000
Putty 95 Putty 85 2.4241 0.1438 3343 16.86 <.0001 <.0001
Putty 95 Putty 75 3.8686 0.1438 3343 26.91 <.0001 <.0001
Putty 95 Putty 0 7.1235 0.1438 3343 49.54 <.0001 <.0001
Putty 95 Foam 95 3.0865 0.5500 3343 5.61 <.0001 <.0001
Putty 95 Foam 85 4.5290 0.5500 3343 8.23 <.0001 <.0001
Putty 95 Foam 75 5.2119 0.5500 3343 9.48 <.0001 <.0001
Putty 95 Foam 0 6.4528 0.5500 3343 11.73 <.0001 <.0001
Putty 85 Putty 75 1.4444 0.1437 3343 10.06 <.0001 <.0001
Putty 85 Putty 0 4.6994 0.1437 3343 32.71 <.0001 <.0001
Putty 85 Foam 95 0.6624 0.5499 3343 1.20 0.2285 0.9887
Putty 85 Foam 85 2.1049 0.5499 3343 3.83 0.0001 0.0073
Putty 85 Foam 75 2.7877 0.5499 3343 5.07 <.0001 <.0001
Putty 85 Foam 0 4.0287 0.5499 3343 7.33 <.0001 <.0001
Putty 75 Putty 0 3.2549 0.1437 3343 22.66 <.0001 <.0001
Putty 75 Foam 95 -0.7821 0.5499 3343 -1.42 0.1551 0.9594
Putty 75 Foam 85 0.6605 0.5499 3343 1.20 0.2298 0.9890
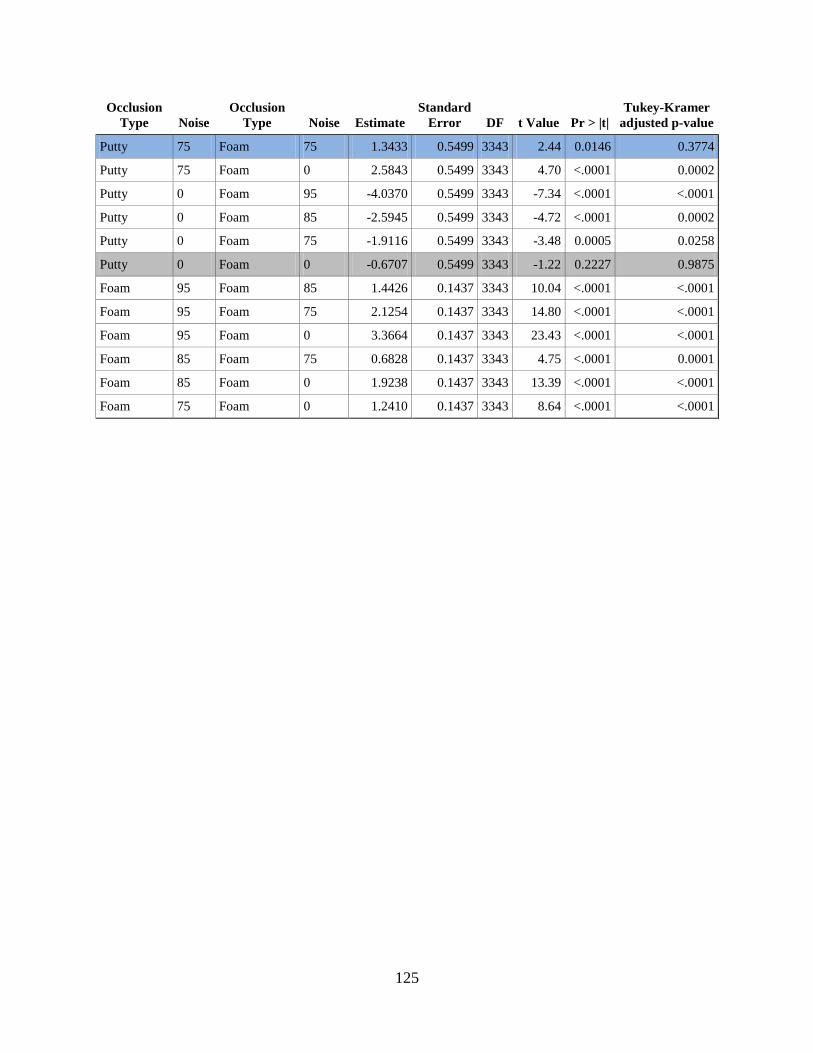
125
Occlusion
Type Noise
Occlusion
Type Noise Estimate
Standard
Error DF t Value Pr > |t|
Tukey-Kramer
adjusted p-value
Putty 75 Foam 75 1.3433 0.5499 3343 2.44 0.0146 0.3774
Putty 75 Foam 0 2.5843 0.5499 3343 4.70 <.0001 0.0002
Putty 0 Foam 95 -4.0370 0.5499 3343 -7.34 <.0001 <.0001
Putty 0 Foam 85 -2.5945 0.5499 3343 -4.72 <.0001 0.0002
Putty 0 Foam 75 -1.9116 0.5499 3343 -3.48 0.0005 0.0258
Putty 0 Foam 0 -0.6707 0.5499 3343 -1.22 0.2227 0.9875
Foam 95 Foam 85 1.4426 0.1437 3343 10.04 <.0001 <.0001
Foam 95 Foam 75 2.1254 0.1437 3343 14.80 <.0001 <.0001
Foam 95 Foam 0 3.3664 0.1437 3343 23.43 <.0001 <.0001
Foam 85 Foam 75 0.6828 0.1437 3343 4.75 <.0001 0.0001
Foam 85 Foam 0 1.9238 0.1437 3343 13.39 <.0001 <.0001
Foam 75 Foam 0 1.2410 0.1437 3343 8.64 <.0001 <.0001

126
APPENDIX F
DIFFERENCES OF MARGINAL MEANS FOR DIFFERENT LEVELS OF
ATTENUATION AND NOISE
Atten. Noise Atten. Noise Estimate
Standard
Error DF t Value Pr > |t|
Tukey-Kramer
adjusted p-value
30 95 30 85 1.5974 0.1661 3343 9.62 <.0001 <.0001
30 95 30 75 2.9830 0.1659 3343 17.98 <.0001 <.0001
30 95 30 0 4.8178 0.1659 3343 29.04 <.0001 <.0001
30 95 20 95 0.08432 0.1659 3343 0.51 0.6113 1.0000
30 95 20 85 1.8544 0.1659 3343 11.18 <.0001 <.0001
30 95 20 75 3.1316 0.1659 3343 18.88 <.0001 <.0001
30 95 20 0 5.1598 0.1659 3343 31.11 <.0001 <.0001
30 95 10 95 0.7588 0.1659 3343 4.57 <.0001 0.0006
30 95 10 85 2.8613 0.1659 3343 17.25 <.0001 <.0001
30 95 10 75 3.7614 0.1677 3343 22.43 <.0001 <.0001
30 95 10 0 5.3860 0.1659 3343 32.47 <.0001 <.0001
30 95 0 95 2.3498 0.1661 3343 14.15 <.0001 <.0001
30 95 0 85 4.2484 0.1659 3343 25.61 <.0001 <.0001
30 95 0 75 5.0309 0.1659 3343 30.33 <.0001 <.0001
30 95 0 0 6.6698 0.1659 3343 40.21 <.0001 <.0001
30 85 30 75 1.3856 0.1661 3343 8.34 <.0001 <.0001
30 85 30 0 3.2205 0.1661 3343 19.39 <.0001 <.0001
30 85 20 95 -1.5131 0.1661 3343 -9.11 <.0001 <.0001
30 85 20 85 0.2570 0.1661 3343 1.55 0.1218 0.9768
30 85 20 75 1.5343 0.1661 3343 9.24 <.0001 <.0001

127
Atten. Noise Atten. Noise Estimate
Standard
Error DF t Value Pr > |t|
Tukey-Kramer
adjusted p-value
30 85 20 0 3.5624 0.1661 3343 21.45 <.0001 <.0001
30 85 10 95 -0.8386 0.1661 3343 -5.05 <.0001 <.0001
30 85 10 85 1.2639 0.1661 3343 7.61 <.0001 <.0001
30 85 10 75 2.1640 0.1679 3343 12.89 <.0001 <.0001
30 85 10 0 3.7887 0.1661 3343 22.81 <.0001 <.0001
30 85 0 95 0.7524 0.1663 3343 4.53 <.0001 0.0007
30 85 0 85 2.6510 0.1661 3343 15.96 <.0001 <.0001
30 85 0 75 3.4335 0.1661 3343 20.67 <.0001 <.0001
30 85 0 0 5.0725 0.1661 3343 30.54 <.0001 <.0001
30 75 30 0 1.8349 0.1659 3343 11.06 <.0001 <.0001
30 75 20 95 -2.8986 0.1659 3343 -17.47 <.0001 <.0001
30 75 20 85 -1.1285 0.1659 3343 -6.80 <.0001 <.0001
30 75 20 75 0.1487 0.1659 3343 0.90 0.3701 1.0000
30 75 20 0 2.1768 0.1659 3343 13.12 <.0001 <.0001
30 75 10 95 -2.2242 0.1659 3343 -13.41 <.0001 <.0001
30 75 10 85 -0.1217 0.1659 3343 -0.73 0.4632 1.0000
30 75 10 75 0.7784 0.1677 3343 4.64 <.0001 0.0004
30 75 10 0 2.4031 0.1659 3343 14.49 <.0001 <.0001
30 75 0 95 -0.6332 0.1661 3343 -3.81 0.0001 0.0133
30 75 0 85 1.2654 0.1659 3343 7.63 <.0001 <.0001
30 75 0 75 2.0479 0.1659 3343 12.35 <.0001 <.0001
30 75 0 0 3.6869 0.1659 3343 22.23 <.0001 <.0001
30 0 20 95 -4.7335 0.1659 3343 -28.54 <.0001 <.0001
30 0 20 85 -2.9634 0.1659 3343 -17.87 <.0001 <.0001
30 0 20 75 -1.6862 0.1659 3343 -10.17 <.0001 <.0001
30 0 20 0 0.3419 0.1659 3343 2.06 0.0393 0.7897
30 0 10 95 -4.0591 0.1659 3343 -24.47 <.0001 <.0001
30 0 10 85 -1.9566 0.1659 3343 -11.80 <.0001 <.0001
30 0 10 75 -1.0564 0.1677 3343 -6.30 <.0001 <.0001
30 0 10 0 0.5682 0.1659 3343 3.43 0.0006 0.0505
30 0 0 95 -2.4681 0.1661 3343 -14.86 <.0001 <.0001
30 0 0 85 -0.5694 0.1659 3343 -3.43 0.0006 0.0493
30 0 0 75 0.2130 0.1659 3343 1.28 0.1991 0.9964
30 0 0 0 1.8520 0.1659 3343 11.16 <.0001 <.0001
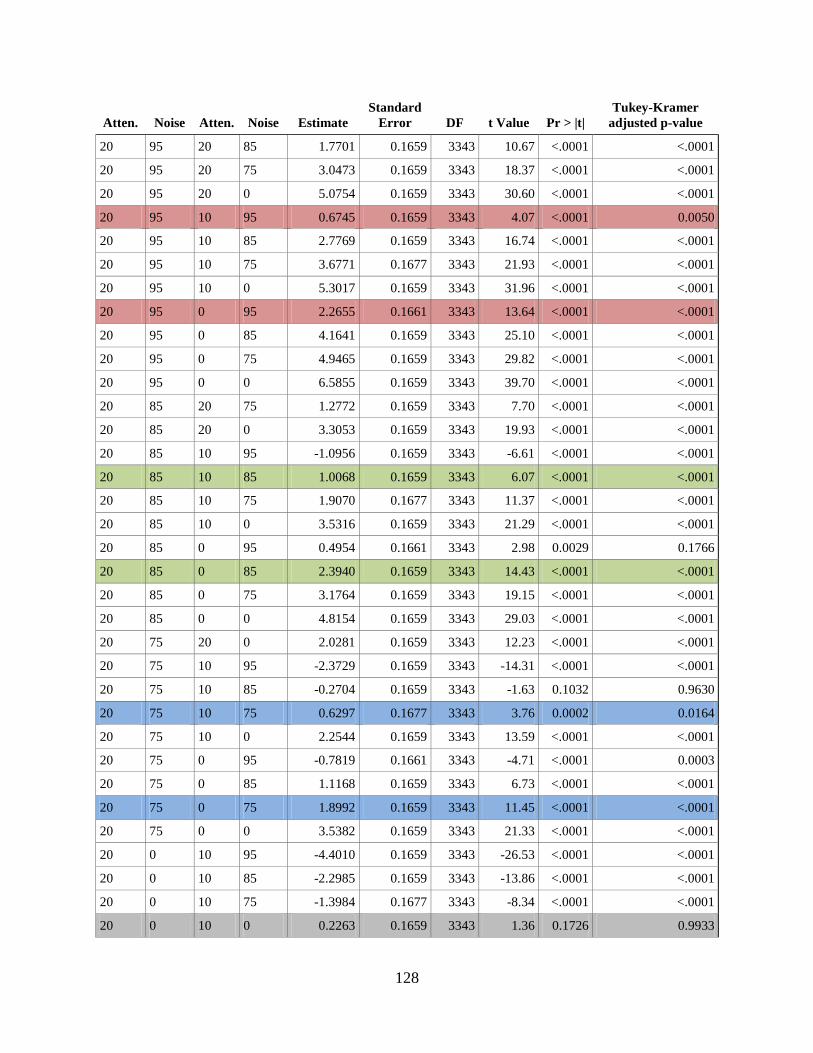
128
Atten. Noise Atten. Noise Estimate
Standard
Error DF t Value Pr > |t|
Tukey-Kramer
adjusted p-value
20 95 20 85 1.7701 0.1659 3343 10.67 <.0001 <.0001
20 95 20 75 3.0473 0.1659 3343 18.37 <.0001 <.0001
20 95 20 0 5.0754 0.1659 3343 30.60 <.0001 <.0001
20 95 10 95 0.6745 0.1659 3343 4.07 <.0001 0.0050
20 95 10 85 2.7769 0.1659 3343 16.74 <.0001 <.0001
20 95 10 75 3.6771 0.1677 3343 21.93 <.0001 <.0001
20 95 10 0 5.3017 0.1659 3343 31.96 <.0001 <.0001
20 95 0 95 2.2655 0.1661 3343 13.64 <.0001 <.0001
20 95 0 85 4.1641 0.1659 3343 25.10 <.0001 <.0001
20 95 0 75 4.9465 0.1659 3343 29.82 <.0001 <.0001
20 95 0 0 6.5855 0.1659 3343 39.70 <.0001 <.0001
20 85 20 75 1.2772 0.1659 3343 7.70 <.0001 <.0001
20 85 20 0 3.3053 0.1659 3343 19.93 <.0001 <.0001
20 85 10 95 -1.0956 0.1659 3343 -6.61 <.0001 <.0001
20 85 10 85 1.0068 0.1659 3343 6.07 <.0001 <.0001
20 85 10 75 1.9070 0.1677 3343 11.37 <.0001 <.0001
20 85 10 0 3.5316 0.1659 3343 21.29 <.0001 <.0001
20 85 0 95 0.4954 0.1661 3343 2.98 0.0029 0.1766
20 85 0 85 2.3940 0.1659 3343 14.43 <.0001 <.0001
20 85 0 75 3.1764 0.1659 3343 19.15 <.0001 <.0001
20 85 0 0 4.8154 0.1659 3343 29.03 <.0001 <.0001
20 75 20 0 2.0281 0.1659 3343 12.23 <.0001 <.0001
20 75 10 95 -2.3729 0.1659 3343 -14.31 <.0001 <.0001
20 75 10 85 -0.2704 0.1659 3343 -1.63 0.1032 0.9630
20 75 10 75 0.6297 0.1677 3343 3.76 0.0002 0.0164
20 75 10 0 2.2544 0.1659 3343 13.59 <.0001 <.0001
20 75 0 95 -0.7819 0.1661 3343 -4.71 <.0001 0.0003
20 75 0 85 1.1168 0.1659 3343 6.73 <.0001 <.0001
20 75 0 75 1.8992 0.1659 3343 11.45 <.0001 <.0001
20 75 0 0 3.5382 0.1659 3343 21.33 <.0001 <.0001
20 0 10 95 -4.4010 0.1659 3343 -26.53 <.0001 <.0001
20 0 10 85 -2.2985 0.1659 3343 -13.86 <.0001 <.0001
20 0 10 75 -1.3984 0.1677 3343 -8.34 <.0001 <.0001
20 0 10 0 0.2263 0.1659 3343 1.36 0.1726 0.9933

129
Atten. Noise Atten. Noise Estimate
Standard
Error DF t Value Pr > |t|
Tukey-Kramer
adjusted p-value
20 0 0 95 -2.8100 0.1661 3343 -16.92 <.0001 <.0001
20 0 0 85 -0.9114 0.1659 3343 -5.49 <.0001 <.0001
20 0 0 75 -0.1289 0.1659 3343 -0.78 0.4371 1.0000
20 0 0 0 1.5101 0.1659 3343 9.10 <.0001 <.0001
10 95 10 85 2.1025 0.1659 3343 12.68 <.0001 <.0001
10 95 10 75 3.0026 0.1677 3343 17.90 <.0001 <.0001
10 95 10 0 4.6272 0.1659 3343 27.90 <.0001 <.0001
10 95 0 95 1.5910 0.1661 3343 9.58 <.0001 <.0001
10 95 0 85 3.4896 0.1659 3343 21.04 <.0001 <.0001
10 95 0 75 4.2721 0.1659 3343 25.75 <.0001 <.0001
10 95 0 0 5.9111 0.1659 3343 35.64 <.0001 <.0001
10 85 10 75 0.9001 0.1677 3343 5.37 <.0001 <.0001
10 85 10 0 2.5248 0.1659 3343 15.22 <.0001 <.0001
10 85 0 95 -0.5115 0.1661 3343 -3.08 0.0021 0.1379
10 85 0 85 1.3871 0.1659 3343 8.36 <.0001 <.0001
10 85 0 75 2.1696 0.1659 3343 13.08 <.0001 <.0001
10 85 0 0 3.8086 0.1659 3343 22.96 <.0001 <.0001
10 75 10 0 1.6246 0.1677 3343 9.69 <.0001 <.0001
10 75 0 95 -1.4116 0.1679 3343 -8.41 <.0001 <.0001
10 75 0 85 0.4870 0.1677 3343 2.90 0.0037 0.2134
10 75 0 75 1.2695 0.1677 3343 7.57 <.0001 <.0001
10 75 0 0 2.9084 0.1677 3343 17.34 <.0001 <.0001
10 0 0 95 -3.0363 0.1661 3343 -18.28 <.0001 <.0001
10 0 0 85 -1.1376 0.1659 3343 -6.86 <.0001 <.0001
10 0 0 75 -0.3552 0.1659 3343 -2.14 0.0323 0.7382
10 0 0 0 1.2838 0.1659 3343 7.74 <.0001 <.0001
0 95 0 85 1.8986 0.1661 3343 11.43 <.0001 <.0001
0 95 0 75 2.6811 0.1661 3343 16.14 <.0001 <.0001
0 95 0 0 4.3201 0.1661 3343 26.01 <.0001 <.0001
0 85 0 75 0.7825 0.1659 3343 4.72 <.0001 0.0003
0 85 0 0 2.4214 0.1659 3343 14.60 <.0001 <.0001
0 75 0 0 1.6390 0.1659 3343 9.88 <.0001 <.0001
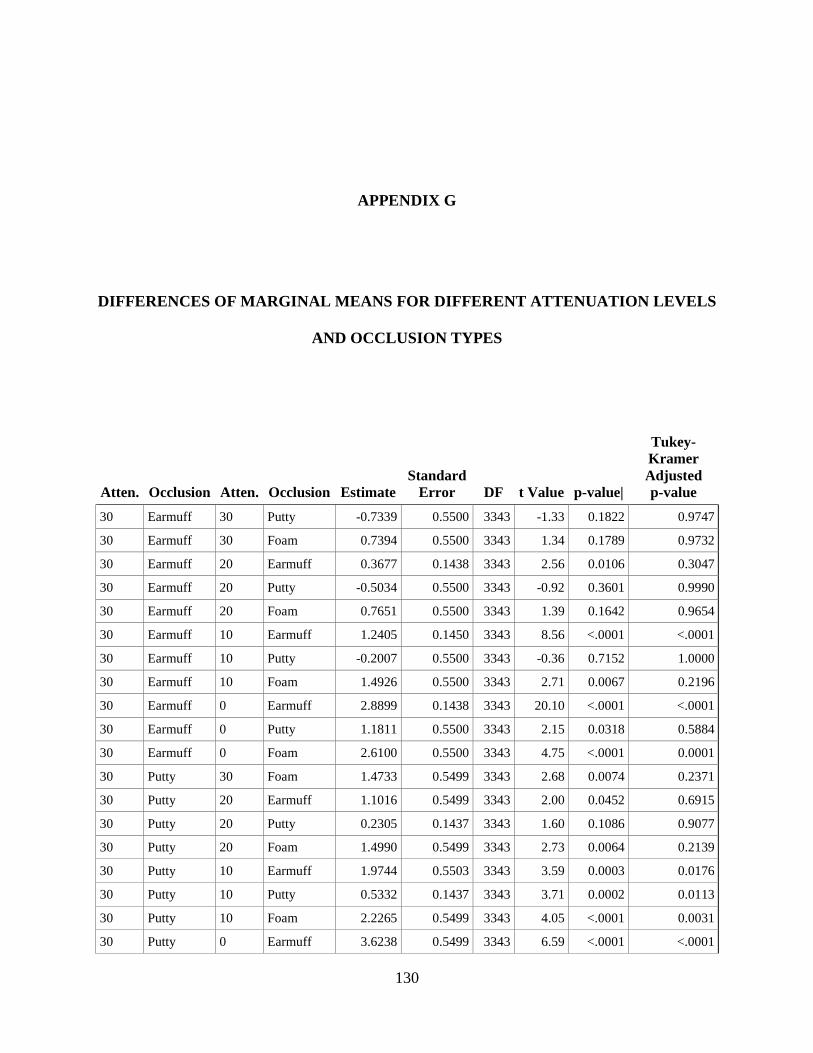
130
APPENDIX G
DIFFERENCES OF MARGINAL MEANS FOR DIFFERENT ATTENUATION LEVELS
AND OCCLUSION TYPES
Atten. Occlusion Atten. Occlusion Estimate
Standard
Error DF t Value p-value|
Tukey-
Kramer
Adjusted
p-value
30 Earmuff 30 Putty -0.7339 0.5500 3343 -1.33 0.1822 0.9747
30 Earmuff 30 Foam 0.7394 0.5500 3343 1.34 0.1789 0.9732
30 Earmuff 20 Earmuff 0.3677 0.1438 3343 2.56 0.0106 0.3047
30 Earmuff 20 Putty -0.5034 0.5500 3343 -0.92 0.3601 0.9990
30 Earmuff 20 Foam 0.7651 0.5500 3343 1.39 0.1642 0.9654
30 Earmuff 10 Earmuff 1.2405 0.1450 3343 8.56 <.0001 <.0001
30 Earmuff 10 Putty -0.2007 0.5500 3343 -0.36 0.7152 1.0000
30 Earmuff 10 Foam 1.4926 0.5500 3343 2.71 0.0067 0.2196
30 Earmuff 0 Earmuff 2.8899 0.1438 3343 20.10 <.0001 <.0001
30 Earmuff 0 Putty 1.1811 0.5500 3343 2.15 0.0318 0.5884
30 Earmuff 0 Foam 2.6100 0.5500 3343 4.75 <.0001 0.0001
30 Putty 30 Foam 1.4733 0.5499 3343 2.68 0.0074 0.2371
30 Putty 20 Earmuff 1.1016 0.5499 3343 2.00 0.0452 0.6915
30 Putty 20 Putty 0.2305 0.1437 3343 1.60 0.1086 0.9077
30 Putty 20 Foam 1.4990 0.5499 3343 2.73 0.0064 0.2139
30 Putty 10 Earmuff 1.9744 0.5503 3343 3.59 0.0003 0.0176
30 Putty 10 Putty 0.5332 0.1437 3343 3.71 0.0002 0.0113
30 Putty 10 Foam 2.2265 0.5499 3343 4.05 <.0001 0.0031
30 Putty 0 Earmuff 3.6238 0.5499 3343 6.59 <.0001 <.0001
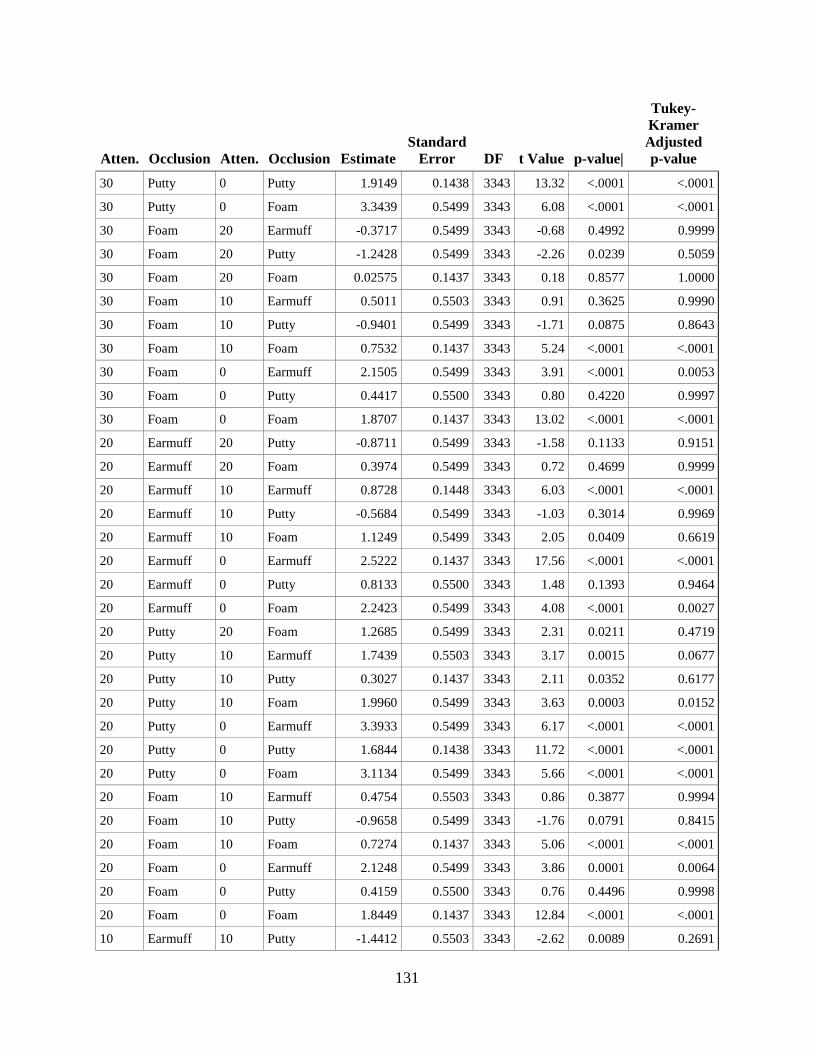
131
Atten. Occlusion Atten. Occlusion Estimate
Standard
Error DF t Value p-value|
Tukey-
Kramer
Adjusted
p-value
30 Putty 0 Putty 1.9149 0.1438 3343 13.32 <.0001 <.0001
30 Putty 0 Foam 3.3439 0.5499 3343 6.08 <.0001 <.0001
30 Foam 20 Earmuff -0.3717 0.5499 3343 -0.68 0.4992 0.9999
30 Foam 20 Putty -1.2428 0.5499 3343 -2.26 0.0239 0.5059
30 Foam 20 Foam 0.02575 0.1437 3343 0.18 0.8577 1.0000
30 Foam 10 Earmuff 0.5011 0.5503 3343 0.91 0.3625 0.9990
30 Foam 10 Putty -0.9401 0.5499 3343 -1.71 0.0875 0.8643
30 Foam 10 Foam 0.7532 0.1437 3343 5.24 <.0001 <.0001
30 Foam 0 Earmuff 2.1505 0.5499 3343 3.91 <.0001 0.0053
30 Foam 0 Putty 0.4417 0.5500 3343 0.80 0.4220 0.9997
30 Foam 0 Foam 1.8707 0.1437 3343 13.02 <.0001 <.0001
20 Earmuff 20 Putty -0.8711 0.5499 3343 -1.58 0.1133 0.9151
20 Earmuff 20 Foam 0.3974 0.5499 3343 0.72 0.4699 0.9999
20 Earmuff 10 Earmuff 0.8728 0.1448 3343 6.03 <.0001 <.0001
20 Earmuff 10 Putty -0.5684 0.5499 3343 -1.03 0.3014 0.9969
20 Earmuff 10 Foam 1.1249 0.5499 3343 2.05 0.0409 0.6619
20 Earmuff 0 Earmuff 2.5222 0.1437 3343 17.56 <.0001 <.0001
20 Earmuff 0 Putty 0.8133 0.5500 3343 1.48 0.1393 0.9464
20 Earmuff 0 Foam 2.2423 0.5499 3343 4.08 <.0001 0.0027
20 Putty 20 Foam 1.2685 0.5499 3343 2.31 0.0211 0.4719
20 Putty 10 Earmuff 1.7439 0.5503 3343 3.17 0.0015 0.0677
20 Putty 10 Putty 0.3027 0.1437 3343 2.11 0.0352 0.6177
20 Putty 10 Foam 1.9960 0.5499 3343 3.63 0.0003 0.0152
20 Putty 0 Earmuff 3.3933 0.5499 3343 6.17 <.0001 <.0001
20 Putty 0 Putty 1.6844 0.1438 3343 11.72 <.0001 <.0001
20 Putty 0 Foam 3.1134 0.5499 3343 5.66 <.0001 <.0001
20 Foam 10 Earmuff 0.4754 0.5503 3343 0.86 0.3877 0.9994
20 Foam 10 Putty -0.9658 0.5499 3343 -1.76 0.0791 0.8415
20 Foam 10 Foam 0.7274 0.1437 3343 5.06 <.0001 <.0001
20 Foam 0 Earmuff 2.1248 0.5499 3343 3.86 0.0001 0.0064
20 Foam 0 Putty 0.4159 0.5500 3343 0.76 0.4496 0.9998
20 Foam 0 Foam 1.8449 0.1437 3343 12.84 <.0001 <.0001
10 Earmuff 10 Putty -1.4412 0.5503 3343 -2.62 0.0089 0.2691
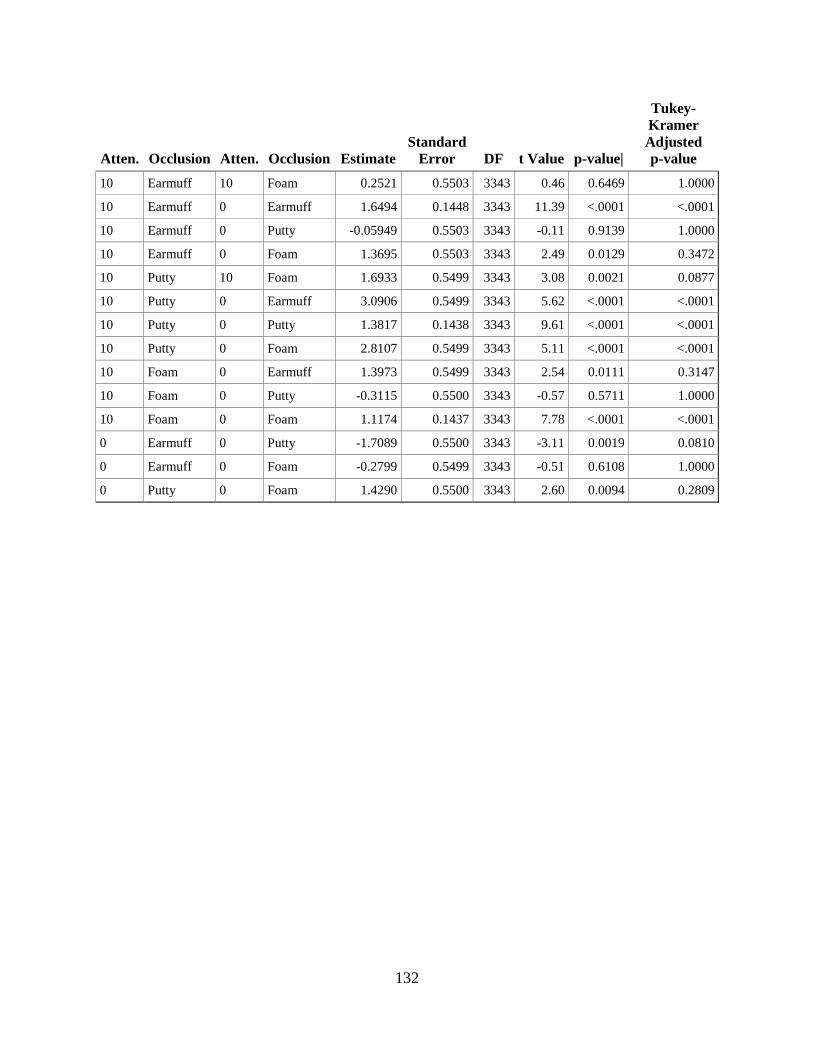
132
Atten. Occlusion Atten. Occlusion Estimate
Standard
Error DF t Value p-value|
Tukey-
Kramer
Adjusted
p-value
10 Earmuff 10 Foam 0.2521 0.5503 3343 0.46 0.6469 1.0000
10 Earmuff 0 Earmuff 1.6494 0.1448 3343 11.39 <.0001 <.0001
10 Earmuff 0 Putty -0.05949 0.5503 3343 -0.11 0.9139 1.0000
10 Earmuff 0 Foam 1.3695 0.5503 3343 2.49 0.0129 0.3472
10 Putty 10 Foam 1.6933 0.5499 3343 3.08 0.0021 0.0877
10 Putty 0 Earmuff 3.0906 0.5499 3343 5.62 <.0001 <.0001
10 Putty 0 Putty 1.3817 0.1438 3343 9.61 <.0001 <.0001
10 Putty 0 Foam 2.8107 0.5499 3343 5.11 <.0001 <.0001
10 Foam 0 Earmuff 1.3973 0.5499 3343 2.54 0.0111 0.3147
10 Foam 0 Putty -0.3115 0.5500 3343 -0.57 0.5711 1.0000
10 Foam 0 Foam 1.1174 0.1437 3343 7.78 <.0001 <.0001
0 Earmuff 0 Putty -1.7089 0.5500 3343 -3.11 0.0019 0.0810
0 Earmuff 0 Foam -0.2799 0.5499 3343 -0.51 0.6108 1.0000
0 Putty 0 Foam 1.4290 0.5500 3343 2.60 0.0094 0.2809

133
BIBLIOGRAPHY
von Bekesy, G. (1949). The structure of the middle ear and the hearing of one's own voice by
bone conduction. J Acoust Soc Am, 21, 217-232.
von Gierke, H.E. (1954). Personal Protection. In Conference on Factory Noise: Sponsored by the
Associated Industries of New York State; Schenectady, New York, October 29, 1953, Am
Ind Hyg Assn Quarterly, 15(1), 44-52.
Abel, S.M., Alberti, P.W., Haythornthwaite, C., & Riko, K. (1982). Speech intelligibility in
noise: Effects of fluency and hearing protector type. J Acoust Soc Am, 71(3), 708-715.
Abel, S.M., Armstrong, N.M., & Giguere, C. (1993). Auditory perception with level dependent
hearing protectors. The effects of age and hearing loss. Scand Audiol, 22, 71-85.
Abel, S.M., & Spencer, D.L. (1997). Active noise reduction versus conventional hearing
protection. Relative benefits for normal-hearing and impaired listeners. Scand Audiol, 26,
155-167.
Allen, C.H., & Berger, E.H. (1990). Development of a unique passive hearing protector with
level-dependent and flat attenuation characteristics. Noise Control Eng J, 34(3), 97-105.
Amazi, D.K., & Garber, S.R. (1982). The Lombard sign as a function of age and task. J Speech
Hear Res, 25, 581-585.
American National Standards Institute (1999). American National Standard Method for
Measuring the Intelligibility of Speech Over Communication Systems (ANSI S3.2-1989,
R1999). New York, ANSI.
American National Standards Institute (2012). American National Standard Methods for
Calculation of the Speech Intelligibility Index (ANSI S3.5-1997, R2012). New York,
ANSI.
American National Standards Institute (2010). American National Standard Specification for
Audiometers (ANSI S3.6-2010). New York, ANSI.
American National Standards Institute (2008). American National Standard Maximum
Permissible Ambient Noise Levels for Audiometric Test Rooms (ANSI S3.1-1999,
R2008). New York, ANSI.

134
American Standards Association (1960). American Standard Method for Measurement of
Monosyllabic Word Intelligibility (S3.2-1960). New York, ASA.
Aronsson, C., Bohman, M., Ternstrom, S., & Sodersten, M. (2007). Loud voice during
environmental noise exposure in patients with vocal nodules. Logopedics, Phoniatrics,
Vocology, 32(2), 60-70.
Bauman, K.S., & Marston, L.E. (1986). Effects of hearing protection on speech intelligibility in
noise. Sound and Vibration, 20(10), 12-14.
Berger, E.H., & Kerivan, J.E. (1983). Influence of physiological noise and the occlusion effect
on the measurement of real-ear attenuation at threshold. J Acoust Soc Am, 74(1), 81-94.
Berger, E.H. (1986). Review and Tutorial - Methods of Measuring the Attenuation of Hearing
Protection Devices. J Acoust Soc Am, 79(6), 1655-1687.
Berger, E.H. (1988). Hearing protectors—specifications, fitting, use, and performance. In
Hearing Conservation in Industry, Schools, and the Military, edited by D.M. Lipscomb,
Singular Publishing Group, Inc., San Diego, CA, p.184.
Berger, E.H., Kieper, R.W., & Gauger, D. (2003). Hearing protection: surpassing the limits to
attenuation imposed by the bone-conduction pathways. J Acoust Soc Am, 114(4 Pt. 1),
1955-1967.
Berger, E. H., Franks, J. R., & Lindgren, F. (1996). International review of field studies of
hearing protector attenuation. In Scientific Basis of Noise-Induced Hearing Loss, edited
by A. Axlesson, H. Borchgrevink, R. P. Hamernik, P. Hellstrom, D. Henderson, and R. J.
Salvi, Thieme Medical Publishers, Inc., New York, NY, pp.361-377.
Bilger, R.C., Neutzel, J.M., Rabinowitz, W.M., & Rzeckowski, C. (1984). Standardization of a
test of speech perception in noise. J Speech Hear Res, 27(1), 32-48.
Blue, M., Ntuen, C., & Letowski, T. (2004). Speech intelligibility of the callsign acquisition test
in a quiet environment. Int J Occup Saf Ergon, 10(2), 179-189.
Bond, Z.S., Moore, T.J., & Gable, B. (1989). Acoustic-phonetic characteristics of speech
produced in noise and while wearing an oxygen mask. J Acoust Soc Am. 85(2), 907-912.
Borg, E., Nilsson, R., & Engstrom, B. (1983). Effect of the acoustic reflex on inner ear damage
induced by industrial noise. Acta Oto-Laryngologica, 96(5-6), 361-369.
Borg, E. & Zakrisson, J.E. (1974). Stapedius reflex and monaural masking. Acta Otolaryngol,
78(3-4), 155-161.
Borg, E. & Zakrisson, J.E. (1975). The activity of the stapedius muscle in man during
vocalization. Acta Otolaryngol, 79(5-6), 325-333.

135
Brunskog, J., Gade, A., Bellester, G.P., & Calbo, L.R., (2009). Increase in voice level and
speaker comfort in lecture rooms. J Acoust Soc Am, 125, 2072–2082.
Burk, M.H., Humes, L.E., Amos, N.E., & Strauser, L.E. (2006). Effect of training on word-
recognition performance in noise for young normal-hearing and older hearing-impaired
listeners. Ear Hear, 27(3), 263-278.
Burk, M.H., & Humes, L.E. (2007). Effects of training on speech recognition performance in
noise using lexically hard words. J Speech Lang Hear Res, 50(1), 25-40.
Byrne, D., Dillon, H., Tran, K., Arlinger, S., Wilbraham, K., Cox, R., Hagerman, B., Hetu, R.,
Kei, J., Lui, C., Kiessling, J., Kotby, M.N., Nasser, N.H.A., El Kholy, W.A.H.,
Nakanishi, Y., Oyer, H., Powell, R., Stephens, D., Meredith, R., Sirimanna, T.,
Tavartkiladze, G., Frolenkov, G.I., Westerman, S., & Ludvigsen, C. (1994). An
international comparison of long-term average speech spectra. J Acoust Soc Am, 96(4),
2108-2120.
Casali, J.G., Horylev, M.J., & Grenell, J.F. (1987). A pilot study on the effects of hearing
protection and ambient noise characteristics on intensity of uttered speech. In Trends in
Ergonomics IV: Proceedings of the Annual International Industrial Ergonomics and
Safety Conference held in Miami, Florida, USA, 9-12 June 1987, edited by S.S. Asfour,
Elsevier Science Publishers, New York, pp.303-310.
Cherry, R. & Rubinstein, A. (2005). A comparison of two approaches to assessment of speech
recognition ability in single cases. J Am Acad Audiol, 16, 54-62.
Chung, D.Y., & Gannon, R.P. (1979). The effect of ear protectors on word discrimination in
subject with normal hearing and subjects with noise-induced hearing loss. J Am Aud Soc,
5, 11-16.
Cluff, G.L., Pavlovic, C.V., & Overson, G.J. (1993). Development of phonetically balanced
phrase lists typical of communication in noisy work environments. Am J Audiol, 2, 54-59.
Cornelisse, L.E., Gagnne, J.P., & Seewald, R.C. (1991). Ear level recordings of the long-term
average spectrum of speech. Ear Hear, 12(1), 47-54.
Cox, R.M., Alexander, G.C., & Gilmore, C. (1987). Development of the Connected Speech Test
(CST). Ear Hear, 8(5 Suppl), 119S-126S.
Cox, R.M., Gray, G.A., & Alexander, G.C. (2001). Evaluation of a revised speech in noise
(RSIN) test. J Am Acad Audiol, 12(8), 423-432.
Cox, R.M., & Moore, J.N. (1988). Composite speech spectrum for hearing and gain
prescriptions. J Speech Hear Res, 31(1), 102-107.
Cushing, I.R., Li, F.F., Cox, T.J., Worrall, K., & Jackson, T. (2011). Vocal effort levels in
anechoic conditions. Appl Acoust, 72(9), 695-701.
136
Davis, R.R. (2008). What do we know about hearing protector comfort? Noise & Health, 10(40),
83-89.
Dean, A., & Voss, D. (1999). Design and analysis of experiments. New York, NY: Springer
Publishing Company.
Department of the Army (2007). Medical Services: Standards of Medical Fitness, Army
Regulation 40-501, Washington, DC, December 14, 2007.
Department of Health and Human Services (2005). “Protection of Human Subjects,” 45 CFR
Part 46, 56 Fed. Regist. 28012-28022, June 18, 1991; 56 Fed. Regist. 29756, June 28,
1991, as amended at 70 Fed. Regist. 36328, June 23, 2005.
Djupesland, G. (1964). Middle-ear muscle reflexes elicited by acoustic and nonacoustic
stimulation. Acta Oto-Laryngologica Supplementum, 188, 287-292.
Dolan, T.G., & O'Loughlin, D. (2005). Amplified earmuffs: impact on speech intelligibility in
industrial noise for listeners with hearing loss. Am J Audiol, 14(1), 80-85.
Dreher, J.J., & O’Neill, J.J. (1957). Effects of ambient noise on speaker intelligibility for words
and phrases. J Acoust Soc Am, 29(12), 1320-1323.
Dubno, J.R., Horwitz, A.R., & Ahlstrom, J.B. (2005). Word recognition in noise at higher-than-
normal levels: decreases in scores and increases in masking. J Acoust Soc Am, 118(2),
914-922.
Dunn, H.K., & White, S.D. (1940). Statistical measurements on conversational speech. J Acoust
Soc Am, 11, 278-288.
Egan, J.P. (1948). Articulation testing methods. Laryngoscope, 58(9), 955-991.
Environmental Protection Agency (EPA), (1979). Noise Labeling Requirements for Hearing
Protectors. 40 CFR PART 211, Fed. Register 44(190), 56130–56147.
Etymotic Research. (2005). BKB-SIN™
Speech-in-Noise Test (compact disc). Elk Grove
Village, IL 60007.
European Committee for Standardization (2004). Hearing protectors – recommendations for
selection, use, care and maintenance – guidance document. European Standard EN 458.
European Committee for Standardization (CEN) Technical Committee 159; Brussels,
Belgium.
Fairbanks, G. (1958). Test of phonemic differentiation: the rhyme test. J Acoust Soc Am, 30(7),
596-600.
Fernandes, J.C. (2003). Effects of hearing protector devices on speech intelligibility. Appl
Acoust, 64, 581-590.
137
Fitzmaurice, G.M., Laird, N.M., & Ware, J.H. (2011). Applied longitudinal analysis, 2nd edition.
Hoboken, New Jersey: John Wiley & Sons, Inc.
Fletcher, H., & Steinberg, J.C. (1929). Articulation testing methods. Bell System Technical
Journal, 8, 806-854.
Fletcher, H., & Steinberg, J.C. (1930). Articulation testing methods. J Acoust Soc Am, 1, 1-48.
Ford, J.M., & Mathalon, D.H. (2005). Corollary discharge dysfunction in schizophrenia: Can it
explain auditory hallucinations? International Journal of Psychophysiology, 58(2-3),
179-189.
Fox, C.M., Ramig, L.O., Ciucci, M.R., Sapir, S., McFarland, D.H., & Farley, B.G. (2006). The
science and practice of LSVT/LOUD: neural plasticity-principled approach to treating
individuals with Parkinson disease and other neurological disorders. Semin Speech Lang,
27(4), 283-299.
Franks, J.R. (1988). Number of workers exposed to occupational noise. Seminars in Hearing,
9(4), 287-298.
French, N.R., & Steinberg, J.C. (1947). Factors governing the intelligibility of speech sounds. J
Acoust Soc Am, 19(1), 90-119.
Garnier, M., Henrich, N., & Dubois, D. (2010). Influence of sound immersion and
communicative interaction on the Lombard effect. J Speech Lang Hearing Res, 53, 588-
608.
Gelfand, S. A. (1981). Hearing: An introduction to psychological and physiological acoustics.
New York, NY: Marcel Dekker, Inc.
Giolas, T.G., & Duffy, J.R. (1973). Equivalency of CID and revised CID sentence lists. J Speech
Hear Res, 16, 549-555.
Hanley, T.D., & Steer, M.D. (1949) Effect of level of distracting noise upon speaking rate,
duration and intensity. J Speech Hear Disord, 14(4), 363-368.
Hanley, C.N., & Harvey, D.G. (1965). Quantifying the Lombard effect. J Speech Hear Disord,
30, 274-277.
Harris, J.D., Haines, H.L., Kelsey, P.A., & Clack, T.D. (1961). The relation between speech
intelligibility and the electro-acoustic characteristics of low fidelity circuitry. J Aud Res,
1(5), 357-381.
Hawkins, J.E., & Stevens, S.S. (1950). The masking of pure tones and of speech by white noise.
J Acoust Soc Am, 22(1), 6-13.
138
Heinks-Maldonado, T.H., Nagarajan, S.S., & Houde, J.F. (2006). Magnetoencephalographic
evidence for a precise forward model in speech production. NeuroReport, 17(13),1375-
1379.
Helmkamp, J.S. (1986). Why workers do not use hearing protection. Occup Health Saf, 55, 52.
Hirsh, I., Davis, H., Silverman, S., Reynolds, E., Eldert, E., & Benson, R. (1952). Development
of materials for speech audiometry. J Speech Hear Disord, 17, 321-337.
Ho, A.K., Bradshaw, J.L., Inasek, R., & Alfredson, R. (1999). Speech volume regulation in
Parkinson's disease: effects of implicit cues and explicit instructions. Neuropsychologia,
37(13), 1453-1460.
Holube, I., Fredelake, S., Vlaming, M., & Kollmeier, B. (2010). Development and analysis of an
International Speech Test Signal (ISTS). Int J Audiol, 49(12), 891-903.
Hormann, H., Lazarus-Mainka, G., Schubeius, M., & Lazarus, H. (1984). The effect of noise and
the wearing of ear protectors on verbal communication. Noise Control Eng J, 23(2), 69-
77.
House, A.S., Williams, C.E., Hecker, M.H.L., & Kryter, K.D. (1965). Articulation testing
methods: Consonantal differentiation with a closed-response set. J Acoust Soc Am, 37(1),
158-166.
Howell, K., & Martin, A.M. (1975). An investigation of the effects of hearing protectors on
vocal communication in noise. Journal of Sound and Vibration, 41(2), 181-196.
Howell, P. (1990). Changes in voice level caused by several forms of altered feedback in fluent
speakers and stutterers. Lang Speech, 33(4), 325-338.
Huber, J.E., Chandrasekaran, B., & Wolstencroft, J.J. (2005). Changes to respiratory
mechanisms during speech as a result of different cues to increase loudness. J Appl
Physiol, 98(6), 2177-2184.
Huber, J.E. (2007). Effect of cues to increase sound pressure level on respiratory kinematic
patterns during connected speech. J Speech Lang Hear Res, 50(3), 621-634.
Institute of Electrical and Electronics Engineers (1969). IEEE recommended practice for speech
quality measurements. IEEE Transactions on Audio and Electroacoustics, 17(3), 225-
246.
Johnson, D.L., & Nixon, C.W. (1974). Simplified methods for estimating hearing protector
performance. Sound and Vibration, 8(6), 20-27.
Joseph, A., Punch, J., Stephenson, M., Wolfe, E., Paneth, N., & Murphy, W. (2007). The effects
of training format on earplug performance. Intl J Audiol, 46(10), 609-618.
139
Junqua, J.C. (1993). The Lombard reflex and its role on human listeners and automatic speech
recognizers. J Acoust Soc Am, 93(1), 510-524.
Kain, A., Amano-Kusumoto, A., Hosom, J.P. (2008). Hybridizing conversational and clear
speech to determine the degree of contribution of acoustic features to intelligibility. J
Acoust Soc Am, 124(4), 2308-2319.
Kalikow, D.N., Stevens, K.N., & Elliott, L.L. (1977). Development of a test of speech
intelligibility in noise using sentence materials with controlled word predictability. J
Acoust Soc Am, 61(5), 1337-1351.
Killion, M.C., Niquette, P.A., Gudmundsen, G.I., Revit, L.J., & Banjerjee, S. (2004).
Development of a quick speech-in-noise test for measuring signal-to-noise ratio loss in
normal-hearing and hearing-impaired listeners. J Acoust Soc Am, 116(4 Pt. 1), 2395-
2405.
Killion, M.C., & Villchur, E. (1993). Kessler was right-partly: But SIN test shows some aids
improve hearing in noise. The Hearing Journal, 46(9), 31-35.
Killion, M.C., Wilber, L.A., & Gudmundsen, G.I. (1988). Zwislocki was right…A potential
solution to the “hollow voice” problem (the amplified occlusion effect) with deeply
sealed earmolds. Hearing Instruments, 39(1), 14-18.
Kitzing, P. (1986). LTAS criteria pertinent to the measurement of voice quality. Journal of
Phonetics, 14, 477-482.
Kjukaanniemi, H., & Sorri, M. (1988). Speech intelligibility in difficult signal/noise
circumstances. Scand Audiol, Suppl. 30, 215-218.
Klockhoff, I. (1961). Middle ear muscle reflexes in man. A clinical and experimental study with
special reference to diagnostic problems in hearing impairment. Acta Oto-Laryngologica
Supplementum, 53(s164), 5-92.
Krause, J.C., & Braida, L.D. (2004). Acoustic properties of naturally produced clear speech at
normal speaking rates. J Acoust Soc Am, 115(1), 362-378.
Kreul, E.J., Nixon, J.C., Kryter, K.D., Bell, D.W., Lang, J.S., & Schubert, E.D. (1968). A
proposed clinical test of speech discrimination. J Speech Hear Res, 11, 536-552.
Kryter, K.D. (1946). Effects of ear protective devices on the intelligibility of speech in noise. J
Acoust Soc Am, 18, 413-417.
Lane, H.L., Catania, A.C., & Stevens, S.S. (1961). Voice Level: Autophonic scale, perceived
loudness, and effects of sidetone. J Acoust Soc Am, 33(2), 160-167.
Lane, H., & Tranel, B. (1971). The Lombard sign and the role of hearing in speech. J Speech
Hear Res, 14, 677-709.
140
Lehiste, I., & Peterson, G.E. (1959). Linguistic considerations in the study of speech
intelligibility. J Acoust Soc Am, 31(3), 280-286.
Letowski, T., Frank, T., & Caravella, J. (1993). Acoustical properties of speech produced in
noise presented through supra-aural earphones. Ear Hear, 14(5), 332-338.
Liberman, M.C., & Guinan, J.J. (1998). Feedback control of the auditory periphery: Anti-
masking effects of middle ear muscles vs. olivocochlear efferents. Journal of
Communication Disorders, 31, 471-483.
Lindblom, B. (1990). Explaining phonetic variation: A sketch of the H & H theory. In W.J.
Hardcastle & A. Marchal (Eds.), Speech production and speech modeling (pp. 403-439).
Dordrecht, Netherlands: Kluwer Academic Publishers.
Lindeman, H.E. (1976). Speech intelligibility and the use of hearing protectors. Audiology,
15(4), 348-356.
Linville, S.E. (2002). Source characteristics of aged voice assessed from long-term average
spectra. J Voice, 16(4), 472-479.
Liu, S., & Zeng, F.G. (2006). Temporal properties in clear speech perception. J Acoust Soc Am,
120(1), 424-432.
Lofqvist, A., & Mandersson, B. (1987). Long-time average spectrum of speech and voice
analysis. Folia Phoniatr (Basel), 39(5), 221-229.
Loren, C.A., Colcord, R.D., & Rastatter, M.P. (1986). Effects of auditory masking by white
noise on variability of fundamental frequency during highly similar productions of
spontaneous speech. Percept Mot Skills, 63(3), 1203-1206.
Mackersie, C., Neuman, A.C., & Levitt, H. (1999a). A comparison of response time and word
recognition measures using a word-monitoring and closed-set identification task. Ear
Hear, 20(2), 140-148.
Mackersie, C., Neuman, A.C., & Levitt, H. (1999b). Response time and word recognition using a
Modified-Rhyme monitoring task: list equivalency and time-order effects. Ear Hear,
20(6), 515-520.
Mackersie, C.L., Boothroyd, A., & Minniear, D. (2001). Evaluation of the computer-assisted
speech perception assessment test (CASPA). J Am Acad Audiol, 12(8), 390-396.
Martin, A.M., Howell, K., & Lower, M.C. (1976). Hearing protection and communication in
noise. In Disorders of Auditory Function II, edited by SDG Stephens, Academic Press,
London.
Maurer, D., & Landis, T. (1990). Role of bone conduction in the self-perception of speech. Folia
Phoniatrica, 42, 226-229.

141
McArdle, R.A., Wilson, R.H., & Burks, C.A. (2005). Speech recognition in multitalker babble
using digits, words, and sentences. J Am Acad Audiol, 16(9), 726-739.
McColl, D. & McCaffrey, P. (2006). Perception of spasmodic dysphonia speech in background
noise. Percept Motor Skills, 103, 629-635.
McGurk, H. & MacDonald, J.D. (1976). Hearing lips and seeing voices. Nature, 264(5588),
746–748.
Mendoza, E., Valencia, N., Munoz, J., & Trujillo, H. (1996). Differences in voice quality
between men and women: use of the long-term average spectrum (LTAS). J Voice, 10(1),
59-66.
Miller, G.A., Heise, G.A., & Lichten, W. (1951). The intelligibility of speech as a function of the
context of the test materials. J Exp Psychol, 41(5), 329-335.
Miller, L.M. & D’Esposito, M. (2005). Perceptual fusion and stimulus coincidence in the cross-
modal integration of speech. J Neurosci, 25(25), 5884-5893.
Mukerji, S. & Lee, D.J. (2010). De visione, voce et auditu: the contribution of Hieronymous
Fabricius to our understanding of tensor tympani function. Otol Neurotol, 31(3), 536-543.
Murphy, W.J., Stephenson, M.R., Byrne, D.C., Witt, B., & Duran, J. (2011). Effects of training
on hearing protector attenuation, Noise and Health, 13(51), 132-141.
Musch, H., & Buus, S. (2001a). Using statistical decision theory to predict speech intelligibility.
I. Model structure. J Acoust Soc Am, 109(6), 2896-2909.
Musch, H., & Buus, S. (2001b). Using statistical decision theory to predict speech intelligibility.
II. Measurement and prediction of consonant-discrimination performance. J Acoust Soc
Am, 109(6), 2910-2920.
Musch, H., & Buus, S. (2004). Using statistical decision theory to predict speech intelligibility.
III. Effect of audibility on speech recognition sensitivity. J Acoust Soc Am, 116(4 Pt. 1),
2223-2233.
Navarro, R. (1996). Effects of ear canal occlusion and masking on the perception of voice.
Perceptual and Motor Skills, 82(1), 199-208.
Neergaard, E.B., Andersen, H.C., Hansen, C.C., & Jepsen, O. (1964). Experimental studies on
sound transmission in the human ear. III influence of the stapedius and tensor tympani
muscles. Acta Oto-Laryngologica, 57, 280-286.
Newby, H.A. (1979). Audiology, 4th
edition, Prentice-Hall, Inc., Engelwood Cliffs, NJ, p. 251.
Nilsson, M., Soli, S.D., & Sullivan, J.A. (1994). Development of the Hearing in Noise Test for
the measurement of speech reception thresholds in quiet and in noise. J Acoust Soc Am,
95(2), 1085-1099.

142
National Institute for Occupational Safety and Health (1994). The NIOSH compendium of
hearing protection devices. DHHS (NIOSH) Publication No.95-105, US Department of
Health and Human Services, Cincinnati, OH.
National Institute for Occupational Safety and Health (1998). Criteria for a recommended
standard: Occupational noise exposure. DHHS (NIOSH) Publication No.98-126, US
Department of Health and Human Services, Cincinnati, OH.
Nixon, C.W., & Berger, E.H. (1991). Hearing protection devices. In Handbook of Acoustical
Measurements and Noise Control, 3rd
edition, edited by C.M. Harris, McGraw-Hill, New
York, pp. 21.1-21.24.
Olsen, W.O. (1998). Average Speech Levels and Spectra in Various Speaking/Listening
Conditions: A Summary of the Pearson, Bennett, & Fidell (1977) Report. Am J Audiol, 7,
21-25.
Olsen, W.O., Hawkins, D.B, & Van Tasell, D.J. (1987). Representations of the long-term spectra
of speech. Ear Hear, 8(5 Suppl), 100S-108S.
Occupational Safety and Health Administration (1983). Occupational noise exposure: Hearing
conservation amendment; Final rule. Occupational Safety and Health Administration, 29
CFR 1910.95, 48 Federal Register, 9738-9785.
Patel, R., & Schell, K.W. (2008). The influence of linguistic content on the Lombard effect. J
Speech Lang Hear Res, 51(1), 209-220.
Pekkarinen, J.O., Starck, J.P., & Ylikoski, J.S. (1992). Hearing protection against high-level
shooting impulses in relation to hearing damage risk criteria. J Acoust Soc Am, 91(1),
196-202.
Pekkarinen, E., Viljanen, V., Salmivalli, A., & Suonpaa, J. (1990). Speech recognition in a noisy
and reverberant environment with and without earmuffs. Audiology, 29, 286-293.
Pelegrin-Garcia, D. (2011). Comment on “Increase in voice level and speaker comfort in lecture
rooms. J Acoust Soc Am, 129, 1161-1164.
Pelegrin-Garcia, D., Fuentes-Mendizabal, O., Brunskog, J, & Jeong, C.H. (2011). Equal
autophonic level curves under different room acoustics conditions. J Acoust Soc Am,
130(1), 228–238.
Peterson, G.E., & Lehiste, I. (1962). Revised CNC lists for auditory tests. J Speech Hear Disord,
27, 62-70.
Phillips, D.P., Stuart, A., Carpenter, M. (2002). Re-examination of the role of the human acoustic
stapedius reflex. J Acoust Soc Am, 111(5 Pt 1), 2200–2207.
143
Picheny, M.A., Durlach, N.I., & Braida, L.D. (1985). Speaking clearly for the hard of hearing I:
Intelligibility differences between clear and conversational speech. J Speech Hear Res,
28(1), 96-103.
Picheny, M.A., Durlach, N.I., & Braida, L.D. (1986). Speaking clearly for the hard of hearing II:
Acoustic characteristics of clear and conversational speech. J Speech Hear Res, 29(4),
434-446.
Pick, H.L., Siegel, G.M., Fox, P.W., Garber, S.R., & Kearney, J.K. (1989). Inhibiting the
Lombard effect. J Acoust Soc Am, 85(2), 894-900.
Pickett, J.M. (1956). Effects of vocal force on the intelligibility of speech sounds. J Acoust Soc
Am, 28(5), 902-905.
Pittman, A.L., & Wiley, T.L. (2001). Recognition of speech produced in noise. J Speech Lang
Hear Res, 44, 487-496.
Pittman, A.L., Stelmachowicz, P.G., Lewis, D.E., & Hoover, B.M. (2003). Spectral
characteristics of speech at the ear: Implications for amplification in children. J Speech
Lang Hear Res, 46, 649-657.
Plyler, P.N., & Klumpp, M.L (2003). Communication in noise with acoustic and electronic
hearing protection devices. J Am Acad Audiol, 14(5), 260-268.
Pollack, I (1957). Speech communications at high noise levels: The roles of a noise-operated
automatic gain control system and hearing protection. J Acoust Soc Am, 29(12), 1324-
1327.
Pollack, I., & Pickett, J.M. (1958). Masking of speech by noise at high sound levels. J Acoust
Soc Am, 30(2), 127-130.
Pörschmann, C. (2000). Influences of bone conduction and air conduction on the sound of one’s
own voice. Acta Acust, 86, 1038-1045.
Ramig, L.O., Countryman, S., Thompson, L.L., & Horii, Y. (1995). Comparison of two forms of
intensive speech treatment for Parkinson disease. J Speech Hear Res, 38, 1232-1251.
Rao, M.D., & Letowski, T. (2006). Callsign Acquisition Test (CAT): Speech intelligibility in
noise. Ear Hear, 27(2), 120-128.
Reeves, E.R. (1998). Development of a speech intelligibility based method of hearing protector
selection, Ph.D. dissertation, The Pennsylvania State University.
Reinfeldt, S., Ostli, P., Hakansson, B., & Stenfelt, S. (2010). Hearing one’s own voice during
phoneme vocalization—Transmission by air and bone conduction. J Acoust Soc Am,
128(2), 751-762.

144
Rhebergen, K.S., Versfeld, N.J., & Dreschler, W.A. (2006). Extended speech intelligibility index
for the prediction of the speech reception threshold in fluctuating noise. J Acoust Soc Am,
120(6), 3988-3997.
Rhebergen, K.S., Versfeld, N.J., & Dreschler, W.A. (2008). Prediction of the intelligibility for
speech in real-life background noises for subjects with normal hearing. Ear Hear, 29(2),
169-175.
Rink, T.L. (1979). Hearing protection and speech discrimination in hearing-impaired persons.
Sound and Vibration, January 1979, 22-25.
Rivers, C., & Rastatter, M.P. (1985). The effects of multitalker and masker noise on fundamental
frequency variability during spontaneous speech for children and adults. J Aud Res,
25(1), 37-45.
Ross, L.A., Saint-Amour, D., Leavitt, V.M., Javitt, D.C., & Foxe, J.J. (2007). Do you see what I
am saying? Exploring visual enhancement of speech comprehension in noisy
environments. Cereb Cortex, 17(5), 1147-1153.
Sapir, S., Spielman, J.L., Ramig, L.O., Story, B.H., & Fox, C. (2007). Effects of intensive voice
treatment (the Lee Silverman Voice Treatment [LSVT]) on vowel articulation in
dysarthric individuals with idiopathic Parkinson disease: acoustic and perceptual
findings. J Speech Lang Hear Res, 50, 899–912.
Sataloff, J. (1966). Hearing Loss. Philadelphia, PA: J.B. Lippincott Company, p 26.
Shaw, E.A.G. (1982). Hearing protector design concepts and performance limitations. In
Personal hearing protection in industry, P.W. Alberti, ed. New York: Raven Press, 51-
68.
Shearer, W.M. (1978). Self-masking effects from live and recorded vowels. J Aud Res, 18, 213-
219.
Shearer, W.M., & Simmons, F.B. (1965). Middle ear activity during speech in normal speakers
and stutterers. J Speech Hear Res, 25, 203–207.
Shuster, L.I., & Durrant, J.D. (2003). Toward a better understanding of self-produced speech. J
Comm Dis, 36, 1–11.
Sodersten, M., Ternstrom, S., & Bohman, M. (2005). Loud speech in realistic environmental
noise: phonetogram data, perceptual voice quality, subjective ratings, and gender
differences in healthy speakers. Journal of Voice, 19(1), 29-46.
Stach, B.A., Jerger, J.F., & Jenkins, H.A. (1984). The human acoustic tensor tympani reflex. A
case report. Scandinavian Audiology, 13, 93-99.

145
Stelmachowicz, P.G., Mace, A.L., Kopun, J.G., & Carney, E. (1993). Long-term and short-term
characteristics of speech: implications for hearing aid selection for young children. J
Speech Hear Res, 36(3), 609-620.
Stenfelt, S. & Reinfeldt, S., (2007). A model of the occlusion effect with bone-conducted
stimulation. Int J Audiol, 46, 595-608.
Stephenson, M.R. (2009). Hearing protection in the 21st century: They’re not your father’s
earplugs anymore. Seminars in Hearing, 30(1), 56-64.
Stephenson, M.R., Shaw, P.B., Stephenson, C.M., & Graydon, P.S. (2011). Hearing loss
prevention for carpenters, Part II - Demonstration projects using individualized and group
training. Noise and Health, 13(51), 122-131.
Stone, M.A., & Moore, B.C. (2002). Tolerable hearing aid delays. II. Estimation of limits
imposed during speech production. Ear Hear, 23(4), 325-338.
Studebaker G.A., Sherbecoe, R.L., McDaniel, D.M., & Gwaltney, C.A. (1999). Monosyllabic
word recognition at higher-than-normal speech and noise levels. J Acoust Soc Am,
105(4), 2431-2444.
Sugimori, E., Tomohisa, A., & Tanno, Y. (2013). The potential link between sense of agency and
output monitoring over speech. Consciousness and Cognition, 22(1), 360-374.
Sumby, W.H., & Pollack, I. (1954). Visual contribution to speech intelligibility in noise. J
Acoust Soc Am, 26(2), 212–215.
Summers, W.V., Pisoni, D.B., Bernacki, R.H., Pedlow, R.I., & Stokes, M.A. (1988). Effects of
noise on speech production: acoustic and perceptual analyses. J Acoust Soc Am, 84(3),
917-928.
Svensson, E.B., Morata, T.C., Nylén, P., Krieg, E.F., & Johnson, A.C. (2004). Beliefs and
attitudes among Swedish workers regarding the risk of hearing loss. Int J Audiol, 43(10),
585-593.
Sweetow, R., & Palmer, C.V. (2005). Efficacy of individual auditory training in adults: a
systematic review of the evidence. J Am Acad Audiol, 16(7), 494-504.
Tak, S., Davis, R., & Calvert, G. (2009). Exposure to hazardous workplace noise and use of
hearing protection devices among US workers – NHANES, 1999-2004. Am J Ind Med,
52(5), 358-371.
Tartter, V.C., Gomes, H., & Litwin, E. (1993). Some acoustic effects of listening to noise on
speech production. J Acoust Soc Am, 94(4), 2437-2440.
Ternstrom, S., Bohman, M., & Sodersten, M. (2006). Loud speech over noise: Some spectral
attributes, with gender differences. J Acoust Soc Am, 119(3), 1648-1665.
146
Thornton, A.R. & Raffin, M.J.M. (1978). Speech-discrimination scores modeled as a binomial
variable. J Speech Hear Res, 21(3), 507-518.
Tillman, T.W. & Carhart, R. (1966). An expanded test for speech discrimination utilizing CNC
monosyllabic words. Northwestern University Auditory Test No. 6. Technical Report No.
SAM-TR-66-55, USAF School of Aerospace Medicine, Brooks Air Force Base, Texas.
Tonndorf, J. (1972). Bone conduction. In Foundations of modern auditory theory, Vol. 2, J.V.
Tobias, ed. New York: Academic Press, 197-237.
Tufts, J.B. & Frank, T. (2003). Speech production in noise with and without hearing protection. J
Acoust Soc Am, 114(2), 1069-1080.
Verdolini, K. & Ramig, L.O. (2001). Review: occupational risks for voice problems. Logopedics,
Phoniatrics, Vocology, 26(1), 37-46.
Voiers, W.D. (1977). Diagnostic evaluation of speech intelligibility. In Speech Intelligibility and
Speaker Recognition, M.E. Hawley, ed. Stroudsburg, PA: Dowden, Hutchinson, and
Ross, 374-387.
Voiers, W.D. (1983). Evaluating processed speech using the diagnostic rhyme test. Speech
Technology, January/February, 30-39.
Walden, B.E., Schwartz, D.M., Williams, D.L., Holum-Hardegen, L.L., & Crowley, J.M. (1983).
Test of the assumptions underlying comparative hearing aid evaluations. J Speech Hear
Disord, 48(3), 264-273.
Watson, N.A. & Gales, R.S. (1943). Bone-conduction threshold measurements: Effects of
occlusion, enclosures, and masking devices. J Acoust Soc Am, 14(4), 207-215.
Wendler, J., Doherty, E.T., & Hollien, H. (1980). Voice classification by means of long-term
speech spectra. Folia Phoniatr (Basel), 32(1), 51-60.
Williams, W., Seeto, M., & Dillon, H. (2012) The mechanical properties of earmuffs, Noise
Control Eng J, 60(1), 29-35.
Wilson, R.H. (2003). Development of a speech-in-multitalker-babble paradigm to assess word-
recognition performance. J Am Acad Audiol, 14(9), 453-470.
Wilson, R.H., & McArdle, R. (2007). Intra- and inter-session test, retest reliability of the Words-
in-Noise (WIN) test, J Am Acad Audiol, 18(10), 813-825.
Wilson, R.H., McArdle, R.A., & Smith, S.L. (2007). An evaluation of the BKB-SIN, HINT,
QuickSIN, and WIN materials on listeners with normal hearing and listeners with hearing
loss. J Speech Lang Hear Res, 50(4), 844-856.
Winkworth, A.L., & Davis, P.J. (1997). Speech breathing and the Lombard effect. J Speech Lang
Hear Res, 40, 159-169.

147
Yorkston, K., Hakel, M., Beukelman, D., & Fager, S. (2007). Evidence for effectiveness of
treatment of loudness, rate, or prosody in dysarthria: a systematic review. J Med Speech
Lang Pathol, 15, xi–xxxvi.
Zemlin, W.R. (1981). Speech and Hearing Science: Anatomy and Physiology. Englewood Cliffs,
NJ: Prentice-Hall, Inc.
Zera, J., & Mlynski, R. (2007). Attenuation of high-level impulses by earmuffs. J Acoust Soc
Am, 122(4), 2082-2096.
Zwislocki, J. (1953). Acoustic attenuation between the ears. J Acoust Soc Am, 25(4), 752-759.
Zwislocki, J. (1957). In search of the bone-conduction threshold in a free sound field. J Acoust
Soc Am, 29(7), 795-804.