Embed Size (px)
Citation preview
33
Influence of Motivation on Employee Job Satisfaction within
the Telecommunication Industry in Kenya (A Case of Airtel
Head Office in Nairobi County)
1Maureen K. KEBASO & Dr. Esther KANYUA
2
1M.Sc Scholar (Human Resource Management), Jomo Kenyatta University of Agriculture and
Technology, Kenya 2Lecturer, Jomo Kenyatta University of Agriculture and Technology, Kenya
ABSTRACT
One of the main aspects of Human Resource Management is the measurement of employee satisfaction.
Organizations have to make sure that employee satisfaction is high among the workers, which is a
precondition for increasing productivity, responsiveness, quality, and customer service. Job satisfaction is
the employee attitude that is most often related to organizational outcomes and so organizations only have
so much control over a person‟s job satisfaction as it overflows in personal life satisfaction. This study
was exploring the role motivation in influencing employee job satisfaction within the telecommunication
industry in Kenya with reference to Airtel Kenya Limited. The specific objectives were rewards,
leadership style, work environment and career development. All the variables were anchored on theories.
The research design used quantitative and qualitative techniques. The target population for this study was
250 employees who are at Airtel head office in Nairobi County. The study used a census survey. Multiple
regressions and inferential descriptive statistics were used in this study. The study collected both primary
and secondary data with the help of a questionnaire which had both structured and semi-structured
questions. Descriptive analysis was used; this included the use of weighted means, standard deviations
and percentages. The data tabulated data was analyzed using regression and SPSS version 23.The data
was then coded to enable the responses to be grouped into various categories. Descriptive statistics was
used to summarize data. The study found out that motivation had a positive influence on employee job
satisfaction in the telecommunication industry. Reward, leadership style, work environment and career
development were all established to have a positive effect on employee job satisfaction.
Keywords: Job satisfaction, motivation, productivity, employee
INTRODUCTION
Motivation is a psychological feature that arouses an organism to act towards a desired goal and elicits,
controls, and sustains certain goal-directed behaviors. It can be considered as a driving force that compels
or reinforces an action toward a desired goal. It is an inner drive such as wishes desires and goals that
make an individual to move in a certain direction in behavior or act in a certain manner. These desires are
what drive our everyday actions and make us who we are that is what makes individuals unique is the
combination and ranking of these desires (Capelli, 2010).
Motivation is divided into two (intrinsic and extrinsic). Intrinsic emanates from inside and occurs when
people are internally motivated to do something because it either brings them pleasure, they think it is
important, or they feel that what they are learning is significant while extrinsic motivation is caused by
the environment or the surroundings and comes into play when someone is compelled to do something or
International Journal of Innovative Development & Policy Studies 4(3):33-52, July-Sept., 2016
© SEAHI PUBLICATIONS, 2016 www.seahipaj.org ISSN: 2354-2926
34
act in a certain way because of factors external to him or her like money or promotion (Freyermuth,
2012).
Motivated employees are more likely to be satisfied with their job and they exhibit pleasurable behavior,
produce high quality goods and services and are always yearning to carry out tasks and duties assigned to
them. They are on the lookout for new opportunities and new challenges and as they do so, they bring
new ideas which promote company growth, expansion and high productivity (Hoot, 2012).Use of rewards
may either encourage or diminish motivation, depending on the type of rewards and the context in which
they are given. Employers should attempt to give employees more autonomy or control over their own
performance by allowing them to make choices (Owolabi & Makinde, 2012).
Workers in any organization need something to keep them working. Most of the time it could be salary,
benefits they receive, working conditions, co- workers relationship or the job itself. According to Otido
(2011), an employee must be motivated to work for an organization. If an employee is not motivated, his
quality of work will be wanting or generally deteriorate or not be able to put up with the tasks and duties
assigned to him. If the employee lacks ability the manager can provide training or replace the worker, if
it‟s an environmental challenge, the manager can make some adjustments to enable the worker do his job
but if the employee lacks motivation, the management has a big task as they may not know exactly why
the employee is not motivated and what needs to be done for him to get motivated (Barney, 2011).
The most widely accepted definition of job satisfaction was presented by Mancini (2011), who defined
job satisfaction as “a pleasurable or positive emotional state resulting from the appraisal of one‟s job or
job experiences”. Additionally, job satisfaction can be defined as the “extent to which a person derives
pleasure from a job” (Owolabi & Makinde, 2012). Or the difference between a desired outcome a person
receives and the desired outcome the person believes he or she ought to receive. Job satisfaction is a
function of satisfaction with different aspects of job, i.e. supervision, pay, works itself, work environment
co-workers, promotion, etc., and of the particular weight or importance one attaches to these respective
components (Gummesson, 2010).
According to Maryan (2012), there are two types of job satisfaction that are based on the level of
employees' feelings regarding their jobs. The first, and most studied, is global job satisfaction, which
refers to employees' overall feelings about their jobs. The second is job facet satisfaction, which refers to
feelings about specific job aspects, such as salary, benefits, and the quality of relationships with one's
coworkers (Nandama, 2010).
Global perspective of Employee Job Satisfaction
In developed countries, employees are the backbone of an organization. Hence, the retention of the
employees is important in keeping the organization on track. In order to retain the best talents, strategies
aimed at satisfying employee‟s needs are implemented, regardless of global companies or small-sized
firms. According to Berkowitz (2011), it is vital for firms to apply the right marketing strategies in order
to succeed.
Traditionally, organizations have focused their marketing strategies of attracting new customers and
increasing their market share. However, due to improved business strategies, most industries and markets
are appropriate more and more competitive forcing significant changes in the way firms do business. In
order to retain employees in industries characterized by high competition, firms need to meet each
individual employee‟s needs and expectations. According to Maryan (2012), it is the value of the
employee experiences with the employer and work environment that is important, therefore, employee
needs are important to consider when structuring organizations.
Pananurak (2010) investigated the determinants of employee satisfaction by interviewing 400
telecommunication employees in Pakistan. Their study found that work environment, rewards,
development opportunities and leadership play the most important role in determining employee
satisfaction. In the same respect, Taylor (2014) examined commitment to companies, in The Netherlands,
using the psychological investment model. The study examined the employee-company relationships in
five sectors: the banking industry, health insurance, supermarkets, mobile telecom providers, and the
Kebaso & Kanyua …..Int. J. Innovative Development & Policy Studies 4(3):33-52, 2016
Ok
35
automotive industry. The study recruited 300 respondents for each sector. More than 50% of those
interviewed agreed that job satisfaction lead to ultimate employee commitment to an organization.
Wijesinghe, J & Foreman, J. (2011), examined customer loyalty in the telecommunication industry in
Pakistan, using 146 telecommunication company employees. The study found that employee loyalty is
shaped mainly by trust, work environment, ability to make decisions, and rewards. The results of this
study agree, partially, with a study by Boohene and Agyapong of 460 employees of Vodafone Telecom
Company in Austria. This study concluded that satisfaction does not necessarily lead to loyalty, while
employee satisfaction was found to be strongly and positively correlated with loyalty. However, it was
noticed from the findings of this study that employee satisfaction is already built into the quality of
treatment they got (Taylor, 2014).
Local perspective of Employee Job Satisfaction
The telecommunication industry in Kenya, just like the rest of the world, is going through profound
changes. In the past decade, technological advancement and regulatory restructuring have transformed the
industry. Markets that were formerly distinct, discrete and vertical have coalesced across their old
boundaries with a massive investment of capital, much of it originating from private sector participants.
The result is new markets, new players, and new challenges including staff restructuring which may cause
dissatisfaction as changes caused by market liberalization (Taylor, 2014).
Market liberalization efforts have also picked up ensuring the successful partial privatization of Telkom
Kenya Ltd (December 2007), divestment of GoK‟s 25% stake in Safaricom Ltd through a public listing
(May, 2008), and the launch of fourth mobile operator Econet Wireless Kenya (November 2009). This
has resulted into some of the world‟s best known telecommunication providers – Vodafone, Bharti
International/ Airtel, France Telecom, and Essar Communications through their investments in Safaricom
Limited, Telkom Kenya Limited and Econet Limited respectively - being major players in the Kenyan
market. Ongoing infrastructural developments by operators have largely been focused on network
expansion for increased nationwide coverage (Musyoka, 2011).
Bharti Airtel Limited is a leading global telecommunications company with operations in 19 countries
across Asia and Africa. The company offers mobile voice and data services, fixed line, and high speed
broadband services. Airtel has been ranked among the six best performing technology companies in the
world by business weekly. Airtel has 25 million+ customers across its operations and is the fifth largest
integrated telecom operator in the world. Airtel as a brand has played the role of a major catalyst in
reforms in every country it operates in and has been contributing to its economic resurgence (Taylor,
2014).
Today Airtel touches people's lives with its services by ushering in a new era of staying connected
offering a wider range of services to choose from. Airtel Kenya is the Kenyan operation, formerly Ken
cell/Celtel/Zain. The company was one of the leading mobile network operators in Kenya and one of the
fastest growing telecommunication companies in Africa. The study therefore analyzed factors influencing
employee satisfaction within the telecommunication sector in Kenya particularly at Airtel Kenya Limited.
Statement of the Problem
The problem of employee motivation for job satisfaction has been a pertinent issue in Airtel Kenya for
quite some time. Employees in Airtel no longer feel the sense of company loyalty that once existed and
the current level of job satisfaction at is quite low. Ali & Sharif (2012) noted that constant changes in
ownership and resultant management teams always comes with a myriad of new ways of doing things.
Most of these new strategies have not performed well in the market because the employees themselves do
not believe in them and were therefore not perform optimally to meet this goal. This has led to the dismal
performance of the company as a whole and that is why Safaricom still leads by a huge margin with close
to ten million subscribers and an 80% market share as compared Airtel‟s less than two million subscribers
and a less that 15% market share. Whereas these two companies were formed on the same year, therefore
the difference is success should not be too huge.
Kebaso & Kanyua …..Int. J. Innovative Development & Policy Studies 4(3):33-52, 2016
Ok
36
Owolabi & Makinde (2014), observed that the issue of employee satisfaction in leading mobile
subscribers in Kenya especially Airtel Kenya, may be affected by the level at which the company recruits
its employees and the way it manages its employee retention processes. They came up with strategies of
acquiring new and competent employees in order ensure quality performance. However no studies have
been done on Airtel Kenya to focus on motivation of employees for job satisfaction.
The available studies have only focused on other telecommunication sister companies at the expense of
Airtel Kenya. Furthermore, most of the studies have only focused on maximization of profit and growth.
This prompted a study to be done in this area of telecommunication in order to validate whether there is
any significance with the existing literature. Noteworthy was that the available studies were from outside
the county hence, the need to do a research in the Kenyan context and compare the finding with other
studies from other counties in Kenya.
Finally, this study has come up with the existing gap and the new knowledge under the area of study; it
therefore means the study has added new knowledge to the existing literature where policy makers,
academicians and Government agencies could use the generated best practices to make prudent decisions
in related field of telecommunication industry. This study therefore sought to explore what past scholars
have said on the influence of motivation on job satisfaction and test viability of best job satisfaction and
its long-run relationship to towards motivations of employees in Telecommunication companies. The
study sought to fill the existing gap after establishing the real cause of the problem of motivating
employees towards job satisfaction at Airtel headquarters in Nairobi City County in Kenya.
Objectives of the study
The general objective for this study is to establish the influence of motivation on employee job
satisfaction in the Telecommunication industry in Kenya. The specific objectives are:
1. To establish the extent to which rewards affect employee job satisfaction in the telecommunication
industry in Kenya.
2. To determine the effect of leadership style enhances on employee job satisfaction in the
telecommunication industry in Kenya.
3. To examine the effect of career development on employee job satisfaction in the telecommunication
industry in Kenya.
4. To establish the extent to which work environment influence employee job satisfaction in the
telecommunication industry Kenya.
Research Questions
1. How do rewards influence employee job satisfaction in the telecommunication industry in
Kenya?
2. How does leadership style influence employee job satisfaction in telecommunication industries
in Kenya?
3. What is the effect of work environment on employee job satisfaction in the Kenyan
telecommunication industry?
4. What is the influence of career development on employee job satisfaction in telecommunication
industries in Kenya?
LITERATURE REVIEW
Theoretical Review
Hertzberg’s Two Factor Theory
Hertzberg‟s two-factor theory is considered relevant in understanding how reward can influence
employee motivation through job satisfaction in Kenya and hence provides the theoretical background for
this study. According to Ewen (2014), the research conducted by Hertzberg determined what people
actually want from their jobs. The respondents had to describe work situations in which they felt good
(satisfied) or bad (dissatisfied) in their jobs. The feedback received was then categorized into satisfaction
or dissatisfaction. The characteristics related to job satisfaction included advancement, recognition, the
work itself, achievement, growth and responsibilities. Hertzberg referred to these characteristics as
Kebaso & Kanyua …..Int. J. Innovative Development & Policy Studies 4(3):33-52, 2016
Ok
37
„motivators‟. The characteristics related to dissatisfaction, which included working conditions,
supervision, interpersonal relationships, company policy and administration were referred to as „hygiene‟
factors (Mancini, 2011).
This theory relates to this study in that it advocates for the creation of a conducive environment that
enhances employee motivation. People are only truly motivated by enabling them to reach for and satisfy
the factors that Herzberg identified as real motivators, such as achievement, advancement, development,
etc., which represent a far deeper level of meaning and job satisfaction (Otido, 2011)
Equity theory
Equity theory is considered to be relevant in understanding how leadership style can influence employee
motivation through job satisfaction in Kenya and hence provides the theoretical background for this for
this study. According to Nyawira (2010), a person perceives fairness in regard to social relationships. The
theory presupposes that during a social exchange, a person identifies the amount of input gained from a
relationship compared to the output, as well as how much effort another person‟s puts forth. Based on
Adam (1965) theory, Yorobe et al.(2011) further suggest that if an employee thinks there is an inequity
between two social groups or individuals, the employee is likely to be distressed or dissatisfied because
the input and the output are not equal. Inputs encompass the quality and quantity of the employee‟s
contributions to his or her work. Examples of inputs include: time, effort, hard work, commitment, ability,
adaptability, flexibility, tolerance, determination, enthusiasm, personal sacrifice, trust in superiors,
support from co-workers and colleagues and skills. Output (outcomes) on the other hand is the positive
and negative consequences that an individual (employee) perceives a participant has incurred as a
consequence of his relationship with another. Examples of outputs include job security, esteem, salary,
employee benefits, expenses, recognition, reputation, responsibilities, and sense of achievement and
praise.
Maslow’s Hierarchy of Needs theory
Maslow‟s hierarchy of needs theory is considered to be relevant on understanding how leadership style
can influence employee motivation through job satisfaction in Kenya and hence provides the theoretical
background for this for this study. According to Harris (2011), the Maslow‟s Hierarchy of needs must be
one of the best known motivation theories in the world. Maslow is a good starting point to start examining
the different motivation theories. Maslow starts with the idea that people always tend to want something
and what they want depends on what they already have. Maslow proposed that there are five different
levels of needs people have to seek for satisfaction of their basic needs. The first or lowest level is
Physiological needs. Before these needs which include for example food, water, shelter and clothing are
fulfilled a person doesn‟t have any other needs. When people don‟t feel hunger, thirst or cold, their needs
go to a second level. The second lowest level is Security needs. In that level a person needs to feel secure
in his/her family and in a society, and feel protected against violence. The need for safety is manifested
with job security, savings and for insurances of health, mental health, old age and disability. Love and
belonging needs is the third level of Maslow‟s hierarchy. After feeling secure, people need to feel that
they receive and give love, they are appreciated and they have good friendships (Nyawira, 2010).
The fourth level is Esteem needs. It is the need to be unique with self-respect and to enjoy esteem from
other individuals. People want to evaluate themselves highly and based on their achievement receive
appreciation from other people. Lack of these needs may cause inferiority, helplessness and weakness.
Highest level of Maslow‟s hierarchy of needs is need of Self-actualization (Boyens, 2011).The
development of this need is based on the satisfaction at the other four lower levels. It refers to the need of
self-fulfillment and to the tendency to become actualized in what a person is potential. The core of this
theory lies in the fact that when one need is fulfilled, its strength diminishes and the strength of the next
level increases. Maslow does note that one level of needs doesn‟t have to be totally fulfilled before a
person moves to the next level. The individual can be partly satisfied with one level and still seek for
satisfaction at the next level (Otido, 2011).
Kebaso & Kanyua …..Int. J. Innovative Development & Policy Studies 4(3):33-52, 2016
Ok
38
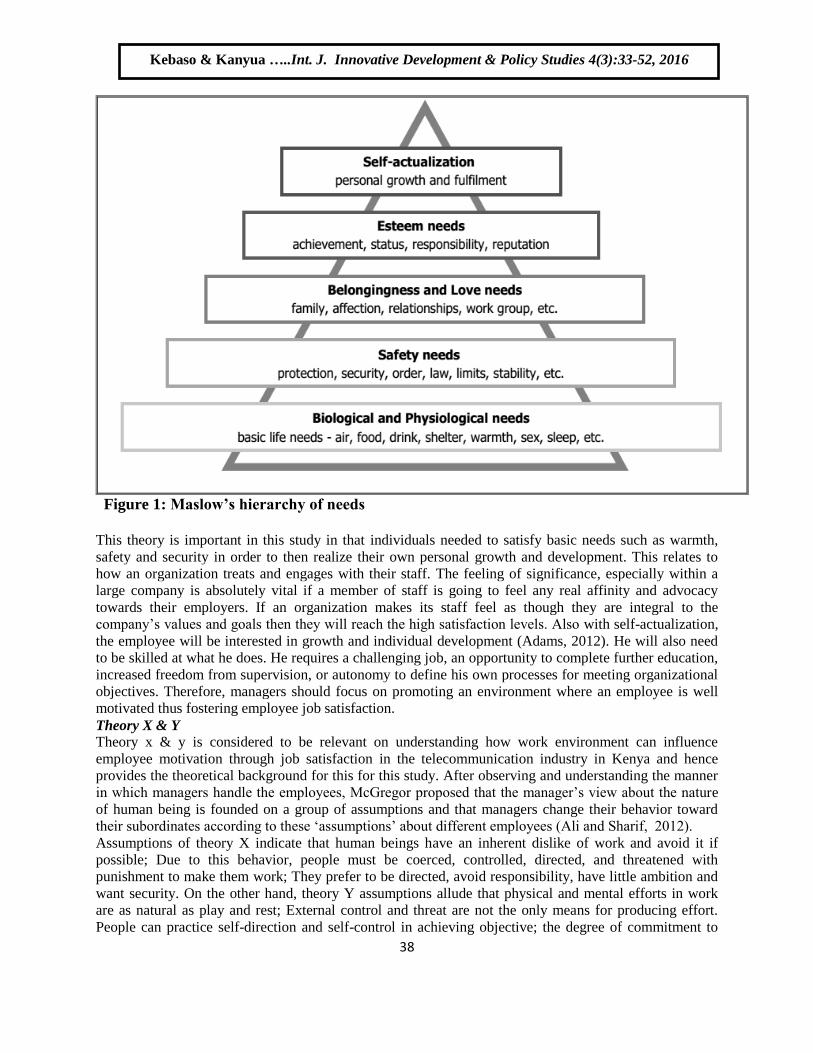
Figure 1: Maslow’s hierarchy of needs
This theory is important in this study in that individuals needed to satisfy basic needs such as warmth,
safety and security in order to then realize their own personal growth and development. This relates to
how an organization treats and engages with their staff. The feeling of significance, especially within a
large company is absolutely vital if a member of staff is going to feel any real affinity and advocacy
towards their employers. If an organization makes its staff feel as though they are integral to the
company‟s values and goals then they will reach the high satisfaction levels. Also with self-actualization,
the employee will be interested in growth and individual development (Adams, 2012). He will also need
to be skilled at what he does. He requires a challenging job, an opportunity to complete further education,
increased freedom from supervision, or autonomy to define his own processes for meeting organizational
objectives. Therefore, managers should focus on promoting an environment where an employee is well
motivated thus fostering employee job satisfaction.
Theory X & Y
Theory x & y is considered to be relevant on understanding how work environment can influence
employee motivation through job satisfaction in the telecommunication industry in Kenya and hence
provides the theoretical background for this for this study. After observing and understanding the manner
in which managers handle the employees, McGregor proposed that the manager‟s view about the nature
of human being is founded on a group of assumptions and that managers change their behavior toward
their subordinates according to these „assumptions‟ about different employees (Ali and Sharif, 2012).
Assumptions of theory X indicate that human beings have an inherent dislike of work and avoid it if
possible; Due to this behavior, people must be coerced, controlled, directed, and threatened with
punishment to make them work; They prefer to be directed, avoid responsibility, have little ambition and
want security. On the other hand, theory Y assumptions allude that physical and mental efforts in work
are as natural as play and rest; External control and threat are not the only means for producing effort.
People can practice self-direction and self-control in achieving objective; the degree of commitment to
Kebaso & Kanyua …..Int. J. Innovative Development & Policy Studies 4(3):33-52, 2016
Ok
39
objectives is determined by the size of rewards attached with achievement; under proper conditions,
human beings learn and not only accept responsibility but also seek it (Owolabi & Makinde, 2012). This
theory is related to this study because it gives guidelines the style of leadership that should be adopted in
order to attain employee motivation which will eventually lead to employee job satisfaction. For example,
jobs that have a significant need for repetition, and don't necessarily require regularly having to figure out
new methods of work may need more Theory X input. The stereotypical assembly line would be an
example of this. For these types of jobs, there‟s a need to set quotas and have fairly strict guidelines with
little margin for error. On the other hand, jobs requiring creative, problem-solving skills such as research,
customer service, engineering or advertising work will thrive better under Theory Y managers.
Employees in these fields need more intellectual freedom and room to make their own decisions (Otido,
2011).
Human capital theory
Human capital theory is considered to be relevant on understanding how career development can
influence employee motivation through job satisfaction in the telecommunication industry in Kenya and
hence provides the theoretical background for this for this study. According to Bucker (2009), human
capital theory regards people as assets and stresses that investment by organizations in people will
generate worthwhile results. The Human Capital Theory states that investing in people adds their value in
the organization. Individuals expect a return on their own investment and a firm recognizes that the
increased value of their employees should be rewarded, the theory encourages the use of skill based or
competence related pay as method of reward. It also underpins the concept of individual market worth
which indicate that individuals have their own value in the market place which they acquire and increase
through investment by their employers and themselves in gaining extra expertise and competence through
training and development (Capelli, 2010).
This theory is linked to the study in that it advocates for employee training, development and rewards
which are variables in this study and considers them as key aspects in human resource to which employee
motivation is key. Training and development could be in the form of in-house training, on the job
training, offering scholarships to employees and reward the most active ones in the workplace. Training
and development as well as rewards improve the rate of employee motivation which further enhances
employee job satisfaction.
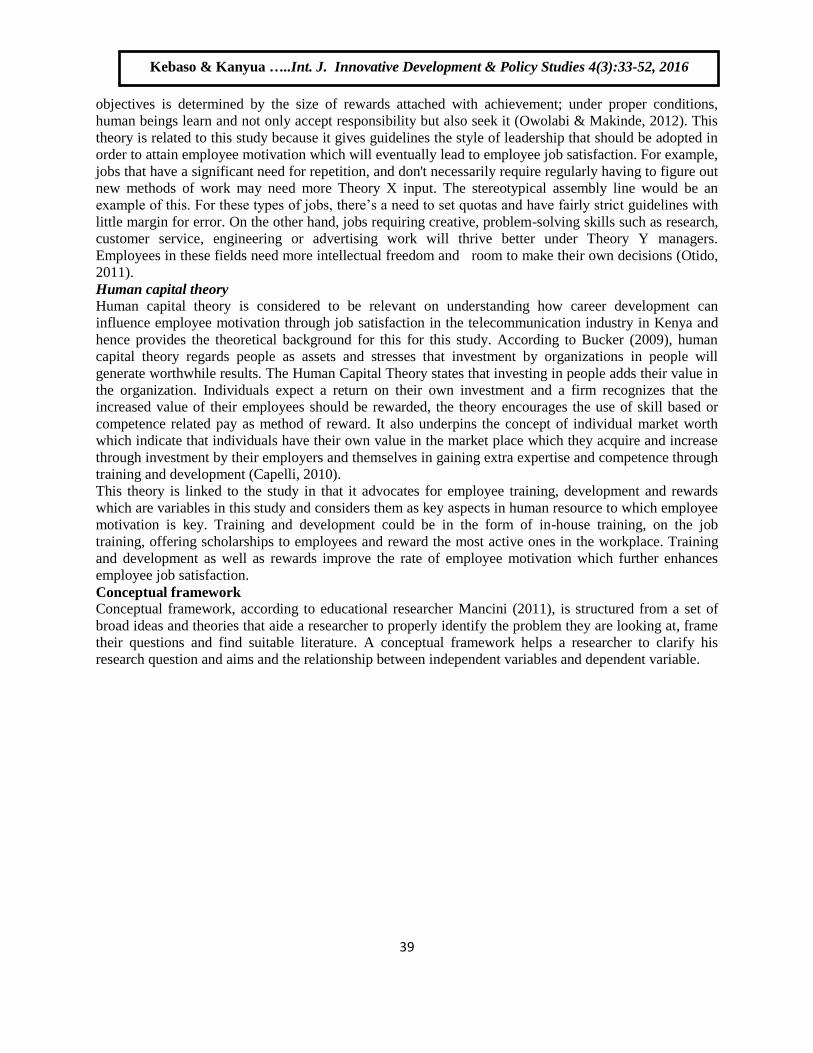
Conceptual framework
Conceptual framework, according to educational researcher Mancini (2011), is structured from a set of
broad ideas and theories that aide a researcher to properly identify the problem they are looking at, frame
their questions and find suitable literature. A conceptual framework helps a researcher to clarify his
research question and aims and the relationship between independent variables and dependent variable.
Kebaso & Kanyua …..Int. J. Innovative Development & Policy Studies 4(3):33-52, 2016
Ok
40
Independent variables Dependent variables
Figure 2: Conceptual framework
RESEARCH METHODOLOGY
Research Design
The study employed the census survey for the study. The method was adopted because it allowed the
collection of a large amount of data from a sizable population in an economical manner. Kothari (2011)
recommended this census survey because the method allowed the study to collect quantitative data which
can be analyzed quantitatively using inferential statistics and qualitatively using numerical data.
Target Population
Target population for this study comprised all the staffs working at Airtel headquarters in Nairobi City
County. This was the researcher‟s unit of analysis and observation. The target population for this study
was 250 employees of Airtel head office in Nairobi City County. A census survey to all employees was
used to capture our unit of analysis. This is called Purposive sampling where the entire population is
involved in the study. This is justifiable since it is 100% respondents and there is no worry whether any of
the respondents will be left out.
Sample and Sampling Techniques
Sampling frame is explained as a process or technique of sampling a suitable sample or representative of
population for the purpose of determining the characteristics of the whole population it purports to
represent (Cooper and Schindler, 2014).The sample frame covered Airtel Kenya head office. A census
survey study was carried out to all employees. This census was technically to pick all employees working
at Airtel Kenya. According to Nandama (2010), a population representation of at least 100% is good and
representative enough.
Data Collection Instruments
The primary data for this data was collected from Airtel Kenya using questionnaires and complimented
by desk research hence ensuring that detailed and relevant information on the subject of the study was
collected. The questionnaires consisted of a mixture of open ended and close ended questions. The study
used questionnaires because it is flexible and facilitates the capture of in-depth knowledge of the
respondent and promotes respondent cooperation.
Rewards
Financial
Non- financial
Leadership style
Autocratic
Participative
Laissez Faire.
Work Environment
Health and safety
Resources
Interpersonal relationships
Career Development
Training of Staff
Sponsoring
Seminars/workshop
Motivation of Employees for Job satisfaction
Types of Incentives
Firm performance
Kebaso & Kanyua …..Int. J. Innovative Development & Policy Studies 4(3):33-52, 2016
Ok
41
Data Collection Procedure
Data refers to all the information a researcher gathers for study Kothari (2011). There are two types of
data; primary and secondary data. According to Maryan (2012), the primary data are those collected for
the first time and thus happens to be original in character.
The primary data was collected through a census survey with the help of semi-structured questionnaire
and secondary data through document review mainly organizational reports and company magazines. The
questionnaire was developed based on the objectives of the study. The questionnaires were administered
by two research assistants who were well trained for this purpose. Items in the questionnaire were
measured using a five-point Likert Scale, with 1 representing “strongly disagree” and 5 representing
„strongly agree. The study targeted a sample size of 250 respondents from which 170 filled in and
returned the questionnaires making a response rate of 87.6% (170).
Pilot Study
The study carried out a pilot study to pretest and validate the questionnaire. Cronbach‟s alpha
methodology, which is based on internal consistency, was used. Cronbach‟s alpha measures the average
of measurable items and its correlation. Kothari (2011), agree that in any research, it is expedient as a
matter of validity and reliability to check that the instrument is pre-tested before the final administration.
The pilot study was to enable the study to assess weakness in design and instrumentation in order to
ensure the clarity of the questionnaire so that those items found to be unclear and misunderstood were
modified to improve the quality of the research instrument.
The researcher selected a pilot group of 15 individuals from the target population to test the reliability of
the research instrument. The pilot data was not included in actual study.
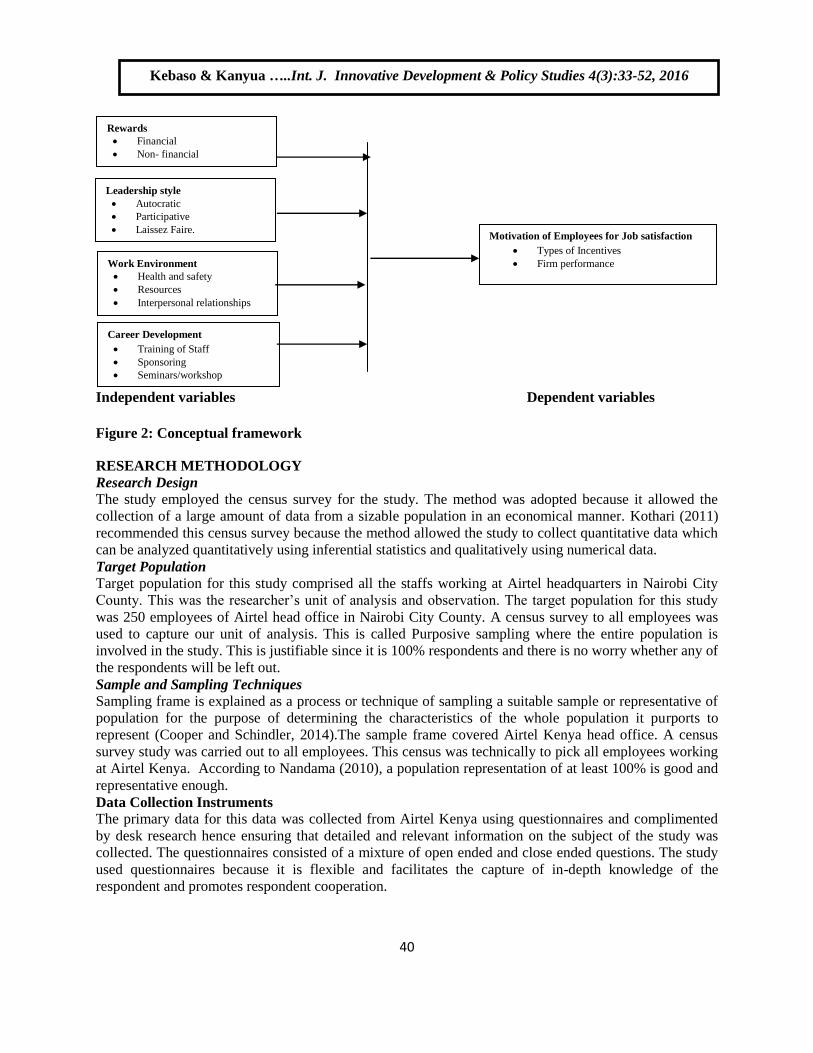
Reliability of the Research Instrument
Cronbach‟s Alpha was used as a measure of reliability and internal consistency. Cronbach‟s Alpha is a
reliability coefficient that indicates how well items in a set are positively correlated to one another. It
measures the inter correlations among test items, with a measure of 1 being higher in terms of internal
consistency and reliability of above 0.7 is acceptable (Mariyono, 2011). The following formula for
Cronbach‟s alpha will be used to measure the reliability and internal consistency.
Validity of the Research Instrument
According to Healy & Perry (2012), validity determines whether the research truly measures that which it
was intended to measure. It estimates how accurately the data obtained in the study represents a given
variable /construct in the study (Maryan, 2012). The questionnaires were given to other three research
experts who have knowledge of the subject under study for their opinion about the adequacy of the
instrument to ensure it covers all the variables being measured so as to achieve validity.
Kebaso & Kanyua …..Int. J. Innovative Development & Policy Studies 4(3):33-52, 2016
Ok
42
Data Analysis and Presentation
Qualitative data was edited, summarized and coded for easy classification in order to facilitate
interpretation of the data. The tabulated data was analyzed using regression and statistical Package for
Social Sciences version 23(SPSS). SPSS has descriptive statistic features that would assist in variable
response comparison and give clear indication of response frequencies. Descriptive statistics was used to
summarize the data. This included percentages and mean and standard deviations. Tables and other
graphical presentations were appropriately used to present the data that was collected for ease of
understanding and analysis. The study further adopted multiple regression models at 5% level of
significance to establish the strength and direction of the relationship between the independent variables
and the dependent variable (job satisfaction). The formula for multiple regressions was expressed as
follows: Y=β0+β1X1+β2X2+β3X3+β4X4+ε, Where;
Y= Motivation of Employee for job satisfaction,
β0=constant (coefficient of intercept),
X1=; Rewards;
X2= Leadership style
X3=Work Environment;
X4= Career development;
ε =error term; β1…
β4=regression coefficient of four variables.
An Analysis of Variance (ANOVA) was used to measure statistically the significance in predicting how
dependent variables influence employee motivation for job satisfaction. The test of significance was
correlation coefficient, the R square as a measure of significance. The coefficient is a standard measure
of an assumed linear relationship between variables. A coefficient of value between (+ve) 0.5 and (-ve)
0.5 or higher indicates a strong relationship and by extension a significant variable in influencing the
trend of the dependent variable.
Reliability Analysis
Cronbach (2003) noted that the more consistent and instrument is, the more reliable the measurement and
noted that the coefficient ranges from 0 to 1. This may be used to describe the reliability of factors
extracted from dichotomous (that is, questions with two possible answers) and /or multipoint formatted
questionnaires or scales. Cooper and Schindler, (2012) accept an alpha of 0.8 and above, while Mugenda
and Mugenda (2010) noted an alpha of 0.6 and below to be poor. The measurement scales for reliability
were tested using Cronbach‟s Alpha coefficient and for an alpha of 0.7 and above, the instrument was
interpreted as reliable(Cronbach,2003).
All the scales were found acceptable with all alpha levels above the 0.7 threshold. More specifically,
Reward measurement had the highest reliability (α=0.901) followed by Employees job satisfaction
(α=0.891) then work environment (α=0.870) while leadership style was (α=0.798) and then career
development (α=0.783) had the lowest respectively. The study found that the analysis was reliable and
could be used for further investigation.
RESULTS AND DISCUSSION
General Information
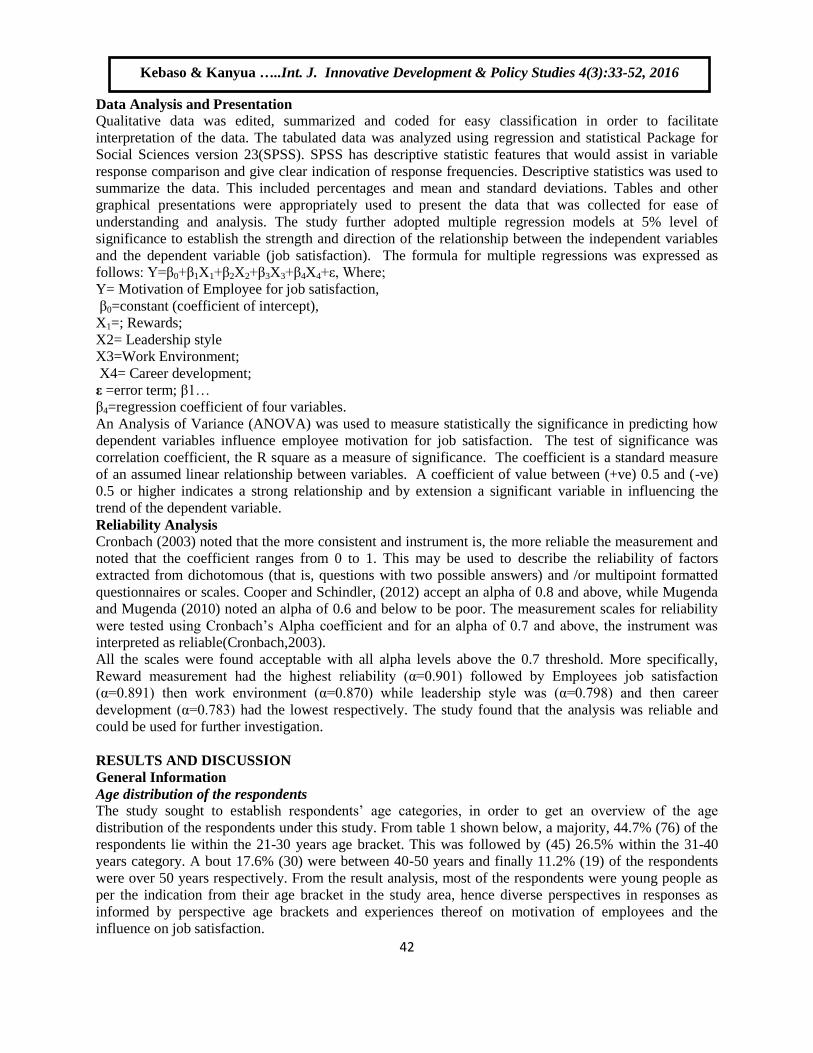
Age distribution of the respondents The study sought to establish respondents‟ age categories, in order to get an overview of the age
distribution of the respondents under this study. From table 1 shown below, a majority, 44.7% (76) of the
respondents lie within the 21-30 years age bracket. This was followed by (45) 26.5% within the 31-40
years category. A bout 17.6% (30) were between 40-50 years and finally 11.2% (19) of the respondents
were over 50 years respectively. From the result analysis, most of the respondents were young people as
per the indication from their age bracket in the study area, hence diverse perspectives in responses as
informed by perspective age brackets and experiences thereof on motivation of employees and the
influence on job satisfaction.
Kebaso & Kanyua …..Int. J. Innovative Development & Policy Studies 4(3):33-52, 2016
Ok
43
Table 1: Age bracket of the respondents
Year Frequency Percentage (%)
21-30 76 44.7
31-40 45 26.5
41-50 30 17.6
Over 50 19 11.2
Total 170 100
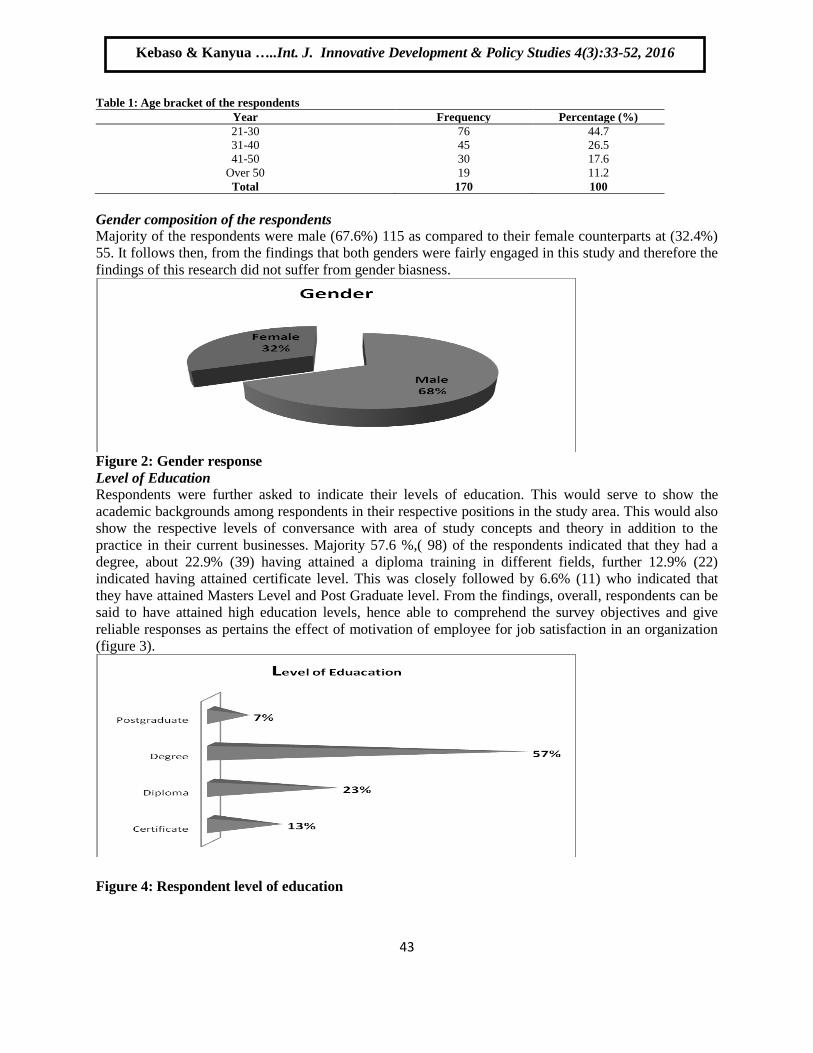
Gender composition of the respondents Majority of the respondents were male (67.6%) 115 as compared to their female counterparts at (32.4%)
55. It follows then, from the findings that both genders were fairly engaged in this study and therefore the
findings of this research did not suffer from gender biasness.
Figure 2: Gender response
Level of Education Respondents were further asked to indicate their levels of education. This would serve to show the
academic backgrounds among respondents in their respective positions in the study area. This would also
show the respective levels of conversance with area of study concepts and theory in addition to the
practice in their current businesses. Majority 57.6 %,( 98) of the respondents indicated that they had a
degree, about 22.9% (39) having attained a diploma training in different fields, further 12.9% (22)
indicated having attained certificate level. This was closely followed by 6.6% (11) who indicated that
they have attained Masters Level and Post Graduate level. From the findings, overall, respondents can be
said to have attained high education levels, hence able to comprehend the survey objectives and give
reliable responses as pertains the effect of motivation of employee for job satisfaction in an organization
(figure 3).
Figure 4: Respondent level of education
Kebaso & Kanyua …..Int. J. Innovative Development & Policy Studies 4(3):33-52, 2016
Ok
44
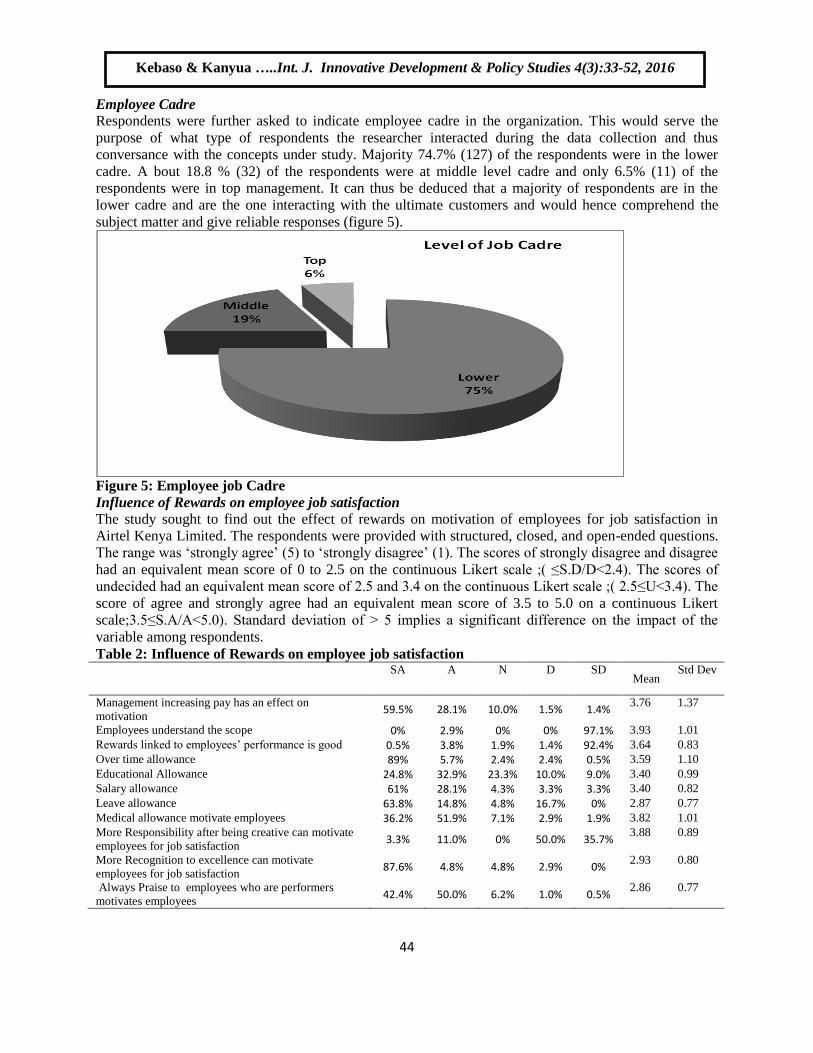
Employee Cadre Respondents were further asked to indicate employee cadre in the organization. This would serve the
purpose of what type of respondents the researcher interacted during the data collection and thus
conversance with the concepts under study. Majority 74.7% (127) of the respondents were in the lower
cadre. A bout 18.8 % (32) of the respondents were at middle level cadre and only 6.5% (11) of the
respondents were in top management. It can thus be deduced that a majority of respondents are in the
lower cadre and are the one interacting with the ultimate customers and would hence comprehend the
subject matter and give reliable responses (figure 5).
Figure 5: Employee job Cadre
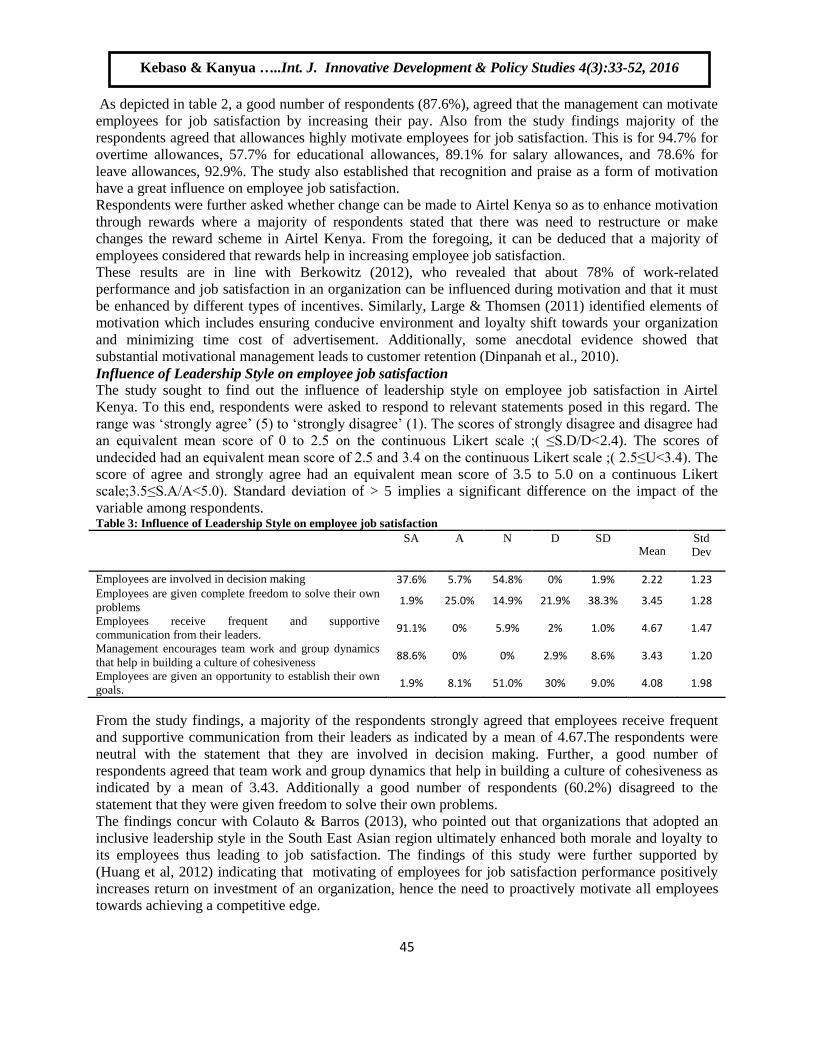
Influence of Rewards on employee job satisfaction
The study sought to find out the effect of rewards on motivation of employees for job satisfaction in
Airtel Kenya Limited. The respondents were provided with structured, closed, and open-ended questions.
The range was „strongly agree‟ (5) to „strongly disagree‟ (1). The scores of strongly disagree and disagree
had an equivalent mean score of 0 to 2.5 on the continuous Likert scale ;( ≤S.D/D<2.4). The scores of
undecided had an equivalent mean score of 2.5 and 3.4 on the continuous Likert scale ;( 2.5≤U<3.4). The
score of agree and strongly agree had an equivalent mean score of 3.5 to 5.0 on a continuous Likert
scale;3.5≤S.A/A<5.0). Standard deviation of > 5 implies a significant difference on the impact of the
variable among respondents.
Table 2: Influence of Rewards on employee job satisfaction SA A N D SD
Mean Std Dev
Management increasing pay has an effect on
motivation 59.5% 28.1% 10.0% 1.5% 1.4%
3.76 1.37
Employees understand the scope 0% 2.9% 0% 0% 97.1% 3.93 1.01
Rewards linked to employees‟ performance is good 0.5% 3.8% 1.9% 1.4% 92.4% 3.64 0.83
Over time allowance 89% 5.7% 2.4% 2.4% 0.5% 3.59 1.10
Educational Allowance 24.8% 32.9% 23.3% 10.0% 9.0% 3.40 0.99
Salary allowance 61% 28.1% 4.3% 3.3% 3.3% 3.40 0.82
Leave allowance 63.8% 14.8% 4.8% 16.7% 0% 2.87 0.77
Medical allowance motivate employees 36.2% 51.9% 7.1% 2.9% 1.9% 3.82 1.01
More Responsibility after being creative can motivate
employees for job satisfaction 3.3% 11.0% 0% 50.0% 35.7%
3.88 0.89
More Recognition to excellence can motivate
employees for job satisfaction 87.6% 4.8% 4.8% 2.9% 0%
2.93 0.80
Always Praise to employees who are performers
motivates employees 42.4% 50.0% 6.2% 1.0% 0.5%
2.86 0.77
Kebaso & Kanyua …..Int. J. Innovative Development & Policy Studies 4(3):33-52, 2016
Ok
45
As depicted in table 2, a good number of respondents (87.6%), agreed that the management can motivate
employees for job satisfaction by increasing their pay. Also from the study findings majority of the
respondents agreed that allowances highly motivate employees for job satisfaction. This is for 94.7% for
overtime allowances, 57.7% for educational allowances, 89.1% for salary allowances, and 78.6% for
leave allowances, 92.9%. The study also established that recognition and praise as a form of motivation
have a great influence on employee job satisfaction.
Respondents were further asked whether change can be made to Airtel Kenya so as to enhance motivation
through rewards where a majority of respondents stated that there was need to restructure or make
changes the reward scheme in Airtel Kenya. From the foregoing, it can be deduced that a majority of
employees considered that rewards help in increasing employee job satisfaction.
These results are in line with Berkowitz (2012), who revealed that about 78% of work-related
performance and job satisfaction in an organization can be influenced during motivation and that it must
be enhanced by different types of incentives. Similarly, Large & Thomsen (2011) identified elements of
motivation which includes ensuring conducive environment and loyalty shift towards your organization
and minimizing time cost of advertisement. Additionally, some anecdotal evidence showed that
substantial motivational management leads to customer retention (Dinpanah et al., 2010).
Influence of Leadership Style on employee job satisfaction
The study sought to find out the influence of leadership style on employee job satisfaction in Airtel
Kenya. To this end, respondents were asked to respond to relevant statements posed in this regard. The
range was „strongly agree‟ (5) to „strongly disagree‟ (1). The scores of strongly disagree and disagree had
an equivalent mean score of 0 to 2.5 on the continuous Likert scale ;( ≤S.D/D<2.4). The scores of
undecided had an equivalent mean score of 2.5 and 3.4 on the continuous Likert scale ;( 2.5≤U<3.4). The
score of agree and strongly agree had an equivalent mean score of 3.5 to 5.0 on a continuous Likert
scale;3.5≤S.A/A<5.0). Standard deviation of > 5 implies a significant difference on the impact of the
variable among respondents. Table 3: Influence of Leadership Style on employee job satisfaction
SA A N D SD Mean
Std
Dev
Employees are involved in decision making 37.6% 5.7% 54.8% 0% 1.9% 2.22 1.23 Employees are given complete freedom to solve their own
problems 1.9% 25.0% 14.9% 21.9% 38.3% 3.45 1.28
Employees receive frequent and supportive
communication from their leaders. 91.1% 0% 5.9% 2% 1.0% 4.67 1.47
Management encourages team work and group dynamics
that help in building a culture of cohesiveness 88.6% 0% 0% 2.9% 8.6% 3.43 1.20
Employees are given an opportunity to establish their own
goals. 1.9% 8.1% 51.0% 30% 9.0% 4.08 1.98
From the study findings, a majority of the respondents strongly agreed that employees receive frequent
and supportive communication from their leaders as indicated by a mean of 4.67.The respondents were
neutral with the statement that they are involved in decision making. Further, a good number of
respondents agreed that team work and group dynamics that help in building a culture of cohesiveness as
indicated by a mean of 3.43. Additionally a good number of respondents (60.2%) disagreed to the
statement that they were given freedom to solve their own problems.
The findings concur with Colauto & Barros (2013), who pointed out that organizations that adopted an
inclusive leadership style in the South East Asian region ultimately enhanced both morale and loyalty to
its employees thus leading to job satisfaction. The findings of this study were further supported by
(Huang et al, 2012) indicating that motivating of employees for job satisfaction performance positively
increases return on investment of an organization, hence the need to proactively motivate all employees
towards achieving a competitive edge.
Kebaso & Kanyua …..Int. J. Innovative Development & Policy Studies 4(3):33-52, 2016
Ok
46
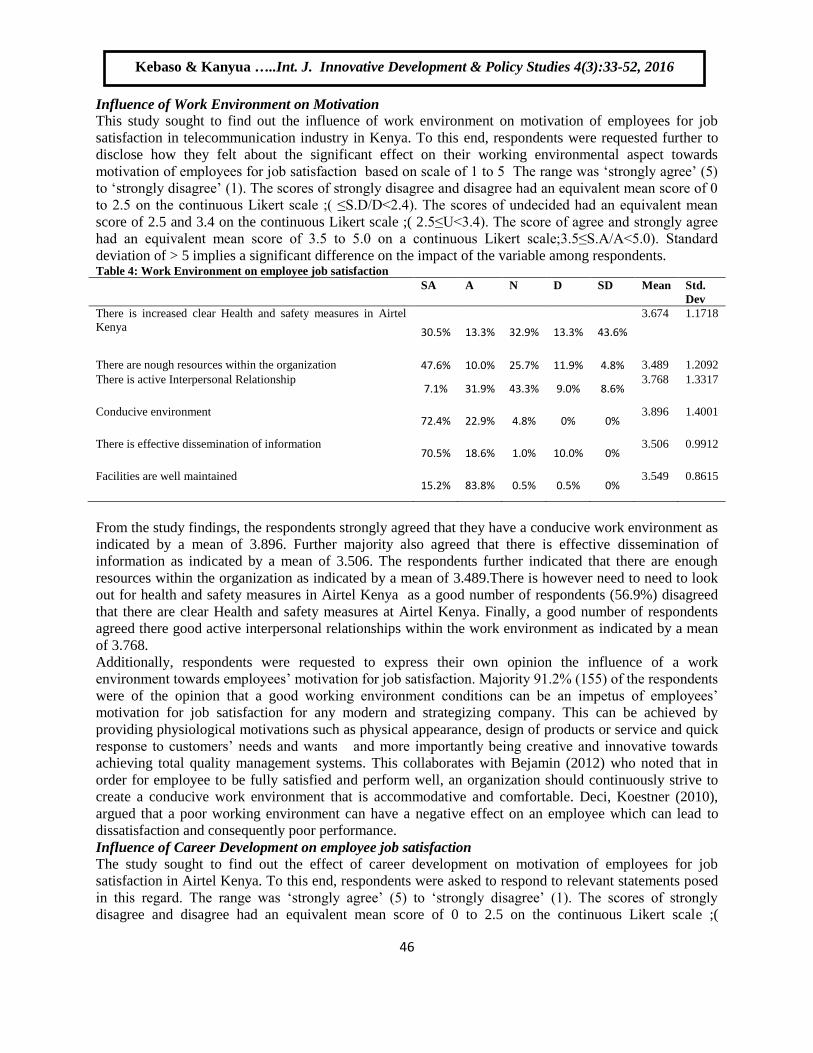
Influence of Work Environment on Motivation
This study sought to find out the influence of work environment on motivation of employees for job
satisfaction in telecommunication industry in Kenya. To this end, respondents were requested further to
disclose how they felt about the significant effect on their working environmental aspect towards
motivation of employees for job satisfaction based on scale of 1 to 5 The range was „strongly agree‟ (5)
to „strongly disagree‟ (1). The scores of strongly disagree and disagree had an equivalent mean score of 0
to 2.5 on the continuous Likert scale ;( ≤S.D/D<2.4). The scores of undecided had an equivalent mean
score of 2.5 and 3.4 on the continuous Likert scale ;( 2.5≤U<3.4). The score of agree and strongly agree
had an equivalent mean score of 3.5 to 5.0 on a continuous Likert scale;3.5≤S.A/A<5.0). Standard
deviation of > 5 implies a significant difference on the impact of the variable among respondents. Table 4: Work Environment on employee job satisfaction
SA A N D SD Mean Std.
Dev
There is increased clear Health and safety measures in Airtel
Kenya 30.5% 13.3% 32.9% 13.3% 43.6%
3.674 1.1718
There are nough resources within the organization 47.6% 10.0% 25.7% 11.9% 4.8% 3.489 1.2092
There is active Interpersonal Relationship 7.1% 31.9% 43.3% 9.0% 8.6%
3.768 1.3317
Conducive environment 72.4% 22.9% 4.8% 0% 0%
3.896 1.4001
There is effective dissemination of information 70.5% 18.6% 1.0% 10.0% 0%
3.506 0.9912
Facilities are well maintained 15.2% 83.8% 0.5% 0.5% 0%
3.549 0.8615
From the study findings, the respondents strongly agreed that they have a conducive work environment as
indicated by a mean of 3.896. Further majority also agreed that there is effective dissemination of
information as indicated by a mean of 3.506. The respondents further indicated that there are enough
resources within the organization as indicated by a mean of 3.489.There is however need to need to look
out for health and safety measures in Airtel Kenya as a good number of respondents (56.9%) disagreed
that there are clear Health and safety measures at Airtel Kenya. Finally, a good number of respondents
agreed there good active interpersonal relationships within the work environment as indicated by a mean
of 3.768.
Additionally, respondents were requested to express their own opinion the influence of a work
environment towards employees‟ motivation for job satisfaction. Majority 91.2% (155) of the respondents
were of the opinion that a good working environment conditions can be an impetus of employees‟
motivation for job satisfaction for any modern and strategizing company. This can be achieved by
providing physiological motivations such as physical appearance, design of products or service and quick
response to customers‟ needs and wants and more importantly being creative and innovative towards
achieving total quality management systems. This collaborates with Bejamin (2012) who noted that in
order for employee to be fully satisfied and perform well, an organization should continuously strive to
create a conducive work environment that is accommodative and comfortable. Deci, Koestner (2010),
argued that a poor working environment can have a negative effect on an employee which can lead to
dissatisfaction and consequently poor performance.
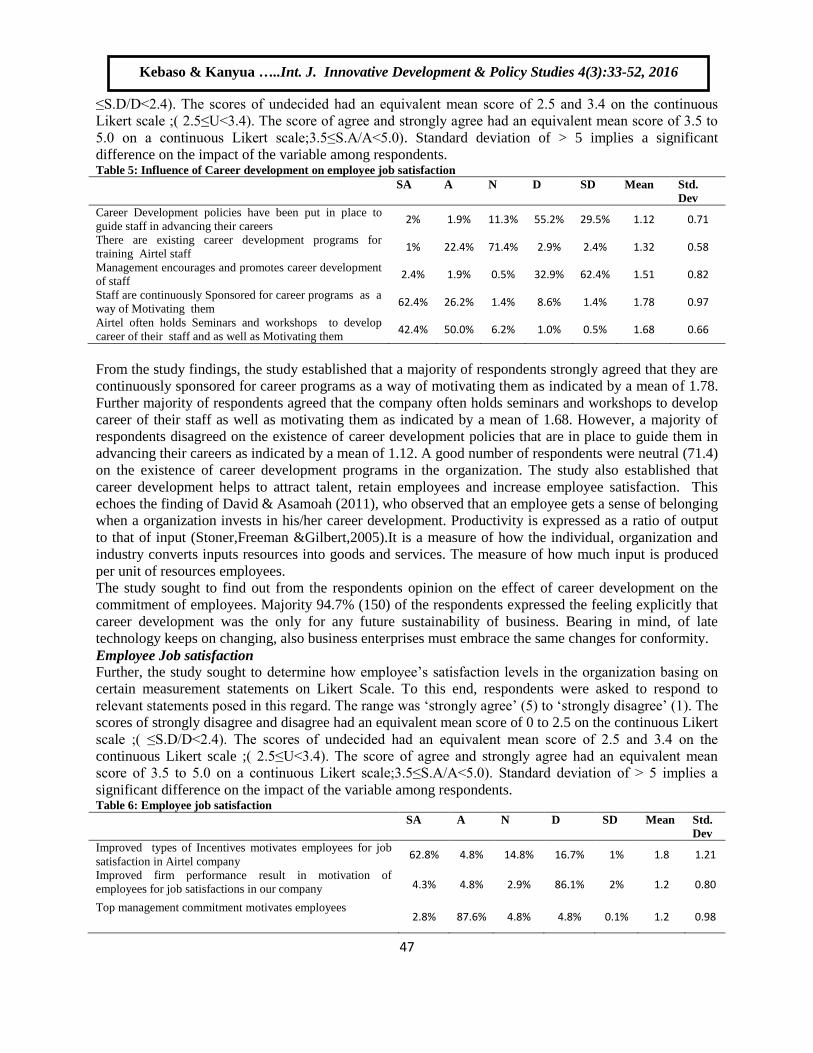
Influence of Career Development on employee job satisfaction
The study sought to find out the effect of career development on motivation of employees for job
satisfaction in Airtel Kenya. To this end, respondents were asked to respond to relevant statements posed
in this regard. The range was „strongly agree‟ (5) to „strongly disagree‟ (1). The scores of strongly
disagree and disagree had an equivalent mean score of 0 to 2.5 on the continuous Likert scale ;(
Kebaso & Kanyua …..Int. J. Innovative Development & Policy Studies 4(3):33-52, 2016
Ok
47
≤S.D/D<2.4). The scores of undecided had an equivalent mean score of 2.5 and 3.4 on the continuous
Likert scale ;( 2.5≤U<3.4). The score of agree and strongly agree had an equivalent mean score of 3.5 to
5.0 on a continuous Likert scale;3.5≤S.A/A<5.0). Standard deviation of > 5 implies a significant
difference on the impact of the variable among respondents. Table 5: Influence of Career development on employee job satisfaction
SA A N D SD Mean Std.
Dev
Career Development policies have been put in place to
guide staff in advancing their careers 2% 1.9% 11.3% 55.2% 29.5% 1.12 0.71
There are existing career development programs for
training Airtel staff 1% 22.4% 71.4% 2.9% 2.4% 1.32 0.58
Management encourages and promotes career development
of staff 2.4% 1.9% 0.5% 32.9% 62.4% 1.51 0.82
Staff are continuously Sponsored for career programs as a
way of Motivating them 62.4% 26.2% 1.4% 8.6% 1.4% 1.78 0.97
Airtel often holds Seminars and workshops to develop
career of their staff and as well as Motivating them 42.4% 50.0% 6.2% 1.0% 0.5% 1.68 0.66
From the study findings, the study established that a majority of respondents strongly agreed that they are
continuously sponsored for career programs as a way of motivating them as indicated by a mean of 1.78.
Further majority of respondents agreed that the company often holds seminars and workshops to develop
career of their staff as well as motivating them as indicated by a mean of 1.68. However, a majority of
respondents disagreed on the existence of career development policies that are in place to guide them in
advancing their careers as indicated by a mean of 1.12. A good number of respondents were neutral (71.4)
on the existence of career development programs in the organization. The study also established that
career development helps to attract talent, retain employees and increase employee satisfaction. This
echoes the finding of David & Asamoah (2011), who observed that an employee gets a sense of belonging
when a organization invests in his/her career development. Productivity is expressed as a ratio of output
to that of input (Stoner,Freeman &Gilbert,2005).It is a measure of how the individual, organization and
industry converts inputs resources into goods and services. The measure of how much input is produced
per unit of resources employees.
The study sought to find out from the respondents opinion on the effect of career development on the
commitment of employees. Majority 94.7% (150) of the respondents expressed the feeling explicitly that
career development was the only for any future sustainability of business. Bearing in mind, of late
technology keeps on changing, also business enterprises must embrace the same changes for conformity.
Employee Job satisfaction
Further, the study sought to determine how employee‟s satisfaction levels in the organization basing on
certain measurement statements on Likert Scale. To this end, respondents were asked to respond to
relevant statements posed in this regard. The range was „strongly agree‟ (5) to „strongly disagree‟ (1). The
scores of strongly disagree and disagree had an equivalent mean score of 0 to 2.5 on the continuous Likert
scale ;( ≤S.D/D<2.4). The scores of undecided had an equivalent mean score of 2.5 and 3.4 on the
continuous Likert scale ;( 2.5≤U<3.4). The score of agree and strongly agree had an equivalent mean
score of 3.5 to 5.0 on a continuous Likert scale;3.5≤S.A/A<5.0). Standard deviation of > 5 implies a
significant difference on the impact of the variable among respondents. Table 6: Employee job satisfaction
SA A N D SD Mean Std.
Dev
Improved types of Incentives motivates employees for job
satisfaction in Airtel company 62.8% 4.8% 14.8% 16.7% 1% 1.8 1.21
Improved firm performance result in motivation of
employees for job satisfactions in our company 4.3% 4.8% 2.9% 86.1% 2% 1.2 0.80
Top management commitment motivates employees 2.8% 87.6% 4.8% 4.8% 0.1% 1.2 0.98
Kebaso & Kanyua …..Int. J. Innovative Development & Policy Studies 4(3):33-52, 2016
Ok
48
From the study findings, the respondents strongly agreed that there has been improved incentives over the
years as indicated by a mean of 1.21. The respondents however indicated that there was not any
significant improvement in the performance of the firm as a result of motivation as indicated by a mean of
0.80.Respondents also agreed that top management commitment can motivate employees as indicated by
a mean of 0.98.
This concurs with Thompson & Prottas (2012) who noted that in order for employees to be committed to
an organization, they need to feel a sense of satisfaction which can stem from various motivation
activities.
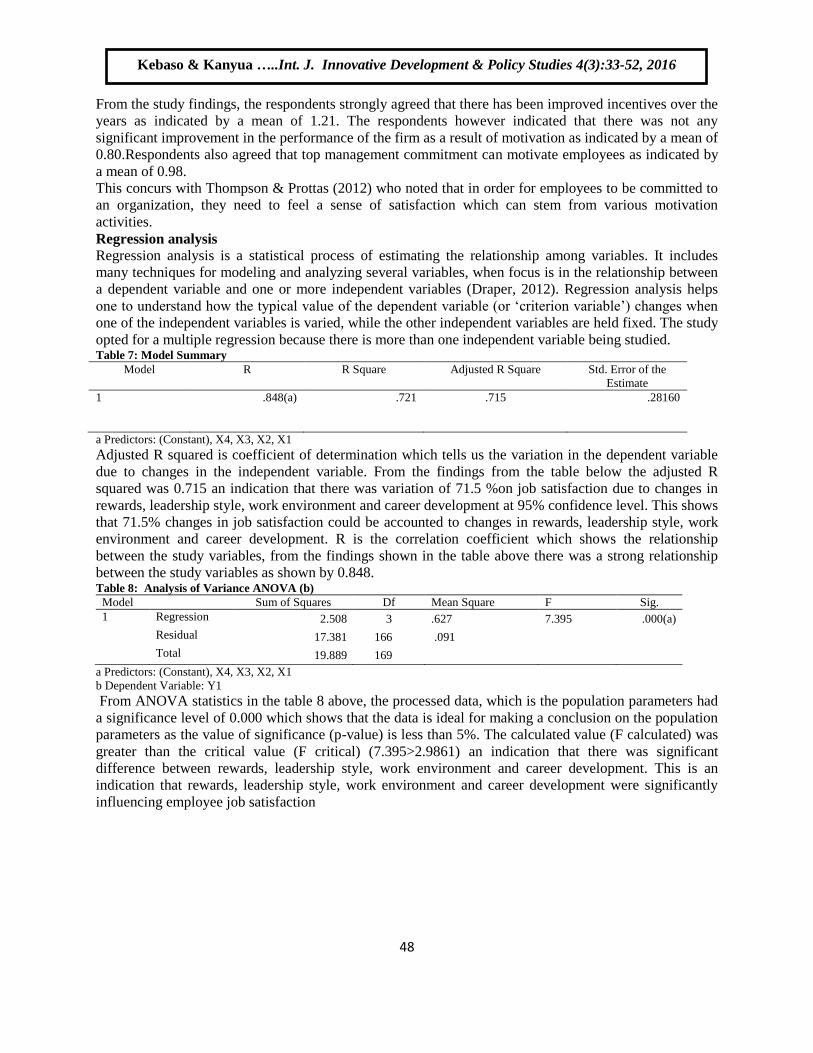
Regression analysis
Regression analysis is a statistical process of estimating the relationship among variables. It includes
many techniques for modeling and analyzing several variables, when focus is in the relationship between
a dependent variable and one or more independent variables (Draper, 2012). Regression analysis helps
one to understand how the typical value of the dependent variable (or „criterion variable‟) changes when
one of the independent variables is varied, while the other independent variables are held fixed. The study
opted for a multiple regression because there is more than one independent variable being studied. Table 7: Model Summary
Model R R Square Adjusted R Square Std. Error of the
Estimate
1 .848(a) .721 .715 .28160
a Predictors: (Constant), X4, X3, X2, X1
Adjusted R squared is coefficient of determination which tells us the variation in the dependent variable
due to changes in the independent variable. From the findings from the table below the adjusted R
squared was 0.715 an indication that there was variation of 71.5 %on job satisfaction due to changes in
rewards, leadership style, work environment and career development at 95% confidence level. This shows
that 71.5% changes in job satisfaction could be accounted to changes in rewards, leadership style, work
environment and career development. R is the correlation coefficient which shows the relationship
between the study variables, from the findings shown in the table above there was a strong relationship
between the study variables as shown by 0.848. Table 8: Analysis of Variance ANOVA (b)
Model Sum of Squares Df Mean Square F Sig.
1 Regression 2.508 3 .627 7.395 .000(a)
Residual 17.381 166 .091
Total 19.889 169
a Predictors: (Constant), X4, X3, X2, X1
b Dependent Variable: Y1
From ANOVA statistics in the table 8 above, the processed data, which is the population parameters had
a significance level of 0.000 which shows that the data is ideal for making a conclusion on the population
parameters as the value of significance (p-value) is less than 5%. The calculated value (F calculated) was
greater than the critical value (F critical) (7.395>2.9861) an indication that there was significant
difference between rewards, leadership style, work environment and career development. This is an
indication that rewards, leadership style, work environment and career development were significantly
influencing employee job satisfaction
Kebaso & Kanyua …..Int. J. Innovative Development & Policy Studies 4(3):33-52, 2016
Ok
49
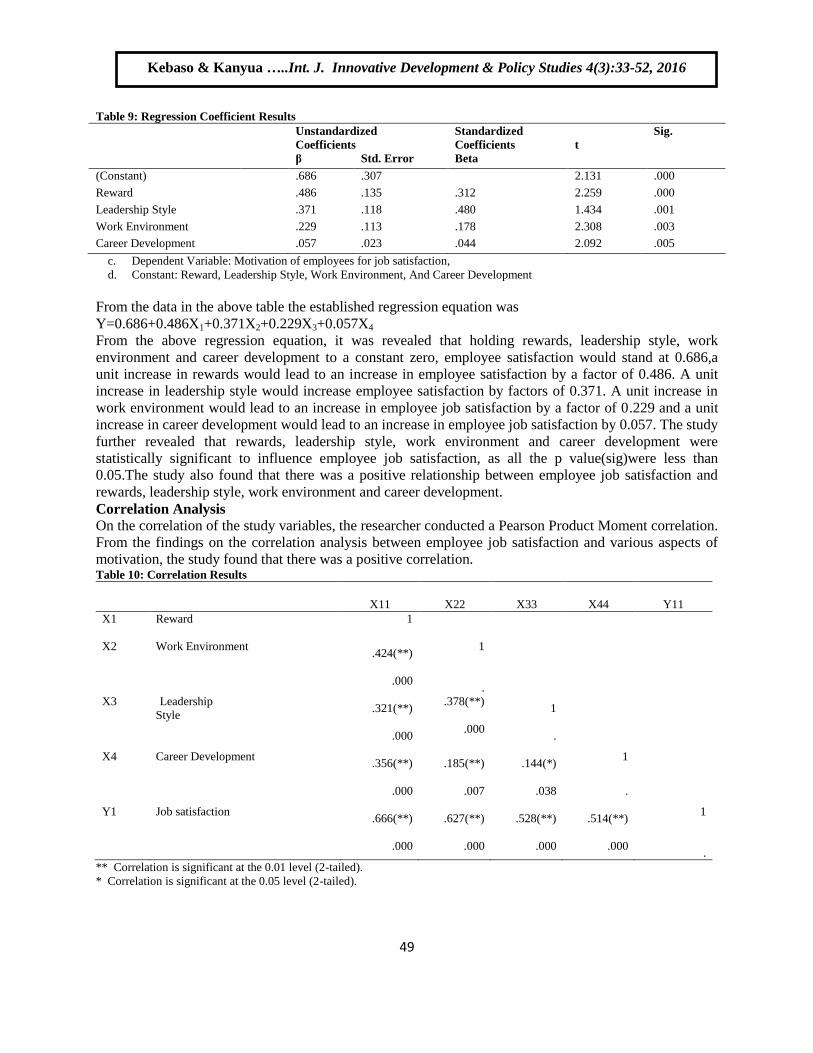
Table 9: Regression Coefficient Results
Unstandardized
Coefficients
Standardized
Coefficients
t
Sig.
β Std. Error Beta
(Constant) .686 .307 2.131 .000
Reward .486 .135 .312 2.259 .000
Leadership Style .371 .118 .480 1.434 .001
Work Environment .229 .113 .178 2.308 .003
Career Development .057 .023 .044 2.092 .005
c. Dependent Variable: Motivation of employees for job satisfaction,
d. Constant: Reward, Leadership Style, Work Environment, And Career Development
From the data in the above table the established regression equation was
Y=0.686+0.486X1+0.371X2+0.229X3+0.057X4
From the above regression equation, it was revealed that holding rewards, leadership style, work
environment and career development to a constant zero, employee satisfaction would stand at 0.686,a
unit increase in rewards would lead to an increase in employee satisfaction by a factor of 0.486. A unit
increase in leadership style would increase employee satisfaction by factors of 0.371. A unit increase in
work environment would lead to an increase in employee job satisfaction by a factor of 0.229 and a unit
increase in career development would lead to an increase in employee job satisfaction by 0.057. The study
further revealed that rewards, leadership style, work environment and career development were
statistically significant to influence employee job satisfaction, as all the p value(sig)were less than
0.05.The study also found that there was a positive relationship between employee job satisfaction and
rewards, leadership style, work environment and career development.
Correlation Analysis
On the correlation of the study variables, the researcher conducted a Pearson Product Moment correlation.
From the findings on the correlation analysis between employee job satisfaction and various aspects of
motivation, the study found that there was a positive correlation. Table 10: Correlation Results
X11 X22 X33 X44 Y11
X1 Reward 1
X2 Work Environment .424(**)
1
.000
.
X3 Leadership
Style .321(**)
.378(**)
1
.000
.000
.
X4 Career Development .356(**) .185(**) .144(*)
1
.000 .007 .038 .
Y1 Job satisfaction .666(**) .627(**) .528(**) .514(**)
1
.000 .000 .000 .000
.
** Correlation is significant at the 0.01 level (2-tailed).
* Correlation is significant at the 0.05 level (2-tailed).
Kebaso & Kanyua …..Int. J. Innovative Development & Policy Studies 4(3):33-52, 2016
Ok
50
The correlation matrix in table 10 above indicates that rewards are strongly and positively correlated with
employee job satisfaction as indicated by a correlation coefficient of 0.666. Further the matrix also
indicated that leadership style is also positively correlated with employee job satisfaction as indicated by
a coefficient of 0.627. The correlation matrix further indicates that work environment is strongly and
positively correlated with employee job satisfaction by a coefficient of 0.528. Lastly, the correlation
matrix further indicates that career development is also strongly and positively correlated with employee
job satisfaction as indicated by a coefficient of 0.514. The correlation matrix implies that the independent
variables: rewards, leadership style, work environment and career development are very crucial in
enhancing employee job satisfaction in the telecommunication industry as shown by their strong and
positive relationship with the dependent variable
CONCLUSION
The study established that is an impetus of motivation in any forecasting organization, hence the need to
embrace reward to employees. Rewards play an important role in building and sustaining the commitment
of employees that ensures a high standard of performance and work consistency. The study concludes that
rewards have a positive influence on employee job satisfaction in the telecommunication industry in
Kenya.
The study further established that employees‟ perception of leadership behavior is an important predictor
of employee job satisfaction and commitment, leadership styles can either motivate or discourage
employees, which can in turn lead to an increase or decrease in performance. The study concludes that
leadership style positively influences employee job satisfaction.
The study also established that a safe working environment boosts employee morale, reduces stress,
which in turn increases productivity and efficiency. In addition, providing health and safety information
and training helped create awareness of dangers that are likely to occur in the organization thus making
employees keep safety practices daily. Creating a conducive work environment and effective
dissemination of information also goes a long way in promoting a good working environment. Therefore,
the study established that work environment had a positive influence in employee job satisfaction in the
telecommunication industry in Kenya.
The study established that investment in training helps the organization in producing impeccable long run
results. It can also help in retention of employees, as levels of satisfaction are high. Thus, the study
concludes that training had a positive influence on employee job satisfaction in the telecommunication
industry in Kenya.
RECOMMENDATIONS
The study recommends that organizations should design effective reward system which is inclusive of all
factors to cater for employee needs. Employees should be continuously appraised through both formal
and informal feedbacks channels on their performance level and what must be done to enhance their
satisfaction. Recognition and feedback is also highly recommended.
The study recommends that organizations should formulate leadership systems that encourage employees
to participate in decision making, establish their own goals, encourages teamwork and offers supportive
communication to employees.
The study recommends that organizations must take an active approach in educating employees on the
importance of practicing safe habits in order to maintain a healthy and safe working environment. The
organizations must keep records and make reports to appropriate agencies (including OSHA)
Demonstrating injury prevention to OSHA standards will protect the organization from legal exposures.
The study recommends that telecommunication industries should consider organizing trainings and
seminars for employees as this will help in increasing employee skills, loyalty and competence making
them more willing to work for the success of their organizations.
Kebaso & Kanyua …..Int. J. Innovative Development & Policy Studies 4(3):33-52, 2016
Ok
51
REFERENCES
Armstrong. M. (2012).Handbook of Human Resource Management Practice. London. Kogan Page. Armstrong M. (2009) Armstrong’s handbook of performance management. London. Kogan Page
Achonga, B.O., Lagat, J.K. & Akuja, T.E. (2011), “Evaluation of the Employee Retention Practices in advanced Business World., Kenya”,
Journal of Human Resource Development, vol. 38, pp. 2496–2507. Ali, A. & Sharif, M.( 2012), “Measuring Employee satisfaction in Management Research; A synthesis of measurement challenges and
approaches.”, Journal of the Asia Pacific Economy, vol. 17, no. 3, pp. 498–513.
Gordon, B. (2012). Are Canadian firms under investing in training? Canadian Business Economics 1, 1, 25–33. Arasa, R., &K'Obonyo, P. (2012). The relationship between strategic planning and firm performance. International Journal of Humanities and
Social Science, Special Issue, 2(22), 201-213.
Barney, J. (2011).Looking inside for competitive advantage, Academy of Management Executive Journal,9 (4),pp. 49-61. Bernard,H.R.(2012).Research Methods in Anthropology :Qualitative and Quantitative Methods.3rd Edition. Altamira Press. Walnut Creek.
California. Berkowitz (2012) Advances in experimental social psychology. New York: Academic Press.
Blakemore N (2008) Organizational Development. Arrow Publishers. Connecticut
Boyens, M. (2011). Organizational socialization, career aspirations and turnover intentions among design engineers. Leadership and Organization Development Journal, Emerald Group Publishing Limited, Vol. 26 (6) pp 424-441.
Carter J.R. (2010) Human Resource Management.Parkland Publishers. New Jersey
Capelli,P.(2010). A Market Driven Approach to Retaining Talent. Harvard Business Review.
Chartered Institute of Personnel and Development (CIPD).(2009).War on Talent: Talent Management under threat in uncertain terms,survey
report, CIPD, London.
David, S. &Asamoah, C. (2011), Efective Motivational Methods in Global Companies. Journal of Sustainable Development in Africa, vol. 14, no. 4, pp. 213–224.
Erbaugh, J.M., Kibwika, P. &Donnermeyer, J. (2010) Impact of Human Capital Management on Employee Satisfaction. European Journal of
Ecomics, Finance and Adminstrative Sciences,Vol.5(34) pp1309-1189 Eriksson, P. &Kovalainen, A. (2008) Qualitative Methods in Business Research, London: SAGE Publications Ltd.
Ewen, R,Hulin C& Smith, P ( 2012)An Empirical test of Herzberg‟s two factor theory. Journal of Applied Psyschology,50(6) 1332-1356
Foot M. &Hook C.(2011).Introducing Human Resource Management,5th Ed, Pearson Education Limited. England. Farquhar, J.D. (2012). Case study research for business. London: Sage Publication.
Freyermuth, B. (2012). Performance Appraisal Satisfaction and Employee Outcome: Mediating and Moderating roles of work motivation.
International Journal of Human Resource Management, Vol. 17 (3). Graziano, A.M., &Raulin, M.L. (2012). Research Methods - A Process of Inquiry (4th ed.).
Gummesson, E. (2010). All Motivational Practices are interpretive. Journal of Business &Industrial Marketing, 18(617), 482-492.
Hanson, J. D., Melnyk, S. A. & Calantone, R. A. (2011), "Defining and measuring alignment in Performance management", International Journal of Operations and Production Management, Vol. 31, No.10, pp. 1089-1114
Harris M. (2011) Human Resource Management. Dryden Press. New Jersey Hill, C. & Jones, G.R. (2010). Strategic management theory: An integrated approach, 9th edition. Mason, OH: Cengage Learning
Hill,B.&Tande, C (2015) .Total Rewards: The Employee Value Proposition, The academy management journal,33(4),692-724
Hoque, Z. & M. Chia. (2012) Competitive forces and the levers of control framework in a Telecommunication setting: a tale of a multinational subsidiary. Qualitative Research in Accounting and Management.9 (2): 123-145
Hunger, J.N. &Wheelen, T.L. (2011). Essentials of Strategic Management, 5th edition. Upper Saddle River, NJ: Prentice Hall
Hackman, J. R., &Wageman, R. (2011). A theory of team coaching. Academy of Management Review, 30( 2). Hamidi, Y. et al. (2010) The Effect of Performance Appraisal Results on the Personnel Motivation and Job Promotion. Australian Journal of
Basic and Applied Sciences, 4(9):
Idowu, A. & Salami, A. (2010) A Paradigmatic Approach to Means of Achieving Competitive Advantage through Workers Motivation. European Journal of Social Sciences, 15(2), 56-63.
Islam, A. E. (2010), Investigating Governmental (Public Sector) Performance Management in Egypt, Thesis (PhD), University of Strathclyde.
Islam, A. E. (2011), "Proposing a Performance and Change Management Framework", International Journal of Finance and Management, Vol. 1, No. 2, pp. 111–123.
Johnson, J, Griffeth, W., & Griffin, M. (2011). Factors discrimination functional and dysfunctional sales force turnover. Journal of Business
& Industrial Marketing, Vol. 15(6) 399-415. Kaguru, J.K. (2010). A survey of strategy control practices of parastatals in Kenya. Nairobi: Unpublished MBA research project of the
University of Nairobi.
Kohtamaki, M., Kraus, S., Makela, M., &Ronkko, M. (2012). The role of personnel commitment to strategy implementation and organisational learning within the relationship between strategic planning and company performance. International Journal of Entrepreneurial
Behaviour& Research, 18(2), 159-178.
Kothari,C.R (2011). Research Methodology. Methods and Techniques. New Delhi: New Age International Publishers. (2nd Edition). Kuye, O.L. & Oghojafor, B.E.A. (2011). Strategic control and corporate performance in the Manufacturing industry: Evidence from Nigeria.
European Journal of Social Sciences, Vol.22 No.2. New York: Routledge.
Lund, T., Saethre, M.G., Nyborg, I., Coulibaly, O. &Rahman, M.H.( 2010)Changing the mindset: the training myth and the need for word-class performance. International Journal of Human Resource Management 12, 4, 586–600.
Mancini, F. (2011), “Effects of externally mediated rewards on intrinsic motivation”. Journal of personality and social psychology, 18,105-
115 Mariyono, J. (2011), The effects of job characteristics and working conditions on employee satisfaction. International journal of
industrial economics,37 (2007)
Maryan, N. N. (2012). Analysis of the relationship between strategic planning and competitive advantages in telecommunication sector. Interdisciplinary Journal of Contemporary Business Research, 4(8), 220-238.
Minchington,B(2010).Employer Brand Leadership. Wiley and Sons Limited. London
Kebaso & Kanyua …..Int. J. Innovative Development & Policy Studies 4(3):33-52, 2016
Ok
52
Mugenda, M. &Mugenda,A.(2008).Research Methods,; Quantitative & Qualitative Approaches;; Nairobi: Acts Press.
Musyoka, S.W. (2011). Strategic control at the National Social Security Fund, Kenya. Nairobi: Unpublished MBA research project of the University of Nairobi.
M. Zhang & B. Huo (2010) Two types of bureaucracy: Enabling and Coercive. Administrative Science Quarterly, 41(1), 61-89
Nandama,W.N. (2010),Motivation and job satisfaction :Theory, research and practice. St.Paul,MN:West Publishing Co.Dharwad. Nyawira, E.W. (2010). Impact of motivational incentives on the public sector in Kenya. Nairobi: Unpublished MBA research project of the
University of Nairobi.
Otido, C.N. (2011). Competitive strategies adopted by Kenyan cement firms in a turbulent business environment. Nairobi: Unpublished MBA research project of the University of Nairobi
Owolabi, S. A., & Makinde, O. G. (2012). The effect of strategic planning on the corporate performance in university education: a study of
Babcock University. Kuwait Chapter of Arabian Journal of Business and Management Review, 2(4), 27-44. Pananurak, P. 2010, “Impact Assessment of Employee satisfaction in the Telecommunication Industry in Pakistan No. 14, Institute of
Development and Business Economics, Leibniz University of Hannover, Germany.
Pace, W. R., Phillip, S. C. & Gordon, M. E. (2011). Human Resource Development: The Field.New Jersey: Prentice Hall. Porter K, Smith P & Roger F. (2011) Leadership and Management for HR Professionals. Butterwood Publication. London
Reid, W.; Turbide, J.(2009) Board/Staff Relationships in a Growth Crisis: Implications for Nonprofit Governance. Nonprofit Volunt. Sect. Q.
2012, 41, 82–99. Todo, Y. and Takahashi, R. (2011).Employees and Motivation: A literature review. Beverly Hills. CA. Sage
Vel, P., Creed, B., & Narayan, R. S. (2012). The corporate strategy of Dubai Duty Free. Asian Journal of Business and Management Sciences,
2(6), 40-52. Wijesinghe, J. C., Ten, E. E., & Foreman, J. (2012). An empirical investigation into formalized strategic planning in small and medium
enterprises (SMEs) in Srilanka. 2nd International Conference on Management Proceeding, 11th-12th June, 2012, Holiday Villa
Beach Resort & Spa, Langkawi Kedah, Malaysia Wu, L. 2010, Work and motivation.S an Francisco, CA: Jossey Bass
Taylor, R. (2014). The Race for Talent: Retaining and Engaging Workers in the 21st Century. Human Resource Planning Journal, Vol. 27 (3)
pp. 12-46. Y. Hou, Y. Xiong, X. Wang, and X. Liang, "The effects of a trust mechanism on a dynamic supply chain network," Expert Systems with
Applications, vol. 41, pp. 3060-3068, 5//2014
Kebaso & Kanyua …..Int. J. Innovative Development & Policy Studies 4(3):33-52, 2016
Ok