Embed Size (px)
Citation preview
Influence of optical properties on two-photonfluorescence imaging in turbid samples
Andrew K. Dunn, Vincent P. Wallace, Mariah Coleno, Michael W. Berns,and Bruce J. Tromberg
A numerical model was developed to simulate the effects of tissue optical properties, objective numericalaperture ~N.A.!, and instrument performance on two-photon-excited fluorescence imaging of turbidsamples. Model data are compared with measurements of fluorescent microspheres in a tissuelikescattering phantom. Our results show that the measured two-photon-excited signal decays exponen-tially with increasing focal depth. The overall decay constant is a function of absorption and scatteringparameters at both excitation and emission wavelengths. The generation of two-photon fluorescence isshown to be independent of the scattering anisotropy, g, except for g . 0.95. The N.A. for which themaximum signal is collected varies with depth, although this effect is not seen until the focal plane isgreater than two scattering mean free paths into the sample. Overall, measurements and model resultsindicate that resolution in two-photon microscopy is dependent solely on the ability to deliver sufficientballistic photon density to the focal volume. As a result we show that lateral resolution in two-photonmicroscopy is largely unaffected by tissue optical properties in the range typically encountered in softtissues, although the maximum imaging depth is strongly dependent on absorption and scatteringcoefficients, scattering anisotropy, and objective N.A.. © 2000 Optical Society of America
OCIS codes: 180.0180, 170.3660, 170.0180.
ootitdpiedlsst
1. Introduction
Two-photon fluorescence microscopy has shown greatpromise as a means of obtaining high-resolution,three-dimensional images of tissue at depths that canexceed those obtained with confocal fluorescencetechniques. In two-photon fluorescence imaging,near-infrared light is used to excite transitions oftwice the energy of a single photon. Since the ab-sorption probability is proportional to the square ofthe instantaneous intensity of the excitation light,the generated fluorescence is confined to a small re-gion around the focal volume, making the techniqueinherently depth resolved. For high-numerical-aperture ~N.A.! microscope objectives this volume isof the order of a femtoliter.
Depth-resolved imaging of tissue by use of two-
When this research was performed, the authors were with theLaser Medical and Microbeam Program, Beckman Laser Institute,University of California, Irvine, California 92612. A. K. Dunn isnow with the NMR Center, Massachusetts General Hospital, Har-vard Medical School, Charlestown, Massachusetts 02129. B. J.Tromberg’s e-mail address is [email protected].
Received 3 August 1999; revised manuscript received 7 Decem-ber 1999.
0003-6935y00y071194-08$15.00y0© 2000 Optical Society of America
1194 APPLIED OPTICS y Vol. 39, No. 7 y 1 March 2000
photon fluorescence was first demonstrated by Denket al.1 One of the advantages of two-photon fluores-cence over conventional fluorescence imaging is thatnear-infrared light is used, which penetrates moredeeply into tissue, owing to decreased scattering.Recent applications of intravital, two-photon fluores-cence imaging have included video-rate imaging ofskin2 and imaging of blood flow in exposed rat neo-cortex.3 In general the investigators in Refs. 1–3were able to image structure and function at depthsbetween 300 and 600 mm.
Other techniques such as confocal microscopes andptical coherence tomography provide the ability tobtain depth-resolved images, but each has limita-ions on resolution and imaging depth. Although its understood that scattering is the primary factorhat limits the imaging depth of these techniques, theetailed factors that influence this depth are not com-letely understood. Scattering plays a role in limit-ng the imaging depth by decreasing the number ofxcitation photons reaching the focus area and byecreasing the number of fluorescent photons col-ected by the objective lens. These effects can betudied by examination of how both temporal andpatial components of the source point-spread func-ion ~PSF! are affected by scattering.
In this paper the detailed influence of tissue optical
Tmjptdtutd
wprettis
rt
wtluFpmou
hr
properties and instrument parameters on the two-photon fluorescence signal is described with a MonteCarlo model. Because of their flexibility, MonteCarlo models have been used to characterize differentimaging modalities in highly scattering media.4–8
Two-photon fluorescence images of fluorescentspheres embedded in turbid gels are used to validatethe model and assess instrument performance. Ourresults show that two-photon microscopy can be usedto form high-resolution images at depths as great as400 mm in typical nonkeratinized epithelial tissues.
he overall signal intensity is a function of instru-ent parameters including source pulse width, ob-
ective N.A., tissue optical properties, and thehotophysical characteristics of the fluorophore. Al-hough the two-photon fluorescence signal intensityecreases as a result of scattering-induced losses inhe ballistic photons, image resolution is essentiallynaffected by tissue optical properties. As a resultransform-limited resolution can be obtained atepths of 2–5 times the scattering mean free path.
2. Theory and Model
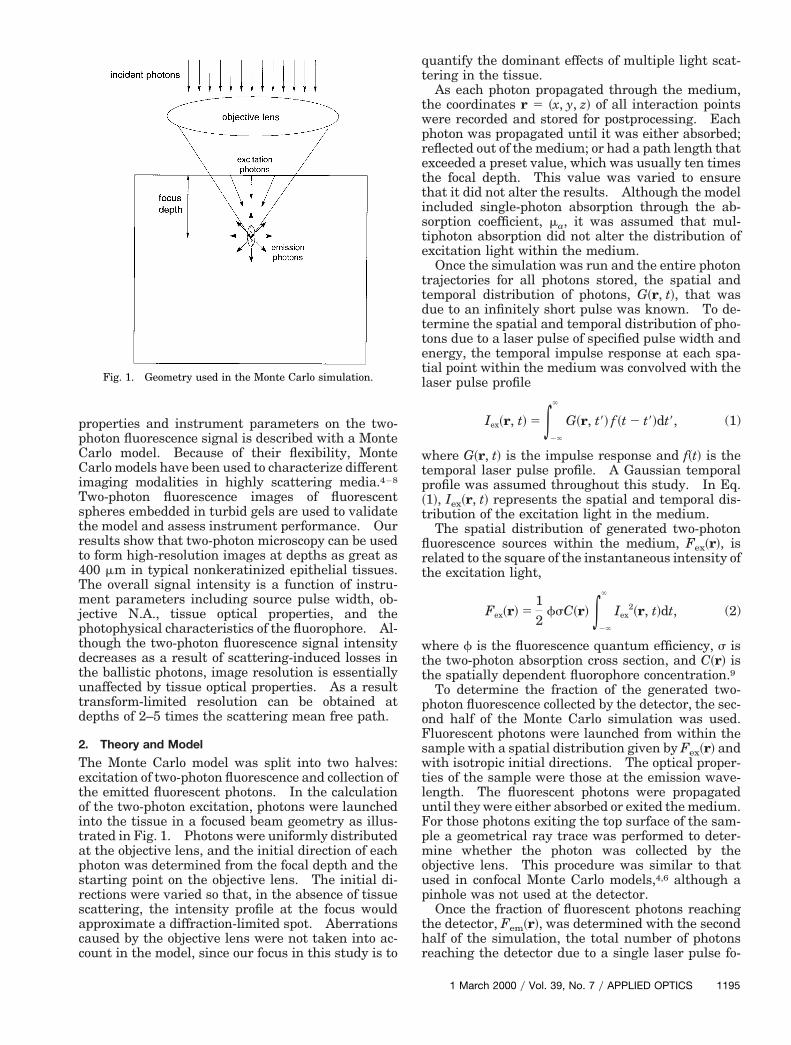
The Monte Carlo model was split into two halves:excitation of two-photon fluorescence and collection ofthe emitted fluorescent photons. In the calculationof the two-photon excitation, photons were launchedinto the tissue in a focused beam geometry as illus-trated in Fig. 1. Photons were uniformly distributedat the objective lens, and the initial direction of eachphoton was determined from the focal depth and thestarting point on the objective lens. The initial di-rections were varied so that, in the absence of tissuescattering, the intensity profile at the focus wouldapproximate a diffraction-limited spot. Aberrationscaused by the objective lens were not taken into ac-count in the model, since our focus in this study is to
Fig. 1. Geometry used in the Monte Carlo simulation.
quantify the dominant effects of multiple light scat-tering in the tissue.
As each photon propagated through the medium,the coordinates r 5 ~x, y, z! of all interaction points
ere recorded and stored for postprocessing. Eachhoton was propagated until it was either absorbed;eflected out of the medium; or had a path length thatxceeded a preset value, which was usually ten timeshe focal depth. This value was varied to ensurehat it did not alter the results. Although the modelncluded single-photon absorption through the ab-orption coefficient, ma, it was assumed that mul-
tiphoton absorption did not alter the distribution ofexcitation light within the medium.
Once the simulation was run and the entire photontrajectories for all photons stored, the spatial andtemporal distribution of photons, G~r, t!, that wasdue to an infinitely short pulse was known. To de-termine the spatial and temporal distribution of pho-tons due to a laser pulse of specified pulse width andenergy, the temporal impulse response at each spa-tial point within the medium was convolved with thelaser pulse profile
Iex~r, t! 5 *2`
`
G~r, t9! f ~t 2 t9!dt9, (1)
where G~r, t! is the impulse response and f~t! is thetemporal laser pulse profile. A Gaussian temporalprofile was assumed throughout this study. In Eq.~1!, Iex~r, t! represents the spatial and temporal dis-tribution of the excitation light in the medium.
The spatial distribution of generated two-photonfluorescence sources within the medium, Fex~r!, iselated to the square of the instantaneous intensity ofhe excitation light,
Fex~r! 512
fsC~r! *2`
`
Iex2~r, t!dt, (2)
where f is the fluorescence quantum efficiency, s isthe two-photon absorption cross section, and C~r! isthe spatially dependent fluorophore concentration.9
To determine the fraction of the generated two-photon fluorescence collected by the detector, the sec-ond half of the Monte Carlo simulation was used.Fluorescent photons were launched from within thesample with a spatial distribution given by Fex~r! and
ith isotropic initial directions. The optical proper-ies of the sample were those at the emission wave-ength. The fluorescent photons were propagatedntil they were either absorbed or exited the medium.or those photons exiting the top surface of the sam-le a geometrical ray trace was performed to deter-ine whether the photon was collected by the
bjective lens. This procedure was similar to thatsed in confocal Monte Carlo models,4,6 although a
pinhole was not used at the detector.Once the fraction of fluorescent photons reaching
the detector, Fem~r!, was determined with the secondalf of the simulation, the total number of photonseaching the detector due to a single laser pulse fo-
1 March 2000 y Vol. 39, No. 7 y APPLIED OPTICS 1195
sa
ttcofo
wppp
e
m
Table 1. Optical Properties of the 2% Intralipid Agarose Gel Used in
1
cused at a depth, zf, could be determined from theproduct of the generation and collection of fluores-cence,
S~zf! 5 h * Fex~r!Fem~r!dr, (3)
where Fem~r! describes the fraction of fluorescentphotons generated at r that reach the surface withinthe acceptance angle of the objective lens and h de-cribes the collection efficiency of the optics, filters,nd detector quantum efficiency.With the two-part simulation the dependence of
he optical properties of the medium on the genera-ion and collection of two-photon fluorescence at in-reasing focal depths was studied for each set ofptical properties. The resulting detector signal as aunction of focal depth, S~zf!, was fitted to a functionf the form
S~zf! 5 So exp@2~bexmtex 1 bemmt
em!zf#, (4)
where mtex and mt
em are the total attenuation coeffi-cients ~mt 5 ms1 ma! at the excitation and emission
avelengths, respectively, and bex and bem arearameters determined by means of fitting the com-uted decay of the generation and collection of two-hoton fluorescence. The term So in Eq. ~2! is the
amount of fluorescence generated in a nonscatteringmedium for the same N.A., fluorophore concentra-tion, and quantum efficiency. The fluorophore con-centration, C~r!, was assumed to be uniform over thentire sample in all simulations.
3. Experiment
The simulated results were compared with measure-ments of the depth-dependent signal decay of a pointemission source in a scattering sample. The sampleconsisted of 0.1-mm-diameter fluorescent spheres~Fluorospheres, F-8803, Molecular Probes! sus-pended in an agarose gel matrix. Intralipid ~20%solids, Baxter! was added to the gelatin at a finalconcentration of 2% to provide background scatteringcomparable with that found in tissues. The scatter-ing and absorption coefficients at the excitation ~780nm! and emission ~515 nm! wavelengths are listed inTable 1. The optical properties of the gel were ver-ified by measurement of the reduced scattering coef-ficient, m9s 5 ms~1 2 g!, and the absorption coefficient,
a, with a frequency domain photon migration instru-ment described in Ref. 10. The gelatin–sphere mix-ture was placed on a glass slide before being solidifiedand covered with a coverslip.
the Measurements and Simulations at the Excitation and EmissionWavelengthsa
Wavelength ~nm! ms ~mm21! ma ~mm21! g
780 6 4 3 1024 0.65515 16 4 3 1024 0.8
aValues taken from van Staveren et al. ~Ref. 14!.
196 APPLIED OPTICS y Vol. 39, No. 7 y 1 March 2000
The two-photon microscope system used in themeasurements consists of a mode-locked titaniumsapphire laser with a pulse width of approximately100 fs and a repetition rate of 76 MHz ~Coherent,Mira Model 900! and an inverted microscope ~Zeiss,Axiovert Model 135!. The beam is scanned acrossthe sample with orthogonal galvanometric mirrors~Cambridge Technology! and focused onto the samplewith a 633, 1.2-N.A. microscope objective ~Zeissc-Apochromat!. The two-photon fluorescence is splitoff from the excitation light with a dichroic beamsplitter, and excess excitation light is suppressed byplacement of bandpass filters in front of the detector.The fluorescent light is detected with a single-photoncounting detection system consisting of a photomul-tiplier tube ~Hamamatsu Model R5600P! and a 100-MHz single-photon counting amplifier–discriminator~Advanced Research Instruments, Model F-100T!.Typically images ~256 3 256 pixels! are acquired at arate of 1 frameys with an excitation power of ;10 mWat the sample. Beam scanning and image acquisi-tion are computer controlled through a data acquisi-tion board developed at the Laboratory forFluorescence Dynamics at the University of Illinois,Urbana-Champaign.
To analyze the decay of the two-photon fluores-cence signal with depth, images were acquired atdepth intervals of 20 mm from the surface of thesample to a maximum depth of 250 mm, which cor-responded to the working distance of the objective.Within each image the signal intensity was quanti-fied by calculation of the average intensity of approx-imately 25 individual spheres. The width of thelateral PSF was approximated by means of fitting thelateral intensity profile of each sphere to a Gaussianfunction.
4. Results
A. Simulation
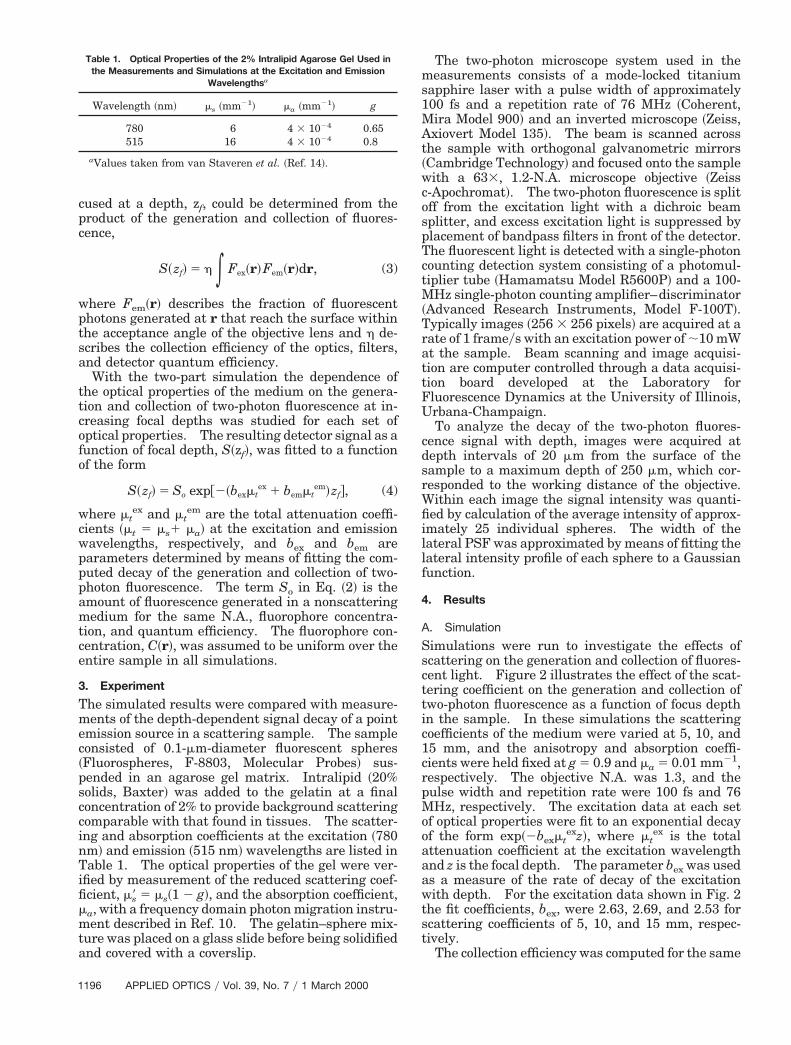
Simulations were run to investigate the effects ofscattering on the generation and collection of fluores-cent light. Figure 2 illustrates the effect of the scat-tering coefficient on the generation and collection oftwo-photon fluorescence as a function of focus depthin the sample. In these simulations the scatteringcoefficients of the medium were varied at 5, 10, and15 mm, and the anisotropy and absorption coeffi-cients were held fixed at g 5 0.9 and ma 5 0.01 mm21,respectively. The objective N.A. was 1.3, and thepulse width and repetition rate were 100 fs and 76MHz, respectively. The excitation data at each setof optical properties were fit to an exponential decayof the form exp~2bexmt
exz!, where mtex is the total
attenuation coefficient at the excitation wavelengthand z is the focal depth. The parameter bex was usedas a measure of the rate of decay of the excitationwith depth. For the excitation data shown in Fig. 2the fit coefficients, bex, were 2.63, 2.69, and 2.53 forscattering coefficients of 5, 10, and 15 mm, respec-tively.
The collection efficiency was computed for the same
gFtmfla
c
three scattering coefficients, and the results areshown in Fig. 2 as a function of depth. These datawere also fit to an exponential decay of the formexp~2bemmt
emz!, and the fit coefficients, bem, were0.59, 0.49, and 0.40 for scattering coefficients of 5, 10,and 15 mm, respectively. Comparison of the gener-ation and collection efficiency decay rates shows thatthe generation of two-photon fluorescence falls offwith depth considerably faster than does the signalcollection.
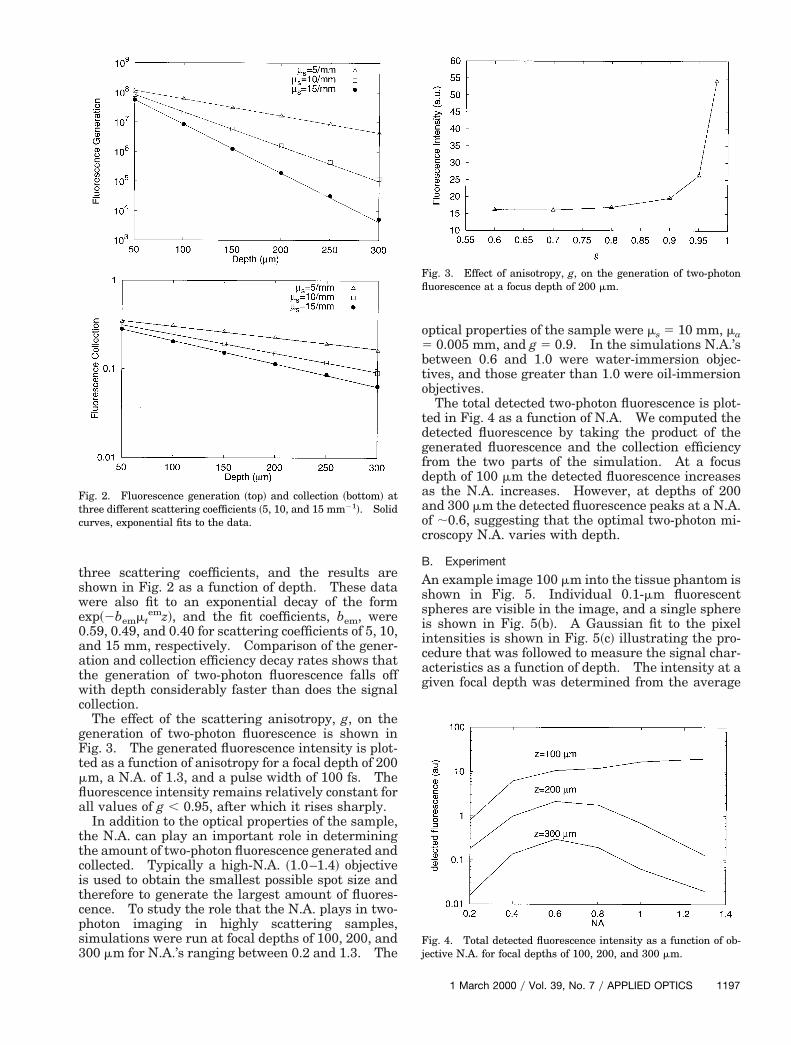
The effect of the scattering anisotropy, g, on theeneration of two-photon fluorescence is shown inig. 3. The generated fluorescence intensity is plot-
ed as a function of anisotropy for a focal depth of 200m, a N.A. of 1.3, and a pulse width of 100 fs. Theuorescence intensity remains relatively constant forll values of g , 0.95, after which it rises sharply.In addition to the optical properties of the sample,
the N.A. can play an important role in determiningthe amount of two-photon fluorescence generated andcollected. Typically a high-N.A. ~1.0–1.4! objectiveis used to obtain the smallest possible spot size andtherefore to generate the largest amount of fluores-cence. To study the role that the N.A. plays in two-photon imaging in highly scattering samples,simulations were run at focal depths of 100, 200, and300 mm for N.A.’s ranging between 0.2 and 1.3. The
Fig. 2. Fluorescence generation ~top! and collection ~bottom! atthree different scattering coefficients ~5, 10, and 15 mm21!. Solidurves, exponential fits to the data.
optical properties of the sample were ms 5 10 mm, ma5 0.005 mm, and g 5 0.9. In the simulations N.A.’sbetween 0.6 and 1.0 were water-immersion objec-tives, and those greater than 1.0 were oil-immersionobjectives.
The total detected two-photon fluorescence is plot-ted in Fig. 4 as a function of N.A. We computed thedetected fluorescence by taking the product of thegenerated fluorescence and the collection efficiencyfrom the two parts of the simulation. At a focusdepth of 100 mm the detected fluorescence increasesas the N.A. increases. However, at depths of 200and 300 mm the detected fluorescence peaks at a N.A.of ;0.6, suggesting that the optimal two-photon mi-croscopy N.A. varies with depth.
B. Experiment
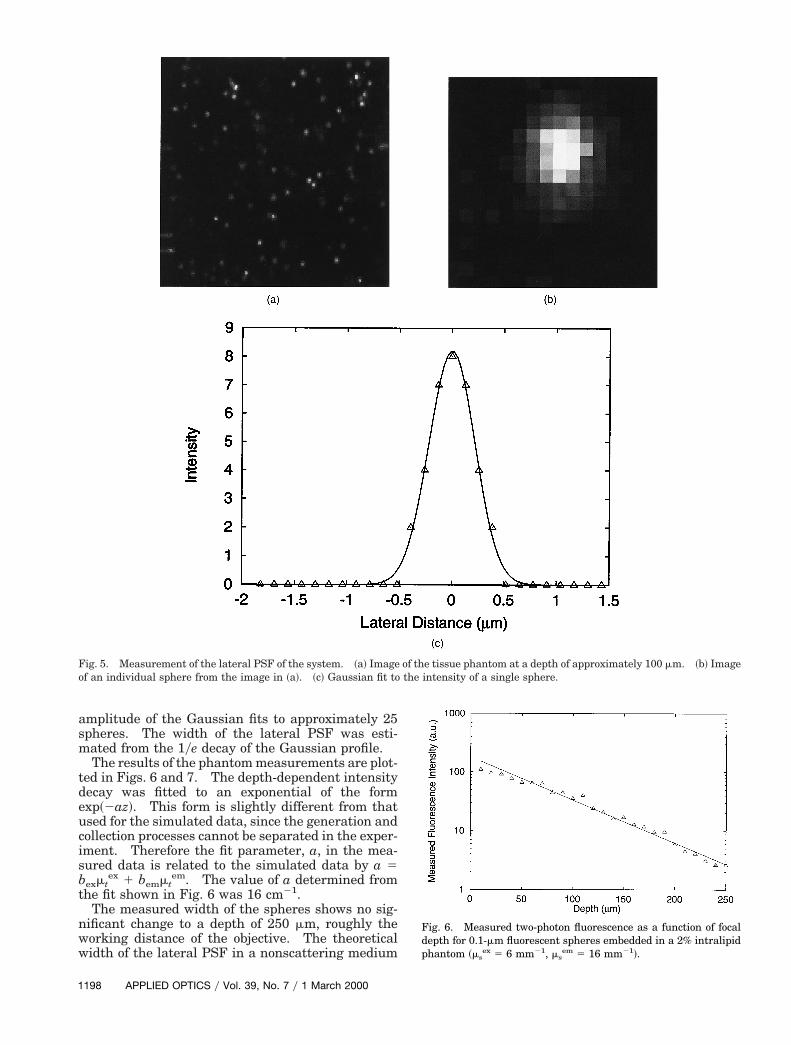
An example image 100 mm into the tissue phantom isshown in Fig. 5. Individual 0.1-mm fluorescentspheres are visible in the image, and a single sphereis shown in Fig. 5~b!. A Gaussian fit to the pixelintensities is shown in Fig. 5~c! illustrating the pro-cedure that was followed to measure the signal char-acteristics as a function of depth. The intensity at agiven focal depth was determined from the average
Fig. 3. Effect of anisotropy, g, on the generation of two-photonfluorescence at a focus depth of 200 mm.
Fig. 4. Total detected fluorescence intensity as a function of ob-jective N.A. for focal depths of 100, 200, and 300 mm.
1 March 2000 y Vol. 39, No. 7 y APPLIED OPTICS 1197
ww
1
amplitude of the Gaussian fits to approximately 25spheres. The width of the lateral PSF was esti-mated from the 1ye decay of the Gaussian profile.
The results of the phantom measurements are plot-ted in Figs. 6 and 7. The depth-dependent intensitydecay was fitted to an exponential of the formexp~2az!. This form is slightly different from thatused for the simulated data, since the generation andcollection processes cannot be separated in the exper-iment. Therefore the fit parameter, a, in the mea-sured data is related to the simulated data by a 5bexmt
ex 1 bemmtem. The value of a determined from
the fit shown in Fig. 6 was 16 cm21.The measured width of the spheres shows no sig-
nificant change to a depth of 250 mm, roughly theorking distance of the objective. The theoreticalidth of the lateral PSF in a nonscattering medium
Fig. 5. Measurement of the lateral PSF of the system. ~a! Imageof an individual sphere from the image in ~a!. ~c! Gaussian fit to
of the tissue phantom at a depth of approximately 100 mm. ~b! Imagethe intensity of a single sphere.
198 APPLIED OPTICS y Vol. 39, No. 7 y 1 March 2000
Fig. 6. Measured two-photon fluorescence as a function of focaldepth for 0.1-mm fluorescent spheres embedded in a 2% intralipidphantom ~ms
ex 5 6 mm21, msem 5 16 mm21!.
;
Ndtpaits
i
cTpmt
~sbdm
ids
for this set of parameters is approximately 0.35 mm,11
which is close to the measured value.
5. Discussion
The signal degradation was decomposed into twocomponents in our model: attenuation of excitationphotons and attenuation of fluorescence. The prod-uct of the two components yields a quantity propor-tional to the measured signal intensity. Figure 2illustrates the two components at different levels ofscattering and shows that each is well described byan exponential attenuation. The slope of the expo-nential decay for the collection efficiency of the fluo-rescent photons ranges between 0.4 and 0.59. Sincethis value is less than unity ~i.e., bem 5 1 for single-scattering behavior!, there is a clear indication thatmultiply scattered photons are collected by the objec-tive lens and subsequently detected. The excitationof two-photon fluorescence however, decays more rap-idly with a relatively large decay coefficient, bex, of
2.5. Since bem 5 2 would be expected for single-scattering attenuation in a two-photon process, thissuggests that ballistic photons are the primary sourceof excitation. The calculated value of 2.5 suggeststhat the average photon path length is slightlygreater than the linear distance between the samplesurface and the focal plane. This observation is con-sistent with our understanding of the enhanced scat-tering probability for high-incidence-angle photonsemerging from high-N.A. objectives.
In two-photon imaging, objectives with the highestavailable N.A. are typically used, since this results inthe smallest spot size and the greatest instantaneousexcitation intensity. In highly scattering media atrade-off exists between the smallest spot size andthe increased attenuation of excitation photons athigh N.A.’s. This is because photons propagatingalong the outer cone of light at high-objective N.A.’shave an incidence angle as high as 60°. Althoughthis effect is not seen in transparent media, in turbidsamples these photons must travel a longer distance
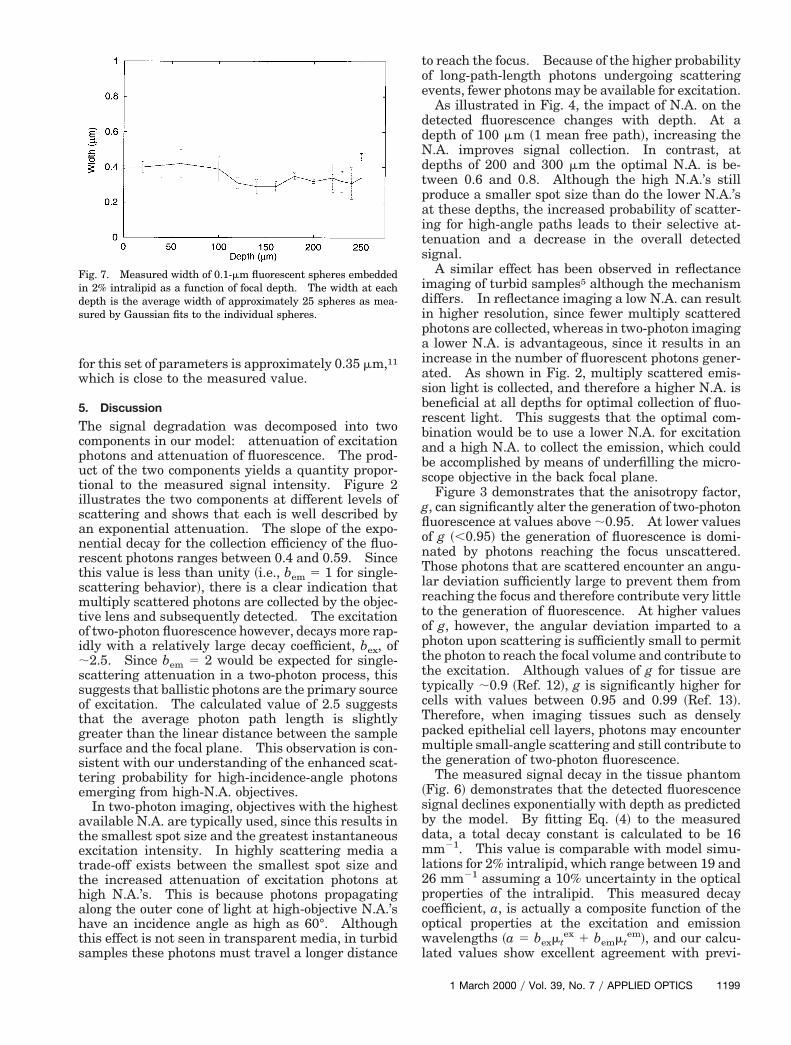
Fig. 7. Measured width of 0.1-mm fluorescent spheres embeddedn 2% intralipid as a function of focal depth. The width at eachepth is the average width of approximately 25 spheres as mea-ured by Gaussian fits to the individual spheres.
to reach the focus. Because of the higher probabilityof long-path-length photons undergoing scatteringevents, fewer photons may be available for excitation.
As illustrated in Fig. 4, the impact of N.A. on thedetected fluorescence changes with depth. At adepth of 100 mm ~1 mean free path!, increasing the
.A. improves signal collection. In contrast, atepths of 200 and 300 mm the optimal N.A. is be-ween 0.6 and 0.8. Although the high N.A.’s stillroduce a smaller spot size than do the lower N.A.’st these depths, the increased probability of scatter-ng for high-angle paths leads to their selective at-enuation and a decrease in the overall detectedignal.A similar effect has been observed in reflectance
maging of turbid samples5 although the mechanismdiffers. In reflectance imaging a low N.A. can resultin higher resolution, since fewer multiply scatteredphotons are collected, whereas in two-photon imaginga lower N.A. is advantageous, since it results in anincrease in the number of fluorescent photons gener-ated. As shown in Fig. 2, multiply scattered emis-sion light is collected, and therefore a higher N.A. isbeneficial at all depths for optimal collection of fluo-rescent light. This suggests that the optimal com-bination would be to use a lower N.A. for excitationand a high N.A. to collect the emission, which couldbe accomplished by means of underfilling the micro-scope objective in the back focal plane.
Figure 3 demonstrates that the anisotropy factor,g, can significantly alter the generation of two-photonfluorescence at values above ;0.95. At lower valuesof g ~,0.95! the generation of fluorescence is domi-nated by photons reaching the focus unscattered.Those photons that are scattered encounter an angu-lar deviation sufficiently large to prevent them fromreaching the focus and therefore contribute very littleto the generation of fluorescence. At higher valuesof g, however, the angular deviation imparted to aphoton upon scattering is sufficiently small to permitthe photon to reach the focal volume and contribute tothe excitation. Although values of g for tissue aretypically ;0.9 ~Ref. 12!, g is significantly higher forells with values between 0.95 and 0.99 ~Ref. 13!.herefore, when imaging tissues such as denselyacked epithelial cell layers, photons may encounterultiple small-angle scattering and still contribute to
he generation of two-photon fluorescence.The measured signal decay in the tissue phantom
Fig. 6! demonstrates that the detected fluorescenceignal declines exponentially with depth as predictedy the model. By fitting Eq. ~4! to the measuredata, a total decay constant is calculated to be 16m21. This value is comparable with model simu-
lations for 2% intralipid, which range between 19 and26 mm21 assuming a 10% uncertainty in the opticalproperties of the intralipid. This measured decaycoefficient, a, is actually a composite function of theoptical properties at the excitation and emissionwavelengths ~a 5 bexmt
ex 1 bemmtem!, and our calcu-
lated values show excellent agreement with previ-
1 March 2000 y Vol. 39, No. 7 y APPLIED OPTICS 1199
ta
17
a
~brEo
mssmwpTdcsa
ofia9G
Table 2. Optical Properties of Cervical Epithelium Used in the
1
ously reported measurements of the opticalproperties of 2% intralipid.14
The lateral resolution is unaffected by scatteringup to a depth of 250 mm as illustrated in Fig. 7, wherethe measured width of the lateral point spread re-mains relatively constant. This indicates that thelimiting factor in imaging in turbid samples is a lackof signal rather than a loss of resolution, which is inagreement with previous studies of confocal15 andtwo-photon16 imaging.
With the expression for the two-photon fluores-cence signal decay given by Eq. ~4!, predictions on themaximum imaging depth can be made for a givenset of experimental parameters and tissue opticalproperties on the basis of an estimation of the signal-to-noise ratio. The signal-to-noise ratio in photon-counting mode can be written as17
SNR 5NsÎt
@Ns 1 2~Nd 1 Nb!#1y2 , (5)
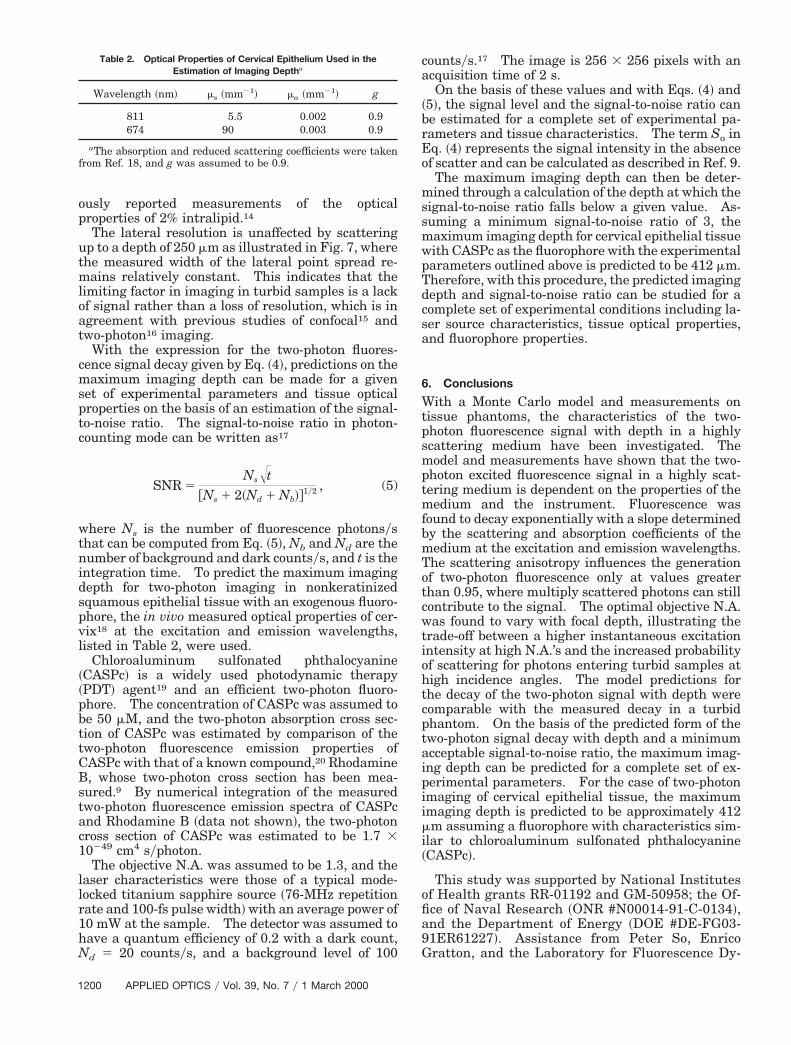
where Ns is the number of fluorescence photonsysthat can be computed from Eq. ~5!, Nb and Nd are thenumber of background and dark countsys, and t is theintegration time. To predict the maximum imagingdepth for two-photon imaging in nonkeratinizedsquamous epithelial tissue with an exogenous fluoro-phore, the in vivo measured optical properties of cer-vix18 at the excitation and emission wavelengths,listed in Table 2, were used.
Chloroaluminum sulfonated phthalocyanine~CASPc! is a widely used photodynamic therapy~PDT! agent19 and an efficient two-photon fluoro-phore. The concentration of CASPc was assumed tobe 50 mM, and the two-photon absorption cross sec-tion of CASPc was estimated by comparison of thetwo-photon fluorescence emission properties ofCASPc with that of a known compound,20 RhodamineB, whose two-photon cross section has been mea-sured.9 By numerical integration of the measuredwo-photon fluorescence emission spectra of CASPcnd Rhodamine B ~data not shown!, the two-photon
cross section of CASPc was estimated to be 1.7 310249 cm4 syphoton.
The objective N.A. was assumed to be 1.3, and thelaser characteristics were those of a typical mode-locked titanium sapphire source ~76-MHz repetitionrate and 100-fs pulse width! with an average power of10 mW at the sample. The detector was assumed tohave a quantum efficiency of 0.2 with a dark count,Nd 5 20 countsys, and a background level of 100
Estimation of Imaging Deptha
Wavelength ~nm! ms ~mm21! ma ~mm21! g
811 5.5 0.002 0.9674 90 0.003 0.9
aThe absorption and reduced scattering coefficients were takenfrom Ref. 18, and g was assumed to be 0.9.
200 APPLIED OPTICS y Vol. 39, No. 7 y 1 March 2000
countsys. The image is 256 3 256 pixels with ancquisition time of 2 s.On the basis of these values and with Eqs. ~4! and
5!, the signal level and the signal-to-noise ratio cane estimated for a complete set of experimental pa-ameters and tissue characteristics. The term So inq. ~4! represents the signal intensity in the absencef scatter and can be calculated as described in Ref. 9.The maximum imaging depth can then be deter-ined through a calculation of the depth at which the
ignal-to-noise ratio falls below a given value. As-uming a minimum signal-to-noise ratio of 3, theaximum imaging depth for cervical epithelial tissueith CASPc as the fluorophore with the experimentalarameters outlined above is predicted to be 412 mm.herefore, with this procedure, the predicted imagingepth and signal-to-noise ratio can be studied for aomplete set of experimental conditions including la-er source characteristics, tissue optical properties,nd fluorophore properties.
6. Conclusions
With a Monte Carlo model and measurements ontissue phantoms, the characteristics of the two-photon fluorescence signal with depth in a highlyscattering medium have been investigated. Themodel and measurements have shown that the two-photon excited fluorescence signal in a highly scat-tering medium is dependent on the properties of themedium and the instrument. Fluorescence wasfound to decay exponentially with a slope determinedby the scattering and absorption coefficients of themedium at the excitation and emission wavelengths.The scattering anisotropy influences the generationof two-photon fluorescence only at values greaterthan 0.95, where multiply scattered photons can stillcontribute to the signal. The optimal objective N.A.was found to vary with focal depth, illustrating thetrade-off between a higher instantaneous excitationintensity at high N.A.’s and the increased probabilityof scattering for photons entering turbid samples athigh incidence angles. The model predictions forthe decay of the two-photon signal with depth werecomparable with the measured decay in a turbidphantom. On the basis of the predicted form of thetwo-photon signal decay with depth and a minimumacceptable signal-to-noise ratio, the maximum imag-ing depth can be predicted for a complete set of ex-perimental parameters. For the case of two-photonimaging of cervical epithelial tissue, the maximumimaging depth is predicted to be approximately 412mm assuming a fluorophore with characteristics sim-ilar to chloroaluminum sulfonated phthalocyanine~CASPc!.
This study was supported by National Institutesf Health grants RR-01192 and GM-50958; the Of-ce of Naval Research ~ONR #N00014-91-C-0134!,nd the Department of Energy ~DOE #DE-FG03-1ER61227!. Assistance from Peter So, Enricoratton, and the Laboratory for Fluorescence Dy-
berg, “Frequency-domain photon migration measurements of
namics in the construction of the two-photon micro-scope is gratefully acknowledged.References1. W. Denk, J. Strickler, and W. Webb, “Two-photon laser scan-
ning fluorescence microscopy,” Science 248, 78–76 ~1990!.2. K. H. Kim, C. Buehler, C.-Y. Dong, B. R. Masters, and P. T. C.
So, “Tissue imaging using two-photon video rate microscopy,”in Optical Diagnostics of Living Cells II, D. L. Farkas, R. C.Leif, and B. J. Tromberg, Proc. SPIE 3604, 60–66 ~1999!.
3. D. Kleinfeld, P. Mitra, F. Helmchen, and W. Denk, “Fluctua-tions and stimulus-induced changes in blood flow observed inindividual capillaries in layers 2 through 4 of rat neocortex,”Proc. Natl. Acad. Sci. USA 95, 15741–15746 ~1998!.
4. J. Schmitt, A. Knuttel, and M. Yadlowski, “Confocal micros-copy in turbid media,” J. Opt. Soc. Am. A 11, 2226–2235~1994!.
5. X. Gan, S. Schilders, and M. Gu, “Image formation in turbidmedia under a microscope,” J. Opt. Soc. Am. A 15, 2052–2058~1998!.
6. A. Dunn, C. Smithpeter, R. Richards-Kortum, and A. J. Welch,“Sources of contrast in confocal reflectance imaging,” Appl.Opt. 35, 3441–3446 ~1996!.
7. D. Smithies, T. Lindmo, Z. Chen, J. Nelson, and T. Milner,“Signal attenuation and localization in optical coherence to-mography studied by Monte Carlo simulation,” Phys. Med.Biol. 43, 3025–3044 ~1998!.
8. X. Gan and M. Gu, “Effective point-spread function for fastimage modeling and processing in microscopic imagingthrough turbid media,” Opt. Lett. 24, 741–743 ~1999!.
9. C. Xu and W. Webb, “Measurement of two-photon excitationcross sections of molecular fluorophores with data from 690 to1050 nm,” J. Opt. Soc. Am. B 13, 481–491 ~1996!.
10. J. Fishkin, O. Coquoz, E. Anderson, M. Brenner, and B. Trom-
normal and malignant tissue optical properties in a humansubject,” Appl. Opt. 36, 10–20 ~1997!.
11. C. Sheppard and M. Gu, “Image formation in two-photon flu-orescence microscopy,” Optik 86, 104–106 ~1990!.
12. S. Jacques, C. Alter, and S. Prahl, “Angular dependence ofHeNe laser light scattering by human dermis,” Lasers Life Sci.1, 309–333 ~1987!.
13. A. Dunn and R. Richards-Kortum, “Three-dimensional compu-tation of light scattering from cells,” IEEE J. Sel. Top. Quan-tum Electron. 2, 898–905 ~1997!.
14. H. van Staveren, C. Moes, J. van Marle, S. Prahl, and M. vanGemert, “Light scattering in Intralipid-10% in the wavelengthrange of 400–1100 nm,” Appl. Opt. 30, 4507–4514 ~1991!.
15. C. L. Smithpeter, A. K. Dunn, A. J. Welch, and R. Richards-Kortum, “Penetration depth limits of in vivo confocal reflec-tance imaging,” Appl. Opt. 37, 2749–2754 ~1998!.
16. V. Centonze and J. White, “Multiphoton excitation providesoptical sections from deeper within scattering specimens thanconfocal imaging,” Biophys. J. 75, 2015–2024 ~1998!.
17. H. Kume, ed., Hamamatsu Photonics, Photomultiplier Tube:Principle to Application,“ ~Hamamatsu Photonics, Bridgewa-ter, N.J., 1994!.
18. R. Hornung, T. Pham, K. Keefe, J. Fishkin, M. Berns, Y. Tadir,and B. Tromberg, “Quantitative near infrared spectroscopy ofcervical dysplasia in vivo,” Hum. Reprod. 14, 2908–2916~1999!.
19. T. Farrel, B. Wilson, M. Patterson, and M. Olivio, “Comparisonof the in vivo photodynamic threshold dose for photofrin,mono- and tetrasulfonated aluminum phthalocyanine using arat liver model,” Photochem. Photobiol. 68, 394–399 ~1998!.
20. D. Oh, R. Stanley, M. Lin, W. Hoeffler, S. Boxer, M. Berns, andE. Bauer, “Two-photon excitation of 49-Hydroxylmethyl-4,59,8-Trimethylpsoralen,” Photochem. Photobiol. 65, 91–95 ~1997!.
1 March 2000 y Vol. 39, No. 7 y APPLIED OPTICS 1201