Embed Size (px)
Citation preview

Influence of Pacing Site Characteristics on Response to Cardiac
Resynchronization Therapy Wong et al: Pacing Site Scar and CRT Response
Jorge A. Wong, MD1; Raymond Yee, MD1; John Stirrat, BMSc2; David Scholl, BSc2;
Andrew D. Krahn, MD1; Lorne J. Gula, MD, MSc1; Allan C. Skanes, MD1;
Peter Leong-Sit, MD1; George J. Klein, MD1; David McCarty, MB BCh1;
Nowell Fine1, MD1; Aashish Goela, MD3; Ali Islam, MD3; Terry Thompson, PhD4,5,6;
Maria Drangova, PhD2,5,6; James A. White, MD1,2,4,5
1Division of Cardiology, Department of Medicine, University of Western Ontario (UWO), 2Imaging Laboratories - Robarts Research Institute, UWO
3Department of Medical Imaging, Schulich School of Medicine and Dentistry 4Lawson Health Research Institute, UWO,
5Biomedical Imaging Research Centre (BIRC), UWO 6Department of Medical Biophysics, UWO, London, Ontario, Canada
Correspondence to: Dr James A. White 3T-7T MRI Unit - Robarts Research InstitutePO Box 5015, 100 Perth Drive London, Ontario, Canada, N6A 5K8Tel: 519-931-5244 Fax: 519 931-5262 E-mail [email protected]
DOI: 10.1161/CIRCIMAGING.111.000146
Journal Subject Codes: 110, 120, 30, 106
ity of Westernn OOO
IInstititititiiitutututututututetetetetetete, ,, UWUWUWUWUWUWUWOOOOOOO
ment of Medical Imaging, Schulich School of Medicine and
p a
mentntntntnt ooof f ff f MeMeMeMeMedidddd cal Imaging, Schulululululiciiii h School ooooof ffff Medicine and44444LaLaLaLL wswswswssononononon HHHHHeaeaeaeaealtltlttlthh hh RRReRR seararrchhhhh Insnsnsnsnstiitutuutte,, UWUWUWWWO,O,O,O,O
55555BiBiBBiB omomomomomedededededicicicccalalalalal Imamamamamagigigigiginggggg RRRRReseseseseseaeaeaeaearcrcrcrcrchhhhh CCCCCenenenenentrtrtrtrtree eee (B(B(B(B(BIRIRIRIRIRC)C)C)C)C),,, UWUWUWUWUWO OOOO
partment of MeMeMeMeMedidididdicacacacc ll ll BiBiBiBiBiopopopopophyhyhyhyhysisisisisicscscscsc , UUUUUWOWOWOWOWO, LoLoLoLoLondndndndndononononn, , , , OOOnOO tario, Ca
by guest on March 10, 2018
http://circimaging.ahajournals.org/
Dow
nloaded from

2
Abstract
Background—Transmural scar occupying left ventricular pacing regions has been associated
with reduced response to cardiac resynchronization therapy (CRT). However, spatial influences
of lead tip delivery relative to scar at both pacing sites remains poorly explored. This study
evaluated scar distribution relative to left ventricular (LV) and right ventricular (RV) lead tip
placement through co-registration of Late Gadolinium Enhancement (LGE) MRI and cardiac
computed tomography (CT) findings. Influences on CRT response were assessed by serial
echocardiography.
Methods and Results—Sixty patients receiving CRT underwent pre-implant LGE-MRI, post-
implant cardiac CT and serial echocardiography. Blinded segmental evaluations of mechanical
delay, percent scar burden, and lead tip location were performed. Response to CRT was defined
as a reduction in LVESV 15% at 6 months. The mean age and LVEF were 64±9 years and
25±7%, respectively. Mean scar volume was higher among CRT non-responders for both the
LV [23±23 vs. 8±14% (p=0.01) and RV pacing regions [40±32 vs. 24±30% (p=0.04)].
Significant pacing region scar was identified in 13% of LV pacing regions and 37% of RV
pacing regions. Absence of scar in both regions was associated with an 81% response rate,
compared to 55%, 25% and 0%, respectively when the RV, LV or both pacing regions contained
scar. LV pacing region dysynchrony was not predictive of response.
Conclusions—Myocardial scar occupying the LV pacing region is associated with non-response
to CRT. Scar occupying the RV pacing region is encountered at higher frequency and appears to
provide a more intermediate influence on CRT response.
Key Words: cardiac resynchronization therapy, cardiac magnetic resonance imaging, late
gadolinium enhancement, dyssynchrony, cardiac computed tomography, scar, response
nt pre implannnnnnnt t t tt tt
mentataaaaaal l l l l l eveveveveveve alalalalalalaluauauauauauauatititititititiono
b C
V e
y d
buuuuurdrdrdrdr en, anananannd d d dd leeeeeadadadadad tttttipipipipip lllllocococococatatatata iooooon nn nn werrre ppppperererererfofofofoformrmrmrrmededededed. ReReReReRespspspspsponononononsesesesese tttttooooo C
VESESESESESVVVVV 15151555%%%%% atatatatat 6 mmmmmoonooo thhhhhsss. ThThThThThee eee mememememeananananan aaaaaggggge eeee ananand dddd LVLVLVLVLVEFEFEFEFEF wwwwwerererrre
yyy. MeMeMeananan ssscacacarrr vovovolululumememe wwwasasas hihihighghghgg ererer aaaaamomomongngnggg CCCCRTRTRT nnnononon rr-resesespopopondndnd
by guest on March 10, 2018
http://circimaging.ahajournals.org/
Dow
nloaded from

3
Abbreviations:
LV = Left Ventricle
RV = Right Ventricle
EF = Ejection Fraction
CRT = Cardiac Resynchronization Therapy
NYHA = New York Heart Association
CAD = Coronary Artery Disease
ICM = Ischemic Cardiomyopathy
DCM = Dilated Cardiomyopathy
QOL = Quality of Life
6-MWT = 6 minute walk test
MLWH = Minnesota Living with Heart Failure
DE-MRI = Delayed Enhancement Magnetic Resonance Imaging
EDV = End Diastolic Volume
ESV = End Systolic Volume
LBBB = Left Bundle Branch Block
RBBB = Right Bundle Branch Block
a Living ith H art F il re
c
a LLLLLiviviviviviiiingngngngng wwwwwititititith Heart Failure
EEEEEnnnhancememeent MMMMMaggagaagnetititititic RRResosoonaancnncce ee ee ImImImImImaggingg
c Volllume
VVV lolumeeeee
by guest on March 10, 2018
http://circimaging.ahajournals.org/
Dow
nloaded from

4
Systolic heart failure is the leading cause of cardiovascular morbidity and mortality in North
America, consuming over $20 billion per year of global health care expenditures1. Therapeutic
strategies currently include cardiac resynchronization therapy (CRT), a permanent pacing
therapy aimed at correcting dysynchronous mechanical activation of the left ventricle (LV)
through simultaneous pacing of the right ventricular (RV) septum and the lateral wall (via a
coronary sinus lead).2 While CRT has been shown to reduce symptoms and mortality in select
heart failure patients2-9 up to 30-40% of candidates may not respond.10, 11 Reasons for response
failure appear multi-factorial, with 3 dominant variables implicated to date: i) lack of LV
dyssynchrony12, 13, ii) geographic placement of the LV lead14-19, and iii) scar within the LV
pacing region.20-22 Preliminary evidence similarly suggests absence of RV pacing region (ie:
septal wall) scar to be of importance for achieving response.23, 24 However, the relative and
combined influence of these variables on response to CRT has not been well studied.
In this prospective cohort study we combine findings from Late Gadolinium Enhancement
(LGE) Magnetic Resonance Imaging (MRI) and Cardiac-gated Computerized Tomography
(CCT) to achieve accurate geographic registration of myocardial scar and lead tip location for
both the LV and RV pacing leads. These findings are correlated to CRT response, as assessed by
serial echocardiography.
Methods
Study Population
Ninety-three consecutive patients referred for CRT between January 2008 and March 2011 at the
London Health Sciences Centre were screened for study eligibility. Inclusion criteria were: age
18 years, LV ejection fraction (EF) 35%, QRS duration 120 ms, NYHA class II and on
maximal tolerated medical therapy for 6 weeks. Exclusion criteria were: myocardial infarction
, and iii) sscacaccccc
senccccccce e e ee e ofofofofofofof RRRRRRRV V V V V V V papppp
of these variables on response to CRT has not been well stud
u
bbbbbeee e of iiiiimmmmmpopppp rtrtrtrtrtananananancecececece fffffororororor aaaachhhhhieieeviinnng rrrrresesesesespopopopoponsnsnsn e.e.e.e.e.mm 23, 24 HHHHHowowowowowevevevevevererererer,
of ffff thththththeseesese e eeee vavavaariririririababababablelelell s onononoon rrrrrespopopopoponsnsnsnsnseee ee tototototo CCCCCRTRTRTRTRT hhhhhasasasasas nnnnnototot bbbbbeeeeeeeeeen nnnn weweweww llllllllll ssssstututuuud
cohorttttt ssssstututututudydydydydy wwwwwe eeee cococooombmbmbmbmbininininine eeee fififififindndndndndininini gsgsgsgsgs fffffrororooom mmmm LaLaLaLaLatetetetete GGGGGadadadadadoliniu
by guest on March 10, 2018
http://circimaging.ahajournals.org/
Dow
nloaded from

5
or revascularization procedure 3 months, standard contraindications to MRI, and a GFR
30ml/min/1.73 m2.
Of all screened patients 63 satisfied study entry criteria and successfully completed baseline
evaluations. Screened patients were excluded for the following reasons; renal insufficiency (12),
existing pacemaker or implantable cardiac defibrillator (ICD) system (16), and severe
claustrophobia (2). Patients were classified according to cardiomyopathy etiology. Ischemic
cardiomyopathy (ICM) was defined as those with prior myocardial infarction (admission for
chest pain with cardiac marker elevation and/or development of new Q waves on ECG) or an
invasive coronary angiogram with obstructive coronary artery disease (CAD) ( 1 coronary artery
with 70% stenosis). Those patients not meeting these criteria were classified as dilated
cardiomyopathy (DCM).
Study Protocol
All patients received baseline clinical evaluations followed by LGE-MRI and a baseline
echocardiogram within 4 weeks of device implantation. An ECG-gated CCT was performed at
the 3-month device interrogation visit to establish lead tip location. A repeat echocardiogram
and clinical evaluation was performed at 3 and 6-months. Clinical evaluations, each performed
by an experienced research nurse, included a 12-lead ECG, NYHA class determination, 6-minute
walk test (6-MWT)25 and a quality of life (QOL) assessment using the Minnesota Living With
Heart Failure (MLWH) questionnaire.26 All imaging studies were blindly analyzed using to the
same 16-segment cardiac model27 with the use of standardized anatomic markers (RV insertion
site) to provide consistent segmental assignment. Using this model 2 geographic regions were
pre-defined: “Paced segment”; the segment below the pacing portion of the LV or RV lead tip,
ssssssseaeaeaeaeaeaeasesesesesesese (((((((CACACACACACACAD)D)D)D)D)D)D) (((((((
i llllllls). Those patients not meeting these criteria were clas
C
s). TTTThohohohh sessss pppppatients not meetingngngnn these critetetetteria were clas
CM)MMMM .
by guest on March 10, 2018
http://circimaging.ahajournals.org/
Dow
nloaded from

6
and: “Pacing region”; the paced segment plus corresponding segments sharing 50% of an
adjacently located border. For example, if the LV paced segment was segment 11 (mid
inferolateral wall) the LV pacing region was defined by segments 5, 10, 11, 12, 15 and 16.
The study protocol was approved by the University of Western Ontario’s ethics review board,
and all patients provided informed consent.
LGE-MRI Protocol and Image Analysis
LGE-MRI was performed using a 3.0 Tesla scanner (Trio or Verio, Siemens Medical Solutions,
Germany) equipped with a 32-channel cardiac coil. Retrospectively gated, breath-held cine
imaging was performed in serial short axis planes from the atrio-ventricular annulus to apex in
addition to 2, 3 and 4-chamber views. Typical pulse sequence parameters were: slice thickness 6
mm, gap 2 mm, TE 1.8 ms, flip angle 50, matrix 256 x 213, temporal resolution 30-35 ms, iPAT
= 2. Ten to fifteen minutes following 0.2 mmol/kg gadolinium chelate (Gadovist�, Bayer Inc.
Canada) administration, LGE imaging was performed using a standard inversion-recovery
gradient pulse sequence in matched slice orientations. The inversion time was manually adjusted
to provide optimal nulling of the normal myocardium, as previously described.28 Typical pulse
sequence parameters were: slice thickness = 6 mm, gap = 2 mm, TR = 800 ms, TE = 3.9 ms, flip
angle = 20 degrees, matrix 256 x 205, iPAT = 2.
CMR images were analyzed using commercially available visualization and analysis software
(CMR42, Circle Cardiovascular Imaging, Calgary, Canada). Short axis cine images were
analyzed to determine segmental measures of time to maximal wall thickening using FDA-
approved commercial software (CMR42, Circle Cardiovascular Inc., Calgary). Semi-automated
endocardial and epicardial contour tracing was performed throughout the cardiac cycle (all
phases) with the time to maximal wall thickness (TmWT) determined for each myocardial
o-vvvvvvvenenenenenenentrtrtrtrtrtrtriciciciciciciculululululululararararararar aaaaaaannnnnnn
4
n
m v
ti LGE i i f d i t d d if
4-c-c-c-c-chahahahahambmbmbmbmberrrrr vvvvviews. Typical pulslslslsseee sequencecccc pppppaaaraa ameters were:
11111.8.8.8.8.8 ms, ffffflippp annngggleee 555055 , ,,, mamamammatrixixix 2555666 x xx xx 212222 3, tttemmpopopopoporararararal reereeesossos llutiiooon
minutes follllllllowowowowowinininnnggg gg 00.0.00.22222 mmmmmmmmmmololololol////kgkgkgkgkg gggggadadada olololo ininininiuiuiuiuium mmmm chchchhelelelele ate (Gadov
iti GLGLGEE ii ii ff dd ii t dd dd iiff by guest on March 10, 2018
http://circimaging.ahajournals.org/
Dow
nloaded from

7
segment, as previously described.21 As shown in Figure 1, 90 radial spokes (15 per segment)
were projected from the center of the LV with wall thickness calculated as the linear difference
in length from its intersection of the endocardial and epicardial borders. For each segment the
mean of 15 radial measurements were used to provide a mean wall thickness at each of the
cardiac phases. TmWT of the LV paced segment was defined as the time in milliseconds (ms)
required to reach maximal wall thickness for this segment, identified by CCT analysis.
An experienced investigator, blinded to patient identity, visually scored each myocardial
segment to identify those with “any myocardial scar”, defined as unequivocal signal
enhancement of the myocardium not felt to be due to image artifact. Quantitative assessment of
myocardial scar was performed by trained core-lab personnel using a signal-threshold based
analysis, and reported for the entire LV (total percent scar) and for each myocardial segment.
This was done using a Signal Threshold versus Reference Myocardium (STRM) approach, as
previously described29, 30, where a signal threshold of 5SD above the mean signal of normal
myocardium was used to define scar. With respect to the referenced myocardial region; careful
attention was paid to avoid tissue-blood and tissue-fat interfaces, and select only homogeneous
regions of signal-nulled tissue.
CCT Imaging Protocol and Image Analysis
Cardiac CT imaging was performed using a 64-slice CT scanner (Lightspeed VCT, GE Medical
Systems, USA) using standard acquisition protocols.31 As part of an expanded study protocol
(although not required for lead localization) contrast enhancement was employed with 80-100 cc
of iodinated contrast agent (VisipaqueTM (iodixanol), Amersham Health, Princeton, NJ)
administered. Typical imaging parameters were: slice thickness 0.625 mm, tube voltage 120 kV,
and tube current 550 mA, followed by a 40 cc saline flush. Image reconstruction was performed
ififfffffacacacact.t.t.tt.tt QQQQQQQuauauauauuu ntntntnnnn itititititititatatatatatatatiiiiiii
usinininininininggggggg aaaaaaa sisisisisisisigngngngngngngnalaaaap y p g g
e o
g R
d
p y p g g
ededed for the eeentntnttirerererere LLLLLVVV VV ((t((( otototal ppperrcccentntntntnt sssssccaccc r)r))r andndndn fofofofofor eaeaeaeaeachchchchch mmmmmyyyoy
g a SiSiSiSiSignal TTTTThreshhhholololoo d versus RRRReferennnce Myoyoyoyoyocardddium (STR
d292929, 303030, whwhwhwhwhererererereeeee a aaaa sisisisisignggnggnalalalalal ttthrhrhrhrhreseseseseshohohohoholdldldldld oooof fff 5S5S5S5S5SD DDDD abababababovovovovove eeee thththththeeeee mean
by guest on March 10, 2018
http://circimaging.ahajournals.org/
Dow
nloaded from

8
using retrospective ECG-gating to obtain the optimal phase for lead visualization with
overlapping 0.75 mm cross-sectional images reconstructed at 0.5mm and image matrix of 512 x
512 pixels.
Segmental assignment of the LV and RV lead tips were performed by a blinded interpreter using
a 3D multi-planar reconstruction (OsiriX, Version 3.7.1), as shown in Figure 2. To minimize
artifact related to the CRT lead system we reconstructed images using a 2.5mm slice thickness
and displayed this dataset using 3D multi-planar reconstruction (MPR), averaging signal of 4
consecutive slices (MIP thickness 10mm). The tips of the LV and RV lead were separately
localized on axial images and orthogonal short and long-axis projections generated. Using a
radial grid manually over-laid on the short axis view to mark standard segmental assignments
according to the AHA 16-segment model (6 basal, 6 mid and 4 apical)27 the segmental position
of the LV and RV leads were determined. The corresponding long axis view was used to
determine its basal, mid or apical position (equal division of the LV into 3 zones). For the LV
lead, pacing lead polarity (ie: ring to tip versus tip to ring) was incrementally considered to
ensure that the pacing portion of the lead was scored.
Echocardiography Imaging Protocol and Image Analysis
Standard 2D echocardiography was performed at baseline, 3 and 6 months using a 3.5 MHz
transducer (S5-1, Philips, Bothell, WA, USA) on commercially available equipment (iE33,
Philips, Eindhoven, Netherlands). Digitally captured images were stored for offline analysis
using the Xcelera software suite version 3.1 (Philips, Eindhoven, Netherlands). All imaging was
performed at end-expiration. The LV end-diastolic volume (LVEDV) and LV end-systolic
volume (LVESV) were determined using the biplane method of discs method (modified
Simpson’s technique)32 by an experienced, blinded echocardiographer.
ppppppprororororororojejejejejejejectctctctctctctioioioioioioionsnsnsnsnsnsns gegegegegegegennnnnnn
ddddddd dddddddy over laid on the short axis view to mark standard segme
H e
i
mid or pical position ( q division of the LV into 3 z n
y oveeveverrr lalaalaaidididd on the short axis vieieieieew to mark stsss andard segme
HAAAA 16-segmmmennnt mooomomoddelllll (666 basassal,, 6 mimimimimiddd dd annd 444 appppiiciii alllll)))))272727272 thehehhh ssse
leads were e eee dededededetetetetermrmrmrmrminininininededededed. ThThThTTheee cococococorrrr esesessspopopopopondndndndndinininining g ggg lololololong axis vi
mmidid oor r r rr apapapapapicicicicicalalalalal pppososososositititii ioioion n n (e(e(e(e(equququqq alalalaa dddddivivivivivisisisioioioioionn n nn ofofofff ttttthehehehehe LLLLLV V V VV ininininntottototo 33 zzonon
by guest on March 10, 2018
http://circimaging.ahajournals.org/
Dow
nloaded from

9
CRT device implantation
CRT devices with defibrillator capability were implanted in the standard fashion in all patients.
The LV pacing lead was inserted transvenously into the coronary sinus and positioned according
to standard clinical practice. The RV septal lead was routinely placed to the apical septal
segment in accordance with the site’s conventional practice. V-V intervals were set to 0 ms with
A-V intervals programmed to the manufacturer’s nominal settings. These settings were not
adjusted during the first 6-months of therapy.
Definition of Response to CRT
The primary outcome, echocardiographic response to CRT, was defined as a reduction in the
LVESV 15% at 6-months post implantation. Pre-defined thresholds for the following clinical
variables were used to define secondary clinical endpoints: NYHA functional class improvement
by 1 class, 6-MWT increase by 30m or 10%, and QOL score improvement (reduction) by 10
points.
Inter-observer and Intra-observer Reproducibility
Inter-observer and intra-observer reproducibility measures for scar analysis in this population
have been reported separately from our laboratory.30 To assess reproducibility of dysynchrony
measurement 10 randomly selected cases underwent blinded evaluations by 2 investigators
followed by a repeat evaluation by the first investigator on a separate day.
Statistical Methods
Continuous variables are expressed as the mean ± SD, while medians with 25th and 75th
percentiles are provided for non-normally distributed data. Categorical variables are expressed
as simple proportions. Univariate analysis to test for differences between responders and non-
as dededededededefififififififinenenenenenened dd d d dd asasasasasasas aaaaaaa
f
t l
T r
mmmmmonononononththththhsssss popopopoposstsss implantation. Prerereee-d-d-defined thththththreeeeessshss olds for the f
tooooo dddddefineeeee sseeecononondaaaaaryryryryry clililililinninicccall endddpoioioioiointntntntntss: NYNN HAHAAAA fffffunuuu ctctctctctioonnall cccl
T increase bybybyyy 303030030mmm mm ororororor 111110%0%0%0%0%, ananananand dddd QOQOQOQQ L LLL scscscscscororororore eeee imimimimprprprprprooovement (r
by guest on March 10, 2018
http://circimaging.ahajournals.org/
Dow
nloaded from

10
responders to CRT was performed using the Mann-Whitney U test for continuous variables and
Fisher’s Exact Test for categorical variables. Similar analyses were performed for improvement
in NYHA, 6-minute walk test and QOL. All endpoints were assessed at 6 months post CRT
device implantation. We constructed a multivariate logistic regression model to assess the
incremental association of MRI and baseline clinical variables to predict to occurrence of non-
response to CRT using backward stepwise selection (p<0.10 for entry and p>0.05 for removal).
Due to the number of events we limited covariates to comply with the general rule that 10 events
should be available for each variable tested.33,34 Reproducibility analyses were performed using
both linear regression analysis and Bland and Altman analysis. Sample size calculations were
performed a-priori based upon available literature20,23 and adequate power was ensured for the
selected primary outcome. All statistical tests were two-tailed and p value of <0.05 was regarded
as significant. S-Plus (version 8.0, Insightful Software, Seattle, WA) was used to perform the
statistical analyses.
Results
Baseline Patient Characteristics
Sixty of the 63 enrolled patients (95%) completed study follow-up and were included in final
analysis. Three patients did not complete initial (3-month) follow-up; two dying - one due to
heart failure and one due to device-unrelated sepsis - and one patient voluntarily withdrawing
from the study. Baseline patient characteristics are summarized in Table 1. The mean age was
64±9 years with 16 (27%) being female. The median baseline NYHA was 3 (IQR 3, 3). Referral
etiology was ICM in 25 patients (42%) and DCM in 35 (58%).
Baseline non-LGE MRI findings revealed a mean LVEF of 25.3±7.1%. No significant
. Sample sizeeeeeee cc
quatte e eeeee popopopopopopowewewewewewewer r r r rrr wawawwwww s
u
cococococ mmmem . AlAAAA l llll stssss aaaaatititititistststssticiicicicalalalalal tttttesesesese tstststst wwwwwereee e tttwo-o-o-o-o-tatatatatailllledededeed aaaaandndndndnd ppppp vvvvvalalalalalueueueueue ooooof f f f f <0<<<<
us (((((veveveveversrsrsrsrsioioioioionnnn 88888.00000, Innnnsisisisisighghghghghtfffffululululul SSSSSofofofofoftwtwtwtwtwararararreeee, SSSSSeaeaeaeaeatttttttttlllllnnn e,eeee WWWWWA)A)A)A)A) wwwwasasasass uuuuuseseses
by guest on March 10, 2018
http://circimaging.ahajournals.org/
Dow
nloaded from

11
differences in septal to LV paced segment mechanical delay was identified between ICM and
DCM cohorts (p=0.22). Mean segmental TmWT values for all 16 myocardial segments are
graphically shown in Figure 3. Univariate analysis showed the following to be associated with
non-response to CRT; lower GFR (p=0.04), higher NYHA class (p=0.04), ischemic
cardiomyopathy (p=0.01) and right bundle branch block (RBBB) (p=0.02). No dysynchrony
measure was predictive of CRT response.
Echocardiographic and Clinical Response to CRT
The primary endpoint was met in 42 patients (70%) at 6-months. Secondary endpoints were
achieved as follows; Improvement 1 NYHA class in 37 patients (62%), increase in 6-MWT
30m or by 10% in 37 patients (62%), and a reduction in MLWH score 10 in 39 patients
(65%).
CRT Lead Tip Locations by CCT
The RV lead tip was delivered to the apical septal segment in 100% of patients. The LV lead tip
was delivered to a posterolateral wall segment (basal or mid) in the majority of patients (59.0%),
a finding that was consistent between ICM and DCM cohorts (58.6% and 59.1%, respectively).
A graphical illustration of RV and LV lead placement for the population is shown in Figure 3.
Patients achieving the primary outcome were more likely to have had the LV lead placed on a
posterolateral wall segment (83%) versus those without response (50%).
Scar Burden and Distribution by LGE-MRI
Analysis of LGE imaging confirmed a higher prevalence and total burden of myocardial scar in
those with ICM versus those with DCM (Table 2). Overall, 25 patients with ICM (100%) and
27 patients with DCM (77%) showed any visible scar by LGE-MRI. Similarly, the mean total
enentststststststs (((((((66666662%2%2%2%2%2%2%))),),),),) iincncncncncncnc
n 37 patients (62%) d d i i 1
t
n 333337 77 7 7 papapapapatitittit enenenenentstt (62%), and a reereeredudddd ction innnnn MMMMMLWLLLL H score 1
tttioionsnsns bbyyyy CCCCTT
by guest on March 10, 2018
http://circimaging.ahajournals.org/
Dow
nloaded from

12
scar burden was significantly higher among those with ICM versus DCM (26.2±14.5% versus
5.9±7.2, p<0.001). Segmental scar analysis, shown in Figure 3, revealed the burden of scar to be
highest among the septal wall segments, irrespective of cardiomyopathy etiology.
The prevalence of transmural scar ( 50% wall thickness) within the LV paced segment was 7%,
with a prevalence of 22% for the RV paced segment. The prevalence of significant pacing
region (paced segment plus adjacent segments) scar, defined as 25% scar by volume, was 13%
for the LV pacing region and 37% for the RV pacing region. Patient examples are shown in
Figure 4.
Pacing Site Scar and Response to CRT
Total scar burden was not statistically different between those achieving and not achieving the
primary outcome (Table 2). This finding was consistent for both ischemic and non-ischemic
cohorts.
The results of segmental scar analysis among responders and non-responders are shown in Table
2. The mean scar volume of the LV pacing region was significantly lower in responders versus
non-responders (p=0.01) with a similar finding identified for the RV pacing region (p=0.04).
Thirty-four patients had no significant scar (<25%) in either the LV or RV pacing regions. Of
these patients 19% failed to achieve CRT response at 6-months (ie: response rate 81%). Twenty-
two patients had significant scar in the RV pacing region with 45% of this group having non-
response (ie: response rate 55%). Eight patients had significant scar in the LV pacing region with
75% having non-response (ie: response rate 25%). Among these patients 4 had significant scar in
both the LV and RV pacing regions, 100% having non-response to CRT at 6-months. The
relationship between pacing region scar and CRT response is graphically shown in Figure 5.
was not statistically different between those achieving and n
Table 2). This finding was consistent for both ischemic a
wasssss nonononon tt ttt stststststatttttiiisisistically different bebeebebetttween thosoooo e aaacaa hieving and n
Tababababablellll 2).).).)) ThTT iis finnnnndidddd ngngngngng wwwass cononnsiiiiistststststennnnnt fofoor bob ththththth isccccchehehhh mmicc a
by guest on March 10, 2018
http://circimaging.ahajournals.org/
Dow
nloaded from

13
LV pacing region scar 25% was the strongest independent predictor of CRT non-response
following adjustment for cardiomyopathy etiology with an odds ratio of 7.2 (95% CI 1.2 to 43.8,
p=0.03). By multivariate analysis, when LV and RV pacing region scar were entered into the
same model only LV pacing region scar remained predictive with an odds ratio of 7.7 (95% CI
1.3 to 46.3, p=0.03).
Secondary endpoints were achieved with high frequency among those with no scarring of LV or
RV pacing regions. Among these patients a reduction of NYHA class 1 was achieved in 82%,
an increase in 6MHW 30m in 82%, and a reduction in MLWH score 10 in 96% of patients.
While a trend towards reduction in these outcomes was seen among those with scarring of LV
and/or RV pacing regions, these differences were not statistically significant.
Inter-observer and Intra-observer Reproducibility
Good inter-observer reproducibility was seen for the measurement of dysychrony by SD16-
TmWT. The Pearson correlation coefficients for intra- and inter-observer measurements were
0.87 and 0.85, respectively. Corresponding Bland and Altman analyses showed non-significant
bias of -3.4 ms (-45.6 to 38.7 ms) and 19.4 (-22.9 to 61.7 ms), respectively.
Discussion
In this prospective, multimodality imaging study analyzing the effects of regional scar in relation
to lead tip localization on CRT response, the primary findings were as follows: 1. Scar in the LV
pacing region was observed in a minority of patients but was associated with a low CRT
response; 2. Scar occupying the RV pacing region was seen more commonly and was associated
momomomomomomongngngngngngng ttttttthohohohohohohosesesesesesese wwwwwwwititititititithhhhhhh
i iiiiiiifififififififigions, these differences were not statistically significant
I
r
gionssnsns, , , ththhthhessssseeeee differences were notoooo statisticallyyyyy significant.
Intntntntntrarararra-obbbbbsessss rvrvrverrr RRRepepepepeprororororodudududud ciciciibibibibibiliiityyyyy
rrr rerereprprprodododucucucibibibilililititityyy wawawasss seseseenenen fffororor ttthehehe mmmeaeaeasususurererememementntttnt ooofff dydydysysysyccc
by guest on March 10, 2018
http://circimaging.ahajournals.org/
Dow
nloaded from

14
with intermediate CRT response; 3. Presence of scar in both pacing regions was associated with
no response, whereas absence of scar in these regions was associated with the highest response
rate.
The over-arching goal of CRT is to advance electro-mechanical activation of the lateral wall
such that it becomes physiologically synchronous with the septal wall. If accomplished this
therapy can realize substantial improvement in stroke volume and cardiac performance.5 Studies
to date evaluating optimal patient selection and CRT delivery have focused primarily on
characteristics of the posterolateral wall, suggesting scar in this region to be associated with
lower rates of LV remodeling. 21, 22, 35, 36 Such findings led to the recent reporting of the first
randomized control trial of targeted LV lead placement in CRT.37 In this study, a reported 15%
improvement in CRT response was observed when LV leads were targeted to dysynchronous but
non-scarred myocardial segments; the latter defined by surrogate echocardiographic markers of
viability. Our current study presents the most comprehensive evaluation of scar burden relative
to lead tip delivery to date and confirms that scar within the LV pacing region, encountered in
approximately 1 out of 8 cases, is an important impediment to CRT response. Scar within the RV
pacing region is more common, being encountered in 1 out of 3 cases. This finding did not
provide an independent influence on CRT response among those also having LV pacing region
scar. However, a reduction in CRT response was appreciated among the whole population when
significant RV pacing region scar was present.
The potential relevance of RV pacing region scar was highlighted in a recent study by Duckett,
et al. that evaluated the feasibility of achieving a mid-septal RV pacing position among 50
consecutive patients receiving CRT. In this study a more conventional apical position was
conceded to in those patients with poor R-wave pacing amplitudes ( 5 mV) and identified that
thththththththeeeeeee rererererererecececececececentntntntntntnt rrrrrrrepepepepepepepooooooo
37 IIIIIII hhhhhhhiiiiiii dddddtrial of targeted LV lead placement in CRT In this study
T res nse was observed when LV leads were ta eted to y
d
nt stu y presents the most co prehensive evaluation of sca
triall oooof f ff f tatatatat rgggggete ed LV lead placememmmm nt in CRT.... In this study
TTTTT rrresponsee wawawass s obobobbbssess rvveded wheh n LVLVLVVV llllleaeeaee dss wererre tatatattargetetetetetedd too ddyd
dial segmentntntntnts;s;s;s;s; ttthehehehee lllllatatatatatteteteteer r r rr dededededefifififfinenenen d d d d bybybybb sssurururururrororororogagagagagatetetetete eeeeechchchchchocardiogr
ntnt sstutudydydyyy ppppprerererereseseseseentntntnn s s s s thththhhe e e momomomooststststst cccooooompmpmpmpmprererer hehehehehensnsnsnsnsivivivii e e e ee evevevevevalalalalaluauauauauatitititiononononon oof f scscaa
by guest on March 10, 2018
http://circimaging.ahajournals.org/
Dow
nloaded from

15
these patients had a 67% prevalence of septal scar by LGE imaging versus 33% in those where
adequate voltages were achieved. Septal wall scar by LGE imaging was associated with a lower
rate of LV remodeling at 6-months (20% versus 56%, p=0.02) within the context of this lead
placement strategy.24 Segmental characterization of LV lead position, LV dysynchrony or LV
pacing region scar were not evaluated. By comparison, our current study shows that the delivery
of both LV and RV pacing leads to non-scarred myocardium provides a robust 81% response
rate to CRT, versus 55% when significant scar is present in the RV pacing region, 25% when in
the LV pacing region, and 0% when present in both pacing regions.
The septal-predominant distribution of myocardial injury found among this referral population is
not unexpected. ICM patients are anticipated to be at higher likelihood of both heart failure and
LBBB when irreversible injury is realized in the LAD-territory (ie: septal wall). Similarly,
patients with DCM preferentially demonstrate non-ischemic fibrosis of the septum in advanced
stages of disease, a finding associated with worse prognosis.38 Irrespective of etiology,
mechanisms relating septal scar to non-response in CRT can be envisioned. First, electro-
mechanical advancement of the lateral wall is aimed at reducing afterload effects on the septum,
and re-engaging its contribution to stroke volume. Such contribution may not be enlisted if the
septum is substantially injured, limiting its capacity to augment stroke volume. Second, the aim
of RV paced stimulation to activate the LV myocardium simultaneous to paced stimulation of the
lateral wall may be violated by interposed scar. An introduction of electro-mechanical
dispersion can therefore be theorized. This latter concept presents one plausible role for
directing RV lead tips to alternate and viable geographic targets - similar to that proposed for the
LV lead. Indeed, the concept of mid-septal or RV outflow tract pacing has been shown to be
both feasible39-42 and potentially of clinical value24, 42. In a study by Haghjoo, et al. patients
amamamamamamamononononononong g gg g g g thththththththisisisisisisis rererererererefefefefefefeferrrrrr
lih dddddd fffffff bbbbbbb hhhhhM patients are anticipated to be at higher likelihood of both
r
p p
a findi g associated with worse prog osis. Irresp t
M papapap tittitienenenenentstttt aaaaare anticipated to be ataaaa higher likekekekekelihood of both
rsssssibibibibible injuuryyy isss rrrreaeeee lizez dd inn thhee LALALALALAD-DDDD terrrrittoooryyy y (ieee:e sseeptaalll
preferentiallllllylylylyly dddddememememmonononononstststststrararararatetetetete nnnnnononoon-i-i-iiiscscscscschehehemimimimimic ccc c fififififibrbrbrbrbrosososososisisisisis of the sep
aa ffinindididididingngngngng aaaaassssssssococococciaiaiaii teteted d d dd wiwiwiwiwithththhh wwwwworororo seseseee ppppprorororr gngngngngnosososososisisisisis..3838383838 IIIIIrrrrrrrrresespepep ctct
by guest on March 10, 2018
http://circimaging.ahajournals.org/
Dow
nloaded from

16
otherwise receiving optimal LV pacing (ie: those with LV leads delivered to the posterolateral
wall) had significantly higher CRT response rates when the RV lead was placed to the high
(basal) septum compared with conventional apical placement (70% vs. 30%, p=0.01).40 Further,
Duckett, et al., showed that mid-septal pacing was associated with improved response rate
compared with apical pacing (70% vs. 30%, p=0.01).24 However, whether the selective
placement of the RV lead to viable myocardial targets improves outcomes in this population
remains to be evaluated.
Clinical Implications
Our findings add justification for lead navigation approaches to optimal myocardial targets in
CRT. Several studies to date, inclusive of the current study, demonstrate that characteristics of
the LV pacing region strongly influence response to CRT21, 36, 37, 43-45 and support that lead
delivery to viable targets may be a pre-requisite for response to occur. We found that without
image-guidance the delivery of this lead to a scarred myocardial region occurs in 13% of cases
with 75% of these patients failing to respond. Navigation strategies to guide the LV lead to
viable targets is therefore of potential importance for this cohort. While the role of RV lead
navigation to optimal septal targets remains uncertain, recognition that scar within this region
may contribute to response failure justifies expanded exploration within larger cohort studies.
Study Limitations
This study must be considered in recognition of several limitations. First, this was a single-
center cohort study and was not sufficiently sized to evaluate clinical outcomes beyond the
surrogate of LV remodeling at 6-months. Second, while not the focus of the current paper, the
MRI-derived measure of mechanical dyssynchrony used in this study, adopted from Marsan, et
to opopopopopopoptititititititimamamamamamamal l lllll mymymymymymymyooooococo
i
o s
a o
ieseseseses ttttto dadadadadattettete, inclusive of the currrrrrent study,yyyy dddddeemememe onstrate that
onnnnn sssstronnnnnglglgglglyyy yy innffflueueueeuencncncncnceeeee rerereespspspspspooonseese tttttooooo CRCRCRCC TTT21, 3666, 377, 7 43-4454 aanddd s
argets may bbbbbeeeee aaaaa ppppprererrere-r-r-rrreqeqeqeqequiuiuiuiuisisisisisitetetetete ffffororororor rerrrr sppppponononoonsesesesese tttttooooo ocococococcucccc r. We fo
by guest on March 10, 2018
http://circimaging.ahajournals.org/
Dow
nloaded from

17
al.21 has not undergone rigorous clinical validation versus other measures of dyssynchrony, such
as tissue Doppler or strain imaging. Finally, signal-threshold based scar quantification is
inherently dependent upon user-selected regions for referencing of “normal” myocardium. In
this study we employed an STRM-based technique with careful attention to the selection of the
reference region. We also selected a higher signal threshold ( 5SD) to maximize
reproducibility, as previously described.30, 46 These technical factors must always be considered
when comparing values of scar burden between otherwise comparable studies. Alternate
techniques, such as the Full-Width Half of Maximum, may offer slightly superior reproducibility
in those with ischemic cardiomyopathy.30, 46 However, the inclusion of patients with dilated
cardiomyopathy in this study, a cohort recognized to have inconsistent results using this
technique30, limited analysis to an STRM-based approach.
Conclusions
Scar within the LV and RV pacing regions is associated with a lower response rate to CRT at 6-
months. Strategies aimed at the selective placement of pacing leads to non-scarred myocardial
targets appear justified.
Acknowledgements
The authors would like to thank Samuel Siu for his assistance in reviewing this manuscript and
Linda Marziali, Kris Carter (RN), Kim Krueger (RMT) and John Butler (RMT) for their
important contributions to this work.
clusion of patatatatatattieiiii
incocococoooonsnsnsnsnsnsnsisisisisissstetetetetetetentntntntntntnt rre
aanananananaaalaa ysis to oo o o anananann SSSSSTRTRTRTRTRM-M-M-M-M-bababababasesss d dd dd apaaa prprroaaaaachchchchch.. . .
by guest on March 10, 2018
http://circimaging.ahajournals.org/
Dow
nloaded from

18
Sources of Funding
Dr White is supported by a Clinician Scientist award with the Heart and Stroke Foundation of
Ontario, Canada. Dr Drangova is supported by a Career Scientist award from the Heart and
Stroke Foundation of Ontario. Dr Krahn is a Career Investigator of the Heart and Stroke
Foundation of Ontario. This research was supported in part by Heart and Stroke Foundation
grant # NA6488 (PI: J.A.W.), the Canada Foundation of Innovation Leaders Opportunity Fund
and the Ontario Research Fund, Imaging in Cardiovascular Therapeutics grant.
Disclosures
Dr White receives in-kind research support from Bayer, Inc. Canada, and has received
consultative fees from Medtronic, Inc. There are no other conflicts of interest or financial
relationships to disclose.
References
1. Cleland JG, Khand A, Clark A. The heart failure epidemic: Exactly how big is it? EurHeart J. 2001;22:623-626.
2. Abraham WT, Fisher WG, Smith AL, Delurgio DB, Leon AR, Loh E, Kocovic DZ, Packer M, Clavell AL, Hayes DL, Ellestad M, Trupp RJ, Underwood J, Pickering F, Truex C, McAtee P, Messenger J. Cardiac resynchronization in chronic heart failure. NEngl J Med. 2002;346:1845-1853.
3. Auricchio A, Stellbrink C, Sack S, Block M, Vogt J, Bakker P, Huth C, Schondube F, Wolfhard U, Bocker D, Krahnefeld O, Kirkels H. Long-term clinical effect of hemodynamically optimized cardiac resynchronization therapy in patients with heart failure and ventricular conduction delay. J Am Coll Cardiol. 2002;39:2026-2033.
4. Bristow MR, Saxon LA, Boehmer J, Krueger S, Kass DA, De Marco T, Carson P, DiCarlo L, DeMets D, White BG, DeVries DW, Feldman AM. Cardiac-resynchronization therapy with or without an implantable defibrillator in advanced chronic heart failure. N Engl J Med. 2004;350:2140-2150.
5. Cazeau S, Leclercq C, Lavergne T, Walker S, Varma C, Linde C, Garrigue S, Kappenberger L, Haywood GA, Santini M, Bailleul C, Daubert JC. Effects of multisite biventricular pacing in patients with heart failure and intraventricular conduction delay. NEngl J Med. 2001;344:873-880.
nc. CCCCCCCanananananananadadadadadadada,a,a,a,a,a,a, aaan
o e
l
References
omomomomo Meddddtrtrtrtrtrononono icicicicic,,,, , InInInInInc.cccc TTTTTheheheheh rerereree aree nonononono oooooththththhererr ccccconoo flflflflflicicicicictststststs ooooof f ff f ininininintett
lose.eeee
ReReRRR fefefff rererencncnceseses
by guest on March 10, 2018
http://circimaging.ahajournals.org/
Dow
nloaded from

19
6. Cleland JG, Daubert JC, Erdmann E, Freemantle N, Gras D, Kappenberger L, Tavazzi L. The effect of cardiac resynchronization on morbidity and mortality in heart failure. NEngl J Med. 2005;352:1539-1549.
7. Higgins SL, Hummel JD, Niazi IK, Giudici MC, Worley SJ, Saxon LA, Boehmer JP, Higginbotham MB, De Marco T, Foster E, Yong PG. Cardiac resynchronization therapy for the treatment of heart failure in patients with intraventricular conduction delay and malignant ventricular tachyarrhythmias. J Am Coll Cardiol. 2003;42:1454-1459.
8. Leclercq C, Walker S, Linde C, Clementy J, Marshall AJ, Ritter P, Djiane P, Mabo P, Levy T, Gadler F, Bailleul C, Daubert JC. Comparative effects of permanent biventricular and right-univentricular pacing in heart failure patients with chronic atrial fibrillation. Eur Heart J. 2002;23:1780-1787.
9. Tang AS, Wells GA, Talajic M, Arnold MO, Sheldon R, Connolly S, Hohnloser SH, Nichol G, Birnie DH, Sapp JL, Yee R, Healey JS, Rouleau JL. Cardiac-resynchronization therapy for mild-to-moderate heart failure. N Engl J Med. 2011;363:2385-2395.
10. Birnie DH, Tang AS. The problem of non-response to cardiac resynchronization therapy. Curr Opin Cardiol. 2006;21:20-26.
11. McAlister FA, Ezekowitz J, Hooton N, Vandermeer B, Spooner C, Dryden DM, Page RL, Hlatky MA, Rowe BH. Cardiac resynchronization therapy for patients with left ventricular systolic dysfunction: A systematic review. JAMA. 2007;297:2502-2514.
12. Bax JJ, Marwick TH, Molhoek SG, Bleeker GB, van Erven L, Boersma E, Steendijk P, van der Wall EE, Schalij MJ. Left ventricular dyssynchrony predicts benefit of cardiac resynchronization therapy in patients with end-stage heart failure before pacemaker implantation. Am J Cardiol. 2003;92:1238-1240.
13. Penicka M, Bartunek J, De Bruyne B, Vanderheyden M, Goethals M, De Zutter M, Brugada P, Geelen P. Improvement of left ventricular function after cardiac resynchronization therapy is predicted by tissue doppler imaging echocardiography. Circulation. 2004;109:978-983.
14. Ansalone G, Giannantoni P, Ricci R, Trambaiolo P, Fedele F, Santini M. Doppler myocardial imaging to evaluate the effectiveness of pacing sites in patients receiving biventricular pacing. J Am Coll Cardiol. 2002;39:489-499.
15. Becker M, Kramann R, Franke A, Breithardt OA, Heussen N, Knackstedt C, Stellbrink C, Schauerte P, Kelm M, Hoffmann R. Impact of left ventricular lead position in cardiac resynchronization therapy on left ventricular remodelling. A circumferential strain analysis based on 2d echocardiography. Eur Heart J. 2007;28:1211-1220.
16. Butter C, Auricchio A, Stellbrink C, Fleck E, Ding J, Yu Y, Huvelle E, Spinelli J. Effect of resynchronization therapy stimulation site on the systolic function of heart failure patients. Circulation. 2001;104:3026-3029.
17. Morgan JM, Delgado V. Lead positioning for cardiac resynchronization therapy: Techniques and priorities. Europace. 2009;11 Suppl 5:v22-28.
18. Singh JP, Klein HU, Huang DT, Reek S, Kuniss M, Quesada A, Barsheshet A, Cannom D, Goldenberg I, McNitt S, Daubert JP, Zareba W, Moss AJ. Left ventricular lead position and clinical outcome in the multicenter automatic defibrillator implantation trial-cardiac resynchronization therapy (madit-crt) trial. Circulation. 2011;123:1159-1166.
19. Ypenburg C, van Bommel RJ, Delgado V, Mollema SA, Bleeker GB, Boersma E, Schalij MJ, Bax JJ. Optimal left ventricular lead position predicts reverse remodeling and survival after cardiac resynchronization therapy. J Am Coll Cardiol. 2008;52:1402-1409.
, Spooner C,, DDDDDDDrn nnnnnn thththththththerererererererapapapapapapapy y y y y y y fofofofofofoforrr r r r r pppppppMAA.. 202020202020200707070707077;2;2;2;2;2;2;297979797979797:2:2
wick TH, Molhoek SG, Bleeker GB, van Erven L, Boersml EE, Schalij MJ. Left ventricular dyssynchrony predicts ba e.
M
ation therapy is predicted by tissue doppler imaging ec
wiccccck k k kk THTHTHTHTH, MoMMMM lhoek SG, Bleekekekekeker rrrr GB, van ErErErErErvevvvv n L, Boersml EEEEEE, Schchchchchalalalalalij MMMMMJ.JJJJ LLLLLefefefefeft tttt vevvvv ntnntntn rirr cuullar rr rr dydydydydyssssssynynynyy chchchchchrorrr nynynynyny ppppprererereredididididictctctctctsssss baatataatioioioiion therapappyyy in papppp tiennttts wwwith hh enenenenenddd-dd sstagagge hehehearrart fafafafailluure be. AmAmAmAmAm JJJJJ CCCCCarararrdididididiolooloo . 202020000303030303;9;9;9;9;92:::::12121212123838383838-1-1-11242424242400.000 Bartunek J,J,J,J,J, DDDDDeeeee BBBBBrururuuruynynynynyneeeee B,B,B,B,B, VVVVananananndedededd rhrhhheyeyeyeyeydededededen nnn n M,M,M,M,M, GoGGGG ethals M
GGGeeeeeelelelen n n PPP. IIImpmpmppprororovevevememementntnt ooofff leleleeeftftft vvvenenentrtrtriciciculullullararar fffunununctctctioioioatatatioionnn thhthhherererapapapyyy isiisi ppprereredididiid ctctctededddd bybbybb tttisisi sususueee dododd pppppplellerrr iimimi agagagininggg ececec
by guest on March 10, 2018
http://circimaging.ahajournals.org/
Dow
nloaded from

20
20. Bleeker GB, Kaandorp TA, Lamb HJ, Boersma E, Steendijk P, de Roos A, van der Wall EE, Schalij MJ, Bax JJ. Effect of posterolateral scar tissue on clinical and echocardiographic improvement after cardiac resynchronization therapy. Circulation. 2006;113:969-976.
21. Marsan NA, Westenberg JJ, Ypenburg C, van Bommel RJ, Roes S, Delgado V, Tops LF, van der Geest RJ, Boersma E, de Roos A, Schalij MJ, Bax JJ. Magnetic resonance imaging and response to cardiac resynchronization therapy: Relative merits of left ventricular dyssynchrony and scar tissue. Eur Heart J. 2009;30:2360-2367.
22. Ypenburg C, Schalij MJ, Bleeker GB, Steendijk P, Boersma E, Dibbets-Schneider P, Stokkel MP, van der Wall EE, Bax JJ. Impact of viability and scar tissue on response to cardiac resynchronization therapy in ischaemic heart failure patients. Eur Heart J. 2007;28:33-41.
23. White JA, Yee R, Yuan X, Krahn A, Skanes A, Parker M, Klein G, Drangova M. Delayed enhancement magnetic resonance imaging predicts response to cardiac resynchronization therapy in patients with intraventricular dyssynchrony. J Am Coll Cardiol. 2006;48:1953-1960.
24. Duckett SG, Ginks M, Shetty A, Kirubakaran S, Bostock J, Kapetanakis S, Gill J, Carr-White G, Razavi R, Rinaldi CA. Adverse response to cardiac resynchronisation therapy in patients with septal scar on cardiac mri preventing a septal right ventricular lead position. J Interv Card Electrophysiol. 2012;33:151-60.
25. Demers C, McKelvie RS, Negassa A, Yusuf S. Reliability, validity, and responsiveness of the six-minute walk test in patients with heart failure. Am Heart J. 2001;142:698-703.
26. Rector TS, Kubo SH, Cohn JN. Validity of the minnesota living with heart failure questionnaire as a measure of therapeutic response to enalapril or placebo. Am J Cardiol. 1993;71:1106-1107.
27. Cerqueira MD, Weissman NJ, Dilsizian V, Jacobs AK, Kaul S, Laskey WK, Pennell DJ, Rumberger JA, Ryan T, Verani MS. Standardized myocardial segmentation and nomenclature for tomographic imaging of the heart: A statement for healthcare professionals from the cardiac imaging committee of the council on clinical cardiology of the american heart association. Circulation. 2002;105:539-542.
28. Kim RJ, Fieno DS, Parrish TB, Harris K, Chen EL, Simonetti O, Bundy J, Finn JP, Klocke FJ, Judd RM. Relationship of mri delayed contrast enhancement to irreversible injury, infarct age, and contractile function. Circulation. 1999;100:1992-2002.
29. Amado LC, Gerber BL, Gupta SN, Rettmann DW, Szarf G, Schock R, Nasir K, Kraitchman DL, Lima JA. Accurate and objective infarct sizing by contrast-enhanced magnetic resonance imaging in a canine myocardial infarction model. J Am Coll Cardiol. 2004;44:2383-2389.
30. Gao P, Yee R, Gula L, Krahn AD, Skanes A, Leong-Sit P, Klein GJ, Stirrat J, Fine N, Pallaveshi L, Wisenberg G, Thompson TR, Prato F, Drangova M, White JA. Prediction of arrhythmic events in ischemic and dilated cardiomyopathy patients referred for implantable cardiac defibrillator: Evaluation of multiple scar quantification measures for late gadolinium enhancement magnetic resonance imaging. Circ Cardiovasc Imaging. 2012;5:448-456.
31. Cademartiri F, Schuijf JD, Mollet NR, Malagutti P, Runza G, Bax JJ, de Feyter PJ. Multislice ct coronary angiography: How to do it and what is the current clinical performance? Eur J Nucl Med Mol Imaging. 2005;32:1337-1347.
k J, Kapetanaaaaaaakikkkkkkararararararardididididididiacacacacacacac rrrrrrresesesesesesesynynynynynynynchchchchchchchrororooooo
g a sssssssepepepepepepeptatatatatatatal l l l l l riririririririghghghghghghght tterv Card Electrophysiol 2012 33 151 60
M nn 0K we b6D Weissman NJ Dilsizian V Jacobs AK Kaul S Laskey
tervrvrvrvrv CCCCCararararard ElEEEE ectrophysiol. 20122222;3;;;; 3:151-60.McMcMcMcMcKKKKeK lvieeee RRRRRS,S,S,,, NNNNNegegegegegasasasasassasasasasa AAAAA, YuYuYuYY suuuf S.S.S.SS. RRRRRelelleleliaiaiaiiabibiibiilililililityyyy, , ,, , vavavavavalililililidddddititititity,y,y,y,y, aaaaannnnnnututututte walk tteeestt t iiin ppppaaata ients wiittth hheeaeartrtrtrtrt fffffaiaa luurrre. AmAmAmm HHHeaaarrrt JJ. 202000JJKubububububoo ooo SHSHSHSHSH, CoCoCoCoCohnhnhnhh JJJJJNN.NNN VVVVValalalalalidididididititititity yyyy ofofofofof thththththeeeee mimimimiminnnnnnnn esee ototototota aaa lllill vivivvv ngngngngng wwwwwe as a measuuuuurerereere ooooof f f f f thththhherererererapapapapapeueueueueutititititicc ccc rerrespspspspsponooono sesesee tttttooooo enenenenenalallapapapapapririririril or placeb666 11-1101010777. DDD WeWeWeisiissmsmsmananan NNNJJJ DDDilililililsisiziiziiiananan VVV JaJaJacococobsbsbbb AAAAKKK KKKauauaullll SSSS LLLasasaskekeyyy
by guest on March 10, 2018
http://circimaging.ahajournals.org/
Dow
nloaded from

21
32. Lang RM, Bierig M, Devereux RB, Flachskampf FA, Foster E, Pellikka PA, Picard MH, Roman MJ, Seward J, Shanewise JS, Solomon SD, Spencer KT, Sutton MS, Stewart WJ. Recommendations for chamber quantification: A report from the american society of echocardiography's guidelines and standards committee and the chamber quantification writing group, developed in conjunction with the european association of echocardiography, a branch of the european society of cardiology. J Am Soc Echocardiogr. 2005;18:1440-1463.
33. Motulsky H. Intuitive biostatistics. Oxford Univeristy Press; 2010. 34. Peduzzi P, Concato J, Feinstein AR, Holford TR. Importance of events per independent
variable in proportional hazards regression analysis. Ii. Accuracy and precision of regression estimates. J Clin Epidemiol. 1995;48:1503-1510.
35. Becker M, Zwicker C, Kaminski M, Napp A, Altiok E, Ocklenburg C, Friedman Z, Adam D, Schauerte P, Marx N, Hoffmann R. Dependency of cardiac resynchronization therapy on myocardial viability at the lv lead position. JACC Cardiovasc Imaging. 2011;4:366-374.
36. Delgado V, van Bommel RJ, Bertini M, Borleffs CJ, Marsan NA, Arnold CT, Nucifora G, van de Veire NR, Ypenburg C, Boersma E, Holman ER, Schalij MJ, Bax JJ. Relative merits of left ventricular dyssynchrony, left ventricular lead position, and myocardial scar to predict long-term survival of ischemic heart failure patients undergoing cardiac resynchronization therapy. Circulation. 2011;123:70-78.
37. Khan FZ, Virdee MS, Palmer CR, Pugh PJ, O'Halloran D, Elsik M, Read PA, Begley D, Fynn SP, Dutka DP. Targeted left ventricular lead placement to guide cardiac resynchronization therapy: The target study: A randomized, controlled trial. Journal of the American College of Cardiology. 2012;59:1509-1518.
38. Assomull RG, Prasad SK, Lyne J, Smith G, Burman ED, Khan M, Sheppard MN, Poole-Wilson PA, Pennell DJ. Cardiovascular magnetic resonance, fibrosis, and prognosis in dilated cardiomyopathy. Journal of the American College of Cardiology. 2006;48:1977-1985.
39. Victor F, Mabo P, Mansour H, Pavin D, Kabalu G, de Place C, Leclercq C, Daubert JC. A randomized comparison of permanent septal versus apical right ventricular pacing: Short-term results. Journal of cardiovascular electrophysiology. 2006;17:238-242.
40. Haghjoo M, Bonakdar HR, Jorat MV, Fazelifar AF, Alizadeh A, Ojaghi-Haghjghi Z, Esmaielzadeh M, Sadr-Ameli MA. Effect of right ventricular lead location on response to cardiac resynchronization therapy in patients with end-stage heart failure. Europace. 2009;11:356-363.
41. Leclercq C, Cazeau S, Le Breton H, Ritter P, Mabo P, Gras D, Pavin D, Lazarus A, Daubert JC. Acute hemodynamic effects of biventricular ddd pacing in patients with end-stage heart failure. J Am Coll Cardiol. 1998;32:1825-1831.
42. Haghjoo M, Bonakdar HR, Jorat MV, Fazelifar AF, Alizadeh A, Ojaghi-Haghjghi Z, Esmaielzadeh M, Sadr-Ameli MA. Effect of right ventricular lead location on response to cardiac resynchronization therapy in patients with end-stage heart failure. Europace. 2009;11:356-363.
43. Taylor AJ, Elsik M, Broughton A, Cherayath J, Leet A, Wong C, Iles L, Butler M, Pfluger H. Combined dyssynchrony and scar imaging with cardiac magnetic resonance imaging predicts clinical response and long-term prognosis following cardiac resynchronization therapy. Europace. 2010;12:708-713.
ER, Schalij MJMJMJMJMJMJMJ, eeeeeadadadadadadad pppppppososososososositititititititioioioioioioion,n,n,n,n,n,n, aaaaaaandndndndndndndure pppppppatatatatatatatieieieieieiei ntntntntntntnts s s s s ss unununuunuu d
ation therapy. Ci l ti 2011 123 70 78r a
D oa
nG, Prasad SK, Lyne J, Smith G, Burman ED, Khan M, Sh pPennell DJ Cardiovascular magnetic resonance fibrosis
atioioioioion nnnn thththththereeee apapapapapy. Circulation. 201111111111;123:70-78. rrrrrdededededee MSSSSS, PaPPaPP lmlmlmlmlmererererer CCCCCR,R,R,RR, PPPPPugugugugh hh hh PJPPP , O'HaHaHaHaHallllll oororoo anananann DDDDD, ElElElElElsisisisiik kkkk M,M,M,M,M, RRRRReaeeee
DDDDDutututututka DP. TTTaaargeeeetttet d lleeft vvvennnttriiiicucucucuculallall r llleaddd ppppplaceeememmem nt toatioioioioionn nnn thththththerrrapapapa y:y:y:: TTTTTheheheee tttttaaraaa geeeeettt tt stststststudududududy:y:y:y:y: AAAAA rrrrrananananandododododomimimmm zezezed,dddd ccccconononoo trtrttrt olololololleleleleled dddd
n College offfff CaCaCaCaCardrdrdrdrdioioioioiololololologygygygygy.... 20202020201212121212;5;5; 9:99:9:9:151111 09090999-1-11-1151515151518.8.888 GGG, PPPrararasasasad d d SKSKSK,, LyLyLyyynenene JJJ,,,, SmSmSmititithhh G,G,G,,, BBBurururrrmamamannn EDEDEDD,,,,, KhKhKhhananan MMM, ShShShepepepPPPenenennenenellllllll DDDJJJ CCCCCararardiddidd ovovovasasascucuculalall rrr mamamagngngneteteticicii rrresesesonononananancecece fififififibrbrbbb osososisis
by guest on March 10, 2018
http://circimaging.ahajournals.org/
Dow
nloaded from

22
44. Ypenburg C, Roes SD, Bleeker GB, Kaandorp TA, de Roos A, Schalij MJ, van der Wall EE, Bax JJ. Effect of total scar burden on contrast-enhanced magnetic resonance imaging on response to cardiac resynchronization therapy. Am J Cardiol. 2007;99:657-660.
45. Ypenburg C, Schalij MJ, Bleeker GB, Steendijk P, Boersma E, Dibbets-Schneider P, Stokkel MP, van der Wall EE, Bax JJ. Extent of viability to predict response to cardiac resynchronization therapy in ischemic heart failure patients. J Nucl Med. 2006;47:1565-1570.
46. Flett AS, Hasleton J, Cook C, Hausenloy D, Quarta G, Ariti C, Muthurangu V, Moon JC. Evaluation of techniques for the quantification of myocardial scar of differing etiology using cardiac magnetic resonance. JACC Cardiovasc Imaging. 2011;4:150-156.
by guest on March 10, 2018
http://circimaging.ahajournals.org/
Dow
nloaded from

Table 1. Non-MRI baseline patient characteristics, presented for the total population and for those with and without response to CRT (defined as a 15% reduction in LVESV at 3 or 6 months).
Total Population (N=60) ICM (N=25) DCM (N=35)
Variables All patients (N=60)
Response (N=42)
No Response (N=18)
p Response (N=13)
No Response (N=12)
p Response (N=29)
No Response
(N=6)
p
Age (years) 64±9 63±10 66±8 .35 66±8 69±7 0.61 61±10 61±10 0.99
Female sex 16(27%) 14(33%) 2(11%) .07 2(15%) 1(8%) 0.53 12(41%) 1(17%) 0.26
Hypertension 34(57%) 25(59%) 9(50%) .34 9(69%) 5(42%) 0.16 16(55%) 4(67%) 0.48
Diabetes mellitus 19(32%) 13(31%) 6(33%) .54 7(54%) 3(25%) 0.14 6(21%) 3(50%) 0.16
Hyperlipidemia 37(62%) 25(59%) 12(67%) .41 9(69%) 8(67%) 0.61 16(55%) 4(67%) 0.48
Smoking 22(37%) 14(33%) 8(44%) .30 3(23%) 5(42%) 0.29 11(38%) 3(50%) 0.46
Any prior revascularization
14(23%) 9(21%) 5(28%) .41 4(31%) 5(42%) 0.44 5(17%) 0(0%) 0.37
GFR (ml/min/1.73m2) 68±16 71±17 61±12 .04* 66±8 68±6 0.17 72±17 64±11 0.33
Atrial fibrillation 9(15%) 5(12%) 4(24%) .23 2(15%) 3(27%) 0.42 3(10%) 1(17%) 0.55
QRS morphology
QRS duration (ms) 159±21 162±20 151±23 .08 156±24 147±19 0.34 165±18 161±30 0.71
LBBB 48(81%) 36(86%) 12(71%) .16 9(69%) 8(73%) 0.60 27(93%) 4(67%) 0.13
RBBB 5(8%) 1(2%) 4(24%) .02* 1(8%) 2(18%) 0.43 0(0%) 2(33%) 0.02*
Non-specific delay 6(10%) 5(12%) 1(6%) .44 3(23%) 1(9%) 0.36 2(7%) 0(0%) 0.68
NYHA functional class 2.8±0.5 2.7±0.6 2.9±0.2 .04* 2.8±0.7 2.9±0.3 0.73 2.6±0.6 3.0±0.0 0.12
Class II 18(30%) 17(40%) 1(6%) .01* 4(31%) 1(8%) 0.10 13(45%) 0(0%) 0.09
Class III 39(65%) 22(52%) 17(94%) 7(54%) 11(92%) 15(52%) 6(100%)
Class IV 3(5%) 3(7%) 0(0%) 2(15%) 0(0%) 1(3%) 0(0%)
Medications
ACE inhibitor 43(72%) 31(74%) 12(67%) .40 12(92%) 8(67%) 0.14 19(66%) 4(67%) 0.67
ARB 20(33%) 13(31%) 7(39%) .38 1(8%) 5(42%) 0.06 12(41%) 2(33%) 0.54
ACE inhibitor or 57(95%) 40(95%) 17(94%) .66 12(92%) 11(92%) 0.74 28(97%) 6(100%) 0.83
(4(4(4(4(4(4(42%2%2%2%2%2%2%) ) ) ) ) ) ) 0.0.0.0.0.0.0.4444444
1
4 4% .23 15 3 7% 0.4
616666 ±12 .0.0.0.0.04*4*4*4*4* 6666 ±88± 686666 ±6±6±6±6±6 0.0000 1
44444(2(2(2(2(24%%4%4%4%))) )) .22223333 2(2(2(2(2(1515151515%)%)%)%)%) 33333(2(2(2(2( 7%7%7%7%7%) )))) 0.0000 4
by guest on March 10, 2018
http://circimaging.ahajournals.org/
Dow
nloaded from

24
ARB
Beta-blocker 54(90%) 38(90%) 16(89%) .59 11(85%) 11(92%) 0.53 27(93%) 5(83%) 0.44
Diuretic 50(83%) 34(81%) 16(89%) .36 11(85%) 10(83%) 0.67 23(79%) 6(100%) 0.29
Continuous data are expressed as mean ±SD, categorical data as n (%). ICM = Ischemic cardiomyopathy; DCM = Dilated cardiomyopathy; PCI = percutaneous coronary intervention; CABG = coronary artery bypass grafting; MI = Myocardial infarction, GFR = Glomerular Filtration Rate; LBBB, left bundle-branch block; NYHA = New York Heart Association; CRT = Cardiac resynchronization therapy; ACE = angiotensin-converting enzyme
by guest on March 10, 2018
http://circimaging.ahajournals.org/
Dow
nloaded from

25
Table 2. Baseline MRI characteristics of the study population and for those with and without response to CRT, stratified according to cardiomyopathy Etiology.
Variable Total Population (N=60) ICM (N=25) DCM (N=35)
Response (N=42)
No-response (N=18)
P Response (N=13)
No-response (N=12)
P Response (N=29)
No-response (N=6)
P
LV volumes / mass
LV EF (%) 26±6 24±9 .48 26±7 25±9 .89 26±6 21±6 .22
LV EDV (mL) 275±78 320±68 .02* 266±55 324±67 .02* 279±87 312±77 .31
LV ESV (mL) 206±71 245±64 .03* 197±52 214±56 .04* 210±78 252±84 .29
LV mass (g) 191±41 229±66 .03* 186±34 214±72 .41 194±44 258±43 .004
LV mass – indexed (g/m2) 96±20 105±27 .28 92±15 101±30 .65 98±22 114±22 .16
Dyssynchrony
SD16 TmWT (ms) 151±48 144±51 .88 169±71 138±54 .22 143±33 154±45 .43
Septal to LVp segment delay (ms) 323±159 303±192 .54 310±179 279±217 .57 328±152 346±144 .82
Septal to LVp segment 130ms 34(81%) 14(78%) .52 10(77%) 9(75%) .64 24(83%) 5(83%) .73
Scar Analysis
Any myocardial scar* 35(83%) 17(94%) .24 13(100%) 12(100%) N/A 22(76%) 5(83%) .58
Total LV scar volume (%) 13±16 17±11 .08 22±8 30±18 .38 6±8 6±4 .68
Total LV pacing region scar (%) 8±14 23±23 .01* 13±20 29±23 .08 5±10 10±20 .85
Total RV pacing region scar (%) 24±30 40±32 .04* 53±31 53±30 .98 12±18 15±18 .56
LVp segment 50% scar 1(2%) 3(17%) .08 1(8%) 3(25%) .26 0(0%) 0(0%) N/A
LVp region 25% scar 2(5%) 6(33%) .01* 1(8%) 5(42%) .06 1(3%) 1(17%) .32
RVp segment 50% scar 8(19%) 5(28%) .33 7(54%) 5(42%) .42 1(3%) 0(0%) .83
RVp region 25% scar 12(29%) 10(56%) .05 9(69%) 9(75%) .55 3(10%) 1(17%) .55
Data expressed as mean ± SD. ICM = Ischemic cardiomyopathy; DCM = Dilated cardiomyopathy; LV = left ventricular; EDV = end-diastolic volume; ESV = end-systolic volume; EF= ejection fraction; SD16 TmWT = Standard Deviation of the Time to Maximal Radial Wall Thickening obtained from all 16 segments; LVpD = Left Ventricular Paced Segment Delay *Defined as the presence of 1 myocardial segment with unequivocal scar, as determined by an experienced, blinded investigator.
.6.6666665 5
1
92 54 310±179 279±217 57
% .52 10 7% 75 .64
1 .888888 8888 16161616169±9±9±9±9±717111 111113838383838±5±5±5± 4 4444 .2.2.22.22 2 222
92 .545454545 3333101111 ±1±1±1±1±17979797979 222227979797979±2±2±2±2±21717171717 . 757777
%%%))) 55.5222 101010(7(7(7(77%7%7%7 ) ) ) ) 9(9(9((757575%)%)%)%)%) .646464
by guest on March 10, 2018
http://circimaging.ahajournals.org/
Dow
nloaded from

Figure Legends
Figure 1. Example of quantitative wall motion analysis applied to a mid-ventricular short axis
cine image. End-systolic and end-diastolic phases shown to illustrate changes in radial “spokes”
representing wall thickening. The mean length of 15 spokes per myocardial segment were used
to determine the mean wall thickness at each phase of the cardiac cycle.
Figure 2. Example of cardiac-gated CT lead mapping. Left: 3D maximum intensity projection
(MIP) showing the RV lead (open arrow) in the typical apical segment location and the LV lead
(solid arrow) positioned within the anterior interventricular vein. Middle: 3D multi-planar
reconstruction (MPR) in short axis showing both the RV and LV leads relative to the myocardial
soft tissues (dashed lines) with standard chamber segmentation. Right: 3D volume rendering in
the same patient (AP view) showing the LV lead is positioned distant from a calcified
inferolateral transmural scar (inset: corresponding short axis DE-MRI image showing enhancing
scar in white against the normal black myocardium).
Figure 3. Results of segmental analysis showing the segmental prevalence of CRT lead tip
delivery, any myocardial scar, and mean time to maximal wall thickness (SD16-TmWT) for all
patients, ICM, and DCM patients. Shown using the AHA 16-segment model divided into septal
and non-septal segments relevant to the RV and LV pacing leads, respectively.
Figure 4. Late gadolinium enhancement (LGE) images of patients found to have significant scar
(bright signal within myocardium) within the left ventricular pacing region scar (A) and right
egment locationonononononon
vein.n...... MiMiMiMiMiMiMiddddddddddddddlelelelelelele: :
R t
u
A f
R)R)R))) iiiiin shoooortrtrtrtt aaaaaxixixiiis s ss s shshshshshowowowowowinininining g g g g bobobooothththtt thehee RRRRRV VV VV ananananandd d dd LVLVLVLVV leeeeeadadadadadsssss rerrererelalalalalatititititiveveveveve t
linnnnneseseseses))))) wiwiwiwiw thththhh ssstatataaandndndnn arrrrrdd ddd chchchchc amamamamambebebebeberrr rr sesesesesegmgmgmgmmenenenenentatatatatatititititionononono . RRRRRigigigigighththththt: 3D3D3D3D3D vvvvvolololololummm
APAPAP vvvieieiew)w)w)) ssshohohowiwiwingngng ttthehehe LLLVVV llleaeaead d d isisis pppososositititioioionenened dd dididistststanananttt fff
by guest on March 10, 2018
http://circimaging.ahajournals.org/
Dow
nloaded from

27
ventricular pacing region (B). Examples provided for both ischemic and non-ischemic patterns
of injury. Left column shows the 4-chamber view (highlighted in red). Middle column shows a
representative short axis view. Right column shows the corresponding signal threshold-based
scar analysis with division into the AHA segment model. Red line corresponds to approximate
position of the 4-chamber view.
Figure 5. Six-month response rate to cardiac resynchronization therapy (CRT) among patients
with i) both leads delivered non-scarred pacing regions, ii) only the right ventricular (RV) lead
delivered to a scarred pacing region, iii) only the left ventricular (LV) lead delivered to a scarred
pacing region, or iv) both the LV and RV lead delivered to scarred pacing regions. CRT
response was defined as a reduction in LV end diastolic volume (LVEDV) by 15% by serial
echocardiography. RVPR = right ventricular pacing region. LVPR = left ventricular pacing
region.
(LV) lead deelililililililivv
scarararararara rerererererered d d d dd papapapapapapacicicicicicicingn
e yeddddd aaaas a rererer dududududucttctcttioioioioion n n n n ininininin LLLLLV VV V V enenenennd d d dd diiaaastootootolililililiccccc vvvvvolololo umumumumume (L(L(L(L(LVEVEVEVEVEDVDVDVDVDV))))) bybbbb
RRVPVPVPVPVPR RRRR = ririririr ghghghghghttt veveventntntntntriririririculalalalalarrr rr papapapapaciciccc ngngngngng rrrrregegegegegioioioioionnn.nn LVLVLVLVLVPRPRPRPRPR === llefefefefeft tttt vvvvvRRR
by guest on March 10, 2018
http://circimaging.ahajournals.org/
Dow
nloaded from

Figure 1
by guest on March 10, 2018
http://circimaging.ahajournals.org/
Dow
nloaded from

Figure 2
by guest on March 10, 2018
http://circimaging.ahajournals.org/
Dow
nloaded from
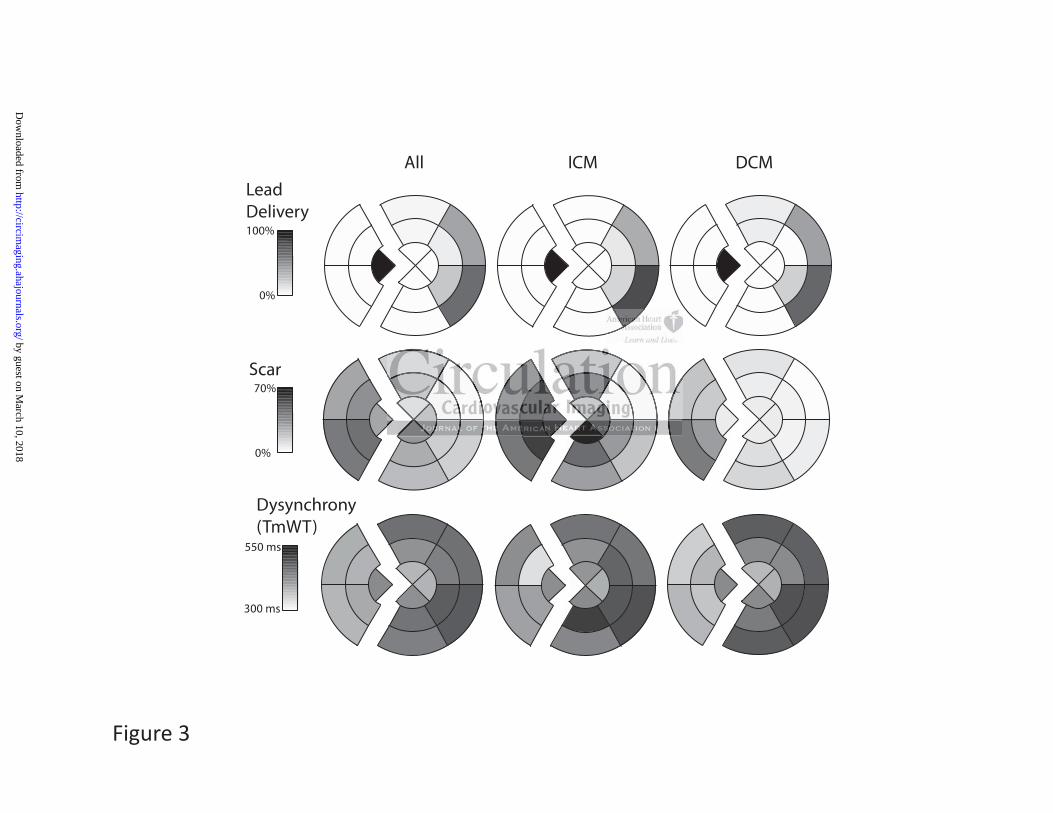
Figure 3
by guest on March 10, 2018
http://circimaging.ahajournals.org/
Dow
nloaded from

A)
B)
Ischemic
Non ischemic
Ischemic
Non ischemic
Figure 4
by guest on March 10, 2018
http://circimaging.ahajournals.org/
Dow
nloaded from

Figure 5
by guest on March 10, 2018
http://circimaging.ahajournals.org/
Dow
nloaded from

Terry Thompson, Maria Drangova and James A. WhiteSkanes, Peter Leong-Sit, George J. Klein, David McCarty, Nowell Fine, Aashish Goela, Ali Islam,
Jorge A. Wong, Raymond Yee, John Stirrat, David Scholl, Andrew D. Krahn, Lorne J. Gula, Allan C.Influence of Pacing Site Characteristics on Response to Cardiac Resynchronization Therapy
Print ISSN: 1941-9651. Online ISSN: 1942-0080 Copyright © 2013 American Heart Association, Inc. All rights reserved.
TX 75231is published by the American Heart Association, 7272 Greenville Avenue, Dallas,Circulation: Cardiovascular Imaging
published online June 5, 2013;Circ Cardiovasc Imaging.
http://circimaging.ahajournals.org/content/early/2013/06/06/CIRCIMAGING.111.000146World Wide Web at:
The online version of this article, along with updated information and services, is located on the
http://circimaging.ahajournals.org//subscriptions/
is online at: Circulation: Cardiovascular Imaging Information about subscribing to Subscriptions:
http://www.lww.com/reprints Information about reprints can be found online at: Reprints:
document. Permissions and Rights Question and Answer this process is available in the
located, click Request Permissions in the middle column of the Web page under Services. Further information aboutnot the Editorial Office. Once the online version of the published article for which permission is being requested is
can be obtained via RightsLink, a service of the Copyright Clearance Center,Circulation: Cardiovascular Imaging Requests for permissions to reproduce figures, tables, or portions of articles originally published inPermissions:
by guest on March 10, 2018
http://circimaging.ahajournals.org/
Dow
nloaded from