Embed Size (px)
Citation preview
Available online at www.sciencedirect.com
www.elsevier.com/locate/gca
Geochimica et Cosmochimica Acta 74 (2010) 5560–5573
Influence of sea level rise on iron diagenesis in an eastFlorida subterranean estuary
Moutusi Roy a,*, Jonathan B. Martin a, Jennifer Cherrier b, Jaye E. Cable c,Christopher G. Smith d
a Department of Geological Sciences, University of Florida, Gainesville, FL, USAb Environmental Sciences Institute, Florida A&M University, Tallahassee, FL, USA
c Department of Oceanography and Coastal Sciences, School of the Coast and Environment, Louisiana State University, Baton Rouge, LA, USAd United State Geological Survey, St. Petersburg, FL, USA
Received 21 January 2010; accepted in revised form 6 July 2010; available online 15 July 2010
Abstract
Subterranean estuary occupies the transition zone between hypoxic fresh groundwater and oxic seawater, and between ter-restrial and marine sediment deposits. Consequently, we hypothesize, in a subterranean estuary, biogeochemical reactions ofFe respond to submarine groundwater discharge (SGD) and sea level rise. Porewater and sediment samples were collectedacross a 30-m wide freshwater discharge zone of the Indian River Lagoon (Florida, USA) subterranean estuary, and at a site250 m offshore. Porewater Fe concentrations range from 0.5 lM at the shoreline and 250 m offshore to about 286 lM at thefreshwater–saltwater boundary. Sediment sulfur and porewater sulfide maxima occur in near-surface OC-rich black sedimentsof marine origin, and dissolved Fe maxima occur in underlying OC-poor orange sediments of terrestrial origin. FreshwaterSGD flow rates decrease offshore from around 1 to 0.1 cm/day, while bioirrigation exchange deepens with distance fromabout 10 cm at the shoreline to about 40 cm at the freshwater–saltwater boundary. DOC concentrations increase from around75 lM at the shoreline to as much as 700 lM at the freshwater–saltwater boundary as a result of labile marine carbon inputsfrom marine SGD. This labile DOC reduces Fe-oxides, which in conjunction with slow discharge of SGD at the boundary,allows dissolved Fe to accumulate. Upward advection of fresh SGD carries dissolved Fe from the Fe-oxide reduction zone tothe sulfate reduction zone, where dissolved Fe precipitates as Fe-sulfides. Saturation models of Fe-sulfides indicate some frac-tions of these Fe-sulfides get dissolved near the sediment–water interface, where bioirrigation exchanges oxic surface water.The estimated dissolved Fe flux is approximately 0.84 lM Fe/day per meter of shoreline to lagoon surface waters. Acceleratedsea level rise predictions are thus likely to increase the Fe flux to surface waters and local primary productivity, particularlyalong coastlines where groundwater discharges through sediments.� 2010 Elsevier Ltd. All rights reserved.
1. INTRODUCTION
Iron (Fe) is an important micronutrient, and its fluxfrom various sources influences primary productivity in
0016-7037/$ - see front matter � 2010 Elsevier Ltd. All rights reserved.
doi:10.1016/j.gca.2010.07.007
* Corresponding author. Present address: Department of Chem-ical Oceanography, College of Oceanic and Atmospheric Sciences(COAS), Oregon State University, Corvallis, OR, USA. Tel.: +1541 737 5224.
E-mail addresses: [email protected], [email protected] (M. Roy), [email protected] (J.B. Martin).
marine systems (Martin and Fitzwater, 1988; Martinet al., 1994; Pollard et al., 2009). Sources of Fe were initiallythought to derive primarily from atmospheric deposition,but Fe fluxes of similar magnitude have been found to orig-inate from continental shelf sediments (Fung et al., 2000;Elrod et al., 2004; Severmann et al., 2010). This flux resultsfrom the mobilization of Fe during the reduction of Fe-oxi-des and linked oxidation of organic carbon (OC) followingdiagenesis in shelf sediments (Froelich et al., 1979; Elrodet al., 2004; Burdige, 2006). Iron diagenesis is also impor-tant in the mobilization of other heavy metals (e.g., arsenic,
Influence of sea level rise on iron diagenesis in a subterranean estuary 5561
cadmium, copper, lead) and nutrients (e.g., phosphate)(Lion et al., 1982; Slomp et al., 1996; Caetano and Vale,2002; Zhang et al., 2002; Ler and Stanforth, 2003; Charetteet al., 2005). Iron mobilization from coastal sediments mayalso be impacted by submarine groundwater discharge(SGD) depending on compositions of the water and sedi-ment through which it flows.
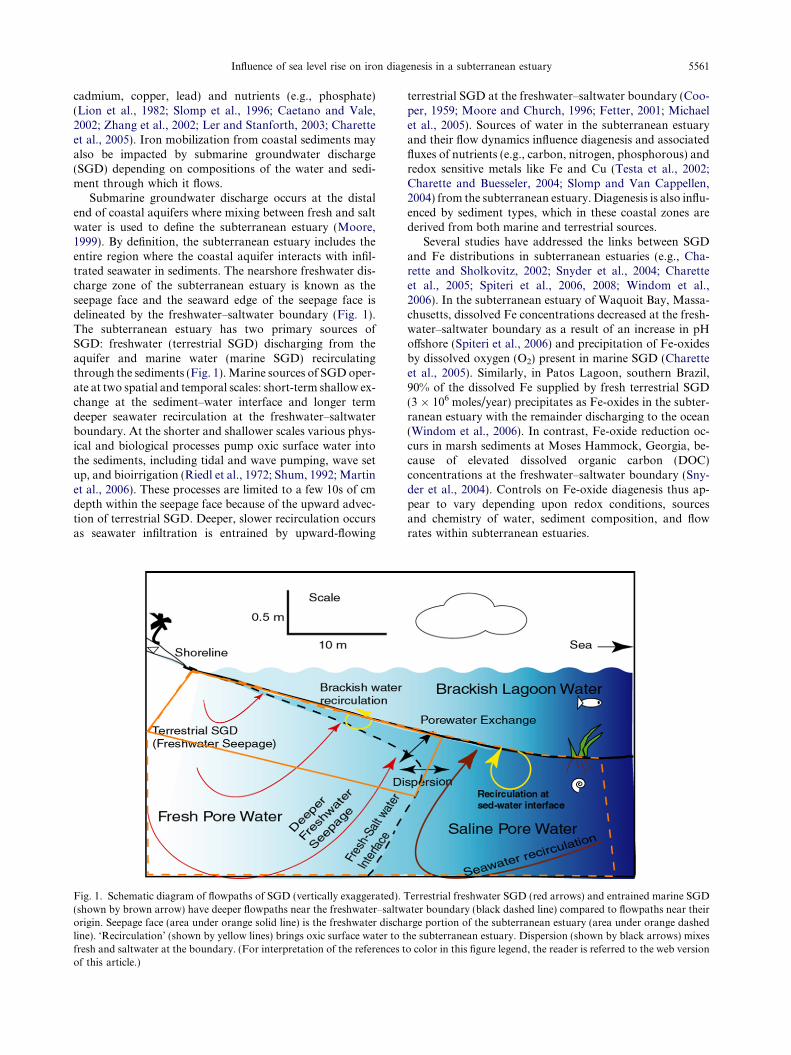
Submarine groundwater discharge occurs at the distalend of coastal aquifers where mixing between fresh and saltwater is used to define the subterranean estuary (Moore,1999). By definition, the subterranean estuary includes theentire region where the coastal aquifer interacts with infil-trated seawater in sediments. The nearshore freshwater dis-charge zone of the subterranean estuary is known as theseepage face and the seaward edge of the seepage face isdelineated by the freshwater–saltwater boundary (Fig. 1).The subterranean estuary has two primary sources ofSGD: freshwater (terrestrial SGD) discharging from theaquifer and marine water (marine SGD) recirculatingthrough the sediments (Fig. 1). Marine sources of SGD oper-ate at two spatial and temporal scales: short-term shallow ex-change at the sediment–water interface and longer termdeeper seawater recirculation at the freshwater–saltwaterboundary. At the shorter and shallower scales various phys-ical and biological processes pump oxic surface water intothe sediments, including tidal and wave pumping, wave setup, and bioirrigation (Riedl et al., 1972; Shum, 1992; Martinet al., 2006). These processes are limited to a few 10s of cmdepth within the seepage face because of the upward advec-tion of terrestrial SGD. Deeper, slower recirculation occursas seawater infiltration is entrained by upward-flowing
Fig. 1. Schematic diagram of flowpaths of SGD (vertically exaggerated).(shown by brown arrow) have deeper flowpaths near the freshwater–saltworigin. Seepage face (area under orange solid line) is the freshwater dischline). ‘Recirculation’ (shown by yellow lines) brings oxic surface water to tfresh and saltwater at the boundary. (For interpretation of the references tof this article.)
terrestrial SGD at the freshwater–saltwater boundary (Coo-per, 1959; Moore and Church, 1996; Fetter, 2001; Michaelet al., 2005). Sources of water in the subterranean estuaryand their flow dynamics influence diagenesis and associatedfluxes of nutrients (e.g., carbon, nitrogen, phosphorous) andredox sensitive metals like Fe and Cu (Testa et al., 2002;Charette and Buesseler, 2004; Slomp and Van Cappellen,2004) from the subterranean estuary. Diagenesis is also influ-enced by sediment types, which in these coastal zones arederived from both marine and terrestrial sources.
Several studies have addressed the links between SGDand Fe distributions in subterranean estuaries (e.g., Cha-rette and Sholkovitz, 2002; Snyder et al., 2004; Charetteet al., 2005; Spiteri et al., 2006, 2008; Windom et al.,2006). In the subterranean estuary of Waquoit Bay, Massa-chusetts, dissolved Fe concentrations decreased at the fresh-water–saltwater boundary as a result of an increase in pHoffshore (Spiteri et al., 2006) and precipitation of Fe-oxidesby dissolved oxygen (O2) present in marine SGD (Charetteet al., 2005). Similarly, in Patos Lagoon, southern Brazil,90% of the dissolved Fe supplied by fresh terrestrial SGD(3 � 106 moles/year) precipitates as Fe-oxides in the subter-ranean estuary with the remainder discharging to the ocean(Windom et al., 2006). In contrast, Fe-oxide reduction oc-curs in marsh sediments at Moses Hammock, Georgia, be-cause of elevated dissolved organic carbon (DOC)concentrations at the freshwater–saltwater boundary (Sny-der et al., 2004). Controls on Fe-oxide diagenesis thus ap-pear to vary depending upon redox conditions, sourcesand chemistry of water, sediment composition, and flowrates within subterranean estuaries.
Terrestrial freshwater SGD (red arrows) and entrained marine SGDater boundary (black dashed line) compared to flowpaths near their
arge portion of the subterranean estuary (area under orange dashedhe subterranean estuary. Dispersion (shown by black arrows) mixeso color in this figure legend, the reader is referred to the web version
5562 M. Roy et al. / Geochimica et Cosmochimica Acta 74 (2010) 5560–5573
Position of the subterranean estuary and correspondingexposure of sediments to the freshwater–saltwater mixingzone will also control diagenetic processes. Shifting of thesubterranean estuary through time could be controlled bywater table fluctuations over less than a year (Michaelet al., 2005). Longer timescale movement, in terms of100 years, of the subterranean estuary could also resultfrom changing sea levels and influence of local hydrogeo-logical conditions (e.g., Melloul and Collin, 2006). Sea levelrise would shift subterranean estuaries landward so that ter-restrial sediments would be introduced to brackish andmarine conditions, thus altering the diagenetic environ-ments within the subterranean estuary. For example, in anumerical modeling study Spiteri et al. (2008) showed50 cm sea level rise till the year 2100 would shift the seepageface of the subterranean estuary of Waquoit Bay 1 m land-ward. This shift of the subterranean estuary would bringmore flux of labile marine DOC into the seepage face,thereby increasing nitrification rate, and production rateof ammonia and phosphorous (Spiteri et al., 2008). Despitethis potential to alter diagenetic reactions, no study has everevaluated the influence of past sea level rise and the land-ward migration of the subterranean estuary on Fe cycling.Consequently, the objectives of this paper are twofold: (1)to evaluate how flow of SGD and sediment chemistry influ-ence Fe-diagenesis in the subterranean estuary, and (2) toassess how sea level rise influenced the Fe-diagenesis andFe flux from sediments in the subterranean estuary.
2. LOCATION AND BACKGROUND
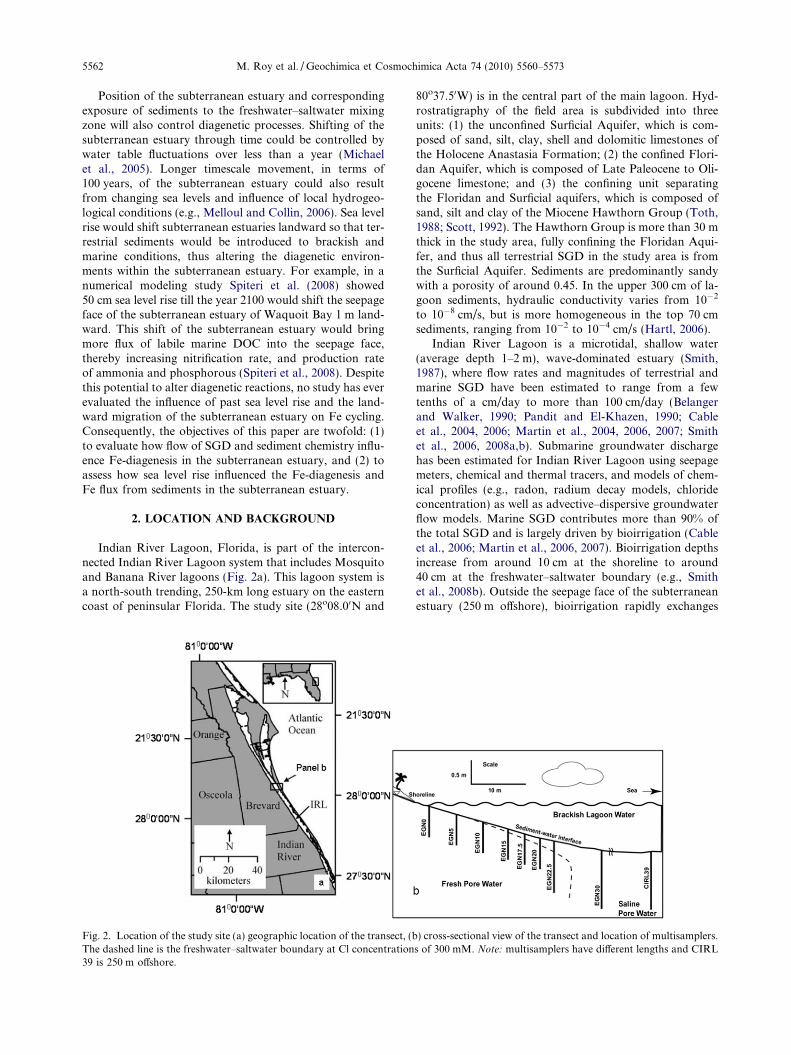
Indian River Lagoon, Florida, is part of the intercon-nected Indian River Lagoon system that includes Mosquitoand Banana River lagoons (Fig. 2a). This lagoon system isa north-south trending, 250-km long estuary on the easterncoast of peninsular Florida. The study site (28o08.00N and
Fig. 2. Location of the study site (a) geographic location of the transect, (bThe dashed line is the freshwater–saltwater boundary at Cl concentration39 is 250 m offshore.
80o37.50W) is in the central part of the main lagoon. Hyd-rostratigraphy of the field area is subdivided into threeunits: (1) the unconfined Surficial Aquifer, which is com-posed of sand, silt, clay, shell and dolomitic limestones ofthe Holocene Anastasia Formation; (2) the confined Flori-dan Aquifer, which is composed of Late Paleocene to Oli-gocene limestone; and (3) the confining unit separatingthe Floridan and Surficial aquifers, which is composed ofsand, silt and clay of the Miocene Hawthorn Group (Toth,1988; Scott, 1992). The Hawthorn Group is more than 30 mthick in the study area, fully confining the Floridan Aqui-fer, and thus all terrestrial SGD in the study area is fromthe Surficial Aquifer. Sediments are predominantly sandywith a porosity of around 0.45. In the upper 300 cm of la-goon sediments, hydraulic conductivity varies from 10�2
to 10�8 cm/s, but is more homogeneous in the top 70 cmsediments, ranging from 10�2 to 10�4 cm/s (Hartl, 2006).
Indian River Lagoon is a microtidal, shallow water(average depth 1–2 m), wave-dominated estuary (Smith,1987), where flow rates and magnitudes of terrestrial andmarine SGD have been estimated to range from a fewtenths of a cm/day to more than 100 cm/day (Belangerand Walker, 1990; Pandit and El-Khazen, 1990; Cableet al., 2004, 2006; Martin et al., 2004, 2006, 2007; Smithet al., 2006, 2008a,b). Submarine groundwater dischargehas been estimated for Indian River Lagoon using seepagemeters, chemical and thermal tracers, and models of chem-ical profiles (e.g., radon, radium decay models, chlorideconcentration) as well as advective–dispersive groundwaterflow models. Marine SGD contributes more than 90% ofthe total SGD and is largely driven by bioirrigation (Cableet al., 2006; Martin et al., 2006, 2007). Bioirrigation depthsincrease from around 10 cm at the shoreline to around40 cm at the freshwater–saltwater boundary (e.g., Smithet al., 2008b). Outside the seepage face of the subterraneanestuary (250 m offshore), bioirrigation rapidly exchanges
) cross-sectional view of the transect and location of multisamplers.s of 300 mM. Note: multisamplers have different lengths and CIRL
Influence of sea level rise on iron diagenesis in a subterranean estuary 5563
surface water with porewater in the upper 70 cm over 24 hfor flow rates as fast as 150 cm/day (Martin et al., 2004,2006). Rates of marine SGD entrained within the freshwa-ter flow, and its residence time in the subsurface, are un-known. Flow rates of terrestrial SGD decrease linearlyoffshore according to
x ¼ 0:16� 0:0064x ð1Þ
where x is distance offshore in meters and x is the flow rateof terrestrial SGD in cm/day (Martin et al., 2007). Terres-trial SGD ceases 20–25 m offshore, as defined by the300 mM chloride (Cl�) concentration isopleth markingthe freshwater–saltwater boundary (Martin et al., 2007).The estimated residence time of terrestrial SGD in the sub-surface is approximately 5–7 months based on the lag be-tween rainfall and discharge (Smith et al., 2008b).
Four major depositional environments, including mar-ine, brackish, lacustrine, and lagoonal, were identified inthe Surficial Aquifer by Hartl (2006) based on four sedi-ment cores collected seaward of the seepage face at our fur-thest offshore site (Site CIRL39, 250 m offshore; locationsare described below in Section 3). These cores contained a2-m thick section of black sediments of marine originunderlain by orange sediments of terrestrial origin, whichextended to the base of the cores and thus have an un-known thickness (Hartl, 2006). The orange sediments con-tain reworked bedded Donax shell lag, indicative offluvial stream-like channel conditions, whereas echinoderm,arthropod, and heavily abraded mollusk fragments in blacksediments reflect a marine origin (Hartl, 2006).
The black sediments at 95 cm below the seafloor (cmbsf)were found to be around 500 years old using the 14C datingtechnique on plant materials and wood debris collected atsite CIRL39. The water depth at this site is 80 cm, butthe lagoon water level averages about 25 cm higher thanthe mean sea level. The depth of the plant material andwood debris is thus about 150 cm below mean sea level indi-cating sea level rise has been about 3 mm/year over the past500 years (Hartl, 2006). This value is similar to the averagerelative sea level change for Florida that has been found tobe about 1.7 mm/year from 1914 to 1986 based on tidalgauge data at four different stations (for details see Penlandand Ramsey, 1990). This relative sea level change for Flor-ida is also similar to the global sea level rise as estimated byJevrejeva et al. (2008): 0.6 mm/year rise during 19th centuryand 1.9 mm/year rise during 20th century.
3. METHODS
Porewater was collected from the subterranean estuarybetween 18 and 22 April, 2007, using multilevel piezometers(multisamplers; Martin et al., 2003). Multisamplers were in-stalled 0, 5, 10, 15, 17.5, and 20 m from shore within theseepage face, 22.5 m offshore at the landward side of thefreshwater–saltwater boundary, 30 m offshore seaward ofthe boundary, and 250 m offshore (Fig. 2b). The stationsfor the nearshore multisampler sites (i.e., 0–30 m offshore)are designated as EGNxx (Eau Gallie North), where xx rep-resents the distance offshore. The farthest offshore station(250 m) is designated CIRL39 (Central Indian River
Lagoon #39) from previous studies. Porewaters were ex-tracted from the seepage face at the depths of the multisam-pler ports, which at EGN0 to EGN20 are located at 7, 15,25, 35, 55, 75, 95, and 115 cmbsf, at EGN22.5 are located at6, 66, 106, 146, and 186 cmbsf, at EGN30 are located at 10,30, 50, 150, 190, and 230 cmbsf, and at CIRL39 are locatedat 10, 20, 30, 40, 60, 110, 140, and 180 cmbsf. A single wellwas installed in the beach sands about 10 m inland from theshoreline to extract samples of fresh water flowing towardthe subterranean estuary.
Water was pumped from the ports into an overflow cupwhile monitoring specific conductivity, temperature, and dis-solved O2 with a YSI model 556MPS multiprobe meter.When these parameters stabilized, samples for metal analy-ses were filtered through 0.45 lm trace metal-clean plasticcanister type inline disposable filter cartridges (WaterraFHT-45) into acid-washed HDPE bottles, immediately acid-ified to pH < 2 with distilled trace metal grade nitric acid,and stored at 4 �C until analyzed in the laboratory. Pore-water DOC samples were collected in acid cleaned and baked60 mL volatile organic (voa) vials equipped with 10% hydro-chloric acid (HCl) leached Teflon lined caps. The sampleswere filtered on site through pre-combusted (4 h at 525 �C)0.7 lm GF/F filters (Whatman Inc.) using 10% HCl washedglass syringes. Samples were flash frozen and transportedback to the laboratory for subsequent analysis. Separate ali-quots of the porewater were processed in the field immedi-ately after sampling to measure sulfide concentrationsusing the p-phenelynediamine — FeCl3 technique (Cline,1969). These samples were analyzed with a Milton Roy Spec-tronic 401 spectrophotometer within 6–10 h of collection.Standards were prepared after each multisampler collectionand measured in sequence with the samples so that samplesand standards reacted over the same time periods.
Dissolved Fe and Mn concentrations were analyzed usinga single collector ICP-MS (Finnegan Element II). The mea-sured concentrations are assumed to be largely reduced Feand Mn because solubilities of their reduced species are sev-eral orders of magnitude higher than corresponding oxidizedforms at ambient pH values. Each sample was diluted 50times with 5% distilled nitric acid spiked with 8 ppb rhodium,which is used as an internal standard to correct for instru-mental drift. Elemental concentrations were quantified usingin-house gravimetrically prepared standards and a pair ofexternal standards, NASS5 (North American seawater stan-dard) and SLRS4 (Canadian river water standard). The pre-cision and accuracy of the technique were calculated bycomparing multiple measurements of the external standardSLRS4, because SLRS4 falls in the range of measured pore-water Fe and Mn concentrations (Table 1). In contrast,NASS5 has Fe and Mn concentrations of 0.003 and0.016 lM, respectively, which are orders of magnitude lowerthan Fe and Mn concentrations measured in porewaters.Consequently, NASS5 was set as the detection limit for thetechnique. Concentrations were below NASS5 in water col-umn sample at sites EGN10, EGN17.5, EGN20 and CIRL39and were not included in the porewater data. Porewaterdissolved inorganic carbon (DIC) concentrations weremeasured using a Coulometrics coulometer. Dissolved or-ganic carbon (DOC) concentrations were measured using a
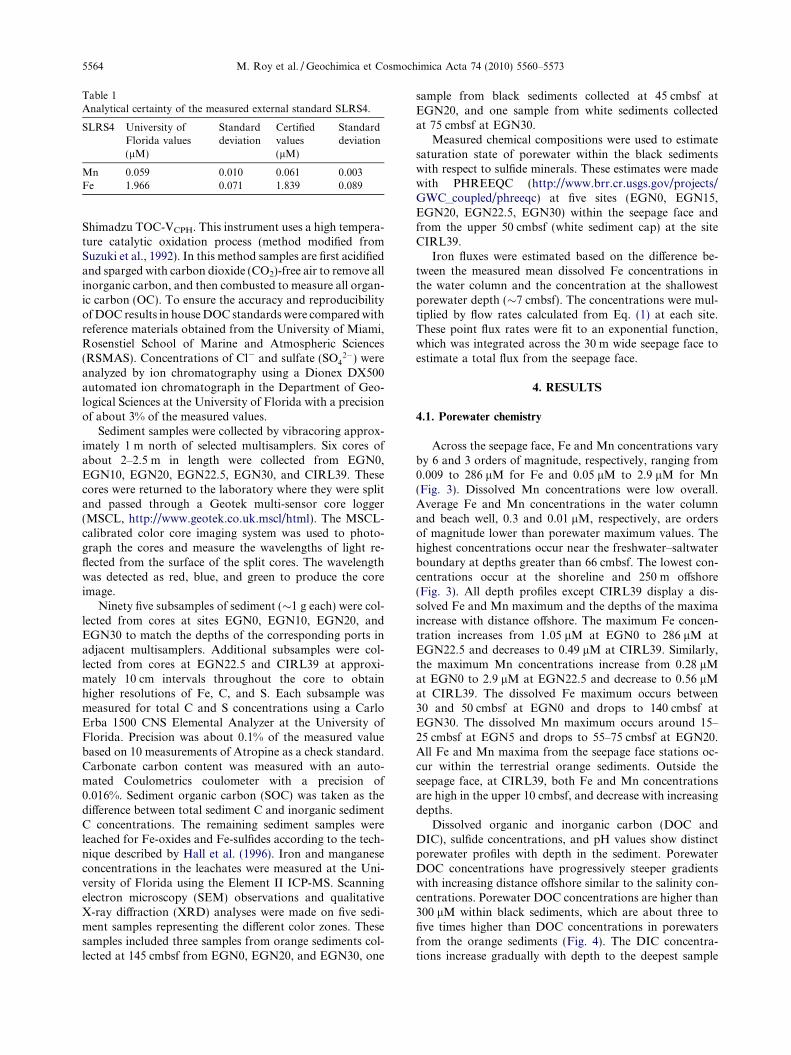
Table 1Analytical certainty of the measured external standard SLRS4.
SLRS4 University ofFlorida values(lM)
Standarddeviation
Certifiedvalues(lM)
Standarddeviation
Mn 0.059 0.010 0.061 0.003Fe 1.966 0.071 1.839 0.089
5564 M. Roy et al. / Geochimica et Cosmochimica Acta 74 (2010) 5560–5573
Shimadzu TOC-VCPH. This instrument uses a high tempera-ture catalytic oxidation process (method modified fromSuzuki et al., 1992). In this method samples are first acidifiedand sparged with carbon dioxide (CO2)-free air to remove allinorganic carbon, and then combusted to measure all organ-ic carbon (OC). To ensure the accuracy and reproducibilityof DOC results in house DOC standards were compared withreference materials obtained from the University of Miami,Rosenstiel School of Marine and Atmospheric Sciences(RSMAS). Concentrations of Cl� and sulfate (SO4
2�) wereanalyzed by ion chromatography using a Dionex DX500automated ion chromatograph in the Department of Geo-logical Sciences at the University of Florida with a precisionof about 3% of the measured values.
Sediment samples were collected by vibracoring approx-imately 1 m north of selected multisamplers. Six cores ofabout 2–2.5 m in length were collected from EGN0,EGN10, EGN20, EGN22.5, EGN30, and CIRL39. Thesecores were returned to the laboratory where they were splitand passed through a Geotek multi-sensor core logger(MSCL, http://www.geotek.co.uk.mscl/html). The MSCL-calibrated color core imaging system was used to photo-graph the cores and measure the wavelengths of light re-flected from the surface of the split cores. The wavelengthwas detected as red, blue, and green to produce the coreimage.
Ninety five subsamples of sediment (�1 g each) were col-lected from cores at sites EGN0, EGN10, EGN20, andEGN30 to match the depths of the corresponding ports inadjacent multisamplers. Additional subsamples were col-lected from cores at EGN22.5 and CIRL39 at approxi-mately 10 cm intervals throughout the core to obtainhigher resolutions of Fe, C, and S. Each subsample wasmeasured for total C and S concentrations using a CarloErba 1500 CNS Elemental Analyzer at the University ofFlorida. Precision was about 0.1% of the measured valuebased on 10 measurements of Atropine as a check standard.Carbonate carbon content was measured with an auto-mated Coulometrics coulometer with a precision of0.016%. Sediment organic carbon (SOC) was taken as thedifference between total sediment C and inorganic sedimentC concentrations. The remaining sediment samples wereleached for Fe-oxides and Fe-sulfides according to the tech-nique described by Hall et al. (1996). Iron and manganeseconcentrations in the leachates were measured at the Uni-versity of Florida using the Element II ICP-MS. Scanningelectron microscopy (SEM) observations and qualitativeX-ray diffraction (XRD) analyses were made on five sedi-ment samples representing the different color zones. Thesesamples included three samples from orange sediments col-lected at 145 cmbsf from EGN0, EGN20, and EGN30, one
sample from black sediments collected at 45 cmbsf atEGN20, and one sample from white sediments collectedat 75 cmbsf at EGN30.
Measured chemical compositions were used to estimatesaturation state of porewater within the black sedimentswith respect to sulfide minerals. These estimates were madewith PHREEQC (http://www.brr.cr.usgs.gov/projects/GWC_coupled/phreeqc) at five sites (EGN0, EGN15,EGN20, EGN22.5, EGN30) within the seepage face andfrom the upper 50 cmbsf (white sediment cap) at the siteCIRL39.
Iron fluxes were estimated based on the difference be-tween the measured mean dissolved Fe concentrations inthe water column and the concentration at the shallowestporewater depth (�7 cmbsf). The concentrations were mul-tiplied by flow rates calculated from Eq. (1) at each site.These point flux rates were fit to an exponential function,which was integrated across the 30 m wide seepage face toestimate a total flux from the seepage face.
4. RESULTS
4.1. Porewater chemistry
Across the seepage face, Fe and Mn concentrations varyby 6 and 3 orders of magnitude, respectively, ranging from0.009 to 286 lM for Fe and 0.05 lM to 2.9 lM for Mn(Fig. 3). Dissolved Mn concentrations were low overall.Average Fe and Mn concentrations in the water columnand beach well, 0.3 and 0.01 lM, respectively, are ordersof magnitude lower than porewater maximum values. Thehighest concentrations occur near the freshwater–saltwaterboundary at depths greater than 66 cmbsf. The lowest con-centrations occur at the shoreline and 250 m offshore(Fig. 3). All depth profiles except CIRL39 display a dis-solved Fe and Mn maximum and the depths of the maximaincrease with distance offshore. The maximum Fe concen-tration increases from 1.05 lM at EGN0 to 286 lM atEGN22.5 and decreases to 0.49 lM at CIRL39. Similarly,the maximum Mn concentrations increase from 0.28 lMat EGN0 to 2.9 lM at EGN22.5 and decrease to 0.56 lMat CIRL39. The dissolved Fe maximum occurs between30 and 50 cmbsf at EGN0 and drops to 140 cmbsf atEGN30. The dissolved Mn maximum occurs around 15–25 cmbsf at EGN5 and drops to 55–75 cmbsf at EGN20.All Fe and Mn maxima from the seepage face stations oc-cur within the terrestrial orange sediments. Outside theseepage face, at CIRL39, both Fe and Mn concentrationsare high in the upper 10 cmbsf, and decrease with increasingdepths.
Dissolved organic and inorganic carbon (DOC andDIC), sulfide concentrations, and pH values show distinctporewater profiles with depth in the sediment. PorewaterDOC concentrations have progressively steeper gradientswith increasing distance offshore similar to the salinity con-centrations. Porewater DOC concentrations are higher than300 lM within black sediments, which are about three tofive times higher than DOC concentrations in porewatersfrom the orange sediments (Fig. 4). The DIC concentra-tions increase gradually with depth to the deepest sample
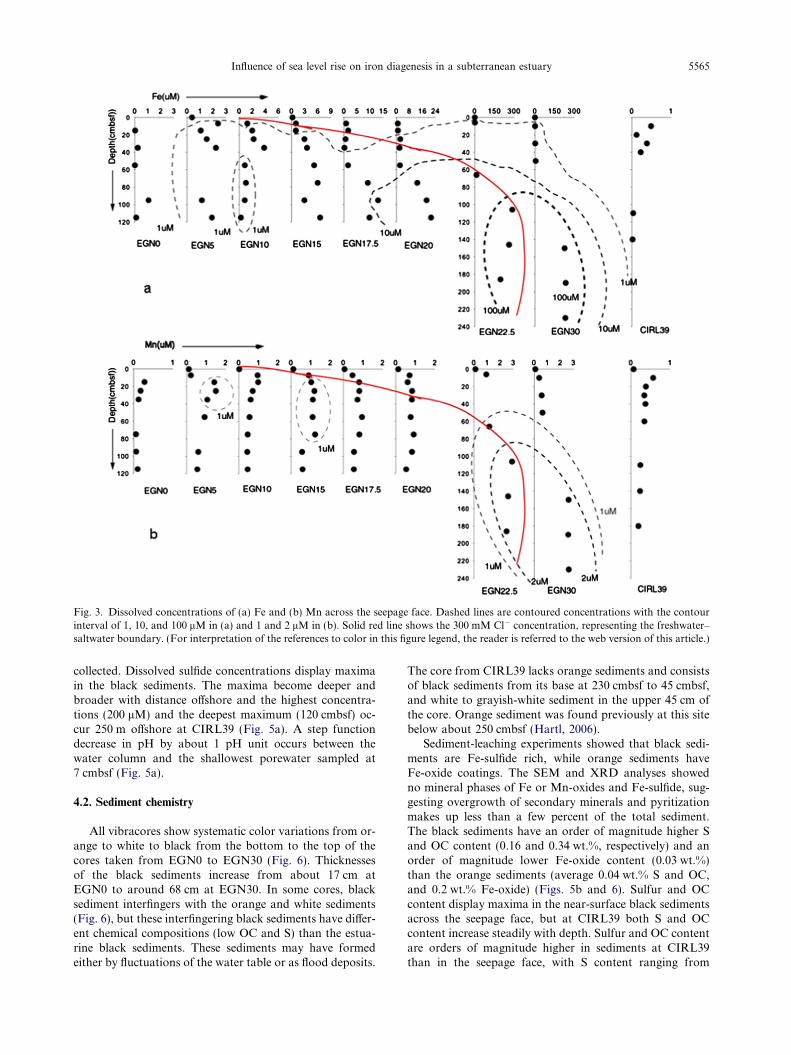
Fig. 3. Dissolved concentrations of (a) Fe and (b) Mn across the seepage face. Dashed lines are contoured concentrations with the contourinterval of 1, 10, and 100 lM in (a) and 1 and 2 lM in (b). Solid red line shows the 300 mM Cl� concentration, representing the freshwater–saltwater boundary. (For interpretation of the references to color in this figure legend, the reader is referred to the web version of this article.)
Influence of sea level rise on iron diagenesis in a subterranean estuary 5565
collected. Dissolved sulfide concentrations display maximain the black sediments. The maxima become deeper andbroader with distance offshore and the highest concentra-tions (200 lM) and the deepest maximum (120 cmbsf) oc-cur 250 m offshore at CIRL39 (Fig. 5a). A step functiondecrease in pH by about 1 pH unit occurs between thewater column and the shallowest porewater sampled at7 cmbsf (Fig. 5a).
4.2. Sediment chemistry
All vibracores show systematic color variations from or-ange to white to black from the bottom to the top of thecores taken from EGN0 to EGN30 (Fig. 6). Thicknessesof the black sediments increase from about 17 cm atEGN0 to around 68 cm at EGN30. In some cores, blacksediment interfingers with the orange and white sediments(Fig. 6), but these interfingering black sediments have differ-ent chemical compositions (low OC and S) than the estua-rine black sediments. These sediments may have formedeither by fluctuations of the water table or as flood deposits.
The core from CIRL39 lacks orange sediments and consistsof black sediments from its base at 230 cmbsf to 45 cmbsf,and white to grayish-white sediment in the upper 45 cm ofthe core. Orange sediment was found previously at this sitebelow about 250 cmbsf (Hartl, 2006).
Sediment-leaching experiments showed that black sedi-ments are Fe-sulfide rich, while orange sediments haveFe-oxide coatings. The SEM and XRD analyses showedno mineral phases of Fe or Mn-oxides and Fe-sulfide, sug-gesting overgrowth of secondary minerals and pyritizationmakes up less than a few percent of the total sediment.The black sediments have an order of magnitude higher Sand OC content (0.16 and 0.34 wt.%, respectively) and anorder of magnitude lower Fe-oxide content (0.03 wt.%)than the orange sediments (average 0.04 wt.% S and OC,and 0.2 wt.% Fe-oxide) (Figs. 5b and 6). Sulfur and OCcontent display maxima in the near-surface black sedimentsacross the seepage face, but at CIRL39 both S and OCcontent increase steadily with depth. Sulfur and OC contentare orders of magnitude higher in sediments at CIRL39than in the seepage face, with S content ranging from
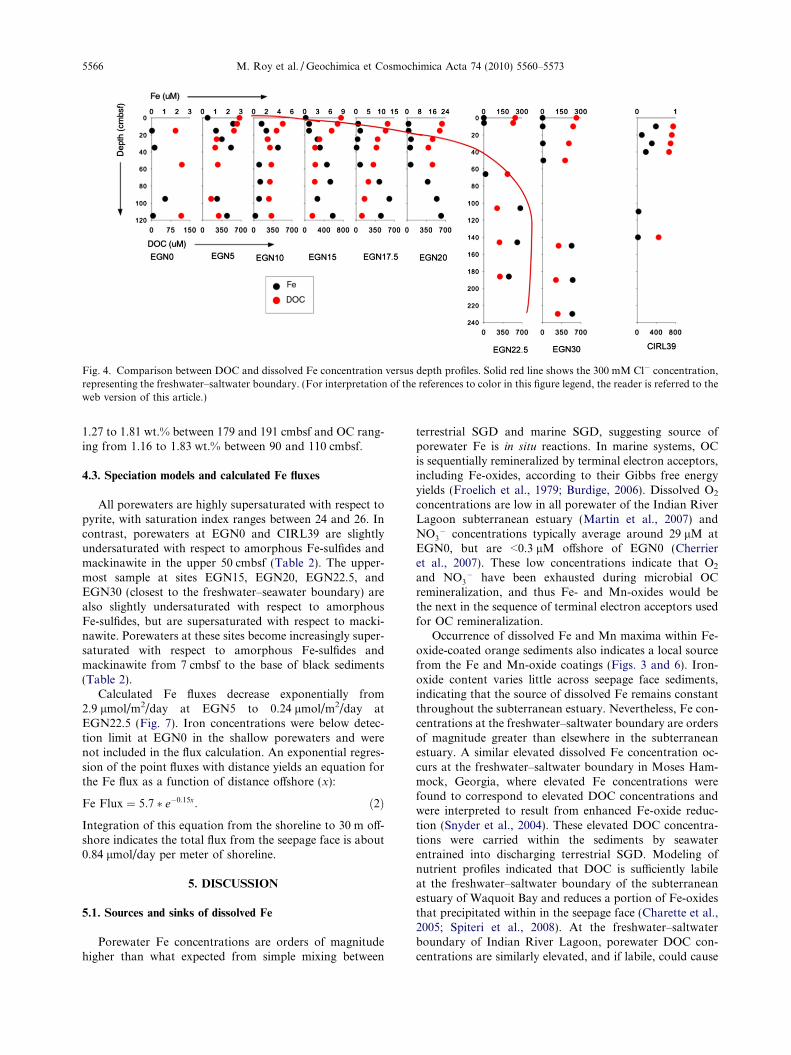
Fig. 4. Comparison between DOC and dissolved Fe concentration versus depth profiles. Solid red line shows the 300 mM Cl� concentration,representing the freshwater–saltwater boundary. (For interpretation of the references to color in this figure legend, the reader is referred to theweb version of this article.)
5566 M. Roy et al. / Geochimica et Cosmochimica Acta 74 (2010) 5560–5573
1.27 to 1.81 wt.% between 179 and 191 cmbsf and OC rang-ing from 1.16 to 1.83 wt.% between 90 and 110 cmbsf.
4.3. Speciation models and calculated Fe fluxes
All porewaters are highly supersaturated with respect topyrite, with saturation index ranges between 24 and 26. Incontrast, porewaters at EGN0 and CIRL39 are slightlyundersaturated with respect to amorphous Fe-sulfides andmackinawite in the upper 50 cmbsf (Table 2). The upper-most sample at sites EGN15, EGN20, EGN22.5, andEGN30 (closest to the freshwater–seawater boundary) arealso slightly undersaturated with respect to amorphousFe-sulfides, but are supersaturated with respect to macki-nawite. Porewaters at these sites become increasingly super-saturated with respect to amorphous Fe-sulfides andmackinawite from 7 cmbsf to the base of black sediments(Table 2).
Calculated Fe fluxes decrease exponentially from2.9 lmol/m2/day at EGN5 to 0.24 lmol/m2/day atEGN22.5 (Fig. 7). Iron concentrations were below detec-tion limit at EGN0 in the shallow porewaters and werenot included in the flux calculation. An exponential regres-sion of the point fluxes with distance yields an equation forthe Fe flux as a function of distance offshore (x):
Fe Flux ¼ 5:7 � e�0:15x: ð2Þ
Integration of this equation from the shoreline to 30 m off-shore indicates the total flux from the seepage face is about0.84 lmol/day per meter of shoreline.
5. DISCUSSION
5.1. Sources and sinks of dissolved Fe
Porewater Fe concentrations are orders of magnitudehigher than what expected from simple mixing between
terrestrial SGD and marine SGD, suggesting source ofporewater Fe is in situ reactions. In marine systems, OCis sequentially remineralized by terminal electron acceptors,including Fe-oxides, according to their Gibbs free energyyields (Froelich et al., 1979; Burdige, 2006). Dissolved O2
concentrations are low in all porewater of the Indian RiverLagoon subterranean estuary (Martin et al., 2007) andNO3
� concentrations typically average around 29 lM atEGN0, but are <0.3 lM offshore of EGN0 (Cherrieret al., 2007). These low concentrations indicate that O2
and NO3� have been exhausted during microbial OC
remineralization, and thus Fe- and Mn-oxides would bethe next in the sequence of terminal electron acceptors usedfor OC remineralization.
Occurrence of dissolved Fe and Mn maxima within Fe-oxide-coated orange sediments also indicates a local sourcefrom the Fe and Mn-oxide coatings (Figs. 3 and 6). Iron-oxide content varies little across seepage face sediments,indicating that the source of dissolved Fe remains constantthroughout the subterranean estuary. Nevertheless, Fe con-centrations at the freshwater–saltwater boundary are ordersof magnitude greater than elsewhere in the subterraneanestuary. A similar elevated dissolved Fe concentration oc-curs at the freshwater–saltwater boundary in Moses Ham-mock, Georgia, where elevated Fe concentrations werefound to correspond to elevated DOC concentrations andwere interpreted to result from enhanced Fe-oxide reduc-tion (Snyder et al., 2004). These elevated DOC concentra-tions were carried within the sediments by seawaterentrained into discharging terrestrial SGD. Modeling ofnutrient profiles indicated that DOC is sufficiently labileat the freshwater–saltwater boundary of the subterraneanestuary of Waquoit Bay and reduces a portion of Fe-oxidesthat precipitated within in the seepage face (Charette et al.,2005; Spiteri et al., 2008). At the freshwater–saltwaterboundary of Indian River Lagoon, porewater DOC con-centrations are similarly elevated, and if labile, could cause
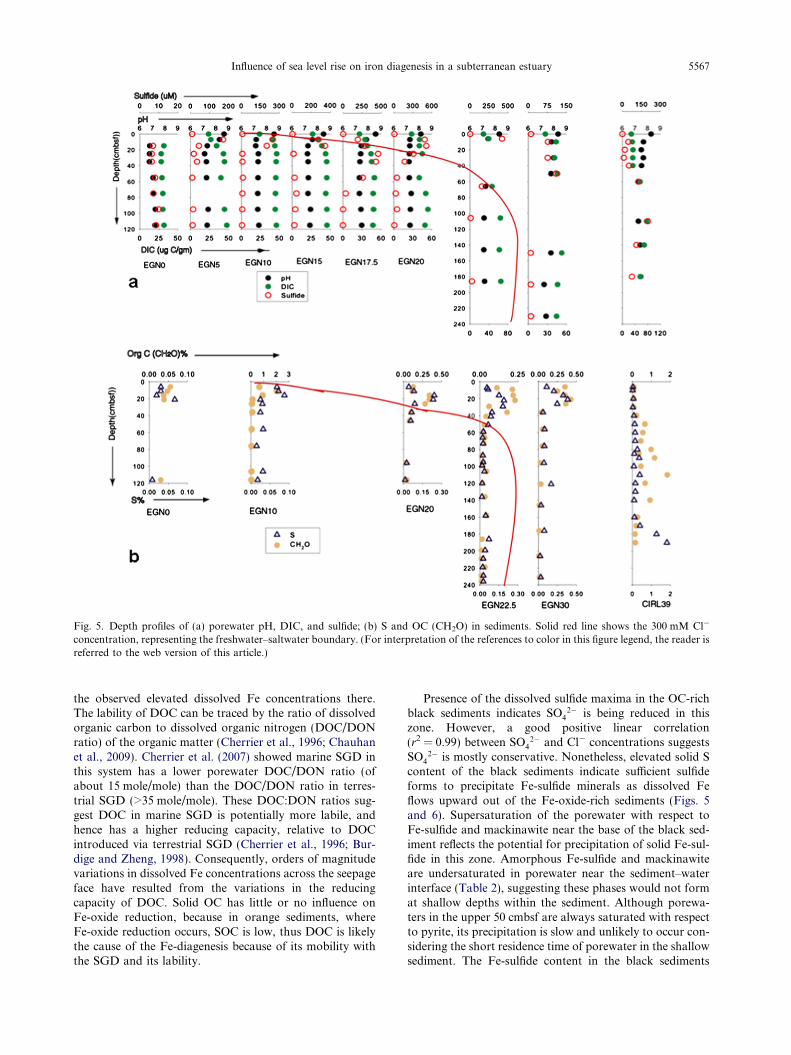
Fig. 5. Depth profiles of (a) porewater pH, DIC, and sulfide; (b) S and OC (CH2O) in sediments. Solid red line shows the 300 mM Cl�
concentration, representing the freshwater–saltwater boundary. (For interpretation of the references to color in this figure legend, the reader isreferred to the web version of this article.)
Influence of sea level rise on iron diagenesis in a subterranean estuary 5567
the observed elevated dissolved Fe concentrations there.The lability of DOC can be traced by the ratio of dissolvedorganic carbon to dissolved organic nitrogen (DOC/DONratio) of the organic matter (Cherrier et al., 1996; Chauhanet al., 2009). Cherrier et al. (2007) showed marine SGD inthis system has a lower porewater DOC/DON ratio (ofabout 15 mole/mole) than the DOC/DON ratio in terres-trial SGD (>35 mole/mole). These DOC:DON ratios sug-gest DOC in marine SGD is potentially more labile, andhence has a higher reducing capacity, relative to DOCintroduced via terrestrial SGD (Cherrier et al., 1996; Bur-dige and Zheng, 1998). Consequently, orders of magnitudevariations in dissolved Fe concentrations across the seepageface have resulted from the variations in the reducingcapacity of DOC. Solid OC has little or no influence onFe-oxide reduction, because in orange sediments, whereFe-oxide reduction occurs, SOC is low, thus DOC is likelythe cause of the Fe-diagenesis because of its mobility withthe SGD and its lability.
Presence of the dissolved sulfide maxima in the OC-richblack sediments indicates SO4
2� is being reduced in thiszone. However, a good positive linear correlation(r2 = 0.99) between SO4
2� and Cl� concentrations suggestsSO4
2� is mostly conservative. Nonetheless, elevated solid Scontent of the black sediments indicate sufficient sulfideforms to precipitate Fe-sulfide minerals as dissolved Feflows upward out of the Fe-oxide-rich sediments (Figs. 5and 6). Supersaturation of the porewater with respect toFe-sulfide and mackinawite near the base of the black sed-iment reflects the potential for precipitation of solid Fe-sul-fide in this zone. Amorphous Fe-sulfide and mackinawiteare undersaturated in porewater near the sediment–waterinterface (Table 2), suggesting these phases would not format shallow depths within the sediment. Although porewa-ters in the upper 50 cmbsf are always saturated with respectto pyrite, its precipitation is slow and unlikely to occur con-sidering the short residence time of porewater in the shallowsediment. The Fe-sulfide content in the black sediments
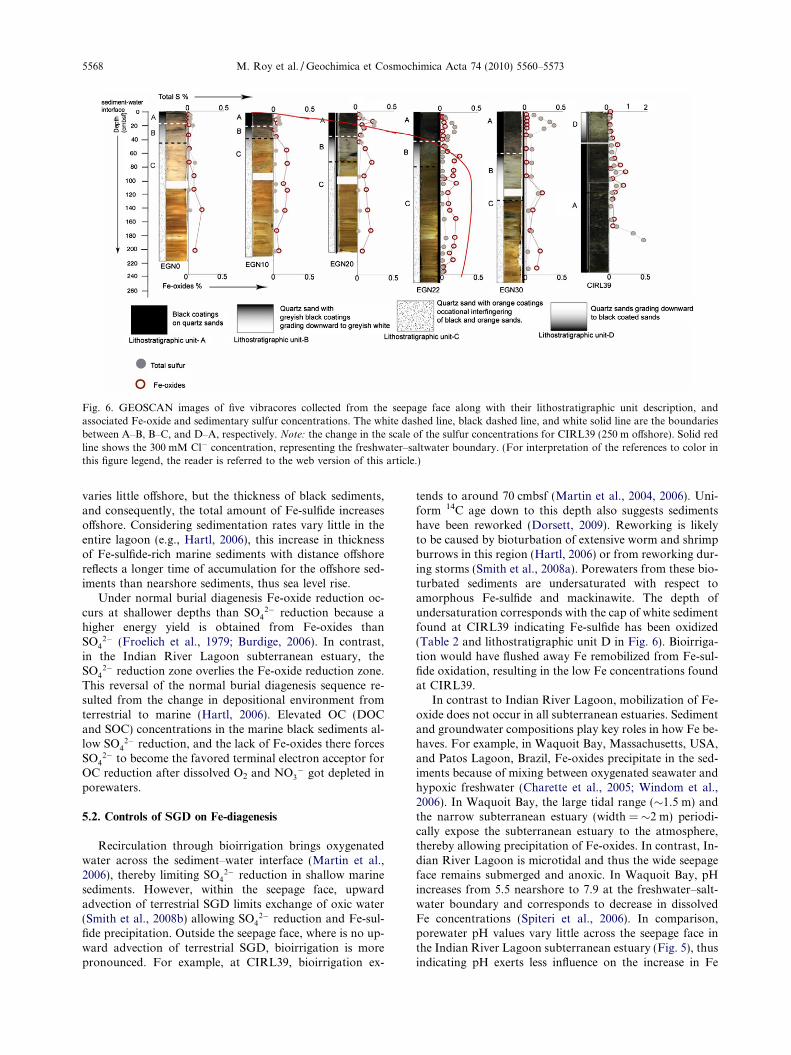
Fig. 6. GEOSCAN images of five vibracores collected from the seepage face along with their lithostratigraphic unit description, andassociated Fe-oxide and sedimentary sulfur concentrations. The white dashed line, black dashed line, and white solid line are the boundariesbetween A–B, B–C, and D–A, respectively. Note: the change in the scale of the sulfur concentrations for CIRL39 (250 m offshore). Solid redline shows the 300 mM Cl� concentration, representing the freshwater–saltwater boundary. (For interpretation of the references to color inthis figure legend, the reader is referred to the web version of this article.)
5568 M. Roy et al. / Geochimica et Cosmochimica Acta 74 (2010) 5560–5573
varies little offshore, but the thickness of black sediments,and consequently, the total amount of Fe-sulfide increasesoffshore. Considering sedimentation rates vary little in theentire lagoon (e.g., Hartl, 2006), this increase in thicknessof Fe-sulfide-rich marine sediments with distance offshorereflects a longer time of accumulation for the offshore sed-iments than nearshore sediments, thus sea level rise.
Under normal burial diagenesis Fe-oxide reduction oc-curs at shallower depths than SO4
2� reduction because ahigher energy yield is obtained from Fe-oxides thanSO4
2� (Froelich et al., 1979; Burdige, 2006). In contrast,in the Indian River Lagoon subterranean estuary, theSO4
2� reduction zone overlies the Fe-oxide reduction zone.This reversal of the normal burial diagenesis sequence re-sulted from the change in depositional environment fromterrestrial to marine (Hartl, 2006). Elevated OC (DOCand SOC) concentrations in the marine black sediments al-low SO4
2� reduction, and the lack of Fe-oxides there forcesSO4
2� to become the favored terminal electron acceptor forOC reduction after dissolved O2 and NO3
� got depleted inporewaters.
5.2. Controls of SGD on Fe-diagenesis
Recirculation through bioirrigation brings oxygenatedwater across the sediment–water interface (Martin et al.,2006), thereby limiting SO4
2� reduction in shallow marinesediments. However, within the seepage face, upwardadvection of terrestrial SGD limits exchange of oxic water(Smith et al., 2008b) allowing SO4
2� reduction and Fe-sul-fide precipitation. Outside the seepage face, where is no up-ward advection of terrestrial SGD, bioirrigation is morepronounced. For example, at CIRL39, bioirrigation ex-
tends to around 70 cmbsf (Martin et al., 2004, 2006). Uni-form 14C age down to this depth also suggests sedimentshave been reworked (Dorsett, 2009). Reworking is likelyto be caused by bioturbation of extensive worm and shrimpburrows in this region (Hartl, 2006) or from reworking dur-ing storms (Smith et al., 2008a). Porewaters from these bio-turbated sediments are undersaturated with respect toamorphous Fe-sulfide and mackinawite. The depth ofundersaturation corresponds with the cap of white sedimentfound at CIRL39 indicating Fe-sulfide has been oxidized(Table 2 and lithostratigraphic unit D in Fig. 6). Bioirriga-tion would have flushed away Fe remobilized from Fe-sul-fide oxidation, resulting in the low Fe concentrations foundat CIRL39.
In contrast to Indian River Lagoon, mobilization of Fe-oxide does not occur in all subterranean estuaries. Sedimentand groundwater compositions play key roles in how Fe be-haves. For example, in Waquoit Bay, Massachusetts, USA,and Patos Lagoon, Brazil, Fe-oxides precipitate in the sed-iments because of mixing between oxygenated seawater andhypoxic freshwater (Charette et al., 2005; Windom et al.,2006). In Waquoit Bay, the large tidal range (�1.5 m) andthe narrow subterranean estuary (width = �2 m) periodi-cally expose the subterranean estuary to the atmosphere,thereby allowing precipitation of Fe-oxides. In contrast, In-dian River Lagoon is microtidal and thus the wide seepageface remains submerged and anoxic. In Waquoit Bay, pHincreases from 5.5 nearshore to 7.9 at the freshwater–salt-water boundary and corresponds to decrease in dissolvedFe concentrations (Spiteri et al., 2006). In comparison,porewater pH values vary little across the seepage face inthe Indian River Lagoon subterranean estuary (Fig. 5), thusindicating pH exerts less influence on the increase in Fe
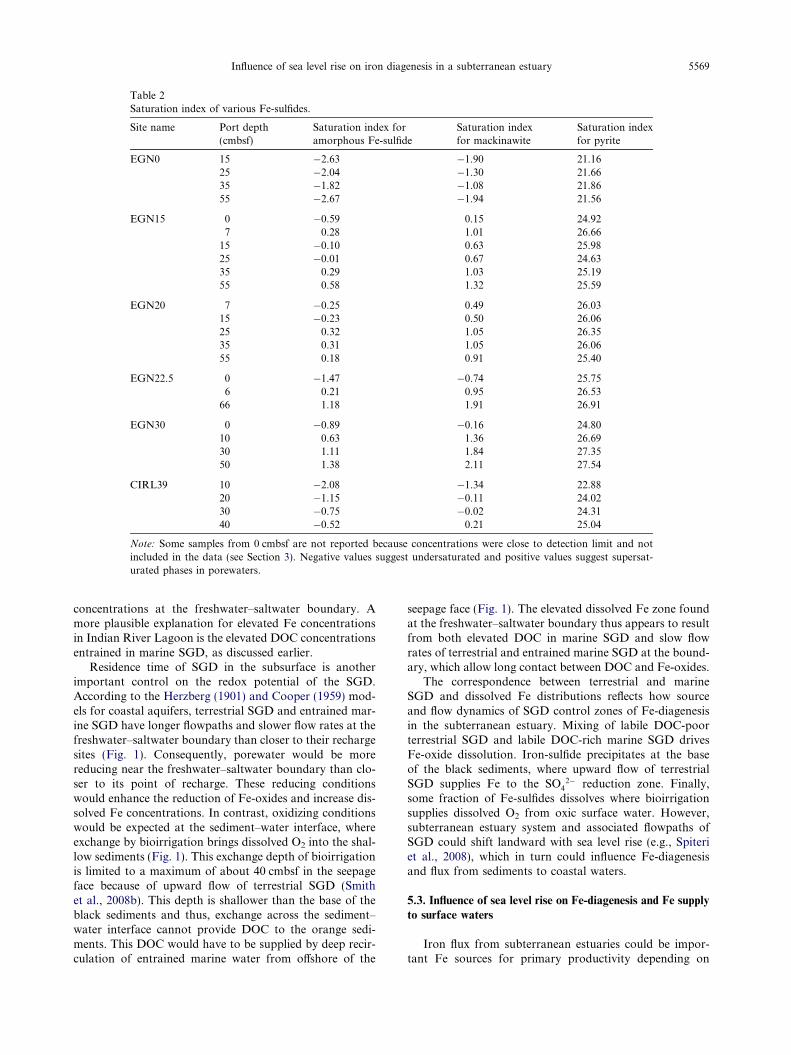
Table 2Saturation index of various Fe-sulfides.
Site name Port depth(cmbsf)
Saturation index foramorphous Fe-sulfide
Saturation indexfor mackinawite
Saturation indexfor pyrite
EGN0 15 �2.63 �1.90 21.1625 �2.04 �1.30 21.6635 �1.82 �1.08 21.8655 �2.67 �1.94 21.56
EGN15 0 �0.59 0.15 24.927 0.28 1.01 26.66
15 �0.10 0.63 25.9825 �0.01 0.67 24.6335 0.29 1.03 25.1955 0.58 1.32 25.59
EGN20 7 �0.25 0.49 26.0315 �0.23 0.50 26.0625 0.32 1.05 26.3535 0.31 1.05 26.0655 0.18 0.91 25.40
EGN22.5 0 �1.47 �0.74 25.756 0.21 0.95 26.53
66 1.18 1.91 26.91
EGN30 0 �0.89 �0.16 24.8010 0.63 1.36 26.6930 1.11 1.84 27.3550 1.38 2.11 27.54
CIRL39 10 �2.08 �1.34 22.8820 �1.15 �0.11 24.0230 �0.75 �0.02 24.3140 �0.52 0.21 25.04
Note: Some samples from 0 cmbsf are not reported because concentrations were close to detection limit and notincluded in the data (see Section 3). Negative values suggest undersaturated and positive values suggest supersat-urated phases in porewaters.
Influence of sea level rise on iron diagenesis in a subterranean estuary 5569
concentrations at the freshwater–saltwater boundary. Amore plausible explanation for elevated Fe concentrationsin Indian River Lagoon is the elevated DOC concentrationsentrained in marine SGD, as discussed earlier.
Residence time of SGD in the subsurface is anotherimportant control on the redox potential of the SGD.According to the Herzberg (1901) and Cooper (1959) mod-els for coastal aquifers, terrestrial SGD and entrained mar-ine SGD have longer flowpaths and slower flow rates at thefreshwater–saltwater boundary than closer to their rechargesites (Fig. 1). Consequently, porewater would be morereducing near the freshwater–saltwater boundary than clo-ser to its point of recharge. These reducing conditionswould enhance the reduction of Fe-oxides and increase dis-solved Fe concentrations. In contrast, oxidizing conditionswould be expected at the sediment–water interface, whereexchange by bioirrigation brings dissolved O2 into the shal-low sediments (Fig. 1). This exchange depth of bioirrigationis limited to a maximum of about 40 cmbsf in the seepageface because of upward flow of terrestrial SGD (Smithet al., 2008b). This depth is shallower than the base of theblack sediments and thus, exchange across the sediment–water interface cannot provide DOC to the orange sedi-ments. This DOC would have to be supplied by deep recir-culation of entrained marine water from offshore of the
seepage face (Fig. 1). The elevated dissolved Fe zone foundat the freshwater–saltwater boundary thus appears to resultfrom both elevated DOC in marine SGD and slow flowrates of terrestrial and entrained marine SGD at the bound-ary, which allow long contact between DOC and Fe-oxides.
The correspondence between terrestrial and marineSGD and dissolved Fe distributions reflects how sourceand flow dynamics of SGD control zones of Fe-diagenesisin the subterranean estuary. Mixing of labile DOC-poorterrestrial SGD and labile DOC-rich marine SGD drivesFe-oxide dissolution. Iron-sulfide precipitates at the baseof the black sediments, where upward flow of terrestrialSGD supplies Fe to the SO4
2� reduction zone. Finally,some fraction of Fe-sulfides dissolves where bioirrigationsupplies dissolved O2 from oxic surface water. However,subterranean estuary system and associated flowpaths ofSGD could shift landward with sea level rise (e.g., Spiteriet al., 2008), which in turn could influence Fe-diagenesisand flux from sediments to coastal waters.
5.3. Influence of sea level rise on Fe-diagenesis and Fe supply
to surface waters
Iron flux from subterranean estuaries could be impor-tant Fe sources for primary productivity depending on
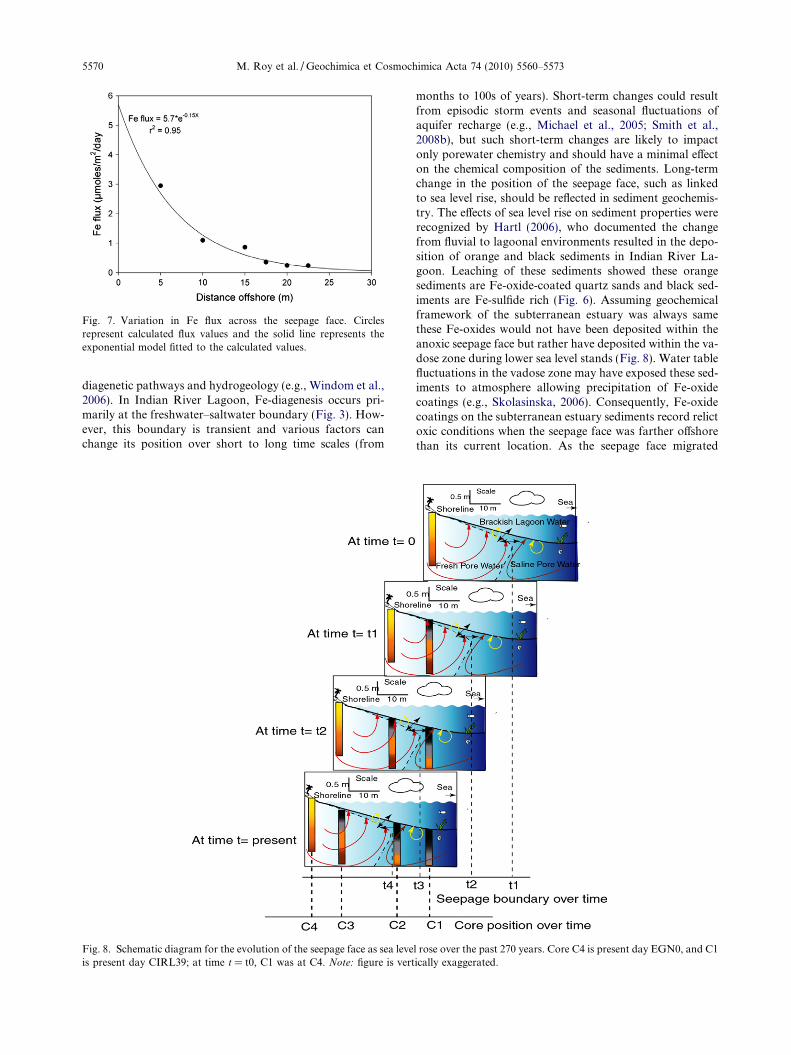
Fig. 7. Variation in Fe flux across the seepage face. Circlesrepresent calculated flux values and the solid line represents theexponential model fitted to the calculated values.
5570 M. Roy et al. / Geochimica et Cosmochimica Acta 74 (2010) 5560–5573
diagenetic pathways and hydrogeology (e.g., Windom et al.,2006). In Indian River Lagoon, Fe-diagenesis occurs pri-marily at the freshwater–saltwater boundary (Fig. 3). How-ever, this boundary is transient and various factors canchange its position over short to long time scales (from
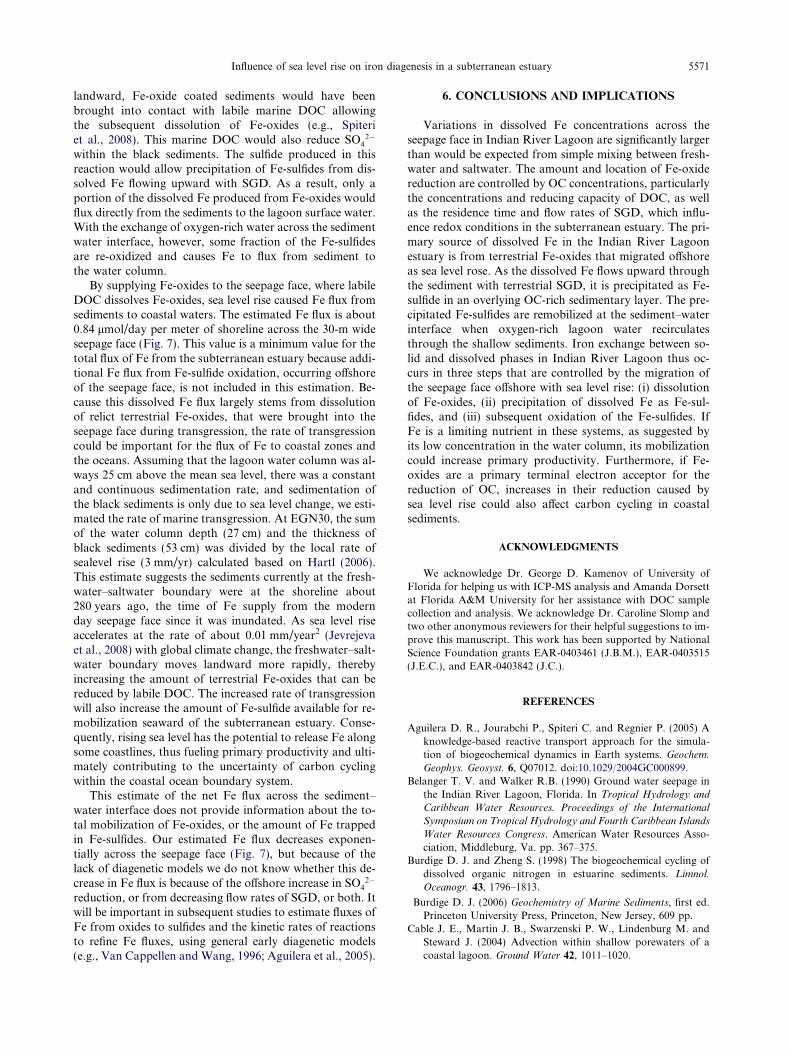
Fig. 8. Schematic diagram for the evolution of the seepage face as sea leveis present day CIRL39; at time t = t0, C1 was at C4. Note: figure is vert
months to 100s of years). Short-term changes could resultfrom episodic storm events and seasonal fluctuations ofaquifer recharge (e.g., Michael et al., 2005; Smith et al.,2008b), but such short-term changes are likely to impactonly porewater chemistry and should have a minimal effecton the chemical composition of the sediments. Long-termchange in the position of the seepage face, such as linkedto sea level rise, should be reflected in sediment geochemis-try. The effects of sea level rise on sediment properties wererecognized by Hartl (2006), who documented the changefrom fluvial to lagoonal environments resulted in the depo-sition of orange and black sediments in Indian River La-goon. Leaching of these sediments showed these orangesediments are Fe-oxide-coated quartz sands and black sed-iments are Fe-sulfide rich (Fig. 6). Assuming geochemicalframework of the subterranean estuary was always samethese Fe-oxides would not have been deposited within theanoxic seepage face but rather have deposited within the va-dose zone during lower sea level stands (Fig. 8). Water tablefluctuations in the vadose zone may have exposed these sed-iments to atmosphere allowing precipitation of Fe-oxidecoatings (e.g., Skolasinska, 2006). Consequently, Fe-oxidecoatings on the subterranean estuary sediments record relictoxic conditions when the seepage face was farther offshorethan its current location. As the seepage face migrated
l rose over the past 270 years. Core C4 is present day EGN0, and C1ically exaggerated.
Influence of sea level rise on iron diagenesis in a subterranean estuary 5571
landward, Fe-oxide coated sediments would have beenbrought into contact with labile marine DOC allowingthe subsequent dissolution of Fe-oxides (e.g., Spiteriet al., 2008). This marine DOC would also reduce SO4
2�
within the black sediments. The sulfide produced in thisreaction would allow precipitation of Fe-sulfides from dis-solved Fe flowing upward with SGD. As a result, only aportion of the dissolved Fe produced from Fe-oxides wouldflux directly from the sediments to the lagoon surface water.With the exchange of oxygen-rich water across the sedimentwater interface, however, some fraction of the Fe-sulfidesare re-oxidized and causes Fe to flux from sediment tothe water column.
By supplying Fe-oxides to the seepage face, where labileDOC dissolves Fe-oxides, sea level rise caused Fe flux fromsediments to coastal waters. The estimated Fe flux is about0.84 lmol/day per meter of shoreline across the 30-m wideseepage face (Fig. 7). This value is a minimum value for thetotal flux of Fe from the subterranean estuary because addi-tional Fe flux from Fe-sulfide oxidation, occurring offshoreof the seepage face, is not included in this estimation. Be-cause this dissolved Fe flux largely stems from dissolutionof relict terrestrial Fe-oxides, that were brought into theseepage face during transgression, the rate of transgressioncould be important for the flux of Fe to coastal zones andthe oceans. Assuming that the lagoon water column was al-ways 25 cm above the mean sea level, there was a constantand continuous sedimentation rate, and sedimentation ofthe black sediments is only due to sea level change, we esti-mated the rate of marine transgression. At EGN30, the sumof the water column depth (27 cm) and the thickness ofblack sediments (53 cm) was divided by the local rate ofsealevel rise (3 mm/yr) calculated based on Hartl (2006).This estimate suggests the sediments currently at the fresh-water–saltwater boundary were at the shoreline about280 years ago, the time of Fe supply from the modernday seepage face since it was inundated. As sea level riseaccelerates at the rate of about 0.01 mm/year2 (Jevrejevaet al., 2008) with global climate change, the freshwater–salt-water boundary moves landward more rapidly, therebyincreasing the amount of terrestrial Fe-oxides that can bereduced by labile DOC. The increased rate of transgressionwill also increase the amount of Fe-sulfide available for re-mobilization seaward of the subterranean estuary. Conse-quently, rising sea level has the potential to release Fe alongsome coastlines, thus fueling primary productivity and ulti-mately contributing to the uncertainty of carbon cyclingwithin the coastal ocean boundary system.
This estimate of the net Fe flux across the sediment–water interface does not provide information about the to-tal mobilization of Fe-oxides, or the amount of Fe trappedin Fe-sulfides. Our estimated Fe flux decreases exponen-tially across the seepage face (Fig. 7), but because of thelack of diagenetic models we do not know whether this de-crease in Fe flux is because of the offshore increase in SO4
2�
reduction, or from decreasing flow rates of SGD, or both. Itwill be important in subsequent studies to estimate fluxes ofFe from oxides to sulfides and the kinetic rates of reactionsto refine Fe fluxes, using general early diagenetic models(e.g., Van Cappellen and Wang, 1996; Aguilera et al., 2005).
6. CONCLUSIONS AND IMPLICATIONS
Variations in dissolved Fe concentrations across theseepage face in Indian River Lagoon are significantly largerthan would be expected from simple mixing between fresh-water and saltwater. The amount and location of Fe-oxidereduction are controlled by OC concentrations, particularlythe concentrations and reducing capacity of DOC, as wellas the residence time and flow rates of SGD, which influ-ence redox conditions in the subterranean estuary. The pri-mary source of dissolved Fe in the Indian River Lagoonestuary is from terrestrial Fe-oxides that migrated offshoreas sea level rose. As the dissolved Fe flows upward throughthe sediment with terrestrial SGD, it is precipitated as Fe-sulfide in an overlying OC-rich sedimentary layer. The pre-cipitated Fe-sulfides are remobilized at the sediment–waterinterface when oxygen-rich lagoon water recirculatesthrough the shallow sediments. Iron exchange between so-lid and dissolved phases in Indian River Lagoon thus oc-curs in three steps that are controlled by the migration ofthe seepage face offshore with sea level rise: (i) dissolutionof Fe-oxides, (ii) precipitation of dissolved Fe as Fe-sul-fides, and (iii) subsequent oxidation of the Fe-sulfides. IfFe is a limiting nutrient in these systems, as suggested byits low concentration in the water column, its mobilizationcould increase primary productivity. Furthermore, if Fe-oxides are a primary terminal electron acceptor for thereduction of OC, increases in their reduction caused bysea level rise could also affect carbon cycling in coastalsediments.
ACKNOWLEDGMENTS
We acknowledge Dr. George D. Kamenov of University ofFlorida for helping us with ICP-MS analysis and Amanda Dorsettat Florida A&M University for her assistance with DOC samplecollection and analysis. We acknowledge Dr. Caroline Slomp andtwo other anonymous reviewers for their helpful suggestions to im-prove this manuscript. This work has been supported by NationalScience Foundation grants EAR-0403461 (J.B.M.), EAR-0403515(J.E.C.), and EAR-0403842 (J.C.).
REFERENCES
Aguilera D. R., Jourabchi P., Spiteri C. and Regnier P. (2005) Aknowledge-based reactive transport approach for the simula-tion of biogeochemical dynamics in Earth systems. Geochem.
Geophys. Geosyst. 6, Q07012. doi:10.1029/2004GC000899.
Belanger T. V. and Walker R.B. (1990) Ground water seepage inthe Indian River Lagoon, Florida. In Tropical Hydrology and
Caribbean Water Resources. Proceedings of the International
Symposium on Tropical Hydrology and Fourth Caribbean Islands
Water Resources Congress. American Water Resources Asso-ciation, Middleburg, Va. pp. 367–375.
Burdige D. J. and Zheng S. (1998) The biogeochemical cycling ofdissolved organic nitrogen in estuarine sediments. Limnol.
Oceanogr. 43, 1796–1813.
Burdige D. J. (2006) Geochemistry of Marine Sediments, first ed.Princeton University Press, Princeton, New Jersey, 609 pp.
Cable J. E., Martin J. B., Swarzenski P. W., Lindenburg M. andSteward J. (2004) Advection within shallow porewaters of acoastal lagoon. Ground Water 42, 1011–1020.
5572 M. Roy et al. / Geochimica et Cosmochimica Acta 74 (2010) 5560–5573
Cable J. E., Martin J. B. and Jaeger J. (2006) ExoneratingBernouilli? Or evaluating the physics of seepage meter mea-surements in marine sediments. Limnol. Oceanogr. Meth. 4,
172–183.
Caetano M. and Vale C. (2002) Retention of arsenic andphosphorous in iron-rich concretions of Tagus salt marshes.Mar. Chem. 79, 261–271.
Charette M. A. and Sholkovitz E. R. (2002) Oxidative precipitationof groundwater-derived ferrous iron in the subterranean estuaryof a coastal bay. Geophys. Res. Lett. 29, 84–85. doi:10.1029/
2001GLO4512.
Charette M. A. and Buesseler E. R. (2004) Submarine groundwaterdischarge of nutrients and copper to an urban subterraneanestuary of Chesapeake Bay (Elizabeth River). Limnol. Ocea-
nogr. 49, 376–385.
Charette M. A., Sholkovitz E. R. and Hansel C. M. (2005) Traceelement cycling in a subterranean estuary: part 1. Geochemistryof the Permeable sediments. Geochim. Cosmochim. Acta 69,
2095–2109.
Chauhan A., Cherrier J. and Williams H. N. (2009) Impact ofsideways and bottom-up control factors on bacterial commu-nity succession over a tidal cycle. Proc. Natl. Acad. Sci. USA
106, 4301–4306. doi:10.1073/pnas.0809671106.
Cherrier J., Bauer J. and Druffel E. R. M. (1996) Utilization andturnover of labile dissolved organic matter by bacterial hetero-trophs in eastern North Pacific surface waters. Mar. Ecol. Prog.
Ser. 139, 267–279.
Cherrier J., Cable J. E., Martin J. B. and Smith C. G. (2007) Pore-water dissolved organic carbon gradients in a subterraneanestuary. In American Society of Limnology Oceanography.Winter Meeting, Santa Fe, New Mexico.
Cline J. (1969) Spectrophotometric determination of hydrogensulphide in natural waters. Limnol. Oceanogr. 14, 454–458.
Cooper H. H. (1959) A hypothesis concerning the dynamic balanceof fresh water and salt water in a coastal aquifer. J. Geophys.
Res. 71, 461–467.
Dorsett A. (2009) Carbon isotopic methods to examine sedimentbiogeochemistry and groundwater flow from an unconfinedaquifer. MS thesis, Florida A&M University.
Elrod V. A., Berelson W. M., Coale K. H. and Johnson K. S.(2004) The flux of iron from continental shelf sediments: amissing source for global budgets. Geophys. Res. Lett. 31.
doi:10.1029/2004GL020216.
Fetter C. W. (2001) Applied Hydrogeology, third ed. Prentice Hall,Upper Saddle River, New Jersey, 691 pp.
Froelich P. N., Klinkhammer G. P., Bender M. L., Luedtke N. A.,Heath G. R., Cullen D. P. D., Hammond D., Hartman B. andMaynard V. (1979) Early oxidation of organic matter in pelagicsediments of the Eastern equatorial Atlantic: suboxic diagen-esis. Geochim. Cosmochim. Acta 43, 1075–1090.
Fung I. Y., Meyn S. K., Tegan I., Doney S. C., John J. G. andBishop K. B. (2000) Iron supply and demand in the upperocean. Global Biogeochem. Cycles 14, 281–295.
Hall G. E. M., Vaive J. E., Beer R. and Hoashi M. (1996) Selectiveleaches revisited, with emphasis on the amorphous oxyhydrox-ide phase extraction. J. Geochem. Explor. 56, 59–78.
Hartl K. M. (2006) Facies distribution and hydraulic conductivityof lagoonal sediments in a Holocene transgressive barrier islandsequence, Indian River Lagoon, Florida. MS thesis, Universityof Florida.
Herzberg A. (1901) Die Wasserversogung eniger Nordseebader. J.
Gasbeleuchtung Wasserversogung (Minich) 44, 815–819, and
842–844.
Jevrejeva S., Moore J. C., Grinsted A. and Woodworth P. L. (2008)Recent global sea level acceleration started over 200 years ago?Geophys. Res. Lett. 35. doi:10.1029/2008GL033611.
Ler A. and Stanforth R. (2003) Evidence of surface precipitationof phosphate on goethite. Environ. Sci. Technol. 37, 2694–
2700.
Lion L. W., Altmann R. S. and Leckle J. O. (1982) Trace-metaladsorption characteristics of estuarine particulate matter:evaluations of contributions of Fe/Mn oxide and organicsurface coatings. Environ. Sci. Technol. 16, 660–666.
Martin J. B., Hartl K. M., Corbett D. R., Swarzenski P. W. andCable J. E. (2003) A multilevel porewater sampler for perme-able sediments. J. Sed. Res. 73, 128–132.
Martin J. B., Cable J. E., Swarzenski P. W. and Lindenberg M. K.(2004) Enhanced submarine ground water discharge frommixing of porewater and estuarine water. Ground Water 42,
1000–1010.
Martin J. B., Cable J. E., Jaeger J., Hartl K. and Smith C. G.(2006) Thermal and chemical evidence for rapid water exchangeacross the sediment–water interface by bioirrigation in theIndian River Lagoon, Florida. Limnol. Oceanogr. 51, 1332–
1341.
Martin J. B., Cable J. E., Smith C. G., Roy M. and Cherrier J.(2007) Magnitudes of submarine groundwater discharge frommarine and terrestrial sources: Indian River Lagoon, Florida.Water Resour. Res. 43. doi:10.1029/2006WR005266.
Martin J. H. and Fitzwater S. E. (1988) Iron deficiency limitsphytoplankton growth in the north-east Pacific subarctic.Nature 331, 341–343.
Martin J. H., Coale K. H., Johnson K. S., Fitzwater S. E., GordonR. M., Tanner S. J., Hunter C. N., Elrod V. A., Nowicki J. L.,Coley T. L., Barber R. T., Lindley S., Watson A. J., Scoy K. V.,Law C. S., Liddicoat M. I., Ling R., Stanton T., Stockel J.,Collins C., Anderson A., Bidigare R., Ondrusek M., Latsa M.,Millero F. J., Lee K., Yao W., Zhang J. Z., Friederich G.,Sakamoto C., Chavez F., Buck K., Kolber Z., Greene R.,Falkowski P., Chisholm S. W., Hoge F., Swift R., Yungel J.,Turner S., Nightingale P., Hatton A., Liss P. and Tindale N. W.(1994) Testing the iron hypothesis in ecosystems of theequatorial Pacific Ocean. Nature 371, 123–129.
Melloul A. and Collin M. (2006) Hydrological changes in coastalaquifers due to sea level rise. Ocean Coast. Manage. 49, 281–
297.
Michael H. A., Mulligan A. E. and Harvey C. F. (2005) Seasonaloscillations in water exchange between aquifers and the coastalocean. Nature 436. doi:10.1038/nature 03935.
Moore W. S. and Church T. M. (1996) Submarine groundwaterdischarge. Nature 382, 121–122.
Moore W. S. (1999) The subterranean estuary: a reaction zone ofground water and sea water. Mar. Chem. 65, 111–125.
Pandit A. and El-Khazen C. C. (1990) Groundwater seepage intothe Indian River Lagoon at Port St. Lucie, Fla. Science 53, 169–
179.
Penland S. and Ramsey K. E. (1990) Relative sea level rise inLouisiana and the Gulf of Mexico: 1908–1988. J. Coast. Res. 6,
323–342.
Pollard R. T., Salter I., Sanders R. J., Lucas M. I., Moore C. M.,Mills R. A., Statham P. J., Allen J. T., Bakker A. R., CharetteM. A., Fielding S., Fones G. R., French M., Hickman A. E.,Holland R. J., Hughes J. A., Jickells T. D., Lampitt R. S.,Morris P. J., Nedelec F. H., Nielsdottir M., Planquette H.,Popova E. E., Poulton A. J., Read J. F., Seeyave S., Smith T.,Stinchcombe M., Taylor S., Thomalla S., Venables H. J.,Williamson R. and Zubkov M. V. (2009) Southern Ocean deep-water carbon export enhanced by natural iron fertilization.Nature 457, 577–581.
Riedl R. J., Huang N. and Machan R. (1972) The subtidal pump: amechanism of interstitial water exchange by wave action. Mar.
Biol. 13, 210–221.
Influence of sea level rise on iron diagenesis in a subterranean estuary 5573
Scott T. M. (1992) A geological overview of Florida. Florida
Geological Survey, Open File Report No. 50. Available from:<http://aquacomm.fcla.edu/1509/1UF00001048.pdf>.
Severmann S., MacManus J., Berelson W. M. and Hammond D. E.(2010) The continental shelf benthic iron flux and its isotopecomposition. Geochim. Cosmochim. Acta 74, 3984–4004.
Shum K. T. (1992) Wave-induced advective transport below arippled water–sediment interface. J. Geophys. Res. 97, 789–808.
Skolasinska K. (2006) Clogging microstructures in the vadosezone-laboratory and field studies. Hydrogeol. J. 14, 1005–1017.
Slomp C. P., Van der Gaast S. J. and Van Raaphorst W. (1996)Phosphorous binding by poorly crystalline iron oxides in NorthSea sediments. Mar. Chem. 52, 55–73.
Slomp C. P. and Van Cappellen P. (2004) Nutrient inputs to thecoastal ocean through submarine groundwater discharge:controls and potential impact. J. Hydrol. 295, 64–86.
Smith C. G., Cable J. E., Martin J. B., Cherrier J. and Roy M.(2006) Mixing in the subterranean estuary: a comparison ofRadon-222 porewater models. In Coastal Hydrology and
Processes (eds. V. P. Singh and Y. Jun Xu). pp. 355–368.Smith C. G., Cable J. E. and Martin J. B. (2008a) Episodic high
intensity mixing events in a subterranean estuary: effects oftropical cyclones. Limnol. Oceanogr. 53, 666–674.
Smith C. G., Cable J. E., Martin J. B. and Roy M. (2008b)Evaluating the source and seasonality of submarine groundwa-ter discharge using a radon-222 porewater transport model.Earth Planet. Sci. Lett. 273, 312–322.
Smith N. P. (1987) An introduction to the tides of Florida’s IndianRiver Lagoon. Part I. Water Levels. Florida Scientist 50, 49–61.
Snyder M., Taillefert M. and Ruppel C. (2004) Redox zonation atthe saline-influenced boundaries of a permeable surficial aqui-fer: effects of physical forcing on the biogeochemical cycling ofiron and manganese. J. Hydrol. 296, 164–178.
Spiteri C., Regnier P., Slomp C. P. and Charette M. A. (2006) PH-dependent iron-oxide precipitation in a subterranean estuary. J.
Geochem. Explor. 88, 399–403.
Spiteri C., Slomp C. P., Charette M. A., Tuncay K. and Meile C.(2008) Flow and nutrient dynamics in a subterranean estuary(Waquoit Bay, MA, USA): field data and reactive transportmodeling. Geochim. Cosmochim. Acta 72, 3398–3412.
Suzuki Y., Tanoue E. and Ito H. (1992) A high-temperaturecatalytic oxidation method for the determination of dissolvedorganic carbon in seawater: analysis and improvement. Deep-
Sea Res. 39, 185–198.
Testa J. M., Charette M. A., Sholkovitz E. R., Allen M. C., RagoA. and Herbold C. W. (2002) Dissolved iron cycling in thesubterranean estuary of a coastal bay: Waquoit Bay, Massa-chusetts. Estuar. Freshwat. Biogeochem. 203, 255–256.
Toth D. J. (1988) Salt water intrusion in coastal areas of Volusia,Brevard, and Indian River counties, Palatka, Fl. TechnicalPublication # SJ 88-1, St. Johns River Water ManagementDistrict, Florida.
Van Cappellen P. and Wang Y. (1996) Cycling of iron andmanganese in surface sediments: a general theory for thecoupled transport and reaction of carbon, oxygen, nitrogen,sulfur, iron and manganese. Am. J. Sci. 296, 197–243.
Windom H. L., Moore W. S., Niencheski L. F. H. and Jahnke R.A. (2006) Submarine groundwater discharge: a large previouslyunrecognized source of dissolved iron to the South AtlanticOcean. Mar. Chem. 102, 252–266.
Zhang H., Davison W., Mortimer R. J. G., Krom M. D., Hayes P.J. and Davies I. M. (2002) Localised remobilization of metals ina marine sediment. Sci. Total Environ. 296, 175–187.
Associate editor: Jack J. Middelburg