Embed Size (px)
Citation preview
The authors are solely responsible for the content of this technical presentation. The technical presentation does not necessarily reflect the official position of the American Society of Agricultural and Biological Engineers (ASABE), and its printing and distribution does not constitute an endorsement of views which may be expressed. Technical presentations are not subject to the formal peer review process by ASABE editorial committees; therefore, they are not to be presented as refereed publications. Citation of this work should state that it is from an ASABE meeting paper. EXAMPLE: Author's Last Name, Initials. 2008. Title of Presentation. ASABE Paper No. 08----. St. Joseph, Mich.: ASABE. For information about securing permission to reprint or reproduce a technical presentation, please contact ASABE at [email protected] or 269-429-0300 (2950 Niles Road, St. Joseph, MI 49085-9659 USA).
An ASABE Meeting Presentation Paper Number: 083752
Influence of spray additives on droplet evaporation and residual patterns on wax and wax-free surfaces
Heping Zhu, Agricultural Engineer, USDA/ARS, ATRU, Wooster, OH. [email protected] Yang Yu, Visiting Associate Professor, FABE, OARDC/The Ohio State University, Wooster, OH.
H. Erdal Ozkan, Professor, FABE, The Ohio State University, Columbus, OH.
Richard C. Derksen, Agricultural Engineer, USDA/ARS, ATRU, Wooster, OH.
Charles R. Krause, Plant Pathologist, USDA/ARS, ATRU, Wooster, OH.
Written for presentation at the 2008 ASABE Annual International Meeting
Sponsored by ASABE Rhode Island Convention Center
Providence, Rhode Island June 29 – July 2, 2008
Mention any other presentations of this paper here, or delete this line.
Abstract. Evaporation time and wetted area of single droplets sizing from 246 to 886 µm at relative humidity (RH) ranging from 30 to 90% were measured with sequential images under controlled laboratory conditions. Droplets were placed inside an environmental-controlled chamber under a stereoscope and a high definition digital camera. The spray mixtures used to form droplets included different combinations of water, a polymer drift retardant, a surfactant, and two insecticides. The droplet evaporation was investigated on the surfaces of crabapple leaf surfaces, hydrophilic and hydrophobic glass slides, respectively. Adding surfactant into spray mixtures greatly increased droplet wetted area while droplet evaporation time was greatly reduced. For a 343 µm droplet on the crabapple leaf at 60% RH, the evaporation time decreased from 70 to 50 s and the wetted area increased from 0.366 to 0.890 mm2 after the surfactant was added into the spray mixture containing water and insecticide. Adding the drift retardant into the spray mixture slightly increased the droplet evaporation time and decreased the droplet coverage area. Also, changing the target surface from the hydrophilic slide to the hydrophobic slide greatly increased the droplet coverage area and reduced the droplet evaporation time. Increasing RH could increase the droplet evaporation time greatly but did not change the coverage area. The droplet evaporation time and coverage area increased exponentially as the droplet size increased.
Keywords. Evaporation time, Droplet size, Pesticide formulation, Surfactant, Drift retardant, Spray efficiency.

2
Introduction Reduction of pesticide use has been emphasized as an important goal by the public for many years due to the potential risks to human health and environment. However, the progress toward that goal has not been significantly achieved during the past decade. In the United States, an estimated 216.6x10⁶ kg of pesticide active ingredients was used for crop protection in 1991, while that amount increased to 224.3x10⁶ kg in 2004 (Osteen and Livingston, 2006). To realize greater pest control efficiency with less pesticide use, the combined efforts of application system performances, formulation of pest-control agents, plant surface fine structure, and microclimate conditions must be recognized and researched. Ignoring either the four factors can cause excessive pesticide use.
Droplet size is always used as one of the most important parameters influencing pest control. Droplets should be large enough to deposit on the target after some evaporation during transportation, but they should also be small enough to provide sufficient pesticide coverage on the target (Reichard et al., 1977). Using large droplets can reduce drift potential but it can reduce the control efficiency, resulting in excessive pesticide use (Smith et al., 1975; Wilson et al., 1963).
Numerous field experiments reported that the spray performances and leaf wetness were enhanced when non-ionic surfactants were added (Zabkiewicz et al., 1985; Holloway et al., 1992; Nalewaja and Matysiak, 2000; Uhlig and Wissemeier, 2000; Basu et al., 2002; Spanoghe et al., 2007). Surfactant added foliar sprays improved chemical coverage on leaves, removed air films between spray and leaf surface and reduced surface tension on leaves (Holloway et al., 1985 and 1992; Zabkiewicz et al., 1985). Droplet adhesion, spreading area and retention on leaf surfaces can also be increased as pesticide droplets containing the surfactant (Basu et al., 2002). Herbicide application rates could be significantly reduced by adding the nonionic surfactant into spray mixtures (Ramsdale et al., 2001).
Spray drift retardants were reported to reduce spray drift in many laboratory and field studies (Bouse et al., 1988; Salyani and Cromwell, 1992; Smith, 1993; Ozkan et al., 1993; VanGessel and Johnson, 2000 and 2005; Miller et al., 2001). This technique has been recommended as an alternative method to reduce drift for the field applications when other methods are not available. Although some drift retardants lost their ability after recirculation through the pumps (Bouse et al., 1988; Reichard et al., 1996), Zhu et al. (1997) reported that the drift retardant with the active ingredient of xanthan gum maintained great resistance to breakdown due to shear after their investigation of various polymer compositions with a range of molecular weights, anionicities and concentrations.
When droplets are delivered to the targets, they will experience the process of spreading and evaporation (Bukovac et al., 1995). The process varies with droplet size, leaf surface fine structure, physical properties of formulation, and weather conditions. In many cases, droplets are required to stay on the targets long enough for plants to absorb chemical ingredients; however, in some other cases longer evaporation may require to use large droplets which can cause runoff and low efficiency.
Understanding the evaporation and spreading process of pesticide droplets on targets can assist better utilization of pest control agents to increase foliar application efficiency. However, previous research mostly focused on the droplet evaporation during the transportation of droplets from the atomizer to the target or droplet evaporation for other industrial uses but not for agro-chemical droplets (Picknett et al., 1977; Baines and James, 1994; Cooper et al., 1983; Westin et al., 1998). The ingredients of agro-chemicals are significantly different from those
3
used in other industries such as pharmaceuticals. Little research has been done on how droplets spread out and then evaporate on leaf surfaces for foliar agro-chemical spray applications. It is unclear how spray additives such as nonionic colloidal polymer drift retardant or an alkyl polyoxyethylene surfactant affect the droplet evaporation and spreading process in foliar applications and how they react on different types of leaves under varied relative humidity conditions.
The objective of this research was to investigate the effects of spray mixture additive, droplet size, and RH on the evaporation time and coverage area of droplets deposited on a hydrophilic surface, a hydrophobic surface and crabapple leaves, in an effort to provide useful information for spray applicators, pesticide formulators and sprayer manufacturers to maximize the pesticide spray application efficiency and minimize pesticide use.
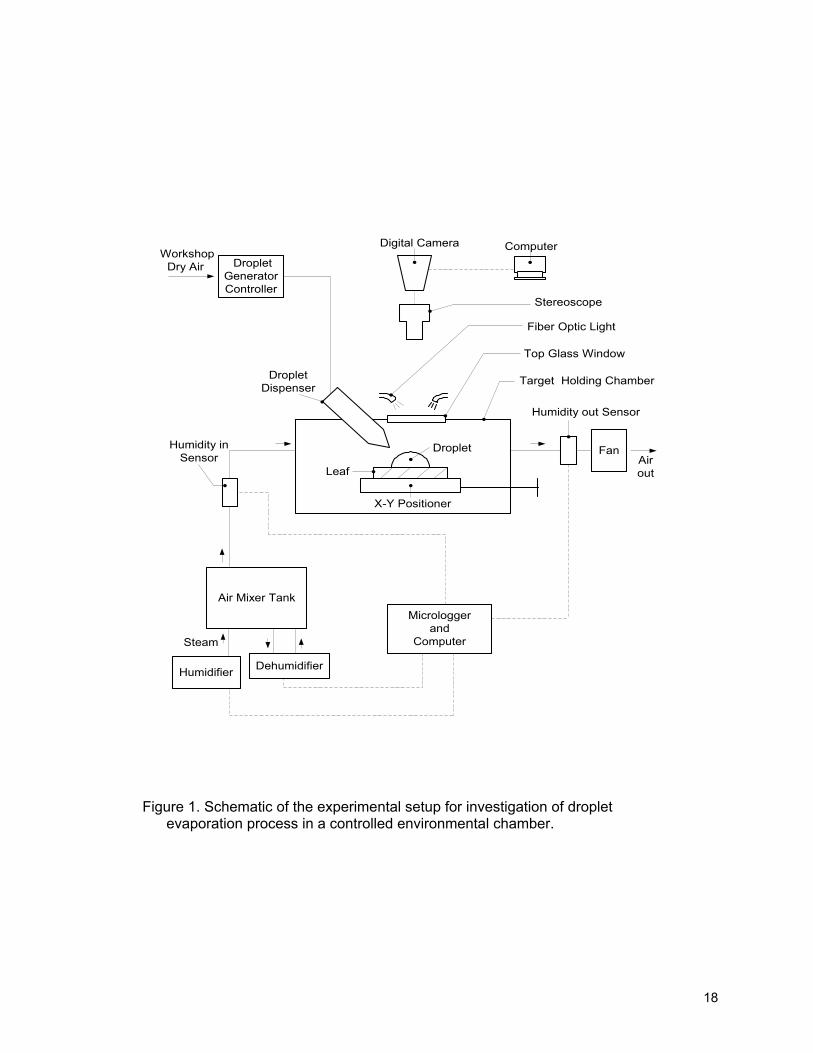
Materials and Methods An experimental system was developed for investigation of droplet evaporation on different targets. The system consists of a RH control unit, a target holding chamber, a stereoscope with a digital camera, and a droplet generator (Fig. 1).
The RH control unit was built with a humidifier, a dehumidification unit, a 20.8L rectangle air mixing tank, RH probe and a micro data-logger (21X, Campbell), and associated electronics. The desired RH air in the air mixing chamber was obtained by mixing humid air from the humidifier and the dry air from the dehumidification unit. The amounts of humid air and dry air were controlled by the micro data-logger, which limited the duty cycle of the humidifier and the dehumidifier through ports connected to external electronic relays. A set point of RH can be entered into the data-logger programming to generate air with constant RH ranging from 10 to 90%.
The target holding chamber was constructed from aluminum in a rectangle shape. The chamber was 12.6 cm long, 12.6 cm wide and 7.8 cm high, and its internal capacity was 0.56 L. There was a 7.8 cm diameter quartz optical flat glass on the top of the chamber for observing targets inside the chamber. A manual X-Y positioner was mounted inside the chamber for holding and locating targets. With the positioner, droplet positions on targets could be easily adjusted in two directions. The air with constant RH inside the chamber was discharged from the RH control unit. An RH sensor (Model PT 1000 IEC 751, Vaisala Inc., Woburn, MA) was installed at each air inlet and outlet to monitor if there was any outside air entering the chamber. The outlet RH sensor was also used to control the humidifier. The chamber was completely insulated from the environment. A small 110V AC axial fan (Model 3VU68, Dayton Electric Manufacturing Company, Niles, IL) was used to exhaust the air inside the chamber at the speed of 0.5 L/m. The fan also created a vacuum source to draw a low volume of air from the air mixing chamber in the RH control unit through the target holding chamber. There was a port near the top corner of the target holding chamber to allow access for the syringe which deposited droplets.
The stereoscope (Model SZX12, Olympus, Japan) was mounted vertically above the glass on the top of the chamber. The stereoscope magnification ranged from 16 to 63. The droplet evaporation process inside the chamber was observed by the stereoscope with two 41 cm long flexible fiber optic lights which were provided from a 120V halogen light source (Model A20500.101EKE, B&B Microscopes, LTD). An INSIGHT FIREWIRE© digital camera (Model SZX-TB1, OLYMPUS) was used to take sequential images of droplets while the evaporation process was taking place. An imaging program (Spot, Diagnostic Instruments, Inc) was used to record and save the sequential images in a computer. The time interval for the images was set from 1 to 8 seconds depending on sizes of droplets.
4
The droplet generator was a microprocessor-based timed mode, air-powered fluid dispenser (Model 2405, EFD Inc., East Providence, RI) that could produce a single droplet with a diameter down to 200 µm. The generator regulated the amount of liquid to control droplet sizes by manipulating the air pressure, dispensing time and vacuum pullback. The high-speed solenoid system provided consistent droplet control for repeated production of the same size droplets. The dispensing time ranged from 0.0001 to 1000 s and air pressure ranged from 0 to 35 kPa. Vacuum control prevented dripping when thin fluids were used. The droplet generator also consisted of a 7.3 cm long and 1.1 cm diameter piston-barrel reservoir and a No. 33 gage chamfered precision tip to produce droplets from 200 to 1000 µm. The 3 mL reservoir was placed to a port on the target holding chamber for depositing droplets on targets.
Sizes of droplets from the generator were first estimated with water sensitive papers to set the air pressure, vacuum and dispensing time. Final droplet sizes were measured from the side view images of droplets on a clean glass slide by the stereomicroscope. The droplet formed a segment of a sphere (Figure 2) when it deposited on the glass slide. The droplet diameter was calculated from the volume of the segment using the following equation.
31
22 )]43([ hshd += (1)
Where, d is the actual droplet diameter (µm), h is height of droplet deposit on the glass (µm), and s is the width of droplet deposit on the glass (µm).
After a droplet was deposited on a target surface, it spreads out on the surface and evaporates. Droplet evaporation time was measured from the total number of sequential images and intervals after the droplet was deposited. The maximal coverage area (or wetted area) of the droplet after spreading was measured with ImageProPlus’ Polygonal Hand-trace Feature (version 4.1, Media Cybernetics, Bethesda, MD). The standard area of each pixel grid for the area measurement ranged from 1.3x10⁻⁶ to 8.6x10⁻⁶ mm2 depending on the amplification used to record images. The program was calibrated with a focal length of a Zeiss 0.01 mm micrometer slide.
The variables used for the study of droplet evaporation time and the maximal droplet coverage area on targets were: three different target surfaces (hydrophilic slide, hydrophobic slide, and crabapple leaf), three RH conditions (30, 60 and 90%), five droplet sizes (246, 343, 575, 762, and 886 µm) and seven liquid mixtures. The first mixture was distilled water only, the second mixture was distilled water and a liquid formulation imidacloprid insecticide (Marathon II, Olympic Horticultural Products Company, Mainland, PA), the third mixture was the second mixture with an addition of a nonionic colloidal polymer drift retardant Strike Zone (Helena Chemical Company, Collierville, TN), the fourth mixture was the second mixture with an addition of an alkyl polyoxyethylene surfactant X-77® (Loveland Industries Inc., Greeley, CO), the fifth mixture was distilled water and a powder formulation Dinotefuran insecticide (Safari, Valent USA Corporation, Walnut Creek, CA), the sixth mixture was the fifth mixture with an addition of the drift retardant, and the seventh mixture was the fifth mixture with an addition of the surfactant. The formulation, percent active ingredient and concentration of the insecticide, drift retardant and surfactant are listed in Table 1. Surface tension of the seven mixtures was measured with a Fisher Semiautomatic Model 21 Tensiomat® tensiometer, and viscosity of the seven mixtures was measured with a No. E335/150 glass capillary viscometer (Cannon Instrument Company, State College, PA). Their values are listed in Table 2.
The hydrophilic slide was a smooth wax-free glass microscope slide that was used, cleaned with acetone, and was stored in methanol until used again. The hydrophobic slide was the same
5
hydrophilic slide but coated with a thin layer of transparent liquid wax (Rain•X®, Sopus Products, Houston, TX). They were selected for the tests because they covered a wide range of contact angles of droplets on numerous fine structures of leaf surfaces. Contact angles of 343 µm droplets with different mixtures on the hydrophilic slide, the hydrophobic slide, and crabapple leaf surface were listed in Table 2. The contact angle was determined with an Image J software (National Institute of Mental Health, Bethesda, Maryland) using the method described by Chachalis et al. (2001) by measuring the side-view images taken from the stereomicroscope.
One droplet was deposited on the target surface inside the chamber each time. After each evaporation period, the position of the target on the X-Y positioner was relocated within the chamber to expose an un-touched area for a new droplet. Tests were conducted in the ambient temperature of 22°C, and each treatment was repeated for three times.
Data were analyzed and regression equations were developed with the SAS Enterprise Guide program (SAS Institute Inc., Cary, NC). Exponential function Y = aеbX (a>0, b>0) was selected for regression equations of evaporation time (Y) or maximal coverage area (Y) with droplet size (X) in this study. The selection was based on the fact that R-Square (r2) values for regression equations of the exponential function ranged from 0.97 to 0.99, which was higher than the ones from reciprocal function, logarithmic function, power function, and logistic growth curve function.
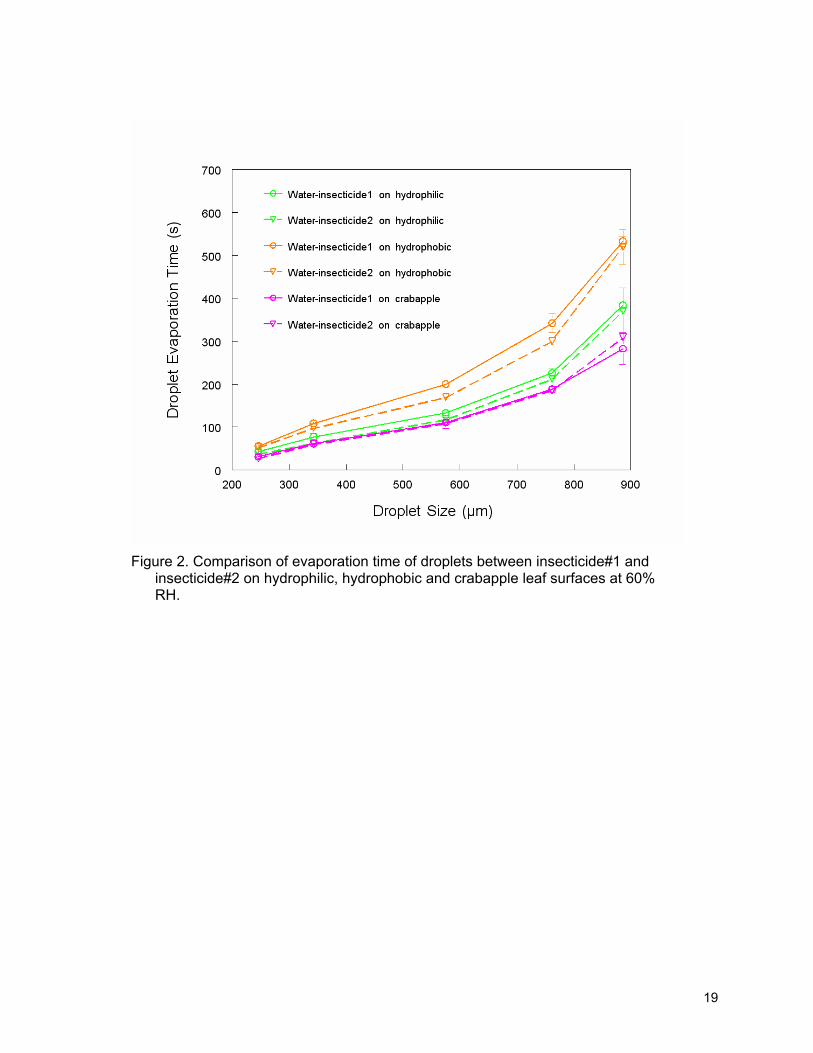
Results and Discussion There was no significant difference (p<0.05) in evaporation time of droplets on each hydrophilic surface, hydrophobic surface or crabapple leaf between mixture 2 (water+insecticide#1) and mixture 5 (water+insecticide#2) (fig. 2). This result was true for the two insecticides added into drift retardant mixtures (mixtures 3 and 6) and surfactant mixtures (mixtures 4 and 7). That is, the effect of the two different insecticides on droplet evaporation time was not significantly different, or adding either liquid insecticide#1 or powder insecticide#2 into spray mixtures would have the same evaporation time. However, similar results were not found for droplet coverage area on each three different surfaces although the significance of difference between two insecticides was very weak at p<0.05. Because of this reason, mixtures containing insecticide#1 and insecticide#2 for each treatment were grouped as an insecticide for the future reports for droplet evaporation times, but not for the droplet coverage area on the three target surfaces.
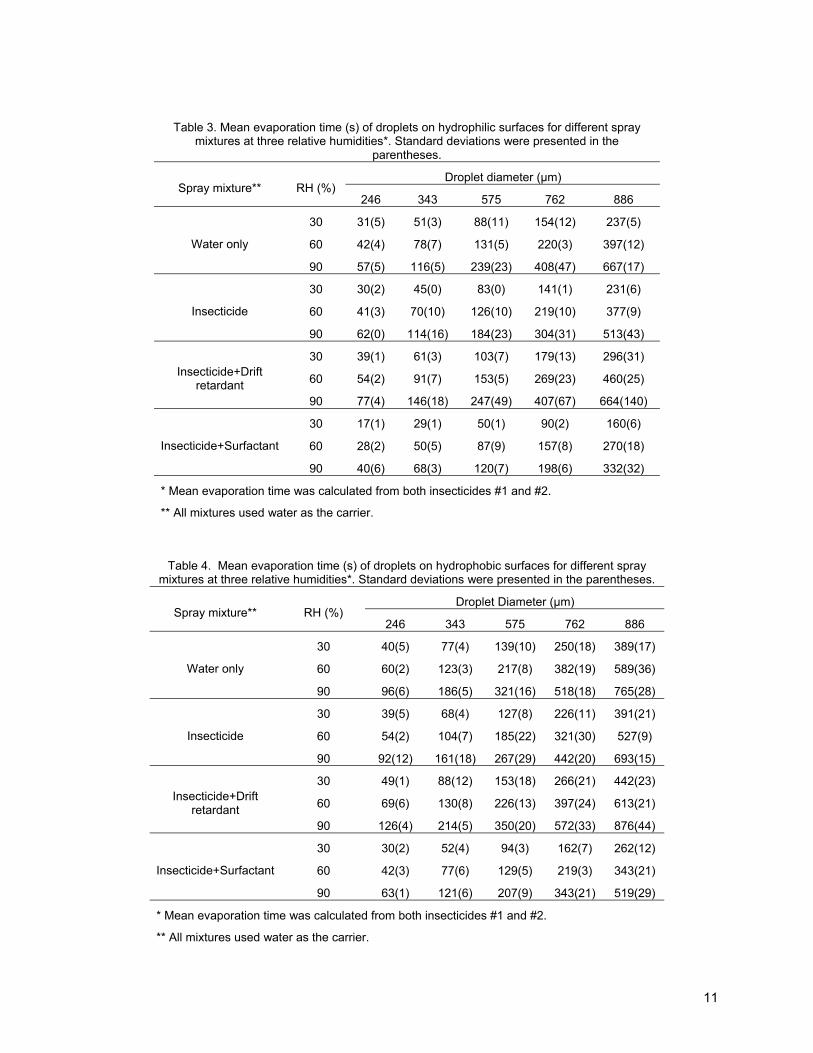
Droplet Evaporation Time Table 3, 4 and 5 illustrated the evaporation time of five size droplets with different mixtures on the hydrophilic, hydrophobic and crabapple leaf surfaces. The mean evaporation time of droplets was significantly increased by adding the drift retardant into the mixtures containing water and insecticides, or significantly decreased by adding the surfactant into the mixtures. For example, the evaporation time of 343 µm droplets containing insecticides at 60% RH on the hydrophilic surface increased about 30% (from 70 to 91 s) after drift retardant was added into spray mixtures (Table 3), while decreased about 29% (from 70 to 50 s) after surfactant was added into spray mixtures. For the same size droplets at a given RH condition, water-only droplets had slightly higher evaporation time than insecticide droplets on the three surfaces. The formulation of insecticides might contain a very small portion of surfactants. Among all four mixture groups, droplets containing the drift retardant had the longest evaporation time on all surfaces at all RH conditions, while droplets containing the surfactant had the shortest evaporation time. The polymer in the drift retardant might reduced the thermal exchange rate between the air and droplets.
The evaporation time of droplets greatly increased as RH increased for the droplets on the hydrophilic surface (Table 3), hydrophobic surface (Table 4), and crabapple leaf surface (Table
6
5). For example, when RH increased from 30% to 90%, the evaporation time of 343 µm droplets containing water and insecticides on the hydrophilic surface increased about 153% (from 45 to 114 s), about 137% (from 68 to 161 s) on hydrophobic surfaces, and about 95% (from 44 to 86) on crabapple tree leaf surfaces respectively (fig. 3).
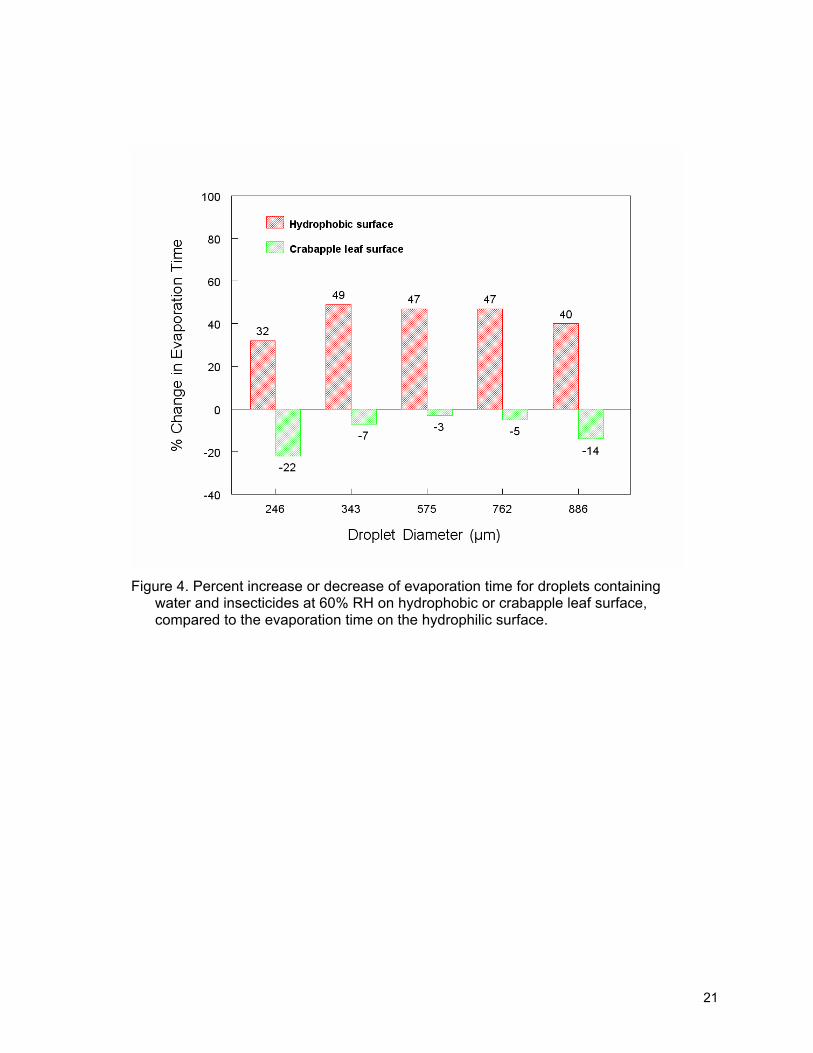
The evaporation time of droplets were also greatly influenced by target surface types (Tables 3, 4 and 5). Figure 4 illustrated the percent increase or decrease in evaporation time for different size droplets containing water and insecticides without additives at 60% RH when the droplets deposited on hydrophobic surface or crabapple leaf surface, compared to the hydrophilic surface. Among the three target surfaces, for the same size droplets at a given RH condition, the droplets on the hydrophobic surface had the longest evaporation time, while droplets on crabapple leaf surfaces had the shortest evaporation time. Compared to the evaporation time on hydrophilic surface, the evaporation time of a 343 µm water-insecticide droplet on the hydrophobic surface at 60% RH was increased 49% on hydrophobic surface, or decreased 7% on crabapple tree leaf surface (fig. 4). The reason that droplets on crabapple leaves had shorter evaporation time might be the thermal conductivity of crabapple leaves was higher than the hydrophilic and hydrophobic slides.
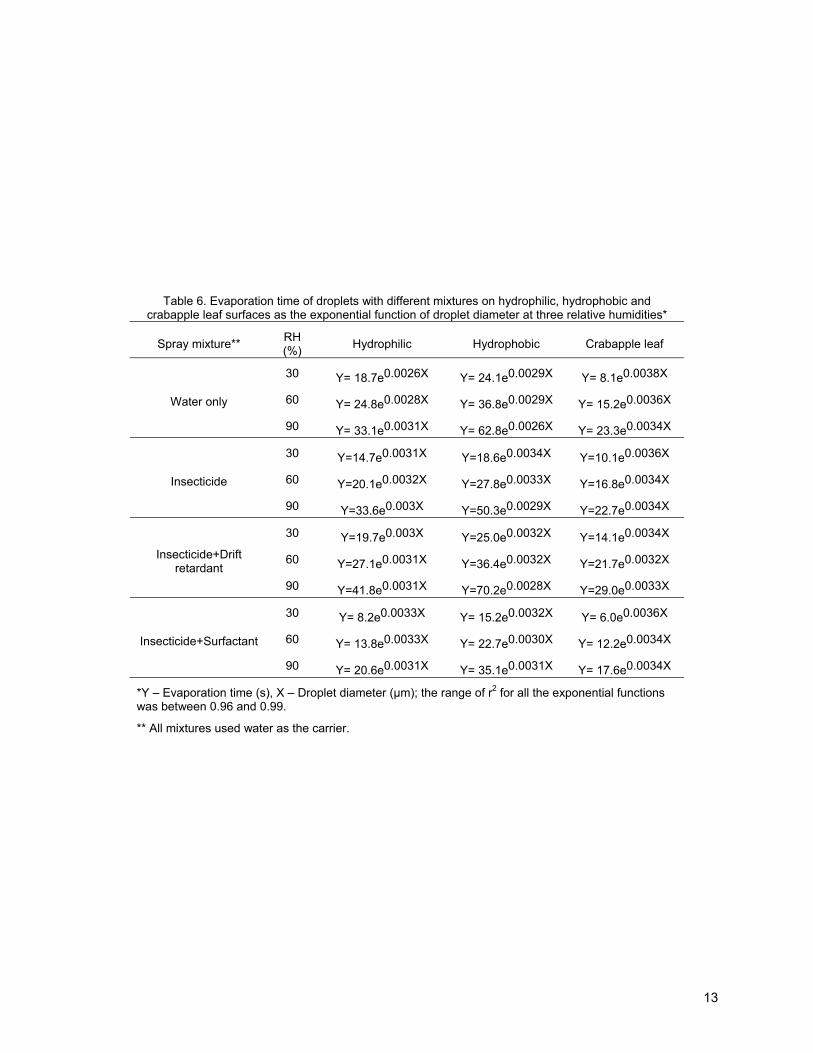
The evaporation time of droplets on the hydrophilic surface (Table 3), hydrophobic surface (Table 4) and crabapple leaf (Table 5) was greatly increased as droplet diameter increased for all RH conditions. For the droplets containing water and insecticides on the hydrophilic surface at 60% RH, the evaporation time increased from 41 to 377 s (or 9.2 times) when droplet diameter increased from 246 to 886 µm (or 3.6 times). For the same size droplets, the evaporation time increased from 54 to 527 s (9.8 times) on the hydrophobic surfaces, increased from 32 to 325 s (10.2 times) on the crabapple leaf. The relationship between droplet diameter and the evaporation time on three target surfaces followed the exponential function for all RH conditions (Table 6).
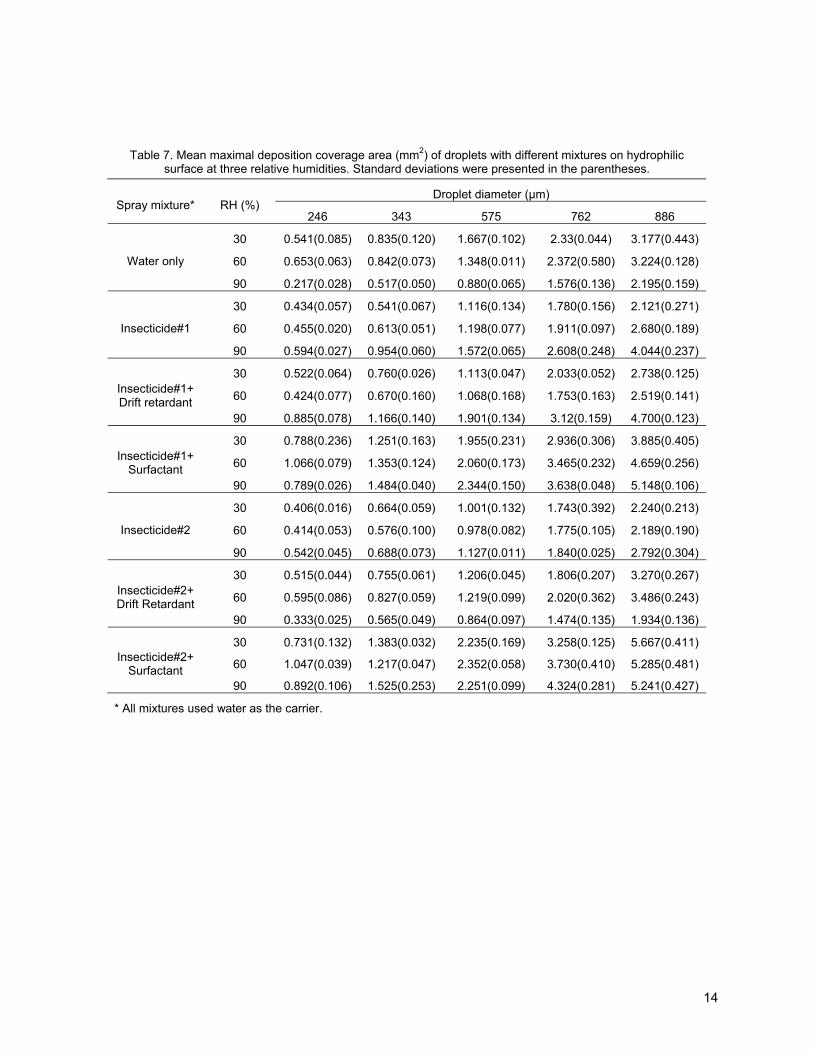
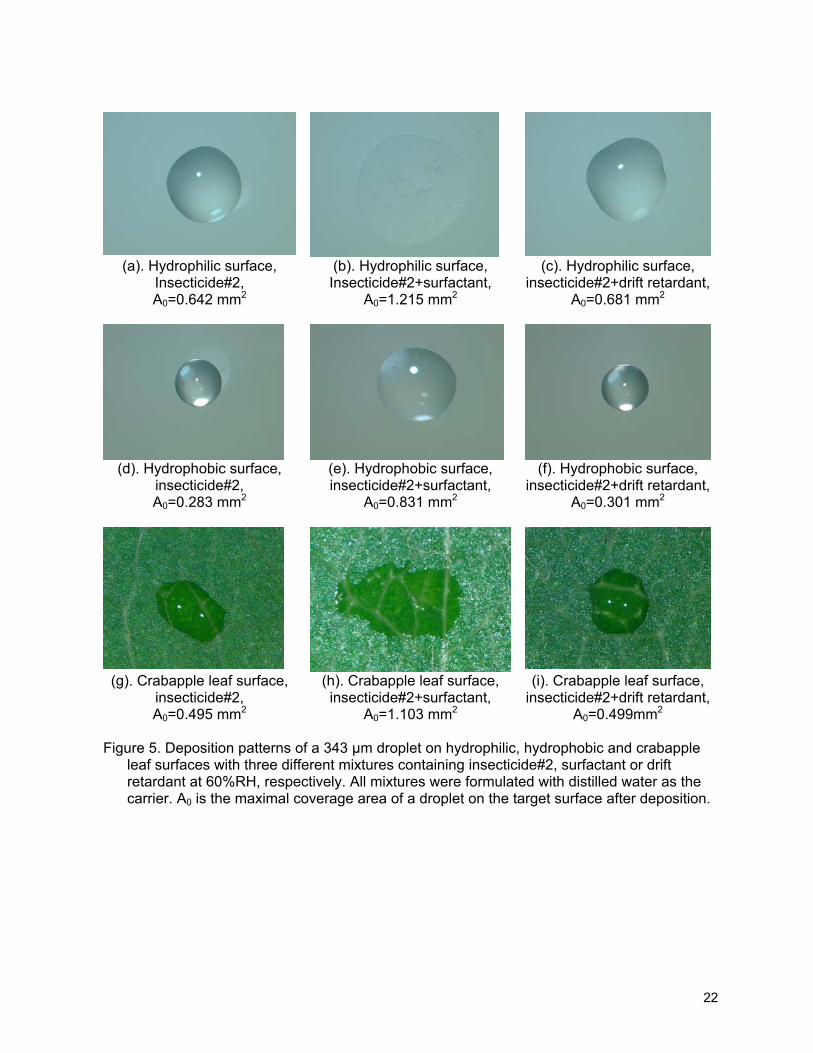
Maximal Droplet Deposition Coverage Area The maximal deposition pattern and coverage area of a droplet on different target surfaces varied greatly with the spray mixture formulation (fig. 5). Table 7, 8 and 9 show the maximal coverage areas of five size droplets with different mixtures and three RH conditions on the hydrophilic surface, hydrophobic surface and crabapple leaf, respectively. Differently from the droplet evaporation time, the data in tables and Figure 6 illustrated that the maximal coverage area of droplets was greatly increased when the surfactant was added into mixtures of water and insecticides. For example, the average maximal coverage areas of all five size droplets containing insecticide#2 on the crabapple leaf surface at 60% RH increased about 97% after the surfactant was added into spray mixtures (fig 6). The area of a 246, 343, 575, 762, or 886 µm droplet projected on a surface before deposition is 0.048, 0.092, 0.260, 0.456, and 0.617 mm2, respectively. The maximal coverage areas of droplets containing the surfactant were 5 to 22 times larger than the projection areas. Adding the surfactant into the mixtures greatly reduced the mixture surface tension (Table 2), resulting in additional spread of droplets on target surfaces.
Differently from the effect of the surfactant, the maximal coverage area of droplets was not strongly affected by adding the drift retardant or/and insecticides into water. In some cases, the maximal coverage area of droplets containing the drift retardant and/or insecticides was larger than those droplets containing water only, but the results were reversed in some other cases (Tables 7, 8, 9). For example, for all three RH conditions and five droplet sizes, 14 out of 15 droplets containing water, insecticide#2 and drift retardant had larger coverage areas on the crabapple leaf than the droplets containing water only while on the hydrophilic surface this ratio become 4 out of 15. Compared to the water-insecticide#2 droplets, the percentage change of
7
maximal droplet coverage area ranged between -6 and 3% after the drift retardant was added, which is much lower than the percentage change between 78 and 96% after the surfactant was added (fig 6). The inconsistence of target surfaces might be the reason of the change in maximal coverage area after the drift retardant was added since the surface tension of these mixtures was very close (Table 2).
Similar to the effect of the drift retardant on the maximal coverage area of droplets, data in Tables 7, 8 and 9 also illustrate that the RH did not influence the maximal droplet coverage areas for all droplets on three different surfaces. In some cases, lower RH had larger maximal coverage areas but the result was reversed in some other cases. The variation might be also caused by the inconsistence of fine structures of each target surface.
The maximal droplet coverage area was greatly influenced by the type of target surfaces (Tables 7, 8, 9). Among the three target surfaces, the hydrophobic surface had the highest resistance to the droplet spreading while the resistance from the hydrophilic surface was the lowest. Thus, the maximal coverage areas of droplets on the hydrophilic surface are larger than that on other two surfaces. For example, at 60% RH, the maximal droplet coverage area of a 343 µm droplet containing water and insecticide#2 was 0.576 mm2 on hydrophilic surface, 0.491 mm2 on the crabapple leaf, and 0.275 mm2 on the hydrophobic surface (fig. 7), respectively.
The maximal droplet coverage area of a droplet on all three surfaces was greatly increased as droplet diameter increased for all RH conditions (Tables 7, 8 and 9). For the droplets containing insecticide#2 on the hydrophilic surface at 60% RH, the maximal droplet coverage area increased from 0.414 to 2.189 mm2 (or 5.3 times) when droplet diameter increased from 246 to 886 µm (or 3.6 times). For the same droplets, the maximal droplet coverage area increased from 0.193 to 0.987 mm2 (5.1 times) on the hydrophobic surfaces, increased from 0.262 to 1.914 mm2 (7.3 times) on the crabapple tree leaf surface. Similar to the results of droplet evaporation time, the maximal droplet coverage area was also the exponential function of droplet diameter for all three RH conditions, three target surfaces and spray mixtures (Table 10).
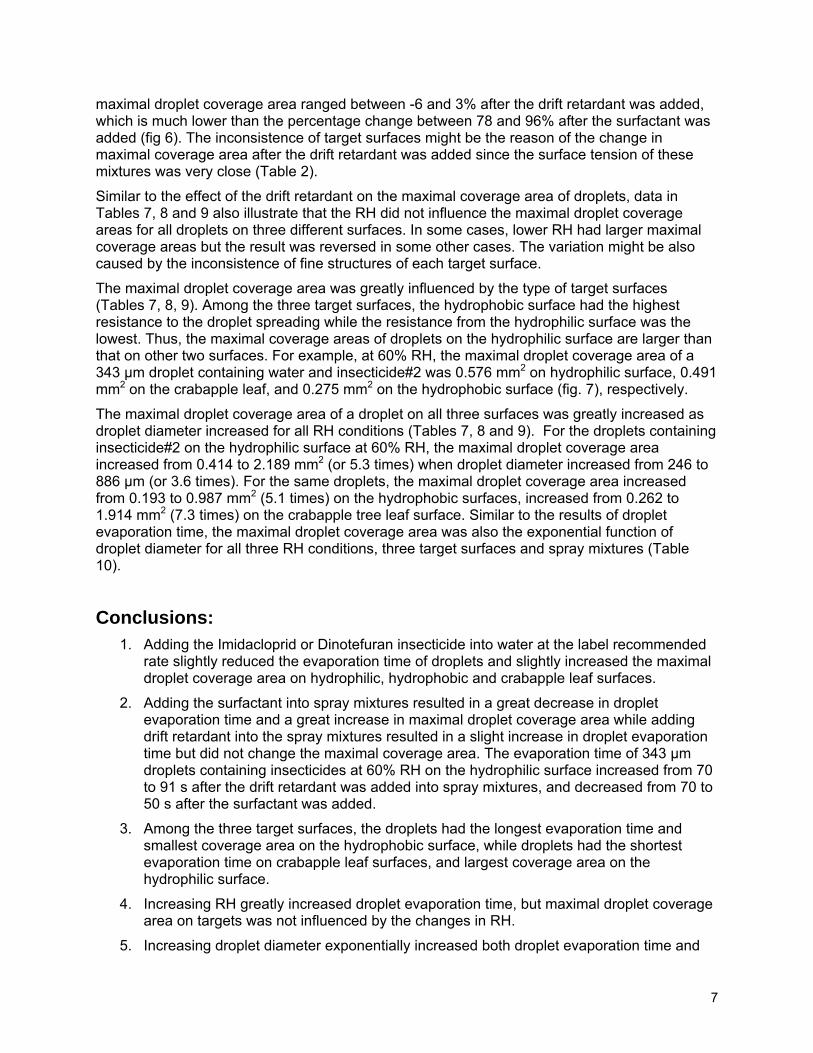
Conclusions: 1. Adding the Imidacloprid or Dinotefuran insecticide into water at the label recommended
rate slightly reduced the evaporation time of droplets and slightly increased the maximal droplet coverage area on hydrophilic, hydrophobic and crabapple leaf surfaces.
2. Adding the surfactant into spray mixtures resulted in a great decrease in droplet evaporation time and a great increase in maximal droplet coverage area while adding drift retardant into the spray mixtures resulted in a slight increase in droplet evaporation time but did not change the maximal coverage area. The evaporation time of 343 µm droplets containing insecticides at 60% RH on the hydrophilic surface increased from 70 to 91 s after the drift retardant was added into spray mixtures, and decreased from 70 to 50 s after the surfactant was added.
3. Among the three target surfaces, the droplets had the longest evaporation time and smallest coverage area on the hydrophobic surface, while droplets had the shortest evaporation time on crabapple leaf surfaces, and largest coverage area on the hydrophilic surface.
4. Increasing RH greatly increased droplet evaporation time, but maximal droplet coverage area on targets was not influenced by the changes in RH.
5. Increasing droplet diameter exponentially increased both droplet evaporation time and
8
coverage area. On the crabapple leaf at 60% RH, the evaporation time of droplets containing water and insecticide#2 increased from 32 to 325 s and the maximal coverage area increased from 0.262 to 1.914 mm2 when the droplet diameter increased from 246 to 886 µm.
6. The information about droplet evaporation on hydrophilic and hydrophobic surfaces could be used as references for a wide range of leaf surface fine structures. Further studies will focus on the evaporation of droplets containing different mixture contents on hairy and waxy leaf surfaces.
Acknowledgments The authors greatly acknowledge Adam Clark, Keith Williams and Andy Doklovic for setting up the experimental system, and Mollie Sheron for analyzing images.
References Baines, W. D. and D. F. James. 1994. Evaporation of a droplet on a surface. Ind. Eng. Chem.
Res. 33: 411-416.
Basu, S., J. Luthra and K.D.P. Nigam. 2002. The effects of surfactants on adhesion, spreading, and retention of herbicide droplet on the surface of the leaves and seeds. Journal of Environmental Science and Health, B37(4): 331-344.
Bouse, L.F., Carlton, J.B. and Jank, P.C. 1988. Effect of Water Soluble Polymers on Spray Droplet Size. Transactions of ASAE 31(6): 1633-1641.
Bukovac, M.J., J.M. Leon, J.A. Cooper, R.E. Whitmoyer, D.L. Reichard and R.D. Brazee. 1995. Spray droplet: plant surface interaction and deposit formation as related to surfactants and spray volume. Proc. 4th Inter. Symposium on Adjuvants for Agrochemicals FRI Bulletin 193: 177-185.
Chachalis, D., K. N. Reddy, C. D. Elmore and M. L. Steele. 2001. Herbicide efficacy, leaf structure, and spray droplet contact angle among lpomoea species and smallflower morningglory. Weed Science. 49: 628-634.
Cooper, W., L. Edwards and F. Hardaway. 1983. Vapour/liquid hazards associated with persistent liquid drop on non-porous surfaces. ARCSL-TR-82092. Chemical System Laboratory. Aberdeen Proing Ground, Maryland.
Holloway, P.J. and D. Silcox. 1985. Behaviour of three nonionic surfactants following foliar application. 1985 British Crop Protection Conference-Weeds. BCPC Publications, Croydon, UK.
Holloway, P.J., W.W.-C. Wong and H. J. Partridge. 1992. Effects of some nonionic polyoxyethylene surfactants on uptake of ethirimol and diclobutrazol from suspension formulations applied to wheat leaves. Pesticide Science. 34: 109-118.
Miller, P.C.H., Hewitt, A.J. and Bagley, W.E. 2001. Adjuvant Effects on Spray Characteristics and Drift Potential. Pesticide Formulations and Application Systems: Twenty First Volume, ASTM STP 1414, American Society for Testing and Materials, West Conshohocken, PA.
Nalewaja, J.D. and R. Matysiak. 2000. Spray deposits from nicosulfuron with salts that affect efficacy. Weed Technology. 14:740-749.
9
Osteen, C. and M. Livingston. 2006. AREI Chapter 4.3: Pest Management Practices. In the publication of Agricultural Resources and Environmental Indicators, 2006 Edition. Keith Wiebe and Noel Gollehon, editors. Washington, D.C.: USDA Economic Research Service.
Ozkan, H.E., Reichard, D.L., Zhu, H. and Akerman, K.D. 1993. Effect of Drift Retardant Chemicals on spray Drift, Droplet Size and Spray Pattern. Pesticide Formulations and Application Systems: 13th Volume, ASTM STP 1183, American Society for Testing and Materials, Philadelphia.
Picknett, R. G. and R. Bexon. 1977. The evaporation of sessile or pendant drops in still air. Journal of Colloid and Interface Science. Vol. 61(2): 336-350.
Ramsdale, B. K. and C. G. Messersmith. 2001. Nozzle, spray volume, and adjuvants effects on carfentrazone and imazamox efficacy. Weed Technology. Vol. 15: 485-491.
Reichard, D.L., Zhu, H., Downer, R.A., Fox, R.D., Brazee, R.D., H.E. Ozkan. 1996. A laboratory system to evaluate effects of shear on spray drift retardants. Transactions of the ASAE 39(6): 1993-1999.
Reichard, D.L., H.J. Retzer, L.A. Liljedahl, F.R. Hall. 1977. Spray droplet size distributions delivered by air blast orchard sprayers. Transactions of the ASAE 39(6): 1993-1999.
Salyani, M. and R.P. Cromwell. 1992. Adjuvants to reduce drift from handgun spray applications. In Pesticide Formulations and Application Systems: 363-376, 12rd Vol., ASTM Publication STP 1146, Eds. B.N. Devisetty. D.G. chasin and P.D. Berger, Philadelphia, Pa.: American Society for Testing and Materials.
Spanoghe, P., M. D. Schampheleire, P. V. der Meeren and W. Steurbaut. 2007. Review influence of agricultural adjuvants on droplet spectra. Pest Management Science. 63: 4-16.
Smith, A. 1993. Adjuvants in crop protection. Grow Bus. Report DS 86. New York, N.Y.: PharmaBooks Ltd.
Smith D.B., E.C. Burt, and E.P. Lloyd. 1975. Selection of optimum spray droplet sizes for boll weevil and drift control. Journal of Economic Entomology. 68(3):415-417.
Uhlig, B.A. and A.H. Wissemeier. 2000. Reduction of non-ionic surfactant phytotoxicity by divalent cations. Crop Protection. Vol.19: 13-19.
VanGessel, J.M. and Johnson, Q.R. 2000. Evaluation of Drift Retardants (Drift Control Agents) Two Year Summary.Research Report Submitted to the Delaware Soybean Board for Funding in 2000.
VanGessel, J.M. and Johnson, Q.R. 2005. Evaluating Drift Control Agents to Reduce Short Distance Movement and Effect on Herbicide Performance. Weed Technology. V. 19: 78-85.
Westin, S. N., S. Winter, E. Karlsson, A. Hin and F. Oeseburg. 1998. On modeling of the evaporation of chemical warfare agents on the ground. Journal of Hazardous Materials. A 63: 5-24.
Wilson, J.D., O.K. Hedden, and J.P. Sleesman. 1963. Spray droplet size as related to disease and insect control on row crops. Res. Bull. 945. Ohio Agic. Exp. Sta., Wooster, OH.
Yu, Y., H. Zhu and H.E. Ozkan. 2008. Evaporation of pesticide droplets under various relative humidity conditions. Submitted to Journal of ASTM International for publication.
Zabkiewicz, J.A., R.E. Gaskin and J.M. Balneaves. 1985. Effect of additives on foliar wetting and uptake of glyphosate into gorse (Ulex europaeus). 1985 BCPC Monogram No. 28 Symposium on Application and Biology.
10
Zhu, H., R.W. Dexter, R.D. Fox, D.L. Reichard, R.D. Brazee and H.E. Ozkan. 1997. Effects of polymer composition and viscosity on droplet size of recirculated spray solutions. Journal of Agricultural Engineering Research 67: 35-45.
Table 1. Formulation, active ingredient and concentration of chemicals used to form mixtures with water for
droplet evaporation and coverage area tests
Chemicals Trade name Formulation Active ingredient Concentration*
Drift retardant Strike Zone Powder
100% proprietary blend of poly-ammonium, phosphates, ammonium carboxylates potassium phosphates, phosphoric acid.
0.46 mg/L
Surfactant X-77 Liquid 90% alkyl polyoxyethylene and 10% constituents ineffective as adjuvant. 7.52 mL/L
Insecticide#1 Marathon Liquid 21.4% Imidacloprid and 78.6% others 0.13 mL/L
Insecticide#2 Safari Powder 20% Dinotefuran and 80% others 0.45 g /L
* Concentration of the chemical in distilled water
Table 2. Surface tension, viscosity and contact angle of 343 µm droplets on hydrophilic, hydrophobic
and crabapple leaf surfaces for spray mixtures used in tests
Contact angle (degree) Item
No. Spray mixture*
Surface Tension (mN/m)
Viscosity (mPa·s) Hydro-
philic
Hydro-
phobic
Crab-
apple
1 Water only 71.7 0.97 41.7 92.3 65.2
2 Insecticide#1 64.3 0.97 40.8 91.8 64.3
3 Insecticide#1+Drift Retardant 68.2 1.11 32.2 90.6 71.9
4 Insecticide#1+Surfactant 39.1 1.91 22.9 43.5 16.1
5 Insecticide#2 68.3 0.97 36.8 89.9 58.4
6 Insecticide#2+Drift Retardant 69.8 1.17 32.6 90.4 48.3
7 Insecticide#2+Surfactant 40.6 1.40 13.8 31.3 23.4
* All spray mixtures used water as the carrier.
11
Table 3. Mean evaporation time (s) of droplets on hydrophilic surfaces for different spray
mixtures at three relative humidities*. Standard deviations were presented in the parentheses.
Droplet diameter (µm) Spray mixture** RH (%)
246 343 575 762 886
30 31(5) 51(3) 88(11) 154(12) 237(5)
60 42(4) 78(7) 131(5) 220(3) 397(12) Water only
90 57(5) 116(5) 239(23) 408(47) 667(17)
30 30(2) 45(0) 83(0) 141(1) 231(6)
60 41(3) 70(10) 126(10) 219(10) 377(9) Insecticide
90 62(0) 114(16) 184(23) 304(31) 513(43)
30 39(1) 61(3) 103(7) 179(13) 296(31)
60 54(2) 91(7) 153(5) 269(23) 460(25) Insecticide+Drift retardant
90 77(4) 146(18) 247(49) 407(67) 664(140)
30 17(1) 29(1) 50(1) 90(2) 160(6)
60 28(2) 50(5) 87(9) 157(8) 270(18) Insecticide+Surfactant
90 40(6) 68(3) 120(7) 198(6) 332(32)
* Mean evaporation time was calculated from both insecticides #1 and #2.
** All mixtures used water as the carrier.
Table 4. Mean evaporation time (s) of droplets on hydrophobic surfaces for different spray mixtures at three relative humidities*. Standard deviations were presented in the parentheses.
Droplet Diameter (µm) Spray mixture** RH (%)
246 343 575 762 886
30 40(5) 77(4) 139(10) 250(18) 389(17)
60 60(2) 123(3) 217(8) 382(19) 589(36) Water only
90 96(6) 186(5) 321(16) 518(18) 765(28)
30 39(5) 68(4) 127(8) 226(11) 391(21)
60 54(2) 104(7) 185(22) 321(30) 527(9) Insecticide
90 92(12) 161(18) 267(29) 442(20) 693(15)
30 49(1) 88(12) 153(18) 266(21) 442(23)
60 69(6) 130(8) 226(13) 397(24) 613(21) Insecticide+Drift retardant
90 126(4) 214(5) 350(20) 572(33) 876(44)
30 30(2) 52(4) 94(3) 162(7) 262(12)
60 42(3) 77(6) 129(5) 219(3) 343(21) Insecticide+Surfactant
90 63(1) 121(6) 207(9) 343(21) 519(29)
* Mean evaporation time was calculated from both insecticides #1 and #2.
** All mixtures used water as the carrier.

12
Table 5. Mean evaporation time (s) of droplets on crabapple leaf surfaces for different spray mixtures at
three relative humidities*. Standard deviations were presented in the parentheses.
Droplet Diameter (µm) Spray mixture** RH (%)
246 343 575 762 886
30 17(1) 37(4) 76(5) 138(5) 234(6)
60 30(4) 65(14) 128(4) 228(6) 360(32) Water only
90 48(1) 87(10) 161(12) 304(19) 475(5)
30 20(2) 44(3) 86(5) 153(11) 248(23)
60 32(4) 65(5) 122(14) 209(26) 325(36) Insecticide
90 44(4) 86(8) 167(14) 287(19) 440(35)
30 28(3) 54(1) 99(4) 178(6) 284(16)
60 41(5) 79(8) 144(20) 242(28) 381(53) Insecticide+Drift retardant
90 54(4) 107(16) 203(24) 335(25) 511(37)
30 11(6) 27(7) 53(12) 89(24) 133(37)
60 23(4) 49(7) 95(13) 162(31) 246(52) Insecticide+Surfactant
90 34(3) 66(6) 128(18) 214(34) 337(57)
* Mean evaporation time was calculated from both insecticides #1 and #2.
** All mixtures used water as the carrier.
13
Table 6. Evaporation time of droplets with different mixtures on hydrophilic, hydrophobic and
crabapple leaf surfaces as the exponential function of droplet diameter at three relative humidities*
Spray mixture** RH (%) Hydrophilic Hydrophobic Crabapple leaf
30 Y= 18.7e0.0026X Y= 24.1e0.0029X Y= 8.1e0.0038X
60 Y= 24.8e0.0028X Y= 36.8e0.0029X Y= 15.2e0.0036X Water only
90 Y= 33.1e0.0031X Y= 62.8e0.0026X Y= 23.3e0.0034X
30 Y=14.7e0.0031X Y=18.6e0.0034X Y=10.1e0.0036X
60 Y=20.1e0.0032X Y=27.8e0.0033X Y=16.8e0.0034X Insecticide
90 Y=33.6e0.003X Y=50.3e0.0029X Y=22.7e0.0034X
30 Y=19.7e0.003X Y=25.0e0.0032X Y=14.1e0.0034X
60 Y=27.1e0.0031X Y=36.4e0.0032X Y=21.7e0.0032X Insecticide+Drift
retardant 90 Y=41.8e0.0031X Y=70.2e0.0028X Y=29.0e0.0033X
30 Y= 8.2e0.0033X Y= 15.2e0.0032X Y= 6.0e0.0036X
60 Y= 13.8e0.0033X Y= 22.7e0.0030X Y= 12.2e0.0034X Insecticide+Surfactant
90 Y= 20.6e0.0031X Y= 35.1e0.0031X Y= 17.6e0.0034X
*Y – Evaporation time (s), X – Droplet diameter (µm); the range of r2 for all the exponential functions was between 0.96 and 0.99.
** All mixtures used water as the carrier.
14
Table 7. Mean maximal deposition coverage area (mm2) of droplets with different mixtures on hydrophilic surface at three relative humidities. Standard deviations were presented in the parentheses.
Droplet diameter (µm) Spray mixture* RH (%)
246 343 575 762 886
30 0.541(0.085) 0.835(0.120) 1.667(0.102) 2.33(0.044) 3.177(0.443)
60 0.653(0.063) 0.842(0.073) 1.348(0.011) 2.372(0.580) 3.224(0.128) Water only
90 0.217(0.028) 0.517(0.050) 0.880(0.065) 1.576(0.136) 2.195(0.159)
30 0.434(0.057) 0.541(0.067) 1.116(0.134) 1.780(0.156) 2.121(0.271)
60 0.455(0.020) 0.613(0.051) 1.198(0.077) 1.911(0.097) 2.680(0.189) Insecticide#1
90 0.594(0.027) 0.954(0.060) 1.572(0.065) 2.608(0.248) 4.044(0.237)
30 0.522(0.064) 0.760(0.026) 1.113(0.047) 2.033(0.052) 2.738(0.125)
60 0.424(0.077) 0.670(0.160) 1.068(0.168) 1.753(0.163) 2.519(0.141) Insecticide#1+Drift retardant
90 0.885(0.078) 1.166(0.140) 1.901(0.134) 3.12(0.159) 4.700(0.123)
30 0.788(0.236) 1.251(0.163) 1.955(0.231) 2.936(0.306) 3.885(0.405)
60 1.066(0.079) 1.353(0.124) 2.060(0.173) 3.465(0.232) 4.659(0.256) Insecticide#1+Surfactant
90 0.789(0.026) 1.484(0.040) 2.344(0.150) 3.638(0.048) 5.148(0.106)
30 0.406(0.016) 0.664(0.059) 1.001(0.132) 1.743(0.392) 2.240(0.213)
60 0.414(0.053) 0.576(0.100) 0.978(0.082) 1.775(0.105) 2.189(0.190) Insecticide#2
90 0.542(0.045) 0.688(0.073) 1.127(0.011) 1.840(0.025) 2.792(0.304)
30 0.515(0.044) 0.755(0.061) 1.206(0.045) 1.806(0.207) 3.270(0.267)
60 0.595(0.086) 0.827(0.059) 1.219(0.099) 2.020(0.362) 3.486(0.243) Insecticide#2+Drift Retardant
90 0.333(0.025) 0.565(0.049) 0.864(0.097) 1.474(0.135) 1.934(0.136)
30 0.731(0.132) 1.383(0.032) 2.235(0.169) 3.258(0.125) 5.667(0.411)
60 1.047(0.039) 1.217(0.047) 2.352(0.058) 3.730(0.410) 5.285(0.481) Insecticide#2+Surfactant
90 0.892(0.106) 1.525(0.253) 2.251(0.099) 4.324(0.281) 5.241(0.427)
* All mixtures used water as the carrier.
15
Table 8. Mean maximal deposition coverage area (mm2) of droplets with different mixtures on hydrophobic surface at three relative humidities. Standard deviations were presented in the parentheses.
Droplet diameter (µm) Spray mixture* RH (%)
246 343 575 762 886
30 0.105(0.012) 0.188(0.012) 0.372(0.033) 0.653(0.015) 1.026(0.137)
60 0.109(0.005) 0.192(0.006) 0.445(0.029) 0.704(0.031) 0.975(0.012) Water only
90 0.089(0.009) 0.133(0.009) 0.351(0.004) 0.693(0.025) 0.864(0.022)
30 0.114(0.016) 0.186(0.011) 0.341(0.019) 0.667(0.034) 1.080(0.053)
60 0.114(0.015) 0.196(0.007) 0.333(0.015) 0.691(0.019) 0.921(0.009) Insecticide#1
90 0.116(0.005) 0.173(0.006) 0.383(0.019) 0.708(0.014) 0.943(0.012)
30 0.207(0.024) 0.399(0.042) 0.645(0.014) 1.116(0.037) 1.585(0.071)
60 0.152(0.010) 0.324(0.026) 0.536(0.008) 1.019(0.034) 1.327(0.056) Insecticide#1+
Drift retardant 90 0.223(0.018) 0.352(0.005) 0.598(0.007) 1.074(0.030) 1.695(0.141)
30 0.332(0.026) 0.426(0.045) 0.890(0.136) 1.495(0.131) 2.119(0.432)
60 0.464(0.050) 0.780(0.012) 1.340(0.053) 2.348(0.094) 3.291(0.063) Insecticide#1+
Surfactant 90 0.383(0.022) 0.665(0.013) 1.049(0.062) 1.846(0.047) 2.578(0.071)
30 0.153(0.019) 0.169(0.122) 0.411(0.013) 0.680(0.024) 0.913(0.011)
60 0.193(0.018) 0.275(0.027) 0.372(0.011) 0.653(0.018) 0.987(0.028) Insecticide#2
90 0.158(0.004) 0.239(0.037) 0.426(0.008) 0.766(0.037) 1.170(0.049)
30 0.167(0.032) 0.275(0.033) 0.528(0.054) 0.912(0.028) 1.212(0.041)
60 0.221(0.026) 0.335(0.071) 0.548(0.048) 0.852(0.049) 1.250(0.067) Insecticide#2+
Drift retardant 90 0.210(0.021) 0.308(0.019) 0.545(0.038) 1.015(0.026) 1.503(0.118)
30 0.286(0.031) 0.606(0.099) 0.989(0.095) 1.429(0.271) 2.729(0.501)
60 0.470(0.017) 0.854(0.034) 1.432(0.025) 2.353(0.160) 3.547(0.207) Insecticide#2+
Surfactant 90 0.406(0.032) 0.669(0.033) 1.202(0.145) 1.964(0.176) 2.800(0.098)
* All mixtures used water as the carrier.
16
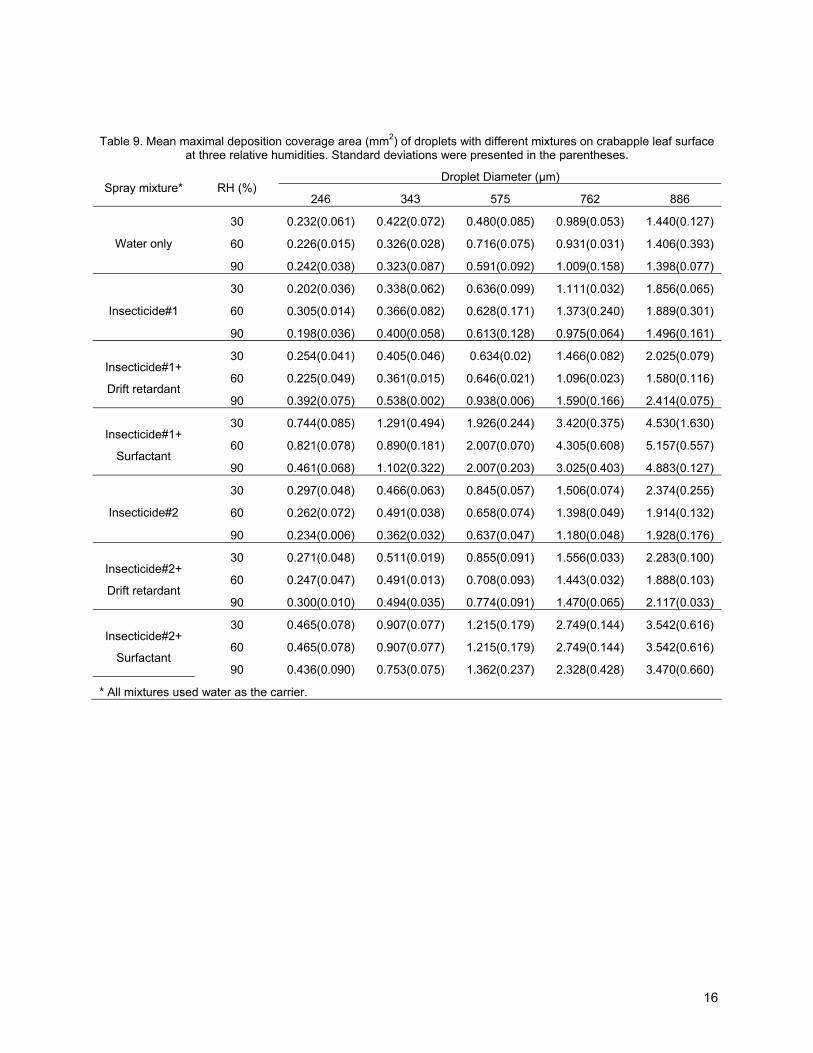
Table 9. Mean maximal deposition coverage area (mm2) of droplets with different mixtures on crabapple leaf surface at three relative humidities. Standard deviations were presented in the parentheses.
Droplet Diameter (µm) Spray mixture* RH (%)
246 343 575 762 886
30 0.232(0.061) 0.422(0.072) 0.480(0.085) 0.989(0.053) 1.440(0.127)
60 0.226(0.015) 0.326(0.028) 0.716(0.075) 0.931(0.031) 1.406(0.393) Water only
90 0.242(0.038) 0.323(0.087) 0.591(0.092) 1.009(0.158) 1.398(0.077)
30 0.202(0.036) 0.338(0.062) 0.636(0.099) 1.111(0.032) 1.856(0.065)
60 0.305(0.014) 0.366(0.082) 0.628(0.171) 1.373(0.240) 1.889(0.301) Insecticide#1
90 0.198(0.036) 0.400(0.058) 0.613(0.128) 0.975(0.064) 1.496(0.161)
30 0.254(0.041) 0.405(0.046) 0.634(0.02) 1.466(0.082) 2.025(0.079)
60 0.225(0.049) 0.361(0.015) 0.646(0.021) 1.096(0.023) 1.580(0.116) Insecticide#1+
Drift retardant 90 0.392(0.075) 0.538(0.002) 0.938(0.006) 1.590(0.166) 2.414(0.075)
30 0.744(0.085) 1.291(0.494) 1.926(0.244) 3.420(0.375) 4.530(1.630)
60 0.821(0.078) 0.890(0.181) 2.007(0.070) 4.305(0.608) 5.157(0.557) Insecticide#1+
Surfactant 90 0.461(0.068) 1.102(0.322) 2.007(0.203) 3.025(0.403) 4.883(0.127)
30 0.297(0.048) 0.466(0.063) 0.845(0.057) 1.506(0.074) 2.374(0.255)
60 0.262(0.072) 0.491(0.038) 0.658(0.074) 1.398(0.049) 1.914(0.132) Insecticide#2
90 0.234(0.006) 0.362(0.032) 0.637(0.047) 1.180(0.048) 1.928(0.176)
30 0.271(0.048) 0.511(0.019) 0.855(0.091) 1.556(0.033) 2.283(0.100)
60 0.247(0.047) 0.491(0.013) 0.708(0.093) 1.443(0.032) 1.888(0.103) Insecticide#2+
Drift retardant 90 0.300(0.010) 0.494(0.035) 0.774(0.091) 1.470(0.065) 2.117(0.033)
30 0.465(0.078) 0.907(0.077) 1.215(0.179) 2.749(0.144) 3.542(0.616)
60 0.465(0.078) 0.907(0.077) 1.215(0.179) 2.749(0.144) 3.542(0.616) Insecticide#2+
Surfactant 90 0.436(0.090) 0.753(0.075) 1.362(0.237) 2.328(0.428) 3.470(0.660)
* All mixtures used water as the carrier.

17
Table 10. The maximal deposition coverage area of droplets with different mixtures on hydrophilic,
hydrophobic and crabapple leaf surfaces as the exponential function of droplet diameter at three relative humidity conditions*
Spray mixture** RH (%) Hydrophilic Hydrophobic Crabapple leaf
30 Y= 0.31e0.0027X Y= 0.05e0.0033X Y= 0.14e0.0026X
60 Y= 0.35e0.0025X Y= 0.06e0.0033X Y= 0.13e0.0028X Water only
90 Y= 0.13e0.0033X Y= 0.038e0.0037X Y= 0.12e0.0027X
30 Y=0.232e0.0026X Y=0.053e0.0037X Y=0.098e0.0033X
60 Y=0.237e0.0028X Y=0.058e0.0032X Y=0.137e0.0029X Insecticide#1
90 Y=0.322e0.0028X Y=0.055e0.0033X Y=0.119e0.0028X
30 Y=0.292e0.0025X Y=0.118e0.003X Y=0.121e0.0032X
60 Y=0.242e0.0026X Y=0.086e0.0032X Y=0.12e0.0029X Insecticide#1+
Drift retardant 90 Y=0.472e0.0025X Y=0.113e0.003X Y=0.2e0.0028X
30 Y= 0.495e0.0024X Y= 0.16e0.0029X Y=0.438e0.0027X
60 Y= 0.601e0.0023X Y= 0.251e0.0029X Y= 0.344e0.0031X Insecticide#1+
Surfactant 90 Y= 0.486e0.0027X Y= 0.216e0.0028X Y= 0.269e0.0033X
30 Y=0.241e0.0026X Y=0.07e0.003X Y=0.146e0.0031X
60 Y=0.224e0.0026X Y=0.109e0.0024X Y=0.151e0.0027X Insecticide#2
90 Y=0.287e0.0025X Y=0.216e0.0028X Y=0.112e0.0032X
30 Y=0.277e0.0027X Y=0.089e0.003X Y=0.146e0.0031X
60 Y=0.314e0.0026X Y=0.126e0.0026X Y=0.151e0.0027X Insecticide#2+
Drift retardant 90 Y=0.199e0.0026X Y=0.103e0.003X Y=0.158e0.0029X
30 Y= 0.424e0.0029X Y= 0.164e0.0031X Y= 0.256e0.003X
60 Y= 0.531e0.0026X Y= 0.263e0.003X Y= 0.309e0.0028X Insecticide#2+
Surfactant 90 Y= 0.52e0.0027X Y= 0.223e0.0029X Y= 0.23e0.0031X
* Y – The maximal droplet deposition coverage area (mm2), X – Droplet diameter (µm); the range of r2 for all the exponential functions was between 0.93 and 0.99.
** All mixtures used water as the carrier.
18
Fan
Microloggerand
Computer
DropletGeneratorController
Humidifier Dehumidifier
Air Mixer Tank
Digital Camera
Stereoscope
DropletDispenser
Computer
Droplet
Leaf
Target Holding Chamber
Humidity out Sensor
Airout
WorkshopDry Air
X-Y Positioner
Steam
Humidity inSensor
Top Glass Window
Fiber Optic Light
Figure 1. Schematic of the experimental setup for investigation of droplet evaporation process in a controlled environmental chamber.
19
Figure 2. Comparison of evaporation time of droplets between insecticide#1 and insecticide#2 on hydrophilic, hydrophobic and crabapple leaf surfaces at 60% RH.
20
Figure 3. Evaporation time of a 343 µm droplet containing water and insecticide#2 on hydrophilic, hydrophobic and crabapple leaf surfaces at three relative humidity conditions.
21
Figure 4. Percent increase or decrease of evaporation time for droplets containing water and insecticides at 60% RH on hydrophobic or crabapple leaf surface, compared to the evaporation time on the hydrophilic surface.
22
(a). Hydrophilic surface,
Insecticide#2, A0=0.642 mm2
(b). Hydrophilic surface, Insecticide#2+surfactant,
A0=1.215 mm2
(c). Hydrophilic surface, insecticide#2+drift retardant,
A0=0.681 mm2
(d). Hydrophobic surface,
insecticide#2, A0=0.283 mm2
(e). Hydrophobic surface, insecticide#2+surfactant,
A0=0.831 mm2
(f). Hydrophobic surface, insecticide#2+drift retardant,
A0=0.301 mm2
(g). Crabapple leaf surface,
insecticide#2, A0=0.495 mm2
(h). Crabapple leaf surface, insecticide#2+surfactant,
A0=1.103 mm2
(i). Crabapple leaf surface, insecticide#2+drift retardant,
A0=0.499mm2
Figure 5. Deposition patterns of a 343 µm droplet on hydrophilic, hydrophobic and crabapple leaf surfaces with three different mixtures containing insecticide#2, surfactant or drift retardant at 60%RH, respectively. All mixtures were formulated with distilled water as the carrier. A0 is the maximal coverage area of a droplet on the target surface after deposition.
23
Figure 6. Percent increase or decrease of maximal droplet coverage area on crabapple leaf surface after surfactant or drift retardant was added into the mixture of water and insecticide#2 at 60% RH.
24
Figure 7. The maximal coverage areas of droplets containing water and insecticide#2 on hydrophilic, hydrophobic and crabapple leaf surfaces at 60% RH.