Embed Size (px)
Citation preview
Lattice-Boltzmann simulations of dropletevaporation
Rodrigo Ledesma-Aguilar,†*a Dominic Vellaa and Julia M. Yeomansb
We study the utility and validity of lattice-Boltzmann (LB) simulations to explore droplet evaporation driven
by a concentration gradient. Using a binary-fluid lattice-Boltzmann algorithm based on Cahn–Hilliard
dynamics, we study the evaporation of planar films and 3D sessile droplets from smooth solid surfaces.
Our results show that LB simulations accurately reproduce the classical regime of quasi-static dynamics.
Beyond this limit, we show that the algorithm can be used to explore regimes where the evaporative and
diffusive timescales are not widely separated, and to include the effect of boundaries of prescribed
driving concentration. We illustrate the method by considering the evaporation of a droplet from a solid
surface that is chemically patterned with hydrophilic and hydrophobic stripes.
1 IntroductionRecent advances in uid manipulation at submillimetre scaleshave driven a resurgence of interest in evaporation phenomena.1
When a drop evaporates, the associated loss of mass leads toreadjustments in the drop shape which is in turn affected byinteractions with any adjacent solid surfaces. For example, onrough rigid surfaces the rim of an evaporating drop tends to pinon the solid leading to a stick-slip dynamics that can affect theevaporation time.2 When pinned, large-scale internal ows forcethe accumulation of suspended particles near the contact line.This so-called coffee-stain effect is a powerful and still devel-oping route to drive the self-assembly of nano-materials.3 If thesolid is elastic, the competition between surface-tension andelastic forces can lead to interesting effects.4 For instance,evaporating drops have successfully been used to guide thecontrolled folding of elastic sheets into prescribed structures.5
The interplay between evaporation, surface-tension and elas-ticity can also have undesired outcomes, e.g., in solvent evapo-ration from micro-engineered elastic surfaces, where surface-tension forces can lead to the stiction and failure of the delicatemicro-pattern.6,7
Modelling evaporation involves accounting for the dynamicsof both liquid and gas phases, the liquid–gas interface, and thesolid–liquid–gas contact line. In general, one needs to accountfor mass, momentum and energy transport in both phases.
Adding to the complexity of the problem, physical systemsinvolve changes in the surface energy and topography of thesolid. The resulting problem is thus challenging from acomputational perspective.
One popular computational tool for studying evaporation ismolecular dynamics (MD).8 The use of MD has led to severalnew insights into evaporation driven by temperature differ-ences, including the observation that the temperature may bediscontinuous across the droplet interface.9 However, MD ismost useful in situations where the quantity of liquid that isevaporating is relatively small since simulating large ensemblesof molecules is costly. This also makes modelling situationsthat involve signicant ow of the evaporating liquid difficult.
Lattice-Boltzmann (LB) simulations have become a standardtool in computational uid dynamics, offering a number ofadvantages compared to other methods. When compared withMD, it is a particular advantage that LB is based on a localkinetic algorithm that reproduces the mass and momentumbalance equations at large scales. In doing so, LB also circum-vents the non-local constraints of other multiphase models,such as boundary integral representations. Several LB multi-phase models have been used successfully to study a variety ofinterfacial phenomena.10 Recently, LB simulations have proveduseful to gain insight in complex geometries, such as thewetting transition on superhydrophobic surfaces,11,12 3D effectsin hydrodynamic instabilities,13,14 contact-line hysteresis,15 andentrainment.16 A particular advantage that an LB treatment ofevaporation would bring is the possibility of studying evapora-tion in the presence of ow and on complex microstructuredsurfaces.
In this paper we focus on the validation of the LB method asa physical way to model evaporation phenomena. As a proof ofprinciple we present simulations of the evaporation of planarlms and sessile droplets, i.e., drops of typical size below the
aOxford Centre for Collaborative Applied Mathematics, Mathematical Institute,University of Oxford, Radcliffe Observatory Quarter, Woodstock Road, Oxford OX26GG, UKbRudolf Peierls Centre for Theoretical Physics, University of Oxford, 1 Keble Road,Oxford OX1 3NP, UK
† Present address: Department of Physics and Electrical Engineering,Northumbria University Newcastle, Ellison Place, Newcastle upon Tyne NE18ST, UK. E-mail: [email protected]
Cite this: Soft Matter, 2014, 10, 8267
Received 16th June 2014Accepted 15th August 2014
DOI: 10.1039/c4sm01291g
www.rsc.org/softmatter
This journal is © The Royal Society of Chemistry 2014 Soft Matter, 2014, 10, 8267–8275 | 8267
Soft Matter
PAPER
Publ
ished
on
04 S
epte
mbe
r 201
4. D
ownl
oade
d by
Uni
vers
ity o
f Oxf
ord
on 1
5/04
/201
5 10
:48:
32.
View Article OnlineView Journal | View Issue
capillary length, from smooth rigid surfaces. In Section 2, westart our discussion with a brief presentation of evaporation inthe context of Cahn–Hilliard dynamics and the LB algorithm,where we include the effects of mass and momentum transportin both phases. We focus on isothermal systems, where theevaporation is dominated by concentration gradients. These areincluded by means of boundary conditions at the edges of thesimulation domain. Our approach departs from the recent workof Safari et al.,17 who considered the evaporation of one- andtwo-dimensional fronts subject to prescribed thermal gradientsimposed at the uid–uid interface. Section 3 is devoted tosimulation results of the evaporation of a planar lm, intro-ducing and discussing the relevant physical timescales. Wethen validate droplet evaporation simulations against analyticalpredictions in simple 3D geometries in Section 4 beforeapplying the LB algorithm to give qualitative understanding ofthe evaporation of a droplet from a chemically patternedsubstrate in Section 5. Finally, in Section 6 we present theconclusions of this work.
2 LB algorithmIn this section we describe the LB algorithm used in oursimulations. We start by considering the equilibrium state ofthe system. The thermodynamics of the liquid and vapourphases is described by the free-energy functional18
F!f!r"; r!r"
"#
#
U
dU
$V !f" $ 1
2k|Vf|
2 $ 1
3r ln r
%$#
S
dS!hfs";
(1)
where f(r) is the phase eld and r(r) is the uid density eld.The rst integral on the RHS of eqn (1) corresponds to the bulkcontribution to the free energy and consists of three terms: ther-dependent term represents the free-energy density of an idealgas and is included to help enforce incompressibility. The non-ideal behaviour of the system is contained in the f-dependentterms. First, the mixing free-energy density V (f) determines thephase behaviour of the uid. Here we choose the familiar
Landau model for a binary uid, V !f"h12af2 $ 1
4bf4; where a
< 0 < b, allowing the formation of two equilibrium phases thatrepresent the liquid and the vapour. The square-gradient termprevents the stabilisation of arbitrarily small neighbouringdomains, inducing instead the formation of a macroscopicinterface whose surface energy can be controlled by an appro-priate choice of the parameter k. The second integral on theRHS of eqn (1) is a Cahn-type surface free energy that dependson the local surface concentration fs(r), where S is the surface ofthe solid-uid interface. By choosing the parameter h this termcan be used to model wetting properties, i.e., by introducing apreferential attraction of one of the two phases to the solidsurface.
The equilibrium density and concentration elds follow byminimising the free energy; requiring that the rst variation ofF vanishes leads to the set of equations
mhdFdf
# dVdf
% kV2f # 0; (2)
and
nVf |S #% h
k; (3)
where m(f) is the chemical potential of the binary mixture and nis the local normal unit vector pointing into the solidboundary.
Close to the interface, the phase eld varies as a hyperbolictangent with the normal coordinate to the interface, r,
f!r" # feqtan h
$r
3
%; (4)
where feqh&&&&&&&&&&&&%a=b
psets the bulk concentration values, i.e.
limr/&N f(r) # &feq, and 3h&&&&&&&&&&&&&&%k=2a
pis the interface thick-
ness. The pressure tensor is
Pab #
"1
3r$ f
dVdf
% V % k
$fV2f$ 1
2|Vf|
2%#
dab $ kvafvbf;
(5)
where the f-dependent terms give rise to interfacial forces.Specically, it can be shown that the pressure drop across theinterface obeys the Young–Laplace equation,
DP # gk,
where gh&&&&&&&&&&&&&&&&&&&&&&&%8ka3=9b2
pis the surface tension and k is the
interface curvature. Similarly, the force balance at the solid–liquid–vapour boundary is dictated by Young's equation, whichdenes the equilibrium contact angle qe, via
cos qe #1
2
"%$1% h&&&&&
kbp
%3=2
$$1$ h&&&&&
kbp
%3=2#
(6)
In this paper we shall assume that the system is isothermal,which has been shown to be a reasonable approximation forevaporation driven by concentration gradients.1 The hydrody-namic equations governing the motion of the uid are thereforethe continuity equation,
vtr + va(rva) # 0, (7)
the Navier–Stokes equations,
vt!rva" $ vb!rvavb" # %vbPab $ vb
"h
$vbva $ vavb %
2
3dabvgvg
%
$ xdabvgvg
#
(8)
and the Cahn–Hilliard convection-diffusion equation,
vtf + va(fva) # %vaja, (9)
8268 | Soft Matter, 2014, 10, 8267–8275 This journal is © The Royal Society of Chemistry 2014
Soft Matter Paper
Publ
ished
on
04 S
epte
mbe
r 201
4. D
ownl
oade
d by
Uni
vers
ity o
f Oxf
ord
on 1
5/04
/201
5 10
:48:
32.
View Article Online

where v(r) is the velocity eld, h and x are the shear and secondviscosities, and summation over repeated Greek indices isimplied.
An important feature of the coupled system given by eqn (8)and (9) is their behaviour close to the triple line. For sharpinterface approximations, enforcing the no-slip boundarycondition along the wall leads to the well-known viscous dissi-pation singularity at the contact line.19 This divergence isnaturally regularised by the diffuse interface model by virtue ofthe diffusive term in eqn (9), which allows for diffusive trans-port along the wall.20,21 The key ingredient needed to modelevaporation in the Cahn–Hilliard equation is the diffusive ux j,which obeys the constitutive equation
ja # %Mvam. (10)
HereM, oen called the mobility parameter, plays the role ofa diffusivity. In the limit of weak deviations from equilibrium, m' f and eqn (10) reduces to the familiar Fick's law. In general,Mcan be chosen to differ between the two phases or even todepend on the local concentration eld, e.g., to model situa-tions where diffusive transport is limited by one phase, or iscoupled to an external eld. For our current purpose, which is toexamine the validity of the model for studying evaporationunder isothermal conditions, we restrict ourselves to the case ofconstant M throughout both phases.
In order to complete the model equations we need to specifyboundary conditions at the solid wall, and away from the uid–uid interface. Similarly to eqn (3), which is a Neummanboundary condition for f at the wall dened by the surface S, weimpose
n$Vr|S # 0, (11)
along with the impenetrability and no-slip boundary conditions
n$v|S # 0 (12)
and
t$v|S # 0, (13)
with t the unit tangent vector to the wall.Because of the nite size of the simulation domain, we need
to impose further boundary conditions at the simulationdomain edges. We use periodic boundary conditions for thevelocity and density elds. To drive the evaporation we imposethe Dirichlet boundary condition
f|SH# fH, (14)
where SH is a surface enclosing the system. Imposing a givenvalue of f on this boundary, eqn (14), is similar to imposing asurface of constant concentration when solving the diffusionequation for the vapour concentration. However, as in theclassical diffusion problem, other boundary conditions, such asa xed ux, can be more suitable for certain situations.
To integrate the set of eqn (7)–(9) we use the LB algorithmdescribed in ref. 22. We discretise the system using a cubic
mesh with lattice spacing Dx # 1. We consider the discretetime evolution of two sets of velocity distribution functions, fiand gi, each associated with a velocity vector ci. The timedependence of the distribution functions is given by the LBequations
fi'r$ ciDt; t$ Dt
(% fi!r; t" # % Dt
s
'fi % f eqi
(; (15)
and
gi'r$ ciDt; t$ Dt
(% gi!r; t" # % Dt
sg
'gi % geqi
(: (16)
The distribution functions undergo a collision step, corre-sponding to the right-hand side of eqn (15) and (16), where theyrelax towards the equilibrium values feqi and geqi Here we use theBGK collision operator, where the relaxation step occurs overthe timescales s and sg, respectively. Aer the collision step,distribution functions are advected to neighbouring sites in thelattice as indicated by the le-hand side of eqn (15) and (16). Weset the time step to Dt # 1, so the set of velocity vectors {ci}completely denes the connectivity of the lattice. Here we usethe D3Q15model,22 where each lattice site is connected to its sixnearest and eight third-nearest neighbours.
The link between the LB algorithm and the hydrodynamicequations is established by enforcing mass and momentumconservation during collisions and by choosing the equilibriumdistribution functions to be consistent with both the form of thestress tensor and the thermodynamic model. The hydrody-namic variables are dened as
rhX
i
fi; rvahX
i
cia fi; fhX
i
gi: (17)
Mass and momentum conservation are thus enforced byrequiring
X
i
f eqi # r;X
i
cia feqi # rva;
X
i
geqi # f; (18)
and the higher order moments of the distribution functions aredened as
X
i
f eqi ciacib # Pab $ rvavb; (19)
andX
i
geqi ciacib # Mmdab $ fvavb: (20)
The equilibrium distribution functions are written asexpansions in the velocity, e.g.,
f eqi # rui
$Ai $ 3vacia $
9
2vavbciacib %
3
2v2 $ Gabciacib
%; (21)
where the coefficients are xed by enforcing eqn (19) and byobserving the symmetry conditions imposed by the lattice. Asimilar expression is used for geqi . The values of the coefficientsare reported in ref. 22 and are omitted here for brevity.
This journal is © The Royal Society of Chemistry 2014 Soft Matter, 2014, 10, 8267–8275 | 8269
Paper Soft Matter
Publ
ished
on
04 S
epte
mbe
r 201
4. D
ownl
oade
d by
Uni
vers
ity o
f Oxf
ord
on 1
5/04
/201
5 10
:48:
32.
View Article Online
The hydrodynamic equations are recovered by performing aChapman–Enskog expansion of eqn (15) and (16), and usingeqn (17)–(20). The transport coefficients are related to the LBrelaxation times by
h # 2s% 1
6
and
M # sg % 1
2M:
Boundary conditions at solid surfaces are imposed usingbounce-back rules,23 which recover the impenetrability andno-slip boundary conditions approximately half way betweensolid and uid lattice sites.
3 Evaporation of a planar film3.1 Analytical approach
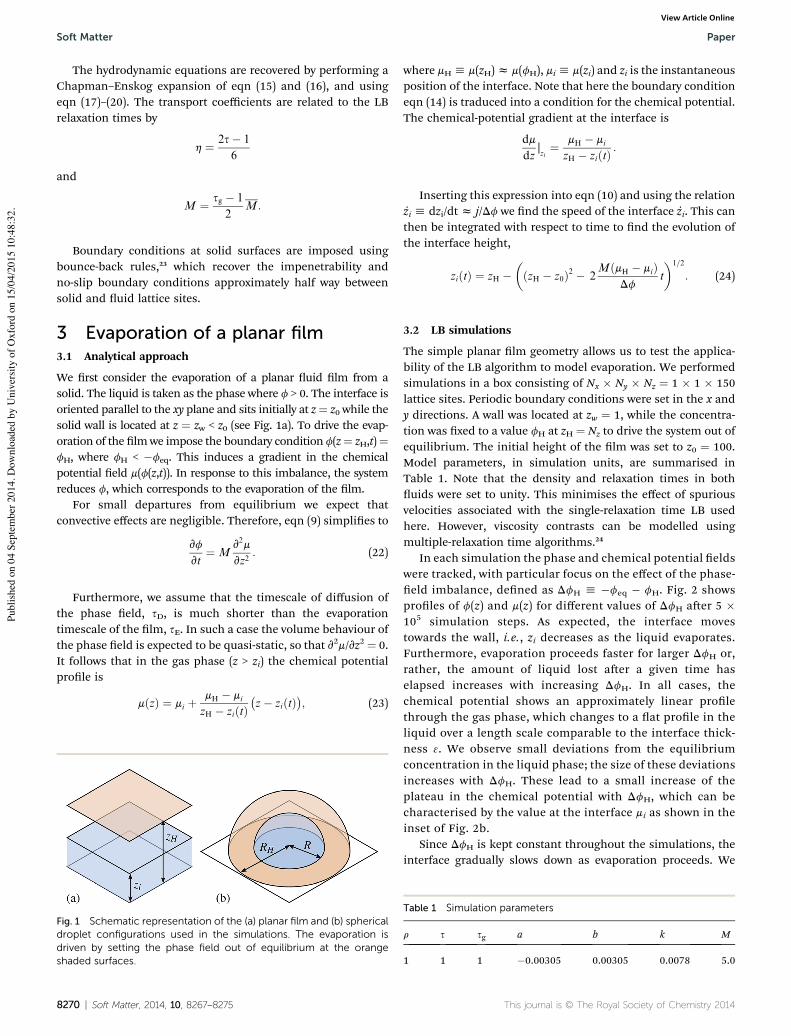
We rst consider the evaporation of a planar uid lm from asolid. The liquid is taken as the phase where f > 0. The interface isoriented parallel to the xy plane and sits initially at z# z0 while thesolid wall is located at z # zw < z0 (see Fig. 1a). To drive the evap-oration of the lmwe impose the boundary condition f(z# zH,t)#fH, where fH < %feq. This induces a gradient in the chemicalpotential eld m(f(z,t)). In response to this imbalance, the systemreduces f, which corresponds to the evaporation of the lm.
For small departures from equilibrium we expect thatconvective effects are negligible. Therefore, eqn (9) simplies to
vf
vt# M
v2m
vz2: (22)
Furthermore, we assume that the timescale of diffusion ofthe phase eld, sD, is much shorter than the evaporationtimescale of the lm, sE. In such a case the volume behaviour ofthe phase eld is expected to be quasi-static, so that v2m/vz2 # 0.It follows that in the gas phase (z > zi) the chemical potentialprole is
m!z" # mi $mH % mi
zH % zi!t"'z% zi!t"
(; (23)
where mHh m(zH)z m(fH), mih m(zi) and zi is the instantaneousposition of the interface. Note that here the boundary conditioneqn (14) is traduced into a condition for the chemical potential.The chemical-potential gradient at the interface is
dm
dz|zi# mH % mi
zH % zi!t":
Inserting this expression into eqn (10) and using the relationzi h dzi/dtz j/Df we nd the speed of the interface zi. This canthen be integrated with respect to time to nd the evolution ofthe interface height,
zi!t" # zH %$!zH % z0"2 % 2
M!mH % mi"Df
t
%1=2
: (24)
3.2 LB simulations
The simple planar lm geometry allows us to test the applica-bility of the LB algorithm to model evaporation. We performedsimulations in a box consisting of Nx ( Ny ( Nz # 1 ( 1 ( 150lattice sites. Periodic boundary conditions were set in the x andy directions. A wall was located at zw # 1, while the concentra-tion was xed to a value fH at zH # Nz to drive the system out ofequilibrium. The initial height of the lm was set to z0 # 100.Model parameters, in simulation units, are summarised inTable 1. Note that the density and relaxation times in bothuids were set to unity. This minimises the effect of spuriousvelocities associated with the single-relaxation time LB usedhere. However, viscosity contrasts can be modelled usingmultiple-relaxation time algorithms.24
In each simulation the phase and chemical potential eldswere tracked, with particular focus on the effect of the phase-eld imbalance, dened as DfH h %feq % fH. Fig. 2 showsproles of f(z) and m(z) for different values of DfH aer 5 (105 simulation steps. As expected, the interface movestowards the wall, i.e., zi decreases as the liquid evaporates.Furthermore, evaporation proceeds faster for larger DfH or,rather, the amount of liquid lost aer a given time haselapsed increases with increasing DfH. In all cases, thechemical potential shows an approximately linear prolethrough the gas phase, which changes to a at prole in theliquid over a length scale comparable to the interface thick-ness 3. We observe small deviations from the equilibriumconcentration in the liquid phase; the size of these deviationsincreases with DfH. These lead to a small increase of theplateau in the chemical potential with DfH, which can becharacterised by the value at the interface mi as shown in theinset of Fig. 2b.
Since DfH is kept constant throughout the simulations, theinterface gradually slows down as evaporation proceeds. We
Fig. 1 Schematic representation of the (a) planar film and (b) sphericaldroplet configurations used in the simulations. The evaporation isdriven by setting the phase field out of equilibrium at the orangeshaded surfaces.
Table 1 Simulation parameters
r s sg a b k M
1 1 1 %0.00305 0.00305 0.0078 5.0
8270 | Soft Matter, 2014, 10, 8267–8275 This journal is © The Royal Society of Chemistry 2014
Soft Matter Paper
Publ
ished
on
04 S
epte
mbe
r 201
4. D
ownl
oade
d by
Uni
vers
ity o
f Oxf
ord
on 1
5/04
/201
5 10
:48:
32.
View Article Online

recorded both the evaporation speed and the gradient of thechemical potential at the interface at various times during thesimulation. As shown in Fig. 3a, the speed of evaporation ziscales linearly with the chemical-potential gradient as expectedfrom eqn (10). A linear t of the data gives a slopez 2.4, in closeagreement with the expected value M/Df # 2.5.
The time evolution of the position of the interface isshown in Fig. 3b. We present simulation results along with theanalytical prediction, eqn (24), where mi is xed at the valuemeasured in the simulations (Fig. 2b inset) and mH z afH +bf3
H. We nd good agreement between theory and simulation,with the smallest deviations observed for the smallest DfH
values.
To understand why the simulations deviate from theanalytical predictions for large DfH, we note that two mainmechanisms control the motion of the liquid front. On the one
hand, evaporation takes place over a time scale sE ## 0
z0dzi= _zi
which gives
sE # Dfz0!2zH % z0"M!mi % mH"
: (25)
Fig. 2 Phase-field and chemical potential profiles for the planar-filmevaporation after 5( 105 simulations steps. (a) The concentration fieldis driven out of equilibrium by imposing a prescribed concentrationvalue fH at the edge of the simulation box (z# zH). The inset shows thetime evolution for DfH/feq # 0.2 at intervals of 105 time steps. (b) Thechemical potential shows a linear profile in the gas phase, and remainsconstant in the liquid, except for small deviations at the interface,which grow with the external driving (inset). The numbers next to eachcurve correspond to the phase-field imbalance, DfH.
Fig. 3 Measurable quantities in the evaporation of a planar film. (a)Rate of evaporation as a function of the local gradient of thechemical potential. Symbols correspond to LB simulations. Thethick black line is a linear fit to the data. The arrow indicates thedirection of increasing time in the simulations, reflecting a slowingdown of the interface. (b) Interface position as a function of time.Symbols correspond to LB simulations. The thick black curvescorrespond to the theoretical prediction, eqn (24).
This journal is © The Royal Society of Chemistry 2014 Soft Matter, 2014, 10, 8267–8275 | 8271
Paper Soft Matter
Publ
ished
on
04 S
epte
mbe
r 201
4. D
ownl
oade
d by
Uni
vers
ity o
f Oxf
ord
on 1
5/04
/201
5 10
:48:
32.
View Article Online
On the other hand, the concentration imbalance DfH islevelled by diffusion over a timescale, sD, which can be esti-mated using eqn (22) in scaling form:
DfH
sD' M!mi % mH"
zH2;
giving,
sD ' DfHzH2
M!mi % mH": (26)
Combining eqn (25) and (26) gives the ratio of diffusive toevaporative timescales,
sDsE
' DfH
Df
)z0zH
$2% z0
zH
%*%1
: (27)
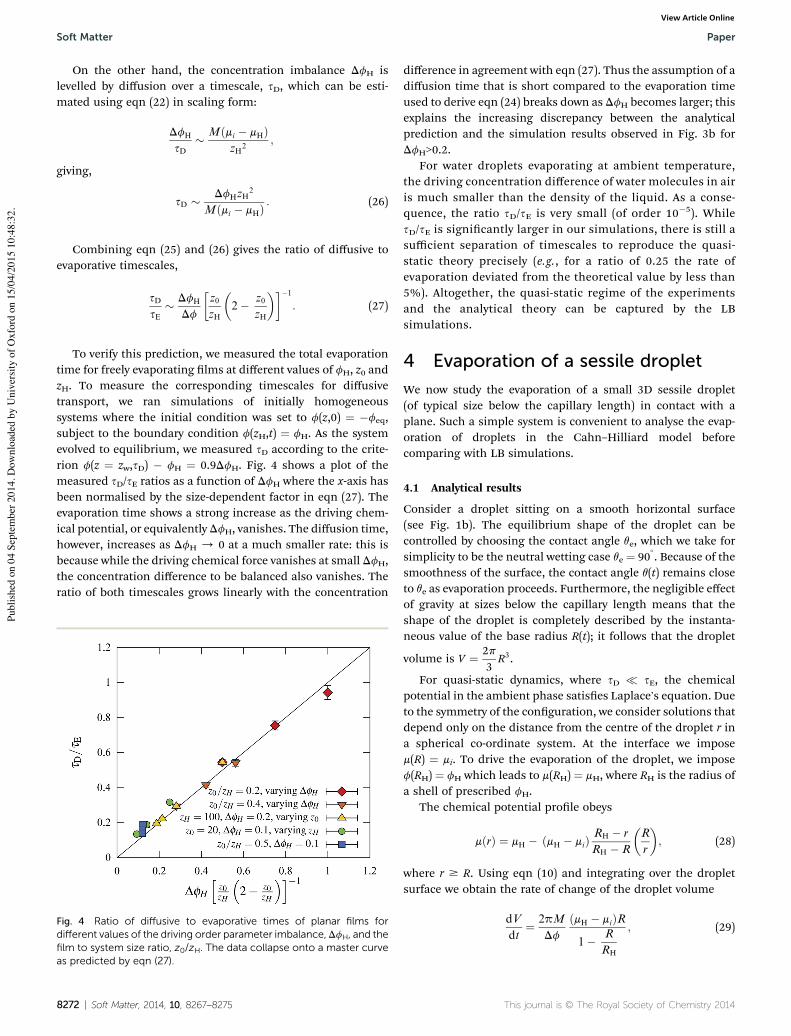
To verify this prediction, we measured the total evaporationtime for freely evaporating lms at different values of fH, z0 andzH. To measure the corresponding timescales for diffusivetransport, we ran simulations of initially homogeneoussystems where the initial condition was set to f(z,0) # %feq,subject to the boundary condition f(zH,t) # fH. As the systemevolved to equilibrium, we measured sD according to the crite-rion f(z # zw,sD) % fH # 0.9DfH. Fig. 4 shows a plot of themeasured sD/sE ratios as a function of DfH where the x-axis hasbeen normalised by the size-dependent factor in eqn (27). Theevaporation time shows a strong increase as the driving chem-ical potential, or equivalentlyDfH, vanishes. The diffusion time,however, increases as DfH / 0 at a much smaller rate: this isbecause while the driving chemical force vanishes at small DfH,the concentration difference to be balanced also vanishes. Theratio of both timescales grows linearly with the concentration
difference in agreement with eqn (27). Thus the assumption of adiffusion time that is short compared to the evaporation timeused to derive eqn (24) breaks down as DfH becomes larger; thisexplains the increasing discrepancy between the analyticalprediction and the simulation results observed in Fig. 3b forDfH>0.2.
For water droplets evaporating at ambient temperature,the driving concentration difference of water molecules in airis much smaller than the density of the liquid. As a conse-quence, the ratio sD/sE is very small (of order 10%5). WhilesD/sE is signicantly larger in our simulations, there is still asufficient separation of timescales to reproduce the quasi-static theory precisely (e.g., for a ratio of 0.25 the rate ofevaporation deviated from the theoretical value by less than5%). Altogether, the quasi-static regime of the experimentsand the analytical theory can be captured by the LBsimulations.
4 Evaporation of a sessile dropletWe now study the evaporation of a small 3D sessile droplet(of typical size below the capillary length) in contact with aplane. Such a simple system is convenient to analyse the evap-oration of droplets in the Cahn–Hilliard model beforecomparing with LB simulations.
4.1 Analytical results
Consider a droplet sitting on a smooth horizontal surface(see Fig. 1b). The equilibrium shape of the droplet can becontrolled by choosing the contact angle qe, which we take forsimplicity to be the neutral wetting case qe # 90
). Because of the
smoothness of the surface, the contact angle q(t) remains closeto qe as evaporation proceeds. Furthermore, the negligible effectof gravity at sizes below the capillary length means that theshape of the droplet is completely described by the instanta-neous value of the base radius R(t); it follows that the droplet
volume is V # 2p3R3.
For quasi-static dynamics, where sD * sE, the chemicalpotential in the ambient phase satises Laplace's equation. Dueto the symmetry of the conguration, we consider solutions thatdepend only on the distance from the centre of the droplet r ina spherical co-ordinate system. At the interface we imposem(R) # mi. To drive the evaporation of the droplet, we imposef(RH) # fH which leads to m(RH) # mH, where RH is the radius ofa shell of prescribed fH.
The chemical potential prole obeys
m!r" # mH % !mH % mi"RH % r
RH % R
$R
r
%; (28)
where r $ R. Using eqn (10) and integrating over the dropletsurface we obtain the rate of change of the droplet volume
dV
dt# 2pM
Df
!mH % mi"R
1% R
RH
; (29)Fig. 4 Ratio of diffusive to evaporative times of planar films fordifferent values of the driving order parameter imbalance,DfH, and thefilm to system size ratio, z0/zH. The data collapse onto a master curveas predicted by eqn (27).
8272 | Soft Matter, 2014, 10, 8267–8275 This journal is © The Royal Society of Chemistry 2014
Soft Matter Paper
Publ
ished
on
04 S
epte
mbe
r 201
4. D
ownl
oade
d by
Uni
vers
ity o
f Oxf
ord
on 1
5/04
/201
5 10
:48:
32.
View Article Online
which can be integrated to give
3
2
hV!t"2=3 % V 2=3
0
i% V!t" % V0
V1=3H
#'2$31=2p
(2=3MDf
!mH % mi"t;
(30)
where VH # 2pR3H/3. We note that eqn (30) accounts for the
nite size of the system through the radius of the hemisphericalshell, RH, at which the outer boundary condition is applied. Assuch, this result is the analogue of results used in moleculardynamics simulations of thermal evaporation to account for asimilar nite size effect.8,9 Crucially, in the limit of large system
size (or small droplets), V0 * VH, eqn (30) reduces to the well-known ‘D2 evaporation law’8
R2 ' (t* % t), (31)
where t* is the time at which the droplet vanishes completely.
4.2 LB simulations
We now test whether the LB simulations can reproduce theevaporation of 3D sessile droplets. We considered a simulationdomain of dimensions Nx ( Ny ( Nz # 100 ( 100 ( 50.
We focus on the effect of fH on droplets of neutral wettingproperties (qe # 90
)). A droplet of initial radius R0 z Nz/2 was
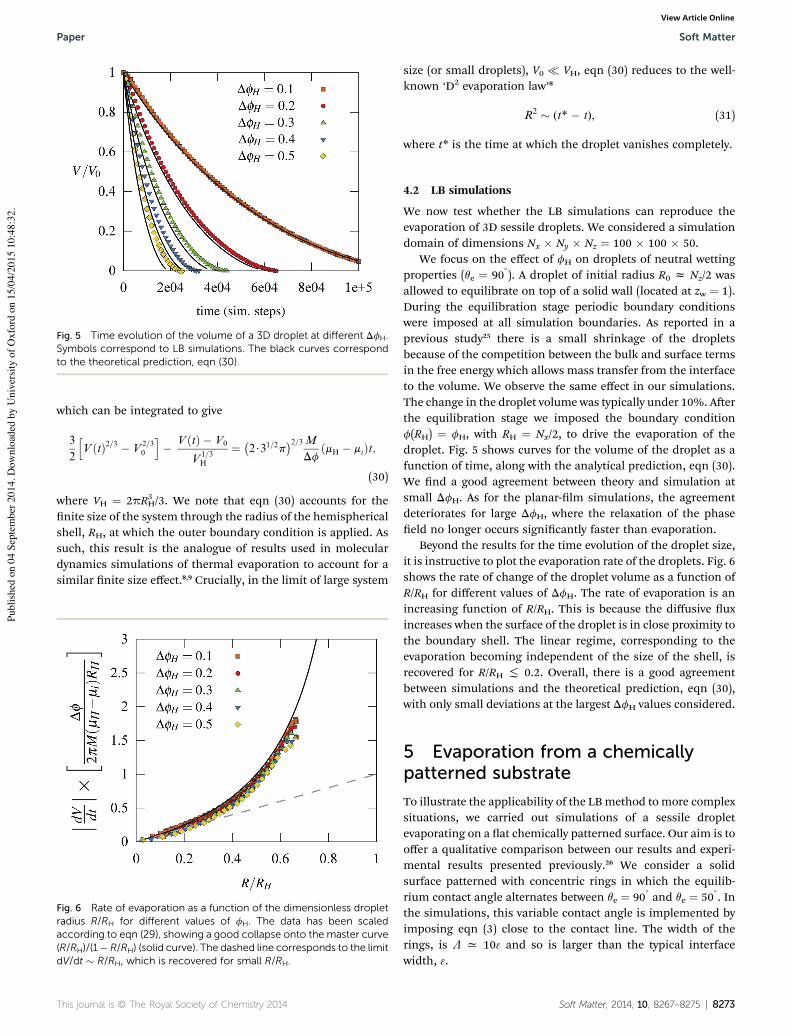
allowed to equilibrate on top of a solid wall (located at zw # 1).During the equilibration stage periodic boundary conditionswere imposed at all simulation boundaries. As reported in aprevious study25 there is a small shrinkage of the dropletsbecause of the competition between the bulk and surface termsin the free energy which allows mass transfer from the interfaceto the volume. We observe the same effect in our simulations.The change in the droplet volume was typically under 10%. Aerthe equilibration stage we imposed the boundary conditionf(RH) # fH, with RH # Nx/2, to drive the evaporation of thedroplet. Fig. 5 shows curves for the volume of the droplet as afunction of time, along with the analytical prediction, eqn (30).We nd a good agreement between theory and simulation atsmall DfH. As for the planar-lm simulations, the agreementdeteriorates for large DfH, where the relaxation of the phaseeld no longer occurs signicantly faster than evaporation.
Beyond the results for the time evolution of the droplet size,it is instructive to plot the evaporation rate of the droplets. Fig. 6shows the rate of change of the droplet volume as a function ofR/RH for different values of DfH. The rate of evaporation is anincreasing function of R/RH. This is because the diffusive uxincreases when the surface of the droplet is in close proximity tothe boundary shell. The linear regime, corresponding to theevaporation becoming independent of the size of the shell, isrecovered for R/RH ( 0.2. Overall, there is a good agreementbetween simulations and the theoretical prediction, eqn (30),with only small deviations at the largest DfH values considered.
5 Evaporation from a chemicallypatterned substrateTo illustrate the applicability of the LBmethod to more complexsituations, we carried out simulations of a sessile dropletevaporating on a at chemically patterned surface. Our aim is tooffer a qualitative comparison between our results and experi-mental results presented previously.26 We consider a solidsurface patterned with concentric rings in which the equilib-rium contact angle alternates between qe # 90
)and qe # 50
). In
the simulations, this variable contact angle is implemented byimposing eqn (3) close to the contact line. The width of therings, is L x 103 and so is larger than the typical interfacewidth, 3.
Fig. 5 Time evolution of the volume of a 3D droplet at different DfH.Symbols correspond to LB simulations. The black curves correspondto the theoretical prediction, eqn (30).
Fig. 6 Rate of evaporation as a function of the dimensionless dropletradius R/RH for different values of fH. The data has been scaledaccording to eqn (29), showing a good collapse onto the master curve(R/RH)/(1% R/RH) (solid curve). The dashed line corresponds to the limitdV/dt ' R/RH, which is recovered for small R/RH.
This journal is © The Royal Society of Chemistry 2014 Soft Matter, 2014, 10, 8267–8275 | 8273
Paper Soft Matter
Publ
ished
on
04 S
epte
mbe
r 201
4. D
ownl
oade
d by
Uni
vers
ity o
f Oxf
ord
on 1
5/04
/201
5 10
:48:
32.
View Article Online
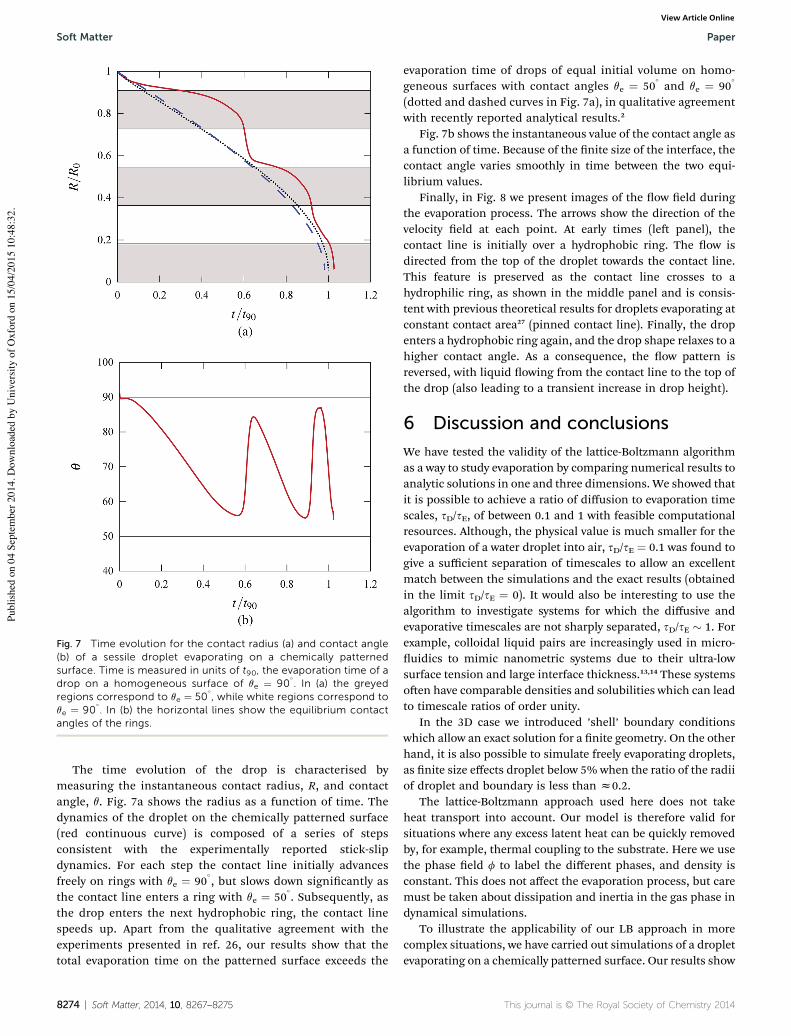
The time evolution of the drop is characterised bymeasuring the instantaneous contact radius, R, and contactangle, q. Fig. 7a shows the radius as a function of time. Thedynamics of the droplet on the chemically patterned surface(red continuous curve) is composed of a series of stepsconsistent with the experimentally reported stick-slipdynamics. For each step the contact line initially advancesfreely on rings with qe # 90
), but slows down signicantly as
the contact line enters a ring with qe # 50). Subsequently, as
the drop enters the next hydrophobic ring, the contact linespeeds up. Apart from the qualitative agreement with theexperiments presented in ref. 26, our results show that thetotal evaporation time on the patterned surface exceeds the
evaporation time of drops of equal initial volume on homo-geneous surfaces with contact angles qe # 50
)and qe # 90
)
(dotted and dashed curves in Fig. 7a), in qualitative agreementwith recently reported analytical results.2
Fig. 7b shows the instantaneous value of the contact angle asa function of time. Because of the nite size of the interface, thecontact angle varies smoothly in time between the two equi-librium values.
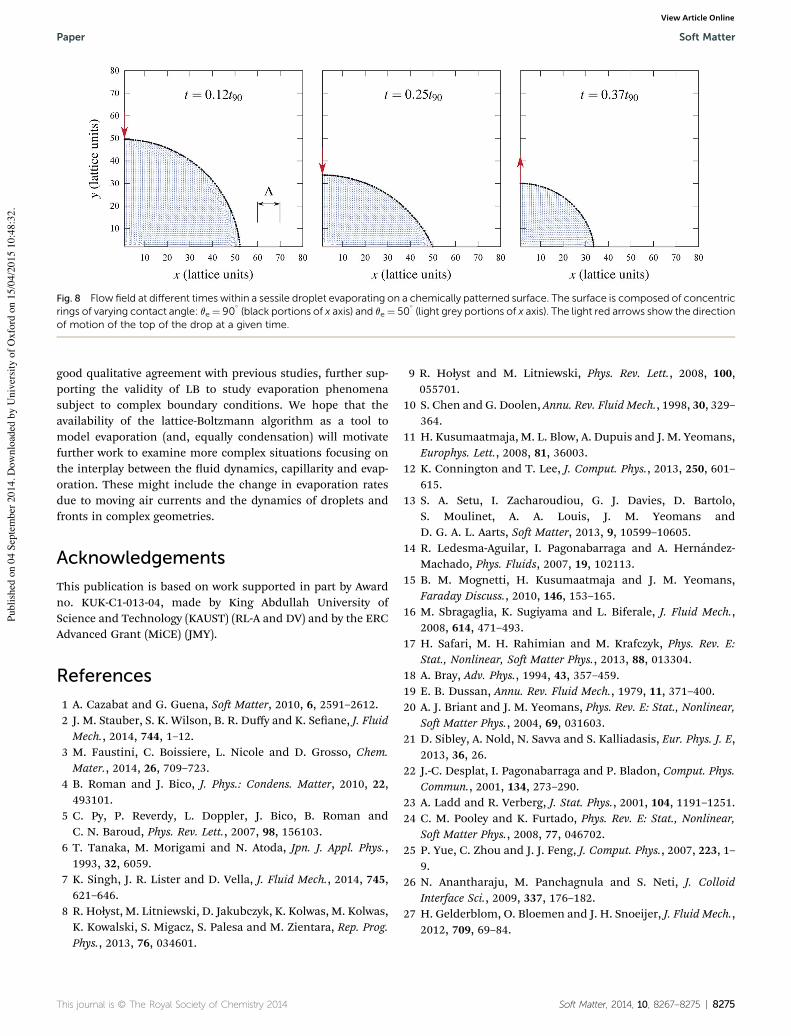
Finally, in Fig. 8 we present images of the ow eld duringthe evaporation process. The arrows show the direction of thevelocity eld at each point. At early times (le panel), thecontact line is initially over a hydrophobic ring. The ow isdirected from the top of the droplet towards the contact line.This feature is preserved as the contact line crosses to ahydrophilic ring, as shown in the middle panel and is consis-tent with previous theoretical results for droplets evaporating atconstant contact area27 (pinned contact line). Finally, the dropenters a hydrophobic ring again, and the drop shape relaxes to ahigher contact angle. As a consequence, the ow pattern isreversed, with liquid owing from the contact line to the top ofthe drop (also leading to a transient increase in drop height).
6 Discussion and conclusionsWe have tested the validity of the lattice-Boltzmann algorithmas a way to study evaporation by comparing numerical results toanalytic solutions in one and three dimensions. We showed thatit is possible to achieve a ratio of diffusion to evaporation timescales, sD/sE, of between 0.1 and 1 with feasible computationalresources. Although, the physical value is much smaller for theevaporation of a water droplet into air, sD/sE # 0.1 was found togive a sufficient separation of timescales to allow an excellentmatch between the simulations and the exact results (obtainedin the limit sD/sE # 0). It would also be interesting to use thealgorithm to investigate systems for which the diffusive andevaporative timescales are not sharply separated, sD/sE ' 1. Forexample, colloidal liquid pairs are increasingly used in micro-uidics to mimic nanometric systems due to their ultra-lowsurface tension and large interface thickness.13,14 These systemsoen have comparable densities and solubilities which can leadto timescale ratios of order unity.
In the 3D case we introduced ’shell’ boundary conditionswhich allow an exact solution for a nite geometry. On the otherhand, it is also possible to simulate freely evaporating droplets,as nite size effects droplet below 5% when the ratio of the radiiof droplet and boundary is less than z0.2.
The lattice-Boltzmann approach used here does not takeheat transport into account. Our model is therefore valid forsituations where any excess latent heat can be quickly removedby, for example, thermal coupling to the substrate. Here we usethe phase eld f to label the different phases, and density isconstant. This does not affect the evaporation process, but caremust be taken about dissipation and inertia in the gas phase indynamical simulations.
To illustrate the applicability of our LB approach in morecomplex situations, we have carried out simulations of a dropletevaporating on a chemically patterned surface. Our results show
Fig. 7 Time evolution for the contact radius (a) and contact angle(b) of a sessile droplet evaporating on a chemically patternedsurface. Time is measured in units of t90, the evaporation time of adrop on a homogeneous surface of qe # 90
). In (a) the greyed
regions correspond to qe # 50), while white regions correspond to
qe # 90). In (b) the horizontal lines show the equilibrium contact
angles of the rings.
8274 | Soft Matter, 2014, 10, 8267–8275 This journal is © The Royal Society of Chemistry 2014
Soft Matter Paper
Publ
ished
on
04 S
epte
mbe
r 201
4. D
ownl
oade
d by
Uni
vers
ity o
f Oxf
ord
on 1
5/04
/201
5 10
:48:
32.
View Article Online
good qualitative agreement with previous studies, further sup-porting the validity of LB to study evaporation phenomenasubject to complex boundary conditions. We hope that theavailability of the lattice-Boltzmann algorithm as a tool tomodel evaporation (and, equally condensation) will motivatefurther work to examine more complex situations focusing onthe interplay between the uid dynamics, capillarity and evap-oration. These might include the change in evaporation ratesdue to moving air currents and the dynamics of droplets andfronts in complex geometries.
AcknowledgementsThis publication is based on work supported in part by Awardno. KUK-C1-013-04, made by King Abdullah University ofScience and Technology (KAUST) (RL-A and DV) and by the ERCAdvanced Grant (MiCE) (JMY).
References1 A. Cazabat and G. Guena, So Matter, 2010, 6, 2591–2612.2 J. M. Stauber, S. K. Wilson, B. R. Duffy and K. Seane, J. FluidMech., 2014, 744, 1–12.
3 M. Faustini, C. Boissiere, L. Nicole and D. Grosso, Chem.Mater., 2014, 26, 709–723.
4 B. Roman and J. Bico, J. Phys.: Condens. Matter, 2010, 22,493101.
5 C. Py, P. Reverdy, L. Doppler, J. Bico, B. Roman andC. N. Baroud, Phys. Rev. Lett., 2007, 98, 156103.
6 T. Tanaka, M. Morigami and N. Atoda, Jpn. J. Appl. Phys.,1993, 32, 6059.
7 K. Singh, J. R. Lister and D. Vella, J. Fluid Mech., 2014, 745,621–646.
8 R. Ho!yst, M. Litniewski, D. Jakubczyk, K. Kolwas, M. Kolwas,K. Kowalski, S. Migacz, S. Palesa and M. Zientara, Rep. Prog.Phys., 2013, 76, 034601.
9 R. Ho!yst and M. Litniewski, Phys. Rev. Lett., 2008, 100,055701.
10 S. Chen and G. Doolen, Annu. Rev. Fluid Mech., 1998, 30, 329–364.
11 H. Kusumaatmaja, M. L. Blow, A. Dupuis and J. M. Yeomans,Europhys. Lett., 2008, 81, 36003.
12 K. Connington and T. Lee, J. Comput. Phys., 2013, 250, 601–615.
13 S. A. Setu, I. Zacharoudiou, G. J. Davies, D. Bartolo,S. Moulinet, A. A. Louis, J. M. Yeomans andD. G. A. L. Aarts, So Matter, 2013, 9, 10599–10605.
14 R. Ledesma-Aguilar, I. Pagonabarraga and A. Hernandez-Machado, Phys. Fluids, 2007, 19, 102113.
15 B. M. Mognetti, H. Kusumaatmaja and J. M. Yeomans,Faraday Discuss., 2010, 146, 153–165.
16 M. Sbragaglia, K. Sugiyama and L. Biferale, J. Fluid Mech.,2008, 614, 471–493.
17 H. Safari, M. H. Rahimian and M. Krafczyk, Phys. Rev. E:Stat., Nonlinear, So Matter Phys., 2013, 88, 013304.
18 A. Bray, Adv. Phys., 1994, 43, 357–459.19 E. B. Dussan, Annu. Rev. Fluid Mech., 1979, 11, 371–400.20 A. J. Briant and J. M. Yeomans, Phys. Rev. E: Stat., Nonlinear,
So Matter Phys., 2004, 69, 031603.21 D. Sibley, A. Nold, N. Savva and S. Kalliadasis, Eur. Phys. J. E,
2013, 36, 26.22 J.-C. Desplat, I. Pagonabarraga and P. Bladon, Comput. Phys.
Commun., 2001, 134, 273–290.23 A. Ladd and R. Verberg, J. Stat. Phys., 2001, 104, 1191–1251.24 C. M. Pooley and K. Furtado, Phys. Rev. E: Stat., Nonlinear,
So Matter Phys., 2008, 77, 046702.25 P. Yue, C. Zhou and J. J. Feng, J. Comput. Phys., 2007, 223, 1–
9.26 N. Anantharaju, M. Panchagnula and S. Neti, J. Colloid
Interface Sci., 2009, 337, 176–182.27 H. Gelderblom, O. Bloemen and J. H. Snoeijer, J. Fluid Mech.,
2012, 709, 69–84.
Fig. 8 Flow field at different times within a sessile droplet evaporating on a chemically patterned surface. The surface is composed of concentricrings of varying contact angle: qe# 90
)(black portions of x axis) and qe# 50
)(light grey portions of x axis). The light red arrows show the direction
of motion of the top of the drop at a given time.
This journal is © The Royal Society of Chemistry 2014 Soft Matter, 2014, 10, 8267–8275 | 8275
Paper Soft Matter
Publ
ished
on
04 S
epte
mbe
r 201
4. D
ownl
oade
d by
Uni
vers
ity o
f Oxf
ord
on 1
5/04
/201
5 10
:48:
32.
View Article Online


![JID: PROCI [m;October 10, 2016;9:36] - rainbow … fileto characterize locally the evaporation of gasoline droplets by measuring the droplet evaporation rate and ... evaporationrate,whilethemeasurementofmoving](https://img.pdfslide.net/doc/110x75/5b77a0867f8b9ad2498d1986/jid-proci-moctober-10-2016936-rainbow-characterize-locally-the-evaporation.jpg)