Embed Size (px)
Citation preview
1
INFLUENCE OF TREAD DESIGN PARAMETERS ON AIR PUMPING NOISE IN AUTOMOTIVE TIRES
Rahul Oorath, Abhishek Saraswat , Shivashish Kumar Gupta and Nachiketa Tiwari
Indian Institute of Technology Kanpur, India
email: [email protected]
Sharad Goyal and Chirag Patel
CEAT Limited, Halol, Gujarat, India
In this paper the authors have analyzed noise characteristics of tires with different tread parameters. For
this, a computational model based on image processing technique to predict the noise produced in rolling
tires has been developed. The model considers different parameters of tire design such as pitch sequence,
pitch length, pitch width, pitch angle, speed of vehicle, length of contact patch, and compression of tread.
The model then predicts the noise generated by tread excitation in temporal and frequency domains. To-
wards this goal, first the volume velocity is calculated for quantifying the air pumped. Image processing
method was used to calculate volume velocity. This volume velocity was numerically processed to compute
sound pressure level at a given distance in free-field conditions in both dB and dBA units. For validation
the predicted pressure results were compared with limited experimental data as well as results from a proven
software. Next, the model was used to study the impact of tread parameters on tire noise generated. Addi-
tionally, the authors have also considered horn effect to quantitatively predict overall tire noise.
Keywords: Tire noise, Air pumping, Tire model, Tire design parameters, Horn effect on tire noise
1. Introduction
There are several mechanisms for noise generation when a tire interacts with road [1-4]. These
mechanisms broadly include stick-slip vibration of treads, air pumping, Helmholtz resonance, tire air
cavity resonance, sidewall vibrations and pipe resonance. Iwao and Yamazaki [5] developed a model
in which excitation of tire due to tread pattern was resolved into first and second order components.
The authors suggested that the noise produced by tire sidewall was excited by first order components
and the tread surface was excited by second order components. The phenomena of air pumping was
first proposed by Hayden [6]. It was later experimentally studied by Winroth et al. [7]. The authors
calculated the relative magnitudes of tire vibration noise and air pumping noise and it was shown that
air pumping significantly contributes to overall tire noise. Ejsmont [8] in his paper has discussed
different types of pulse shapes to represent air pumping noise. Later, Chiu and Tu [9] used pattern
recognition algorithms to identify tread pattern. They fitted time domain experimental data for a tire
onto its simulated data to determine the geometry of a tire’s contact patch. Further they used same
contact patch shape and size to predict noise of other tires of similar category. To match simulated
results with experimental observations, Cho et al. [10] used adaptive filters to tune model. Gagen [11]
have developed approximate analytical solutions of exhaust velocity using a squeezed tire cavity
model. Kim et al. [12] have used CFD analysis to calculate the flow of air out of a squeezed tire cavity
and subsequently developed a nonlinear air pumping noise source.
ICSV24, London, 23-27 July 2017
2 ICSV24, London, 23-27 July 2017
Tiwari et al. [13] had discussed a model to predict air pumping noise accounting for the exact
profile of a tire surface as well as all the features of contact patch. They had considered pitch param-
eters, pitch sequence, contact patch length and speed as input parameters and had predicted air pump-
ing noise quantitatively with considerable accuracy. Their noise simulation algorithm used numerical
scanning of the tire profile in order to calculate volume velocity. However, such a method takes sig-
nificant time to generate input files as it requires extraction of tread information from geometrical
tread parameters. Further, it is also prone to errors. Finally, the numeric scanning does not accurately
capture complex shapes of pitches. Hence, in this work, we directly use images of tread patterns as
input. Further, in the current paper the authors have considered horn effect in addition to the param-
eters mentioned above to quantitatively predict air pumping noise. The “horn effect” not only ampli-
fies air pumping noise significantly, but it also alters the color of this noise by amplifying certain
frequencies more than others. This effect has been studied both analytically [14] as well as experi-
mentally [14, 15]. The noise generated due to air pumping gets amplified due to horn effect, and it is
this noise that is heard. Hence, a good model for predicting air pumping noise should account for
effects of all of the design features of contact patch, the vehicle speed as well as the horn effect.
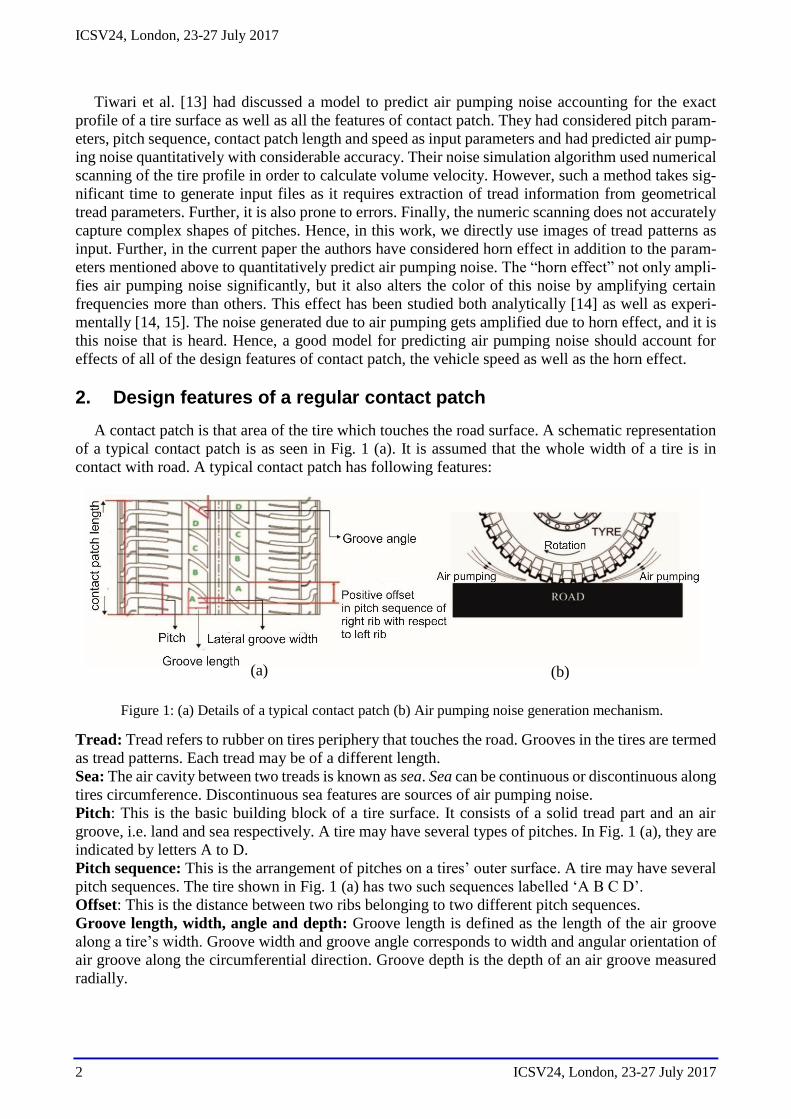
2. Design features of a regular contact patch
A contact patch is that area of the tire which touches the road surface. A schematic representation
of a typical contact patch is as seen in Fig. 1 (a). It is assumed that the whole width of a tire is in
contact with road. A typical contact patch has following features:
Tread: Tread refers to rubber on tires periphery that touches the road. Grooves in the tires are termed
as tread patterns. Each tread may be of a different length.
Sea: The air cavity between two treads is known as sea. Sea can be continuous or discontinuous along
tires circumference. Discontinuous sea features are sources of air pumping noise.
Pitch: This is the basic building block of a tire surface. It consists of a solid tread part and an air
groove, i.e. land and sea respectively. A tire may have several types of pitches. In Fig. 1 (a), they are
indicated by letters A to D.
Pitch sequence: This is the arrangement of pitches on a tires’ outer surface. A tire may have several
pitch sequences. The tire shown in Fig. 1 (a) has two such sequences labelled ‘A B C D’.
Offset: This is the distance between two ribs belonging to two different pitch sequences.
Groove length, width, angle and depth: Groove length is defined as the length of the air groove
along a tire’s width. Groove width and groove angle corresponds to width and angular orientation of
air groove along the circumferential direction. Groove depth is the depth of an air groove measured
radially.
Figure 1: (a) Details of a typical contact patch (b) Air pumping noise generation mechanism.
(a) (b)
ICSV24, London, 23-27 July 2017
ICSV24, London, 23-27 July 2017 3
3. Modelling of air pumping noise
The tire-road contact and the basic mechanism underlying air pumping in tires is as shown in Fig.
1 (b). Here, noise generated due to air pumping is due to variation in volume of air cavity between
tire treads. When a tread enters the contact patch, the volume of the air cavity is reduced which leads
to pumping of air out of the cavity. Further, when the tread comes out of contact patch, the size of the
cavity is reinstated leading to pumping of air into the cavity. The process of pumping air in and out
of the cavity makes positive and negative pressure pulses, which is heard as tire noise.
As discussed in previous section, air pumping noise is due to repeated entry and exit of air from
the grooves. Thus, for computing the noise level due to air pumping mechanism, it is required to
quantify the pumping of air. For noise prediction we have to calculate the volume velocity of this
airflow.
The authors have developed an image processing algorithm which calculates the volume velocity
of pumped air by scanning the profile of the tire. For this, road is assumed as a smooth surface. Such
a scanning process of the tire’s contact patch accounts for all contact patch parameters, pitch se-
quence, and tire speed as input variables. The algorithm enables the user to track air gaps entering
and exiting out of the contact patch. Each air gap acts as a source of volume velocity, which can be
calculated as the rate of change of volume of the air gap present in contact patch. This rate of change
of volume of air in contact patch also depends on the extent of compression of treads. The amount of
tread compression in turn depends on the tire weight and vehicle load. Tread compression is generally
between 2% and 10%. The volume velocity (𝑉𝑉) can thus be calculated using the expression:
𝑉𝑉(𝑡) = 𝐶𝑀𝑅 ∗ 𝑙 ∗ 𝑑𝑙 ∗ 𝑆 (1)
Here, 𝑉𝑉, 𝐶𝑀𝑅, l, dl and S correspond to volume velocity, compression ratio, lateral length of the
groove at a particular time, depth of the groove, and the vehicle speed respectively. At a given time,
there may be an air gap entering the contact patch and another one leaving the contact patch. The total
volume velocity is the sum of volume of air displaced by entering and exiting air gaps. The sign of
volume velocity attributable to entering air gap and that attributable to exiting air gap were considered
positive and negative respectively. In this exercise, we have assumed a constant groove depth of 8
mm for a new tire. Further, it was also assumed that the amount of tread compression is approximately
4% of overall groove depth. This is based on experimental data. Now, the relation between complex
amplitude of pressure and volume velocity in frequency domain for a monopole source in free field
medium is given by:
𝑃(𝜔) =𝜌𝜔
4𝜋𝑟𝑉𝑉(𝜔) (2)
Here, 𝑉𝑉(𝜔) and 𝑃(𝜔) are complex amplitudes of volume velocity and pressure corresponding to
angular frequency ω respectively, r is the distance between the point of observation and the source,
and ρ is density of the medium. The road surface has been considered as a perfectly reflecting infinite
baffle. Thus the relationship between 𝑉𝑉(𝜔) and 𝑃(𝜔) becomes:
𝑃(𝜔) =𝜌𝜔
4𝜋𝑟𝑉𝑉(𝜔) (3)
Once 𝑉𝑉(𝑡) had been computed using such an algorithm, 𝑉𝑉(𝜔) was obtained using the Fast Fou-
rier Transform (FFT) technique. Next, 𝑃(𝜔) was computed using Eq. 3, and an A- weighting filter
was applied onto it to obtain 𝑃𝐴(𝜔). The values attained are in frequency domain and an inverse FFT
was applied in order to compute 𝑃(𝑡) and 𝑃𝐴(𝑡). These functions were used to compute sound pres-
sure level (SPL) in dB and dBA units.
ICSV24, London, 23-27 July 2017
4 ICSV24, London, 23-27 July 2017
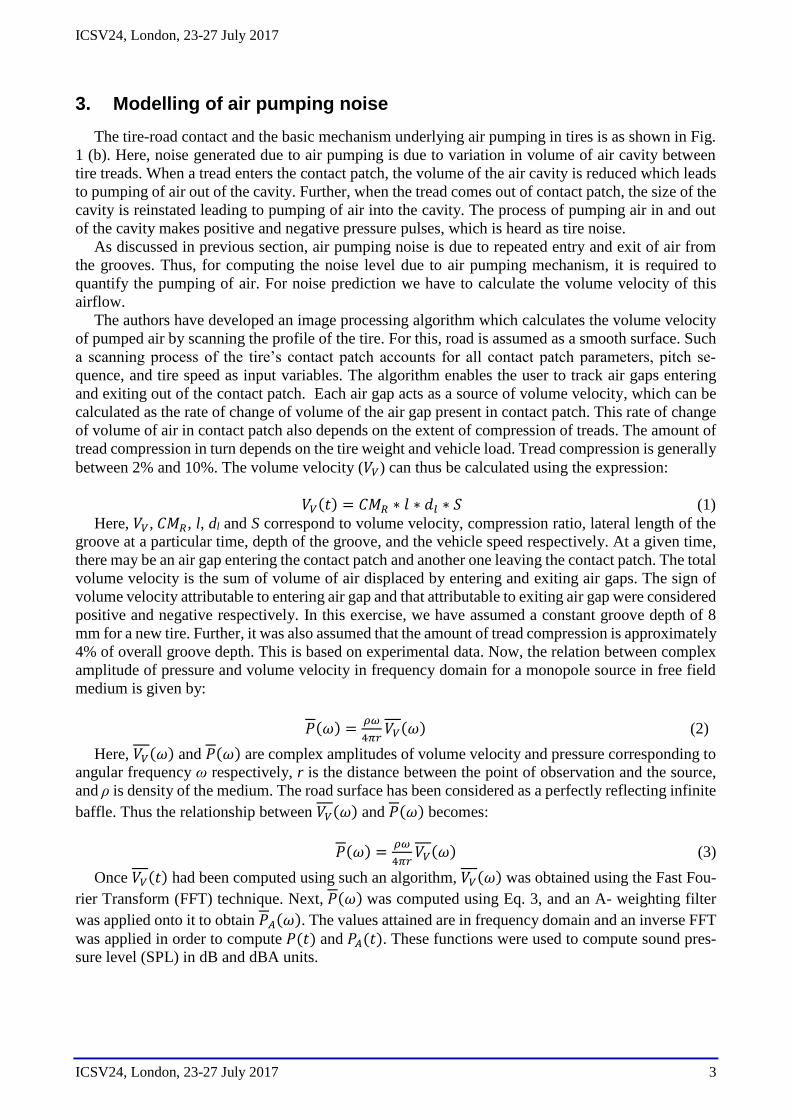
3.1 Image processing algorithm for volume velocity calculation
Consider the situation when a tire is laid down flat and the contact patch is rolling over it as shown
in Fig. 2 (a). The amount of white portion entering Edge-A and leaving Edge-B represents the amount
of air trapped and released, respectively at an instant. Their difference provides the instantaneous
volume velocity. As the contact patch moves over tire pitches the volume velocity at each instant is
calculated and thus corresponding noise produced in dBA is obtained.
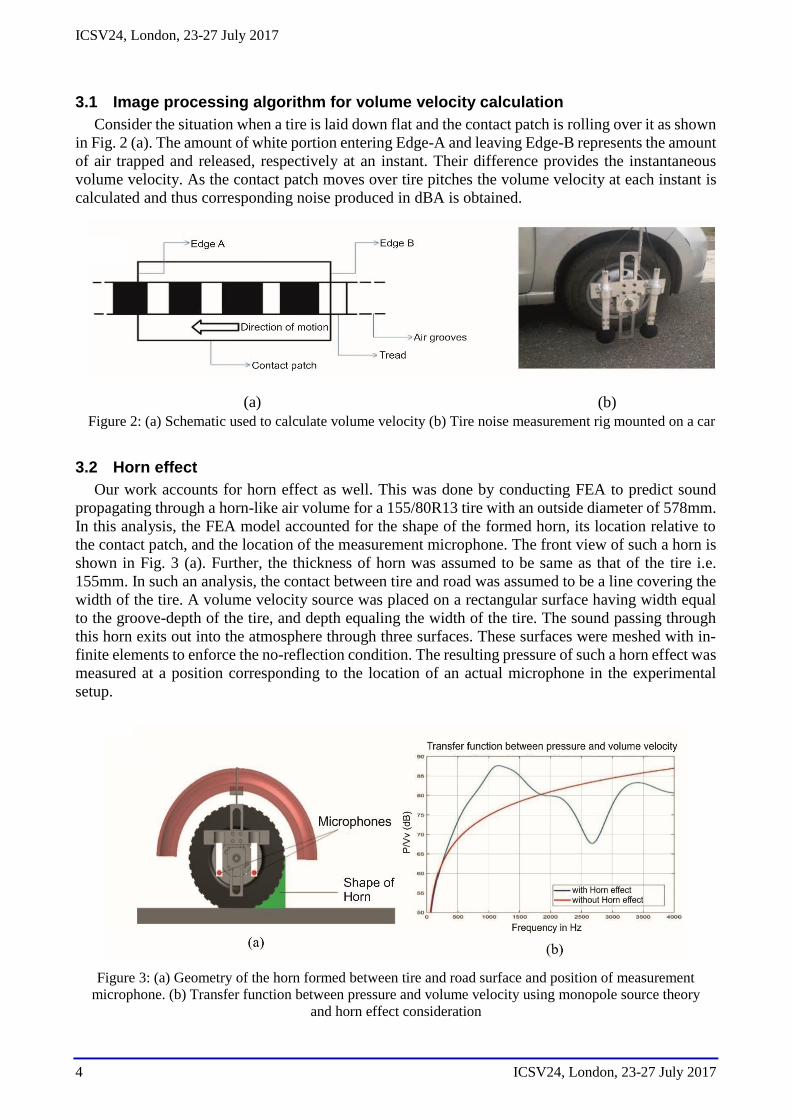
3.2 Horn effect
Our work accounts for horn effect as well. This was done by conducting FEA to predict sound
propagating through a horn-like air volume for a 155/80R13 tire with an outside diameter of 578mm.
In this analysis, the FEA model accounted for the shape of the formed horn, its location relative to
the contact patch, and the location of the measurement microphone. The front view of such a horn is
shown in Fig. 3 (a). Further, the thickness of horn was assumed to be same as that of the tire i.e.
155mm. In such an analysis, the contact between tire and road was assumed to be a line covering the
width of the tire. A volume velocity source was placed on a rectangular surface having width equal
to the groove-depth of the tire, and depth equaling the width of the tire. The sound passing through
this horn exits out into the atmosphere through three surfaces. These surfaces were meshed with in-
finite elements to enforce the no-reflection condition. The resulting pressure of such a horn effect was
measured at a position corresponding to the location of an actual microphone in the experimental
setup.
(i) (ii)
Figure 3: (a) Geometry of the horn formed between tire and road surface and position of measurement
microphone. (b) Transfer function between pressure and volume velocity using monopole source theory
and horn effect consideration
(a) (b)
Figure 2: (a) Schematic used to calculate volume velocity (b) Tire noise measurement rig mounted on a car
ICSV24, London, 23-27 July 2017
ICSV24, London, 23-27 July 2017 5
The transfer function in dB between pressure and volume velocity in absence and presence of the
horn effect is depicted in Fig. 3 (b). Such a comparison shows that horn effect can enhance spectral
amplitude in specific bands by as much as 15 dB. Thus, its accounting for accurate prediction of air
pumping noise is very important. It must also be stated here that the additional contribution to specific
bands due to horn effect is invariant of tread and pitch parameters, as well as the car speed. Rather, it
is a function of tire radius, and tire width. Thus, it acts as a “filter” for air-pumping noise for a given
class of tires with same radii and width, and its attributes need not be recalculated due to changes in
contact patch parameters.
4. Results
4.1 Influence of tire design parameters on air pumping noise
To study the influence of tire design parameters on air pumping noise, a tread configuration with
parameters as shown in Tables 1 and 2 was analyzed. The size of the tire studied was 155/80R13.
First, our software based on image processing method was validated against an existing proven
software. Comparison of results from our algorithm and the benchmark software [13] are shown in
Figs. 4 (a) and (b). Good agreement is seen between results from two software codes. Next, the tire
with parameters as defined in Tables 1 and 2 was used to study effects of changes in speed, contact
patch length, offset, groove angle, groove width and groove length on air-pumping noise.
4.1.1 Groove width
The duration of air pumping in tire is largely influenced by the lateral groove width. A wider
groove width would mean a higher volume velocity for a longer time duration and also lower fre-
quency and harmonic order. However, if the groove width increases beyond a certain threshold, the
SPL remains constant. The effect of groove width on air pumping noise is as shown in Fig. 4 (a). It
is seen that predicted noise level increases with increasing groove width up to 8.5 mm. After this
threshold there is minimal change in the SPL. This observation is consistent with our understanding
of the physical phenomena of air pumping.
4.1.2 Contact patch length
As contact patch length varies with load and environmental conditions, the sensitivity of air pump-
ing noise to changes in contact patch length was studied. The effect of changing the contact patch
length on air pumping noise is shown in Fig. 4 (b). It is seen that if the contact patch is a multiple of
pitch size (40 mm in our case) there would be less noise produced due to air pumping phenomena.
This is due to the fact that air pumped out because of a groove entering the contact patch would be
cancelled by the effect of same amount of air moving in, simultaneously. This is seen in Fig. 4 (b).
Here, the predicted noise at 120 mm and 160 mm is very small in relation to that for other contact
patch lengths. It can also be observed that apart from these special values of contact patch length, the
SPL level remains relatively unchanged.
Table 1 - Pitch parameters used to conduct parametric study.
Pitch Type θG WG LG Pitch Length (mm)
A 45 5 15 40
Pitch Sequence 123-123-123-123-123-123-123-123-123-123-123-123-123-123-123-123-123-123-123-123
Table 2 - Other parameters
Speed (Kmph) Contact Patch (mm) Compression Fraction (%) Groove depth (mm)
80 150 4 8
ICSV24, London, 23-27 July 2017
6 ICSV24, London, 23-27 July 2017
(a) (b)
Figure 4: (a) Effect of groove width on air pumping noise (b) Effect of contact patch length on air
pumping noise
(a) (b)
Figure 5: (a) Effect of groove length on air pumping noise (b) Effect of groove angle on air pumping
noise
(a) (b)
Figure 6: (a) Effect of offset on air pumping noise (b) Effect of vehicle speed on air pumping noise
4.1.3 Groove length
The volume of air pumped is directly controlled by lateral groove. As value of lateral groove length
increases, more volume of air is pumped, and this results in higher SPL. Effects of changing groove
length on the predicted noise level for the tire studied is shown in Fig. 5 (a).
It was observed that SPL increases with increase in groove length and then at around 13 mm (for
the tire under analysis), it becomes constant. It can be inferred from the graph that for most practical
values of groove length, the SPL remains nearly constant with respect to variation in groove length.
ICSV24, London, 23-27 July 2017
ICSV24, London, 23-27 July 2017 7
The aforementioned observation is strongly dependent on the tire under investigation and thus for a
different tire the threshold value of 13 mm can be different.
4.1.4 Groove angle
Effect of changes in groove angle on air pumping noise is as shown in Fig. 5 (b). The figure shows
that SPL decreases monotonically with increase in groove angle.
4.1.5 Offset
The value of offset between pitch sequences of two ribs can be tuned to reduce tire noise. This
effect is shown in Fig. 6 (a). It is seen in the figure that for the given pitch sequence, the SPL does
not strongly depend on the value of the offset.
4.1.6 Vehicle speed
It was observed that as vehicle speed increases SPL also increases. It has been often predicted in
existing literature that tire noise in passenger cars increases at a rate of 40log S where S is the speed
of the vehicle. The effect of speed on tire noise for the tire studied is as shown in Fig. 6 (b). It is seen
in the figure that SPL increases monotonically with speed at a rate of around 39.8 dB per decadal
increase in speed. This matches with our experimental data where the speed-SPL dependence was
observed to be 38.4 dB per decadal increment in speed.
4.2 Influence of horn effect on overall noise produced
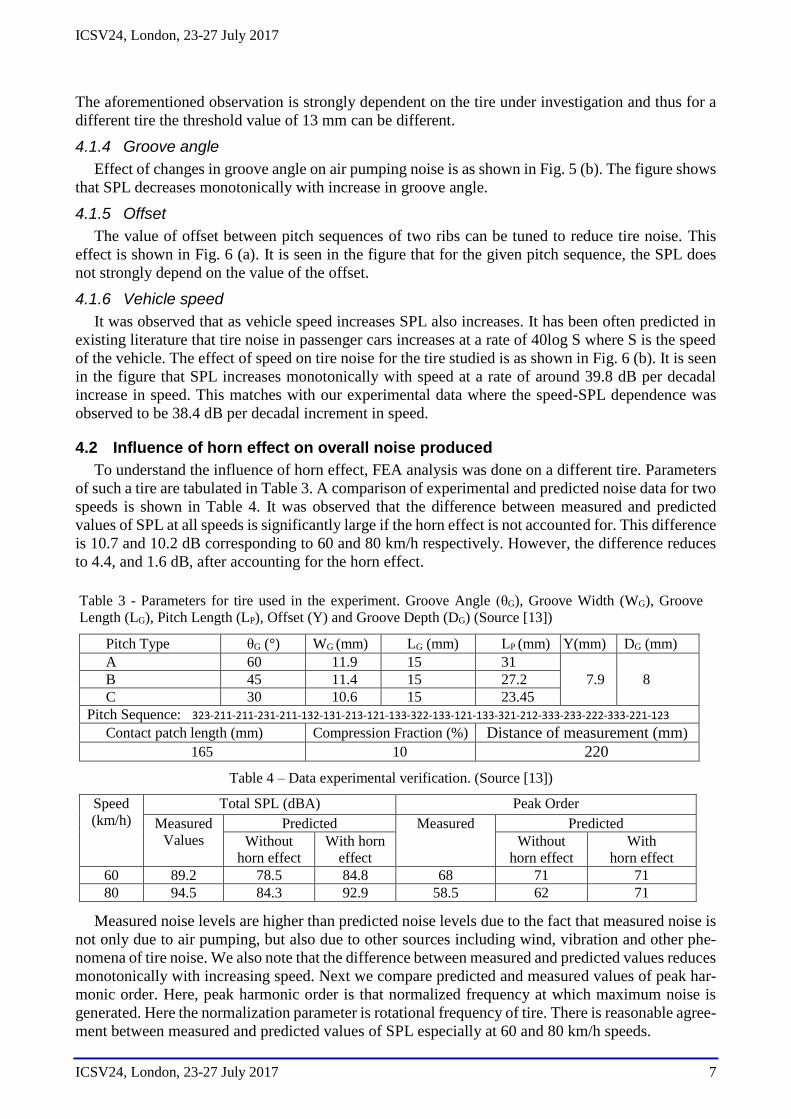
To understand the influence of horn effect, FEA analysis was done on a different tire. Parameters
of such a tire are tabulated in Table 3. A comparison of experimental and predicted noise data for two
speeds is shown in Table 4. It was observed that the difference between measured and predicted
values of SPL at all speeds is significantly large if the horn effect is not accounted for. This difference
is 10.7 and 10.2 dB corresponding to 60 and 80 km/h respectively. However, the difference reduces
to 4.4, and 1.6 dB, after accounting for the horn effect.
Measured noise levels are higher than predicted noise levels due to the fact that measured noise is
not only due to air pumping, but also due to other sources including wind, vibration and other phe-
nomena of tire noise. We also note that the difference between measured and predicted values reduces
monotonically with increasing speed. Next we compare predicted and measured values of peak har-
monic order. Here, peak harmonic order is that normalized frequency at which maximum noise is
generated. Here the normalization parameter is rotational frequency of tire. There is reasonable agree-
ment between measured and predicted values of SPL especially at 60 and 80 km/h speeds.
Table 3 - Parameters for tire used in the experiment. Groove Angle (θG), Groove Width (WG), Groove
Length (LG), Pitch Length (LP), Offset (Y) and Groove Depth (DG) (Source [13])
Pitch Type θG (°) WG (mm) LG (mm) LP (mm) Y(mm) DG (mm)
A 60 11.9 15 31
7.9 8 B 45 11.4 15 27.2
C 30 10.6 15 23.45
Pitch Sequence: 323-211-211-231-211-132-131-213-121-133-322-133-121-133-321-212-333-233-222-333-221-123
Contact patch length (mm) Compression Fraction (%) Distance of measurement (mm)
165 10 220
Table 4 – Data experimental verification. (Source [13])
Speed
(km/h)
Total SPL (dBA) Peak Order
Measured
Values
Predicted Measured Predicted
Without
horn effect
With horn
effect
Without
horn effect
With
horn effect
60 89.2 78.5 84.8 68 71 71
80 94.5 84.3 92.9 58.5 62 71
ICSV24, London, 23-27 July 2017
8 ICSV24, London, 23-27 July 2017
5. Conclusion
An image scanning algorithm to predict air pumping noise has been developed. The algorithm is
simple and more efficient than its predecessor. Noise prediction has been improved further by includ-
ing the horn effect. The model developed is able to provide an overview of the effects of changing
parameters on noise produced. A more thorough verification of developed model with experimental
data remains to be done. The proposed model can also be used to optimize tread pitch sequence.
6. Acknowledgements
This work was supported by CEAT Limited, India. We thank them for their support.
REFERENCES
1. Marshall, K. D., The Pneumatic Tire, National Highway Traffic Safety Administration, U.S. Department of
Transportation, 364–407 (2006).
2. Kuijpers, A. and Van Blokland, G., Tyre/road noise models in the last two decades : a critical evaluation, Inter-
national Congress and Exhibition on Noise Control Engineering, (2001).
3. Morgan, P. A., Nelson, P. M. and Steven, H., Integrated Assessment of Noise Reduction Measures in the Road
Transport Sector, (2003).
4. Sas, P., Structural Dynamic Behaviour of Tyres, XIX Congreso Nacional de Ingeniería Mecánica, (2012).
5. Iwao, K. and Yamazaki, I., A study on the mechanism of tire/road noise, The Society of Automotive Engineers
of Japan (JSAE) Review, 17 (2), 139–144, (1996).
6. Hayden, R. E., Roadside noise from the interaction of a rolling tire with the road surface, in Proceedings of the
Purdue Noise Control Conference, pp. 62–67, (1971).
7. Winroth, J., Hoever C., Kropp, W. and Beckenbauer, T., The contribution of air-pumping to tyre/road noise,
Proceedings of AIA-DAGA, pp. 1594–1597, (2013).
8. Ejsmont, J., Tire/Road noise simulation for optimization of the tread pattern, The 29th International Congress
and Exhibition on Noise Control Engineering, August, 1–6, (2000).
9. Chiu, J.T. and Tu, F.Y., Application of a pattern recognition technique to the prediction of tire noise, Journal of
Sound and Vibration, 1–11, (2015).
10. Cho, H.Y., Lee, S.K., Hwang, S.W. and Kim B.H., Improvement of tire pattern noise estimation using adaptive
filter and sound quality application research, in The 21st International Congress on Sound and Vibration, (2014).
11. Gagen, M. J., Novel acoustic sources from squeezed cavities in car tires, Journal of Acoustical Society of Amer-
ica, 106, 794-801 (1999).
12. Kim, S., Wontae, P. Yonghwan, and L. Soogab. Prediction method for tire air-pumping noise using a hybrid
technique, Journal of Acoustical Society of America, 119, 3799–3812, (2006).
13. Tiwari Nachiketa, Saraswat Abhishek, Unnikrishnan G., Goyal Sharad and Kumar Ujjwal, A model to predict
role of different tread parameters on tire noise, 44th Inter-Noise Congress & Exposition on Noise Control Engi-
neering, (2015).
14. Anfosso-Ledee, F., Klein, P., Fadavi A. and Duhamel D., Tire/Road noise: 3D model for horn effect, The 29th
International Congress and Exhibition on Noise Control Engineering, (2000).
15. Graf, R.A.G., Kuo, C.Y., Dowling A.P. and Graham W.R., On the horn effect of a tyre/road interface, Part I:
Experiment and Computation, Journal of Sound and Vibration, 256, 417–431, (2002).