Embed Size (px)
Citation preview
Influence Propagation: Patterns, Model and a CaseStudy
Yibin Lin, Agha Ali Raza, Jay-Yoon Lee, Danai Koutra, Roni Rosenfeld, andChristos Faloutsos
School of Computer Science, Carnegie Mellon University, Pittsburgh, PA USAyibinl,araza,lee.jayyoon,danai,roni,[email protected]
Abstract. When a free, catchy application shows up, how quickly will peoplenotify their friends about it? Will the enthusiasm drop exponentially with time,or oscillate? What other patterns emerge?Here we answer these questions using data from the Polly telephone-based appli-cation, a large influence network of 72,000 people, with about 173,000 interac-tions, spanning 500MB of log data and 200 GB of audio data.We report surprising patterns, the most striking of which are: (a) the FIZZLE
pattern, i.e., excitement about Polly shows a power-law decay over time with ex-ponent of -1.2; (b) the RENDEZVOUS pattern, that obeys a power law (we explainRENDEZVOUS in the text); (c) the DISPERSION pattern, we find that the more aperson uses Polly, the fewer friends he will use it with, but in a reciprocal fashion.Finally, we also propose a generator of influence networks, which generate net-works that mimic our discovered patterns.
Keywords: social network mining, influence network, influence patterns.
1 Introduction
How will a catchy phone application propagate among people? Will the excitementabout it spike, oscillate, or decay with time?
Information cascades, like the above one, appear in numerous settings, like blogs,trending topics in social networks, memes, to name a few. Social influence has beena topic of interest in the research community [38,30,16,23,21,9,4,8,11,27] because ofthe rise of various on-line social media and social networks. In this work, by socialinfluence we refer to the fact that “individuals adopt a new action because of others”.
Our current work tries to answer all these questions in a large dataset of hundreds ofthousands of interactions. We obtained access to Polly data. Polly is a voice, telephone-based application which allows the sender to record a short message, choose among sixfunny manipulations of distorting his voice-message (faster, slower, high-pitch, etc.),and forward the modified recording to any of his friends1. Polly was devised as aplatform for disseminating and popularizing voice-based information services for low-skilled, low-literate people in the developing world. We focus in two main problems,described informally as follows:
1 For a brief video introduction to Polly, including demos of different voice effects, seehttp://www.cs.cmu.edu/ Polly/
2 Y. Lin, A. Raza, J. Lee, D. Koutra, R. Rosenfeld, C. Faloutsos
Informal Problem 1 (Pattern Discovery) Consider a real-world influence network:Given who influences whom, and when, find general influence patterns this networkobeys.
Informal Problem 2 (Generator) Create a realistic influence-network-generator:– Given a friendship social network (who-likes-whom)– Design a simple, local propagation mechanism– so that we can generate realistic-looking influence networks.
By “realistic” we mean that the resulting influence networks match our discovered pat-terns.
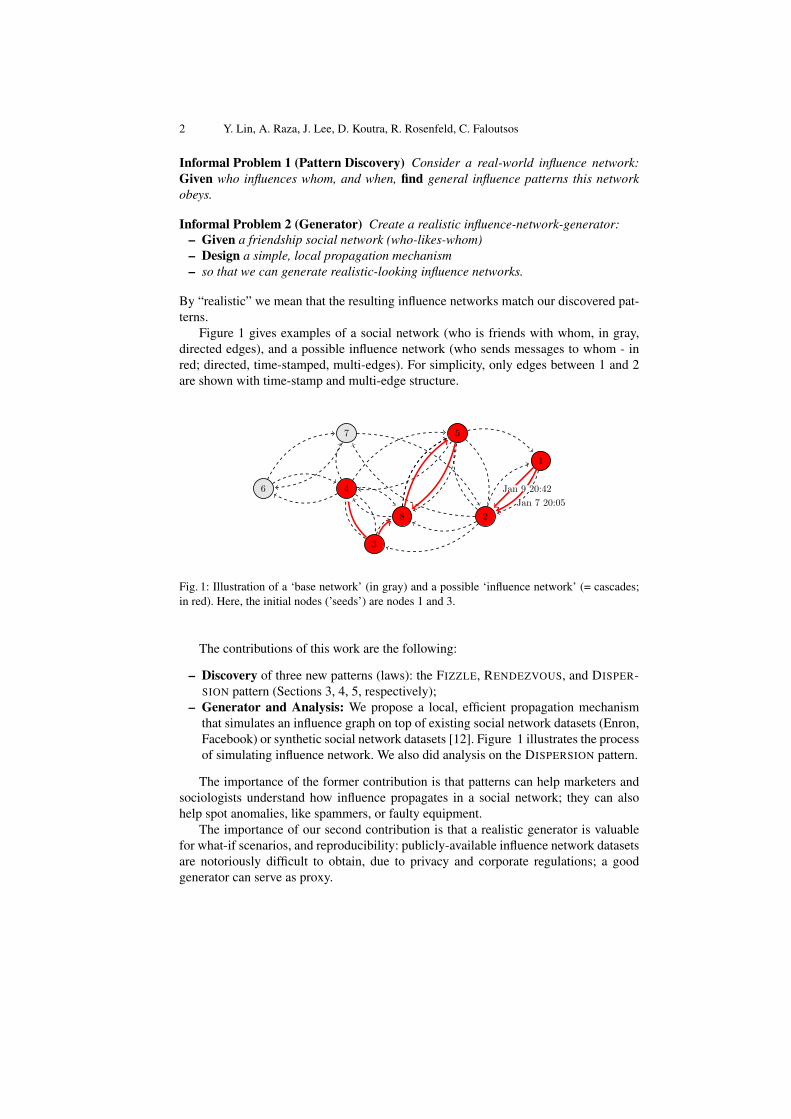
Figure 1 gives examples of a social network (who is friends with whom, in gray,directed edges), and a possible influence network (who sends messages to whom - inred; directed, time-stamped, multi-edges). For simplicity, only edges between 1 and 2are shown with time-stamp and multi-edge structure.
6 4
5
1
2
3
7
8
Jan 9 20:42
Jan 7 20:05
Fig. 1: Illustration of a ‘base network’ (in gray) and a possible ‘influence network’ (= cascades;in red). Here, the initial nodes (’seeds’) are nodes 1 and 3.
The contributions of this work are the following:
– Discovery of three new patterns (laws): the FIZZLE, RENDEZVOUS, and DISPER-SION pattern (Sections 3, 4, 5, respectively);
– Generator and Analysis: We propose a local, efficient propagation mechanismthat simulates an influence graph on top of existing social network datasets (Enron,Facebook) or synthetic social network datasets [12]. Figure 1 illustrates the processof simulating influence network. We also did analysis on the DISPERSION pattern.
The importance of the former contribution is that patterns can help marketers andsociologists understand how influence propagates in a social network; they can alsohelp spot anomalies, like spammers, or faulty equipment.
The importance of our second contribution is that a realistic generator is valuablefor what-if scenarios, and reproducibility: publicly-available influence network datasetsare notoriously difficult to obtain, due to privacy and corporate regulations; a goodgenerator can serve as proxy.
Influence Propagation: Patterns, Model and a Case Study 3
Reproducibility
For privacy reasons, the Polly dataset that we used in this paper is not public. Thus,for reproducibility, we present experiments on public data (such the Enron Email net-work [22,1], and Facebook [2]) which exhibit similar behavior like our dataset. We alsomake our code open-source at: https://github.com/yibinlin/inflood_generator/.
Next, we describe the dataset (Sec. 2), our discoveries (Sec. 3, 4 and 5), our gen-erator (Sec. 6), the related work (Sec. 7) and conclusions (Sec. 8).
2 Dataset Used
The dataset comes from Polly [34,33,32], a simple, telephone-based, voice messagemanipulation and forwarding system that allows a user to make a short recording of hisvoice, optionally modify it using a choice of funny sound effects, and have the modifiedrecording delivered to one or more friends by their phone numbers. Each friend in turncan choose to re-forward the same message to others, and/or to create a new record-ing of his own. Using entertainment as motivation, Polly has been spreading virallyamong low-literate users in South Asia, training them in the use of speech interfaces,and introducing them to other speech-based information services.
The dataset comes from the first large-scale deployment of Polly in Lahore, Pak-istan. After being seeded with only 5 users in May, 2012, Polly spread to 72,341 usersby January, 2013. There are 173,710 recorded interactions , spanning 500 MB of real-world message delivery log and 200 GB of audio data. However, this analysis focusesonly on the forwarding of user recorded messages. In what follows, we denote a userwith a node and a forwarded message with a directed and dated edge. Hence we viewour dataset as an influence network.
We have IRB2-approved access to the full, though anonymized, logs of interaction.
3 Discovered Pattern (P1): FIZZLE
Users may have been introduced to Polly by receiving a forwarded message from oneof their friends, or simply by “word of mouth”. Many such users may in turn call thesystem, experiment with it, and possibly send messages to their own friends. Most suchusers cease interacting with the system within a few days. Still, a significant number ofusers stay with the system for a long time. How does these users’ activity change overtime?
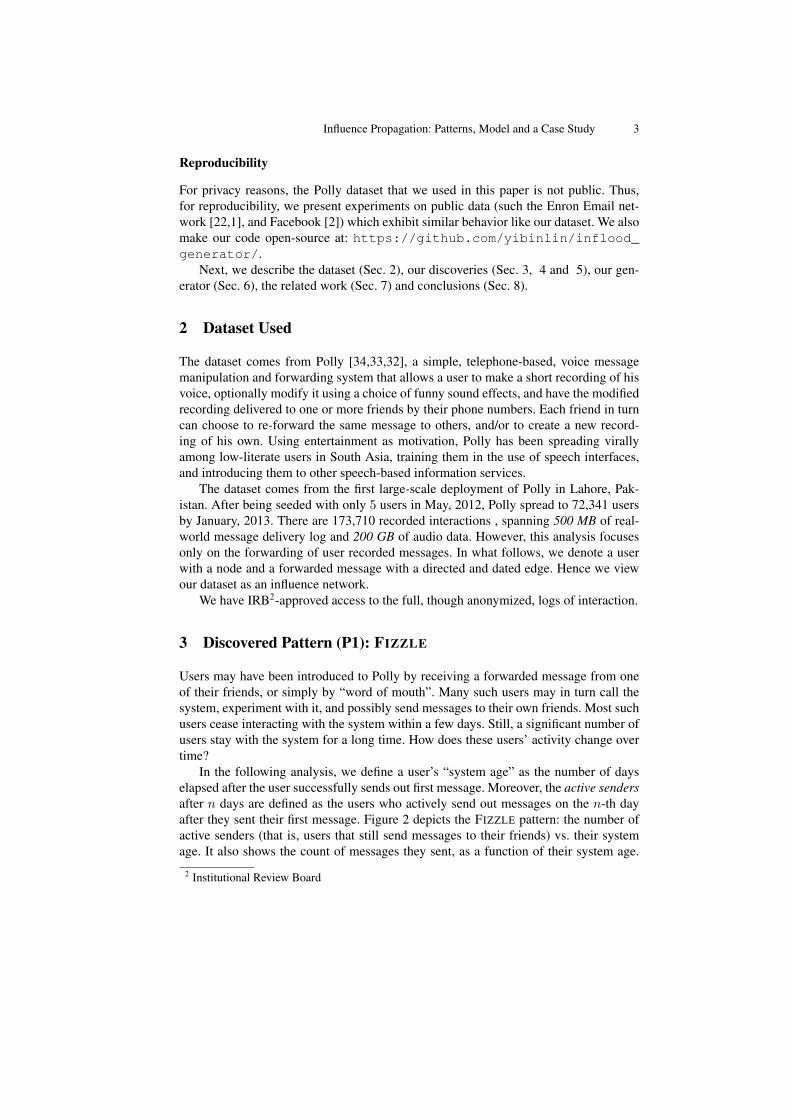
In the following analysis, we define a user’s “system age” as the number of dayselapsed after the user successfully sends out first message. Moreover, the active sendersafter n days are defined as the users who actively send out messages on the n-th dayafter they sent their first message. Figure 2 depicts the FIZZLE pattern: the number ofactive senders (that is, users that still send messages to their friends) vs. their systemage. It also shows the count of messages they sent, as a function of their system age.
2 Institutional Review Board
4 Y. Lin, A. Raza, J. Lee, D. Koutra, R. Rosenfeld, C. Faloutsos
Activity (number of messages (red), remaining users (blue)) vs system age.
Fig. 2: The FIZZLE pattern (P1) - best viewed in color: the number of messages sent (in red) andcount of active senders (in blue), versus system age. In both cases, the excitement follows a powerlaw with exponent ≈ -1.2. The horizon effect is explained in Section 3.
Both follow power-law distribution with exponents of -1.2 and -1.26, respectively. Thisobservation agrees with earlier results of the behavior of elapsed time in communicationpatterns (see [30]): there, Oliveira et al reported shows similar power-law patterns inmail and e-mail correspondences, but with slightly different exponents (1.5 and 1).
Observation 1 (P1) The number of active senders c(t) at system age t follows
c(t) ∝ tα (1)
where α ≈ −1.2. Similarly for the count of messages m(t) at system age t.
Horizon effect: In order to get accurate information about the FIZZLE pattern, newusers who are introduced to the system later than 110th day after it was launched wereexcluded. In this paper, messages delivered within the first 140 days are analyzed. Inother words, all the users shown in Figures 2 have passed “system age” of 30 (no matterwhether they are still active or not) because they were introduced to the system at least30 days before the end of our analysis scope. This is exactly the reason for the deviationfrom power-law “system ages” of 30 and above are unfairly handicapped.
The detailed power-law linear regression results for the FIZZLE pattern, as well asall our upcoming patterns, are listed in Table 1. Notice that they all have extremely highcorrelation coefficient (absolute value ≥ 0.95).
4 Discovered Pattern (P2): RENDEZVOUS
In a directed network, propagation from one source can take multiple paths to the samedestination node. Of particular interest to us are two paths that diverge for a while (with
Influence Propagation: Patterns, Model and a Case Study 5
Table 1: Summary of Power Laws Observed in Our DatasetPattern Slope Correlation
k Coefficient rP1 The FIZZLE pattern (number of remaining users) k1 −1.2 −0.994P1 The FIZZLE pattern (number of phone calls) k3 −1.26 −0.996P2 The RENDEZVOUS pattern k2 −4.88 −0.992
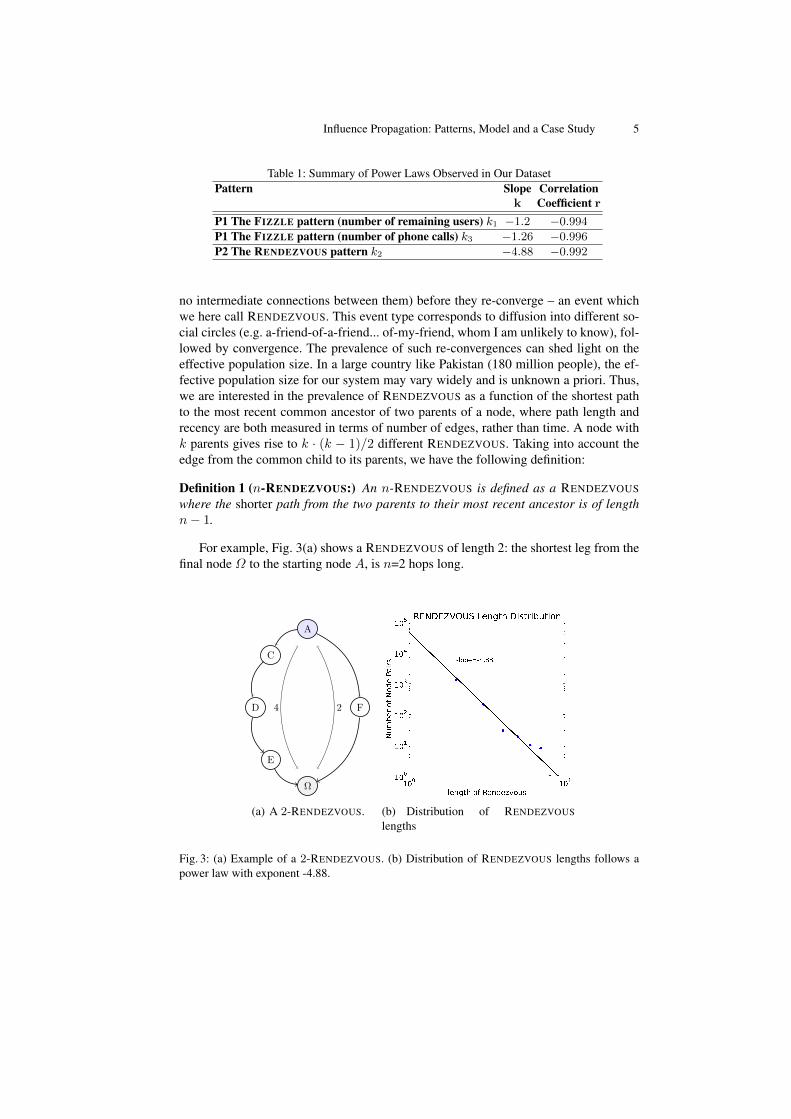
no intermediate connections between them) before they re-converge – an event whichwe here call RENDEZVOUS. This event type corresponds to diffusion into different so-cial circles (e.g. a-friend-of-a-friend... of-my-friend, whom I am unlikely to know), fol-lowed by convergence. The prevalence of such re-convergences can shed light on theeffective population size. In a large country like Pakistan (180 million people), the ef-fective population size for our system may vary widely and is unknown a priori. Thus,we are interested in the prevalence of RENDEZVOUS as a function of the shortest pathto the most recent common ancestor of two parents of a node, where path length andrecency are both measured in terms of number of edges, rather than time. A node withk parents gives rise to k · (k − 1)/2 different RENDEZVOUS. Taking into account theedge from the common child to its parents, we have the following definition:
Definition 1 (n-RENDEZVOUS:) An n-RENDEZVOUS is defined as a RENDEZVOUSwhere the shorter path from the two parents to their most recent ancestor is of lengthn− 1.
For example, Fig. 3(a) shows a RENDEZVOUS of length 2: the shortest leg from thefinal node Ω to the starting node A, is n=2 hops long.
A
C
D
E
F
Ω
24
1
(a) A 2-RENDEZVOUS. (b) Distribution of RENDEZVOUS
lengths
Fig. 3: (a) Example of a 2-RENDEZVOUS. (b) Distribution of RENDEZVOUS lengths follows apower law with exponent -4.88.
6 Y. Lin, A. Raza, J. Lee, D. Koutra, R. Rosenfeld, C. Faloutsos
Figure 3(b) shows that the length distribution of RENDEZVOUS’ in our dataset fol-lows a power-law . Most of RENDEZVOUS have a length of 1, meaning that one of theparents is the most recent common ancestor, because it has a direct link to the otherparent.
Observation 2 (P2) The number of RENDEZVOUS’ n(l) at RENDEZVOUS length lfollows
n(l) ∝ lβ (2)
where β ≈ −4.88.
5 Discovered Pattern (P3): DISPERSION
Let the “reciprocal activity” between two users be the smaller of the number of mes-sages sent between them in either direction. Let the “activity profile” of a user bem1,m2,m3, ...,mF (m1 > m2 > m3 > ... > mF > 0), where mi is the reciprocalactivity between a user and one of his recipients.
Definition 2 (DISPERSION) The DISPERSION D of a user with activity profile m1,m2,m3, ...,mF is defined as the entropy H of the normalized count distribution:
D(m1,m2, ...,mF ) = −F∑r=1
Pr ∗ ln(Pr)
Where Pr = mr/∑F
k=1mk.
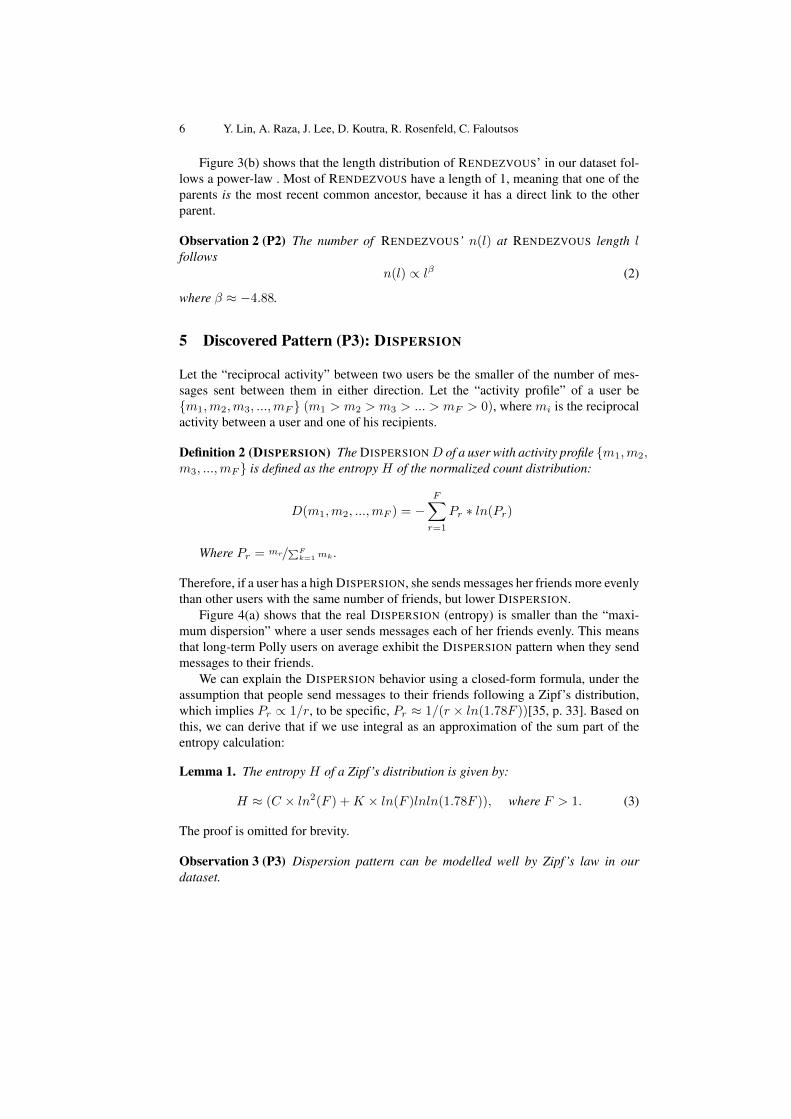
Therefore, if a user has a high DISPERSION, she sends messages her friends more evenlythan other users with the same number of friends, but lower DISPERSION.
Figure 4(a) shows that the real DISPERSION (entropy) is smaller than the “maxi-mum dispersion” where a user sends messages each of her friends evenly. This meansthat long-term Polly users on average exhibit the DISPERSION pattern when they sendmessages to their friends.
We can explain the DISPERSION behavior using a closed-form formula, under theassumption that people send messages to their friends following a Zipf’s distribution,which implies Pr ∝ 1/r, to be specific, Pr ≈ 1/(r × ln(1.78F ))[35, p. 33]. Based onthis, we can derive that if we use integral as an approximation of the sum part of theentropy calculation:
Lemma 1. The entropy H of a Zipf’s distribution is given by:
H ≈ (C × ln2(F ) +K × ln(F )lnln(1.78F )), where F > 1. (3)
The proof is omitted for brevity.
Observation 3 (P3) Dispersion pattern can be modelled well by Zipf’s law in ourdataset.
Influence Propagation: Patterns, Model and a Case Study 7
(a) DISPERSION pattern in our dataset (b) DISPERSION pattern in Experiment E1
(Enron)
Fig. 4: (a) DISPERSION pattern found in the influence network. (b) DISPERSION pattern found insimulated influence network in Experiment E1, see Section 6.
The mathematical analysis shows that the “friend contact” distribution of a user withF reciprocal friends will follow an expected entropy value proportional to the square oflogarithm of F (ln2(F )) other than (ln(F )) when we assume the distribution followsuniform distribution. The predicted entropy of Eq (3) matches reality much better thanthe uniformity assumption. As shown in Figure 4(a), the predicted entropy (the dashedblue curve) is a better match for the real data (red dots), while the uniformity assumptionleads to the black-dotted line.
6 INFLOOD GENERATOR: Algorithm and Evaluation
First, we formally define the base and influence network:
Definition 3 (Base Network) A Base Network (Vbase, Ebase) is the underlying socialnetwork of all people who are related to social information cascades. Vbase is a setof individuals. Ebase is a set of directed, weighted edges. The weights represent thestrength of connections.
Definition 4 (Influence Network) An Influence Network (Vinfl, Einfl) shows whichnode sent a system message to which node, and when. Vinfl is a set of individuals.Einfl is a set of directed, timestamped edges of which the weight shows the number oftimes a node has been notified of the influence by another node.
In our model, Vinfl ⊆ Vbase,Einfl ⊆ Ebase, i.e., individuals can only be influencedby others they know.
We model all patterns by using INFLOOD GENERATOR. As mentioned above, Pollycan be viewed as an influence network where people are notified of it from their base-network friends. After the notification, people may start forwarding messages.
8 Y. Lin, A. Raza, J. Lee, D. Koutra, R. Rosenfeld, C. Faloutsos
Why we need a generator The best way to verify all our three patterns (FIZZLE, REN-DEZVOUS and DISPERSION) is to study other influence network datasets. However,they are difficult to obtain, and some of them lack time stamp information (See Sec 1).
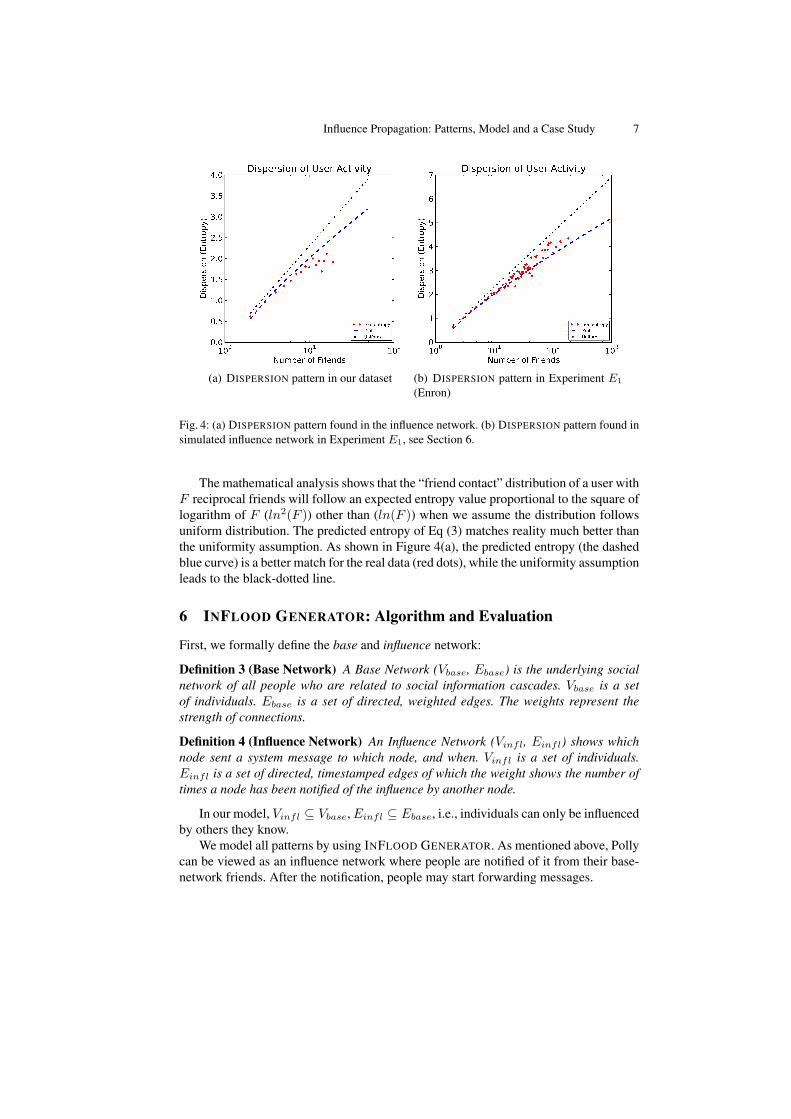
Details of INFLOOD GENERATOR The pseudo code of our influence-network gener-ator, is given in Algorithm 1. In more details, on day 0, s0 seed nodes (s0 = 5) in thesocial networkG1 (e.g., Facebook or Enron) are notified of Polly. Then, each followingday t, every person u who has been notified of Polly has a probability, Pu,t, of callingsome of her friends via Polly. The friends are sampled from the outgoing edges fromG1 independent of no matter whether they have been already notified.
Input: G1 = A base network, T = simulated days, α = power-law decay factor, Pu,0:first-day infection probability of user u, day = 0.
Output: An influence network G2 on top of G1begin
notifiedUsers←−(5 randomly chosen people in G1 with notified day tu = 0);day ←− 0;while day < T do
for each user u in notifiedUsers docoin←− TAIL;if random() < Pu,t in Equation 4 then
coin←− HEAD;while coin == HEAD do
f = a friend sampled from G1;if f is not in notifiedUsers then
add f into notifiedUsers with tu = dayelse
//User u has sent a message to user f , Record this interaction.//Details are omitted for simplicity.
if random() >= Pu,t thencoin←− TAIL;
day ←− day + 1;
Algorithm 1: Pseudo Code of INFLOOD GENERATOR
The probability of a user u telling other people about Polly is given by
Pu,t = Pu,0 × (day − tu)−1.0×α, day > tu (4)
, where α parameter affects the exponent of the power-law that governs the decayof infection activities, and Pu,0 is defined the first-day infection probability.
Estimating Pu,0 Pu,0 depends on the total weight (number of communication mes-sages) a user (node) has in base network G1. In fact, Pu,0 is set so that, in expectation,the number of edges user u makes on the first day msgu,0 is proportional to the user’stotal weight of out-going connection strength in base network G1, i.e.
Influence Propagation: Patterns, Model and a Case Study 9
msgu,0 = c×∑v∈VG1
wu,v (5)
Note that in Algorithm 1, the process of sending messages is a geometric distribu-tion. Hence we can get msgu,0 = 1/(1−Pu,0) in expectation.
Hence, we set the Pu,0 to be:
Pu,0 = 1− 1
c×∑v∈VG1
wu,v(6)
This ensures that a high weight node has more simulated edges. It is also morerealistic, because more social people may spread messages more easily. In our setting,c = 1
4 , i.e. a user will contact a quarter of her G1 out-degrees in expectation on the firstday. This formula is based on experimental observations.
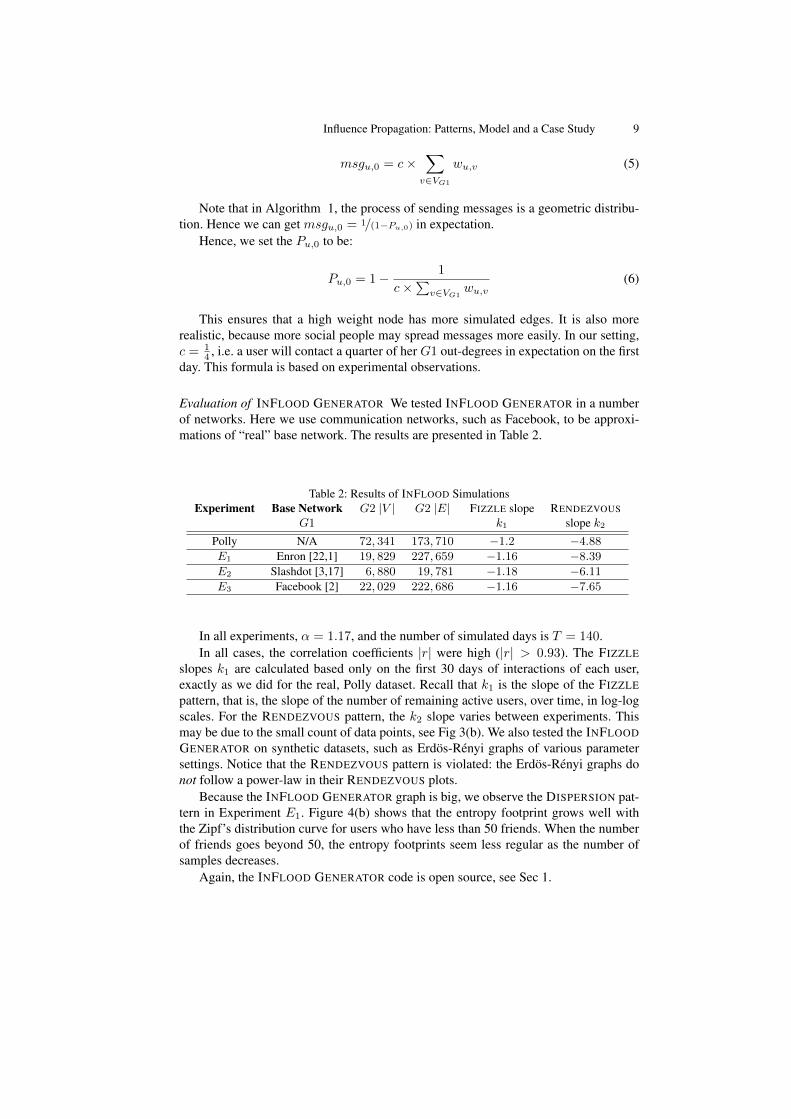
Evaluation of INFLOOD GENERATOR We tested INFLOOD GENERATOR in a numberof networks. Here we use communication networks, such as Facebook, to be approxi-mations of “real” base network. The results are presented in Table 2.
Table 2: Results of INFLOOD SimulationsExperiment Base Network G2 |V | G2 |E| FIZZLE slope RENDEZVOUS
G1 k1 slope k2Polly N/A 72, 341 173, 710 −1.2 −4.88E1 Enron [22,1] 19, 829 227, 659 −1.16 −8.39E2 Slashdot [3,17] 6, 880 19, 781 −1.18 −6.11E3 Facebook [2] 22, 029 222, 686 −1.16 −7.65
In all experiments, α = 1.17, and the number of simulated days is T = 140.In all cases, the correlation coefficients |r| were high (|r| > 0.93). The FIZZLE
slopes k1 are calculated based only on the first 30 days of interactions of each user,exactly as we did for the real, Polly dataset. Recall that k1 is the slope of the FIZZLEpattern, that is, the slope of the number of remaining active users, over time, in log-logscales. For the RENDEZVOUS pattern, the k2 slope varies between experiments. Thismay be due to the small count of data points, see Fig 3(b). We also tested the INFLOODGENERATOR on synthetic datasets, such as Erdos-Renyi graphs of various parametersettings. Notice that the RENDEZVOUS pattern is violated: the Erdos-Renyi graphs donot follow a power-law in their RENDEZVOUS plots.
Because the INFLOOD GENERATOR graph is big, we observe the DISPERSION pat-tern in Experiment E1. Figure 4(b) shows that the entropy footprint grows well withthe Zipf’s distribution curve for users who have less than 50 friends. When the numberof friends goes beyond 50, the entropy footprints seem less regular as the number ofsamples decreases.
Again, the INFLOOD GENERATOR code is open source, see Sec 1.
10 Y. Lin, A. Raza, J. Lee, D. Koutra, R. Rosenfeld, C. Faloutsos
7 Related Work
Static graph patterns. These include the legendary ’six-degrees of separation’ [29];the skewed degree distribution [13], specially for telephone graphs [5]; the power lawtails in connected components distributions; the power law PageRank distributions andbimodal radius plots [20]; the super-linearity rules [28], triangle patterns [39,19]. Thislist is by no means exhaustive; see [10] for more patterns. Algorithms for detectingthese patterns have been proposed by multiple research teams, such as [18].
Temporal and influence patterns. Work on this topic encompasses the shrinking di-ameter and densification [25]; the power law for the mail response times of Einsteinand Darwin, [30]; analysis of blog dynamics [16,26], and discovery of core-peripherypatterns in blogs and news articles [15]; viral marketing [23,21]; meme tracking [24];reciprocity analysis [14,6]; analysis of the role of weak and strong ties in informationdiffusion in mobile networks [31]; identification of important influencers [36]; predic-tion of service adoption in mobile communication networks [37]; information or cas-cade diffusion in social networks [9,4,8,38]; linguistic change in online forums, andpredicting the user’s lifespan based on her linguistic patterns [11]; peer and authoritypressure in information propagation [7].
However, none of the above works reports anything similar to our discoveries, theRENDEZVOUS and the DISPERSION patterns.
8 Conclusions
We study a large, real influence network induced by the Polly system, with over 70,000users (nodes), 170,000 interactions (edges), distilled from 500MB of log data and 200GBof audio data. Polly is a free, telephone-based, voice message application that has beendeployed and used in the real world. Our contributions are as follows:
1. Discovery of new patterns in Polly:– P1: the ‘enthusiasm’ drops as a power law with time.– P2: The RENDEZVOUS pattern shows a power-law distribution.– P3: The DISPERSION pattern of users behaves like a Zipf distribution;
2. Generator and Analysis:– We propose the INFLOOD GENERATOR algorithm, which matches the ob-
served patterns (P1, P2 and P3) in various communication networks. The codeis open-sourced at https://github.com/yibinlin/inflood_generator/.
– We give the derivation for the observed DISPERSION pattern
With respect to future work, a fascinating research direction is to estimate the un-derlying population size of our dataset, from the statistics of the RENDEZVOUS pattern.
Influence Propagation: Patterns, Model and a Case Study 11
9 Acknowledgements
The authors would like to thank Naoki Orii in CMU for suggestions and proof-reading.This material is based upon work supported by the National Science Foundation under Grant
No. IIS-1217559. Funding was also provided by the U.S. Army Research Office (ARO) and De-fense Advanced Research Projects Agency (DARPA) under Contract Numbers W911NF-11-C-0088 and W911NF-09-2-0053. The content of the information in this document does not neces-sarily reflect the position or the policy of the Government, and no official endorsement should beinferred. The U.S. Government is authorized to reproduce and distribute reprints for Governmentpurposes notwithstanding any copyright notation here on.
References
1. Berkeley enron email analysis, 2013.2. Facebook wall posts network dataset - konect, August 2013.3. Slashdot threads network dataset - konect, August 2013.4. Divyakant Agrawal, Ceren Budak, and Amr El Abbadi. Information diffusion in social net-
works: Observing and influencing societal interests. PVLDB, 4(12):1512–1513, 2011.5. William Aiello, Fan Chung, and Linyuan Lu. A random graph model for massive graphs. In
STOC, pages 171–180, New York, NY, USA, 2000. ACM.6. Leman Akoglu, Pedro O. S. Vaz de Melo, and Christos Faloutsos. Quantifying reciprocity
in large weighted communication networks. In PAKDD (2), pages 85–96, 2012.7. Aris Anagnostopoulos, George Brova, and Evimaria Terzi. Peer and authority pressure in
information-propagation models. In ECML PKDD, pages 76–91, 2011.8. Nicola Barbieri, Francesco Bonchi, and Giuseppe Manco. Cascade-based community detec-
tion. In WSDM, pages 33–42, 2013.9. Ceren Budak, Divyakant Agrawal, and Amr El Abbadi. Diffusion of information in social
networks: Is it all local? In ICDM, pages 121–130, 2012.10. Deepayan Chakrabarti and Christos Faloutsos. Graph Mining: Laws, Tools, and Case Stud-
ies. Morgan Claypool, 2012.11. Cristian Danescu-Niculescu-Mizil, Robert West, Dan Jurafsky, Jure Leskovec, and Christo-
pher Potts. No country for old members: User lifecycle and linguistic change in onlinecommunities. In WWW, New York, 2013. ACM.
12. Paul Erdos and Alfred Renyi. On the evolution of random graphs. In Publication 5, pages17–61. Institute of Mathematics, Hungarian Academy of Sciences, Hungary, 1960.
13. Michalis Faloutsos, Petros Faloutsos, and Christos Faloutsos. On power-law relationships ofthe internet topology. SIGCOMM, pages 251–262, Aug-Sept. 1999.
14. D. Garlaschelli and M. I. Loffredo. Patterns of Link Reciprocity in Directed Networks. Phys.Rev. Lett., 93:268701, 2004.
15. Manuel Gomez Rodriguez, Jure Leskovec, and Andreas Krause. Inferring networks of dif-fusion and influence. In KDD, pages 1019–1028, New York, NY, USA, 2010. ACM.
16. Daniel Gruhl, Ramanathan V. Guha, David Liben-Nowell, and Andrew Tomkins. Informa-tion diffusion through blogspace. In WWW Conference, pages 491–501, New York, NY, May2004.
17. Vicenc Gomez, Andreas Kaltenbrunner, and Vicente Lopez. Statistical analysis of the socialnetwork and discussion threads in Slashdot. In Proc. Int. World Wide Web Conf., pages645–654, 2008.
18. Daxin Jiang and Jian Pei. Mining frequent cross-graph quasi-cliques. ACM TKDD,2(4):16:1–16:42, January 2009.

12 Y. Lin, A. Raza, J. Lee, D. Koutra, R. Rosenfeld, C. Faloutsos
19. U. Kang, Brendan Meeder, and Christos Faloutsos. Spectral analysis for billion-scale graphs:Discoveries and implementation. In PAKDD (2), pages 13–25, 2011.
20. U. Kang, Charalampos E. Tsourakakis, and Christos Faloutsos. Pegasus: mining peta-scalegraphs. Knowl. Inf. Sys., 27(2):303–325, 2011.
21. David Kempe, Jon Kleinberg, and Eva Tardos. Maximizing the spread of influence througha social network. In KDD, pages 137–146, New York, NY, USA, 2003. ACM.
22. Bryan Klimt and Yiming Yang. The enron corpus: A new dataset for email classificationresearch. In Machine learning: ECML 2004, pages 217–226. Springer, 2004.
23. Jure Leskovec, Lada A. Adamic, and Bernardo A. Huberman. The dynamics of viral mar-keting. TWEB, 1(1), 2007.
24. Jure Leskovec, Lars Backstrom, and Jon M. Kleinberg. Meme-tracking and the dynamics ofthe news cycle. In KDD, pages 497–506, 2009.
25. Jure Leskovec, Jon M. Kleinberg, and Christos Faloutsos. Graphs over time: densificationlaws, shrinking diameters and possible explanations. In KDD, pages 177–187, 2005.
26. Jure Leskovec, Mary McGlohon, Christos Faloutsos, Natalie S. Glance, and Matthew Hurst.Patterns of cascading behavior in large blog graphs. In SDM, 2007.
27. Jure Leskovec, Ajit Singh, and Jon Kleinberg. Patterns of influence in a recommendationnetwork. In Advances in Knowledge Discovery and Data Mining, pages 380–389. Springer,2006.
28. Mary McGlohon, Leman Akoglu, and Christos Faloutsos. Weighted graphs and disconnectedcomponents: patterns and a generator. In KDD, pages 524–532, 2008.
29. Stanley Milgram. The small world problem. Psychology Today, 2:60–67, 1967.30. Joao G. Oliveira and Albert-Laszlo Barabasi. Human dynamics: Darwin and Einstein corre-
spondence patterns. Nature, 437(7063):1251, 2005.31. J-P Onnela, J Saramaki, J Hyvonen, G Szabo, D Lazer, K Kaski, J Kertesz, and A-L Barabasi.
Structure and tie strengths in mobile communication networks. Proc. Natl. Acad. Sci. USA,104(18):7332–6, 2007.
32. A.A. Raza, F.U. Haq, Z. Tariq, S. Razaq, U. Saif, and R. Rosenfeld. Job opportunities throughentertainment: Virally spread speech-based services for low-literate users. In SIGCHI, pages2803–2812, Paris, France, 2013. ACM.
33. A.A. Raza, F.U. Haq, Z. Tariq, U. Saif, and R. Rosenfeld. Spread and sustainability: Thegeography and economics of speech-based services. In DEV, 2013.
34. A.A. Raza, C. Milo, G. Alster, J. Sherwani, M. Pervaiz, S. Razaq, U. Saif, and R. Rosenfeld.Viral entertainment as a vehicle for disseminating speech-based services to low-literate users.In ICTD, volume 2, 2012.
35. M. Schroeder. Fractals, Chaos, Power Laws: Minutes from an Infinite Paradise. Henry Holtand Company, 1992.
36. Karthik Subbian, Dhruv Sharma, Zhen Wen, and Jaideep Srivastava. Social capital: thepower of influencers in networks. In AAMAS, pages 1243–1244, 2013.
37. G. Szabo and A. . Barabasi. Network effects in service usage. ArXiv Physics e-prints,November 2006.
38. Jie Tang, Jimeng Sun, Chi Wang, and Zi Yang. Social influence analysis in large-scalenetworks. In KDD, pages 807–816. ACM, 2009.
39. Charalampos E. Tsourakakis. Fast counting of triangles in large real networks without count-ing: Algorithms and laws. In ICDM, 2008.