Embed Size (px)
Citation preview
InfographicVQA
Minesh Mathew1 Viraj Bagal2* Ruben Tito3
Dimosthenis Karatzas3 Ernest Valveny3 C.V. Jawahar11CVIT, IIIT Hyderabad, India 1IISER Pune, India 3CVC, Universitat Autonoma de Barcelona, Spain
[email protected], [email protected], [email protected]
Abstract
Infographics communicate information using a combi-nation of textual, graphical and visual elements. In thiswork, we explore automatic understanding of infographicimages by using a Visual Question Answering technique.To this end, we present InfographicVQA, a new datasetthat comprises a diverse collection of infographics alongwith question-answer annotations. The questions requiremethods to jointly reason over the document layout, tex-tual content, graphical elements, and data visualizations.We curate the dataset with emphasis on questions that re-quire elementary reasoning and basic arithmetic skills. ForVQA on the dataset, we evaluate two strong baselines basedon state-of-the-art Transformer-based, scene text VQA anddocument understanding models. Poor performance of boththe approaches compared to near perfect human perfor-mance suggests that VQA on infographics that are designedto communicate information quickly and clearly to humanbrain, is ideal for benchmarking machine understanding ofcomplex document images. The dataset, code and leader-board will be made available at docvqa.org
1. IntroductionInfographics are documents created to convey informa-
tion in a compact manner using a combination of textualand visual cues. The presence of the text, numbers and sym-bols, along with the semantics that arise from their relativeplacements, make infographics understanding a challengingproblem. True document image understanding in this do-main requires methods to jointly reason over the documentlayout, textual content, graphical elements, data visualisa-tions, color schemes and visual art among others. Motivatedby the multimodal nature of infographics, and the humancentred design, we propose a Visual Question Answering(VQA) approach to infographics understanding.
VQA received significant attention over the past fewyears [17, 5, 18, 22, 27, 3]. Several new VQA branches
*Work done during an internship at IIIT Hyderabad.
How many companies have more than 10K delivery workers?Answer: 2 Evidence: FigureAnswer-source: Non-extractive Operation: Counting Sorting
Who has better coverage in Toronto - Canada post or Amazon?Answer: canada post Evidence: TextAnswer-source: Question-span Image-span Operation: none
In which cities did Canada Post get maximum media coverage?Answer: vancouver, montreal Evidence: Text MapAnswer-source: Multi-span Operation: none
Figure 1: Example image from InfographicVQA along with ques-tions and answers. For each question, source of the answer, typeof evidence the answer is grounded on, and the discrete operationrequired to find the answer are shown.
focus on images with text, such as answering questionsby looking at text books [28], business documents [36],charts [25, 26, 11] and screenshots of web pages [47]. Still,infographics are unique in their combined use, and purpose-ful arrangement of visual and textual elements.
In this work, we introduce a new dataset for VQA on in-fographics, InfographicVQA, comprising 30, 035 questionsover 5, 485 images. An example from our dataset is shownin Figure 1. Questions in the dataset include questionsgrounded on tables, figures and visualizations as well asquestions that require combining multiple cues. Since mostinfographics contain numerical data, we collect questions
1
arX
iv:2
104.
1275
6v2
[cs
.CV
] 2
2 A
ug 2
021
Dataset Images Synthetic Template Text type # Images # Questions Answer typeImages questions
TQA [28] Science diagrams 7 7 MR 1K 26K MCQRecipeQA [54] Culinary pictures 7 3 MR 251K 37K MCQST-VQA [7] Natural images 7 7 ST 23K 31K ExTextVQA [45] Natural images 7 7 ST 28K 45K Ex, SAbOCR-VQA [37] Book covers 7 3 BD 207K 1M Ex, Y/NDVQA [25] Bar charts 3 3 BD 300K 3.4M Ex, Nm, Y/NFigureQA [26] Charts - 5 types 3 3 BD 120K 1.5M Y/NLEAF-QA [11] Charts - 4 types 3 3 BD 250K 2M Ex, Nm, Y/NVisualMRC [47] Webpage screenshots 7 7 BD 10K 30K AbDocVQA [36] Industry documents 7 7 Pr, Tw, Hw, BD 12K 50K ExInfographicVQA Infographics 7 7 BD 5.4K 30K Ex, Nm
Table 1: Summary of VQA and Multimodal QA datasets where text on the images need to be read to answer questions. Text typeabbreviations are: Machine Readable: MR, Scene Text: ST,Born Digital: BD, Printed: Pr, Handwritten: Hw, and Typewritten: Tw. Answertype abbreviations are: Multiple Choice Question: MCQ, Extractive: Ex, Short abstractive: SAb, Abstractive: Ab, Yes/No: Y/N, andNumerical (answer is numerical and not extracted from image or question; but derived): Nm.
that require elementary reasoning skills such as counting,sorting and arithmetic operations. We believe our dataset isideal for benchmarking progress of algorithms at the meet-ing point of vision, language and document understanding.
We adapt a multimodal Transformer [48]-based VQAmodel called M4C [21] and a layout-aware, BERT [14]-style extractive QA model called LayoutLM [52] for VQAon InfographicVQA. Results using these two strong base-lines show that current state-of-the-art (SoTA) models forsimilar tasks perform poorly on the new dataset. The resultsalso highlight the need to devise better feature extractors forinfographics, different from bottom-up features [4] that aretypically used for VQA on natural scene images.
2. Related worksQuestion answering in a multimodal context. TextbookQuestion Answering (TQA) [28] and RecipeQA [54] aretwo works addressing Question Answering (QA) in a multi-modal context. For TQA, contexts are textbook lessons andfor RecipeQA, contexts are recipes containing text and im-ages. Contrary to InfographicVQA and other datasets men-tioned below, text in these two datasets are not embeddedon the images, but provided in machine readable form, as aseparate input.
ST-VQA [7] and TextVQA [45] datasets extend VQAover natural images to a new direction where understandingscene text on the images is necessary to answer the ques-tions. While these datasets comprise images captured in thewild with sparse text content, InfographicVQA has born-digital images with an order of magnitude more text tokensper image, richer in layout and in the interplay betweentextual and visual elements. OCR-VQA [37] introduces atask similar to ST-VQA and TextVQA, but solely on im-ages of book covers. Template questions are generated frombook metadata such as author name, title and other infor-mation. Consequently, questions in this dataset rely less on
visual information present in the images. DVQA [25], Fig-ureQA [26], and LEAF-QA [11] datasets deal with VQAon charts. All the three datasets have chart images renderedusing chart plotting libraries and template questions.
DocVQA [36] is a VQA dataset that comprises doc-ument images of industry/business documents, and ques-tions that require understanding document elements suchas text passages, forms, and tables. Similar to ST-VQA,DocVQA is an extractive VQA task where answers can al-ways be extracted verbatim from the text on the images. Vi-sualMRC [47] on the other hand is an abstractive VQA (an-swers cannot be directly extracted from text in the images orquestions) benchmark where images are screenshots of webpages. Compared to VisualMRC, InfographicVQA is anextractive VQA task (answers are extracted as ‘span’(s) ofthe question or text present in the given image), except forquestions that require certain discrete operations resultingin numerical non-extractive answers. (see subsection 3.2).In Table 1 we present a high level summary of the QA/VQAdatasets related to ours.
Multimodal transformer for Vision-Language tasks.Following the success of BERT [14]-like models for NaturalLanguage Processing (NLP) tasks, there have been multipleworks extending it to the Vision-Language space. Modelslike VL-BERT [46], VisualBERT [31], and UNITER [12]show that combined pretraining of BERT-like architectureson vision and language inputs achieve SoTA performanceson various downstream tasks including VQA on naturalimages. For VQA on images with scene text, M4C andTAP [55] use a multimodal transformer block to fuse em-beddings of question, scene text tokens, and objects de-tected from an image.
The success of transformer-based models for text under-standing inspired the use of similar models for documentiamge understanding. LayoutLM and LAMBERT [16] in-corporate layout information to the BERT architecture by
2
Num
ber o
f Que
stio
ns
0
500
1000
1500
2000
Image-span Question-span Multi-span Non-extractive
(a) Answer-sources and their counts
Num
ber o
f Que
stio
ns
0
500
1000
1500
2000
Text Table/List Figure Map Visual/Layout
(b) Evidence types and their counts
Num
ber o
f Que
stio
ns
0
100
200
300
400
Counting Sorting Arithmetic
(c) Operation types and their counts
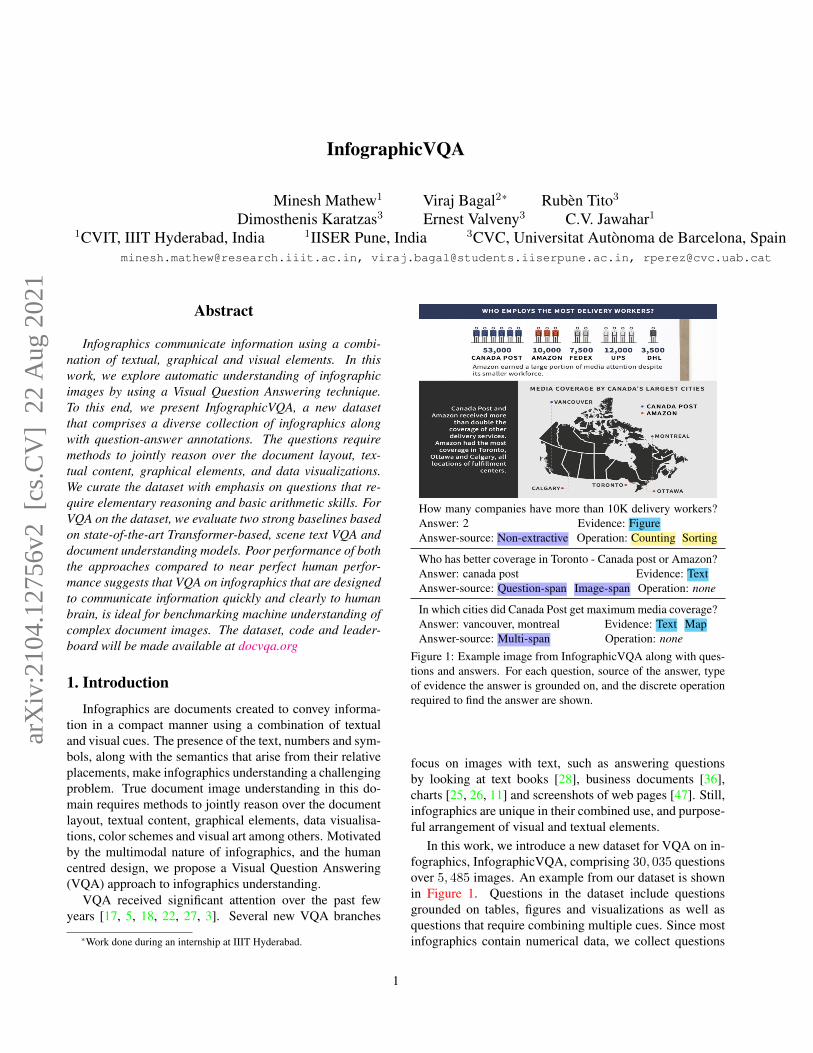
Figure 2: Count of questions in validation set by their Answer-source, (2a), Evidence required to answer (2b) and the discrete Operationperformed to find the answer (2c).
using embeddings of the 2D positions of the text tokens inthe image. One of the strong baselines we use in this workis based on the LayoutLM model. Concurrent to this work,there have been multiple works published on arXiv that dealwith joint understanding of text, image and layout in docu-ment images. Models such as LayoutLMv2 [53], TILT [39],DocFormer [6] and StrucText [32] build on transformer-based architectures and leverage large-scale pretraining onunlabelled data, using pretraining objectives specifically de-signed for document understanding.
Infographics understanding. Bylinskii et al. [10] andMadan et al. [35] looked at generating textual and visualtags from infographics. In another work, Landman uses anexisting text summarization model to generate captions forinfographics [30]. This model uses only text recognizedfrom infographics to generate the captions and layout/visualinformation is not considered. These three works use Vi-sually29K dataset comprising images from a single web-site. MASSVIS [9] is a collection of infographics createdto study infographics from a cognitive perspective. As ob-served by Lu et al. [33], MASSVIS is a specialized col-lection focusing on illustration of scientific procedures andstatistical charts, therefore not representative of general in-fographics.
To summarize, existing datasets containing infograph-ics are either specialized collections or infographics col-lected from a single source. In contrast, the Infograph-icVQA dataset comprises infographics drawn from thou-sands of different sources, with diverse layouts and designs,and without any topic specialization.
3. InfographicVQA
A brief description of the data collection and detailedanalysis of the data is presented here. For more details ondata collection, annotation process and annotation tool, re-fer to Section A in the supplementary material.
3.1. Collecting images and question-answer pairs
Infographics in the dataset were downloaded from the In-ternet for the search query “infographics” . The downloaded
images are cleaned for removal of duplicates before addingthem to the annotation tool. Unlike crowd sourced annota-tion, InfographicVQA was annotated by a small number ofannotators using an internal annotation tool. The annotationprocess involved two stages. In the first stage, workers wererequired to add question-answer pairs on an image shown.Similarly to SQuAD dataset [40] annotation, in order tomake the evaluation more robust, we collect an additionalanswer for each question in the validation and test split bysending those questions through a second stage of annota-tion. In this stage an image along with questions asked onit in the first stage are shown to a worker. Workers wereinstructed to enter answers for the questions shown or flaga question if it is unanswerable.
3.2. Question-answer types: answer-source, evi-dence and operation
In the second stage of annotation, in addition to answer-ing questions collected in the first stage, we instructed theworkers to add question-answer types (QA types). QAtypes are a set of category labels assigned to each question-answer pair. DocVQA and VisualMRC have QA types thatindicate the kind of document object (table, form, title etc.)a question is based on. DROP [15] dataset for reading com-prehension define answer types such as Question span andPassage span and categorize questions by the kind of dis-crete operations ( count, add etc.) required to find the an-swer. In InfographicVQA we collect QA types under threecategories — Answer-source, Evidence and Operation.
There are four types of Answer-source — Image-span,Question-span, Multi-span and Non-extractive. Akin to thedefinition of ‘span’ in SQuAD [40] and DocVQA, an an-swer is considered Image-span if it corresponds to a singlespan (a sequence of text tokens) of text, extracted verba-tim, in the reading order, from text present in the image.Similarly when the answer is a span from the question itis labelled as Question-span. In Figure 1 the answer to thesecond question is both an Image-span and a Question-spansince ‘canada post’ appears as a single sequence of con-tiguous tokens (or a ‘span’) both in the question and in the
3
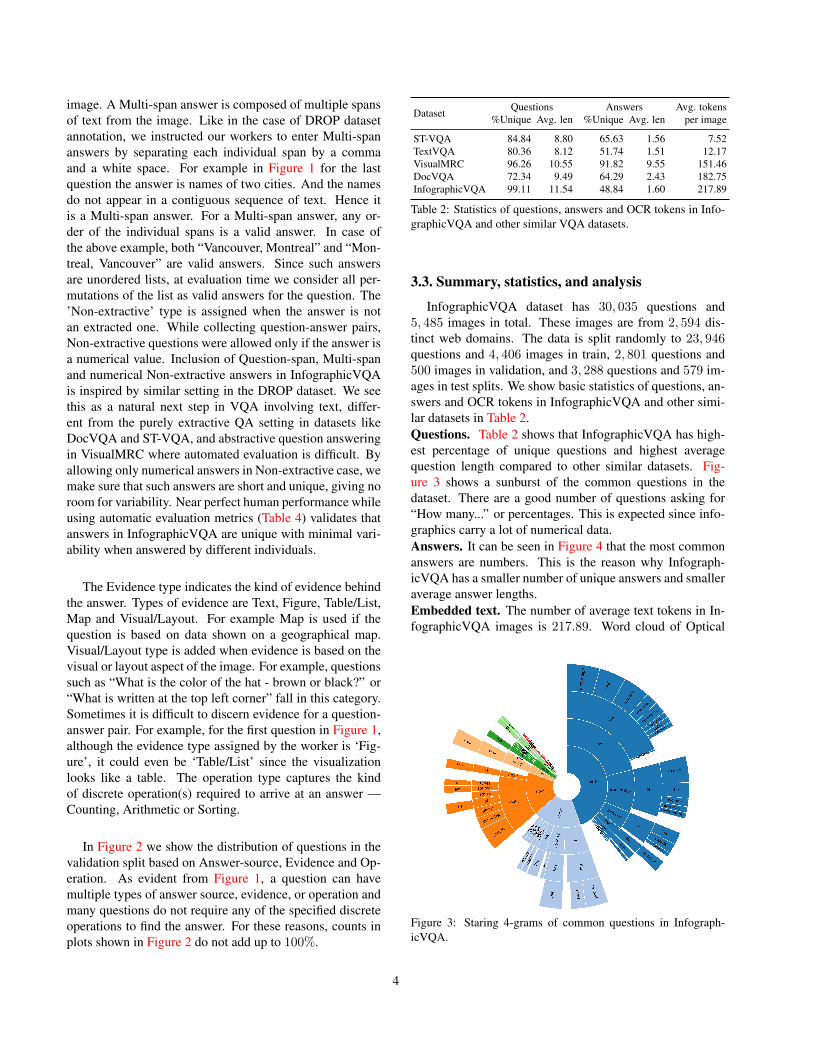
image. A Multi-span answer is composed of multiple spansof text from the image. Like in the case of DROP datasetannotation, we instructed our workers to enter Multi-spananswers by separating each individual span by a commaand a white space. For example in Figure 1 for the lastquestion the answer is names of two cities. And the namesdo not appear in a contiguous sequence of text. Hence itis a Multi-span answer. For a Multi-span answer, any or-der of the individual spans is a valid answer. In case ofthe above example, both “Vancouver, Montreal” and “Mon-treal, Vancouver” are valid answers. Since such answersare unordered lists, at evaluation time we consider all per-mutations of the list as valid answers for the question. The’Non-extractive’ type is assigned when the answer is notan extracted one. While collecting question-answer pairs,Non-extractive questions were allowed only if the answer isa numerical value. Inclusion of Question-span, Multi-spanand numerical Non-extractive answers in InfographicVQAis inspired by similar setting in the DROP dataset. We seethis as a natural next step in VQA involving text, differ-ent from the purely extractive QA setting in datasets likeDocVQA and ST-VQA, and abstractive question answeringin VisualMRC where automated evaluation is difficult. Byallowing only numerical answers in Non-extractive case, wemake sure that such answers are short and unique, giving noroom for variability. Near perfect human performance whileusing automatic evaluation metrics (Table 4) validates thatanswers in InfographicVQA are unique with minimal vari-ability when answered by different individuals.
The Evidence type indicates the kind of evidence behindthe answer. Types of evidence are Text, Figure, Table/List,Map and Visual/Layout. For example Map is used if thequestion is based on data shown on a geographical map.Visual/Layout type is added when evidence is based on thevisual or layout aspect of the image. For example, questionssuch as “What is the color of the hat - brown or black?” or“What is written at the top left corner” fall in this category.Sometimes it is difficult to discern evidence for a question-answer pair. For example, for the first question in Figure 1,although the evidence type assigned by the worker is ‘Fig-ure’, it could even be ‘Table/List’ since the visualizationlooks like a table. The operation type captures the kindof discrete operation(s) required to arrive at an answer —Counting, Arithmetic or Sorting.
In Figure 2 we show the distribution of questions in thevalidation split based on Answer-source, Evidence and Op-eration. As evident from Figure 1, a question can havemultiple types of answer source, evidence, or operation andmany questions do not require any of the specified discreteoperations to find the answer. For these reasons, counts inplots shown in Figure 2 do not add up to 100%.
Dataset Questions Answers Avg. tokens%Unique Avg. len %Unique Avg. len per image
ST-VQA 84.84 8.80 65.63 1.56 7.52TextVQA 80.36 8.12 51.74 1.51 12.17VisualMRC 96.26 10.55 91.82 9.55 151.46DocVQA 72.34 9.49 64.29 2.43 182.75InfographicVQA 99.11 11.54 48.84 1.60 217.89
Table 2: Statistics of questions, answers and OCR tokens in Info-graphicVQA and other similar VQA datasets.
3.3. Summary, statistics, and analysis
InfographicVQA dataset has 30, 035 questions and5, 485 images in total. These images are from 2, 594 dis-tinct web domains. The data is split randomly to 23, 946questions and 4, 406 images in train, 2, 801 questions and500 images in validation, and 3, 288 questions and 579 im-ages in test splits. We show basic statistics of questions, an-swers and OCR tokens in InfographicVQA and other simi-lar datasets in Table 2.Questions. Table 2 shows that InfographicVQA has high-est percentage of unique questions and highest averagequestion length compared to other similar datasets. Fig-ure 3 shows a sunburst of the common questions in thedataset. There are a good number of questions asking for“How many...” or percentages. This is expected since info-graphics carry a lot of numerical data.Answers. It can be seen in Figure 4 that the most commonanswers are numbers. This is the reason why Infograph-icVQA has a smaller number of unique answers and smalleraverage answer lengths.Embedded text. The number of average text tokens in In-fographicVQA images is 217.89. Word cloud of Optical
Figure 3: Staring 4-grams of common questions in Infograph-icVQA.
4
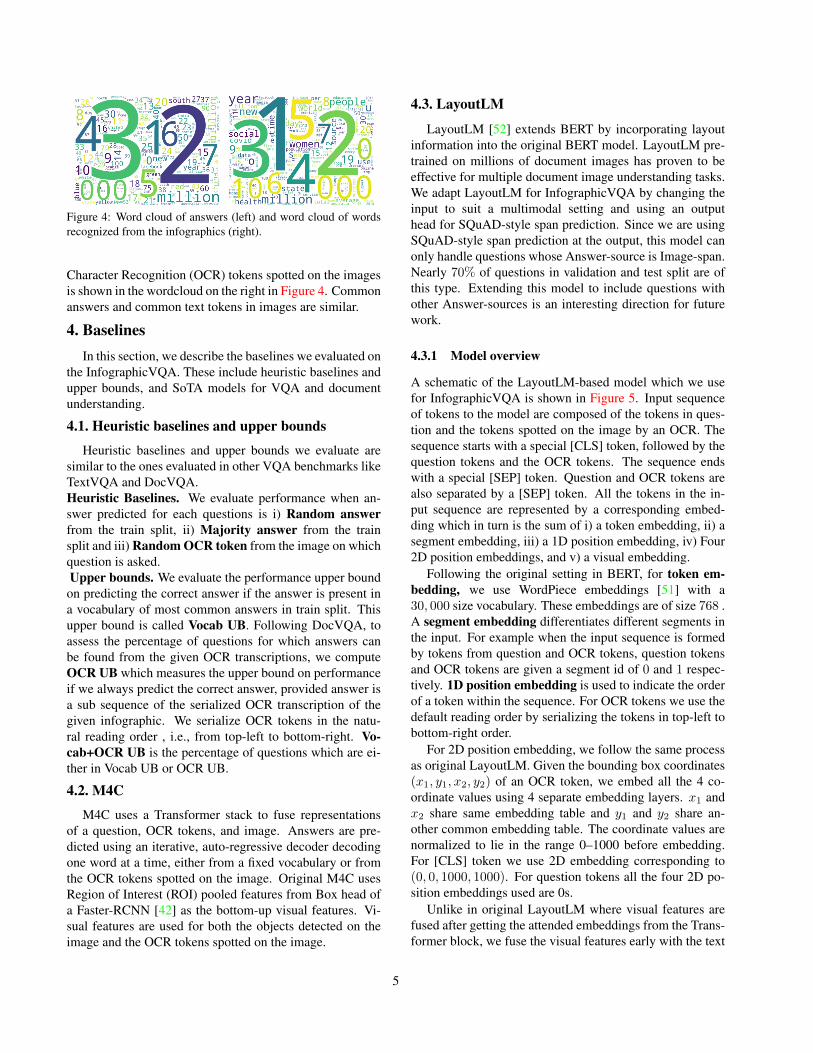
Figure 4: Word cloud of answers (left) and word cloud of wordsrecognized from the infographics (right).
Character Recognition (OCR) tokens spotted on the imagesis shown in the wordcloud on the right in Figure 4. Commonanswers and common text tokens in images are similar.
4. BaselinesIn this section, we describe the baselines we evaluated on
the InfographicVQA. These include heuristic baselines andupper bounds, and SoTA models for VQA and documentunderstanding.
4.1. Heuristic baselines and upper bounds
Heuristic baselines and upper bounds we evaluate aresimilar to the ones evaluated in other VQA benchmarks likeTextVQA and DocVQA.Heuristic Baselines. We evaluate performance when an-swer predicted for each questions is i) Random answerfrom the train split, ii) Majority answer from the trainsplit and iii) Random OCR token from the image on whichquestion is asked.Upper bounds. We evaluate the performance upper boundon predicting the correct answer if the answer is present ina vocabulary of most common answers in train split. Thisupper bound is called Vocab UB. Following DocVQA, toassess the percentage of questions for which answers canbe found from the given OCR transcriptions, we computeOCR UB which measures the upper bound on performanceif we always predict the correct answer, provided answer isa sub sequence of the serialized OCR transcription of thegiven infographic. We serialize OCR tokens in the natu-ral reading order , i.e., from top-left to bottom-right. Vo-cab+OCR UB is the percentage of questions which are ei-ther in Vocab UB or OCR UB.
4.2. M4C
M4C uses a Transformer stack to fuse representationsof a question, OCR tokens, and image. Answers are pre-dicted using an iterative, auto-regressive decoder decodingone word at a time, either from a fixed vocabulary or fromthe OCR tokens spotted on the image. Original M4C usesRegion of Interest (ROI) pooled features from Box head ofa Faster-RCNN [42] as the bottom-up visual features. Vi-sual features are used for both the objects detected on theimage and the OCR tokens spotted on the image.
4.3. LayoutLM
LayoutLM [52] extends BERT by incorporating layoutinformation into the original BERT model. LayoutLM pre-trained on millions of document images has proven to beeffective for multiple document image understanding tasks.We adapt LayoutLM for InfographicVQA by changing theinput to suit a multimodal setting and using an outputhead for SQuAD-style span prediction. Since we are usingSQuAD-style span prediction at the output, this model canonly handle questions whose Answer-source is Image-span.Nearly 70% of questions in validation and test split are ofthis type. Extending this model to include questions withother Answer-sources is an interesting direction for futurework.
4.3.1 Model overview
A schematic of the LayoutLM-based model which we usefor InfographicVQA is shown in Figure 5. Input sequenceof tokens to the model are composed of the tokens in ques-tion and the tokens spotted on the image by an OCR. Thesequence starts with a special [CLS] token, followed by thequestion tokens and the OCR tokens. The sequence endswith a special [SEP] token. Question and OCR tokens arealso separated by a [SEP] token. All the tokens in the in-put sequence are represented by a corresponding embed-ding which in turn is the sum of i) a token embedding, ii) asegment embedding, iii) a 1D position embedding, iv) Four2D position embeddings, and v) a visual embedding.
Following the original setting in BERT, for token em-bedding, we use WordPiece embeddings [51] with a30, 000 size vocabulary. These embeddings are of size 768 .A segment embedding differentiates different segments inthe input. For example when the input sequence is formedby tokens from question and OCR tokens, question tokensand OCR tokens are given a segment id of 0 and 1 respec-tively. 1D position embedding is used to indicate the orderof a token within the sequence. For OCR tokens we use thedefault reading order by serializing the tokens in top-left tobottom-right order.
For 2D position embedding, we follow the same processas original LayoutLM. Given the bounding box coordinates(x1, y1, x2, y2) of an OCR token, we embed all the 4 co-ordinate values using 4 separate embedding layers. x1 andx2 share same embedding table and y1 and y2 share an-other common embedding table. The coordinate values arenormalized to lie in the range 0–1000 before embedding.For [CLS] token we use 2D embedding corresponding to(0, 0, 1000, 1000). For question tokens all the four 2D po-sition embeddings used are 0s.
Unlike in original LayoutLM where visual features arefused after getting the attended embeddings from the Trans-former block, we fuse the visual features early with the text
5
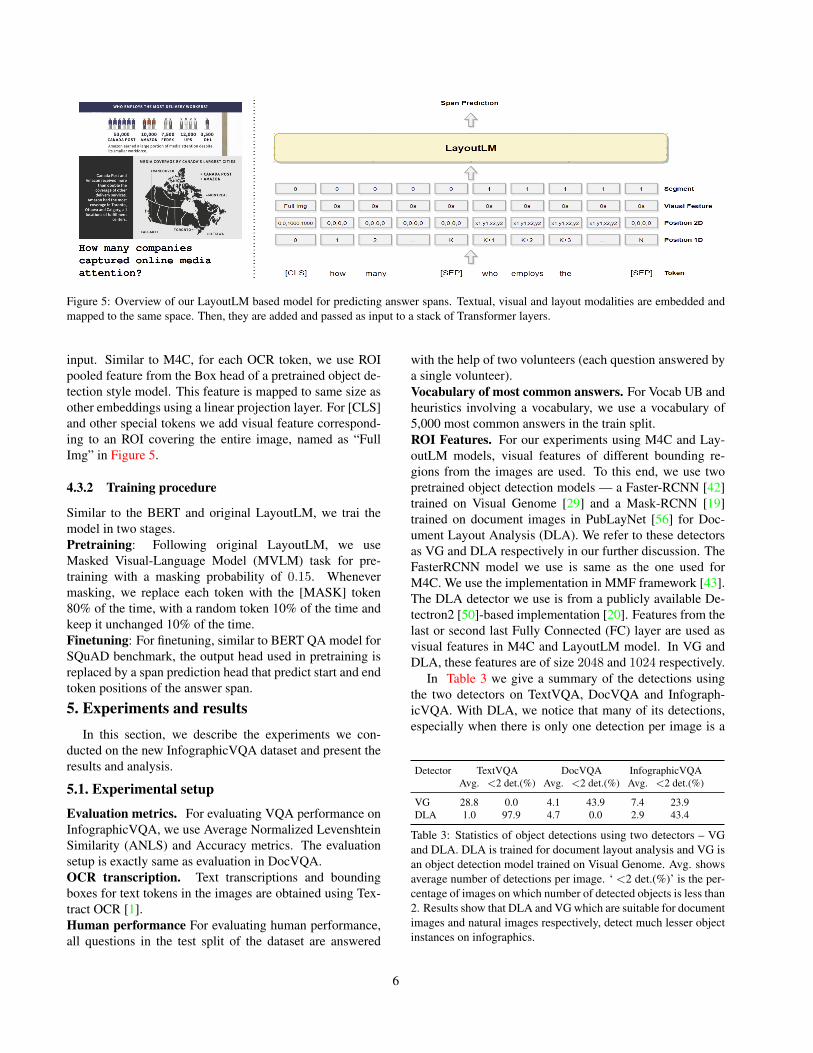
Figure 5: Overview of our LayoutLM based model for predicting answer spans. Textual, visual and layout modalities are embedded andmapped to the same space. Then, they are added and passed as input to a stack of Transformer layers.
input. Similar to M4C, for each OCR token, we use ROIpooled feature from the Box head of a pretrained object de-tection style model. This feature is mapped to same size asother embeddings using a linear projection layer. For [CLS]and other special tokens we add visual feature correspond-ing to an ROI covering the entire image, named as “FullImg” in Figure 5.
4.3.2 Training procedure
Similar to the BERT and original LayoutLM, we trai themodel in two stages.Pretraining: Following original LayoutLM, we useMasked Visual-Language Model (MVLM) task for pre-training with a masking probability of 0.15. Whenevermasking, we replace each token with the [MASK] token80% of the time, with a random token 10% of the time andkeep it unchanged 10% of the time.Finetuning: For finetuning, similar to BERT QA model forSQuAD benchmark, the output head used in pretraining isreplaced by a span prediction head that predict start and endtoken positions of the answer span.
5. Experiments and resultsIn this section, we describe the experiments we con-
ducted on the new InfographicVQA dataset and present theresults and analysis.
5.1. Experimental setup
Evaluation metrics. For evaluating VQA performance onInfographicVQA, we use Average Normalized LevenshteinSimilarity (ANLS) and Accuracy metrics. The evaluationsetup is exactly same as evaluation in DocVQA.OCR transcription. Text transcriptions and boundingboxes for text tokens in the images are obtained using Tex-tract OCR [1].Human performance For evaluating human performance,all questions in the test split of the dataset are answered
with the help of two volunteers (each question answered bya single volunteer).Vocabulary of most common answers. For Vocab UB andheuristics involving a vocabulary, we use a vocabulary of5,000 most common answers in the train split.ROI Features. For our experiments using M4C and Lay-outLM models, visual features of different bounding re-gions from the images are used. To this end, we use twopretrained object detection models — a Faster-RCNN [42]trained on Visual Genome [29] and a Mask-RCNN [19]trained on document images in PubLayNet [56] for Doc-ument Layout Analysis (DLA). We refer to these detectorsas VG and DLA respectively in our further discussion. TheFasterRCNN model we use is same as the one used forM4C. We use the implementation in MMF framework [43].The DLA detector we use is from a publicly available De-tectron2 [50]-based implementation [20]. Features from thelast or second last Fully Connected (FC) layer are used asvisual features in M4C and LayoutLM model. In VG andDLA, these features are of size 2048 and 1024 respectively.
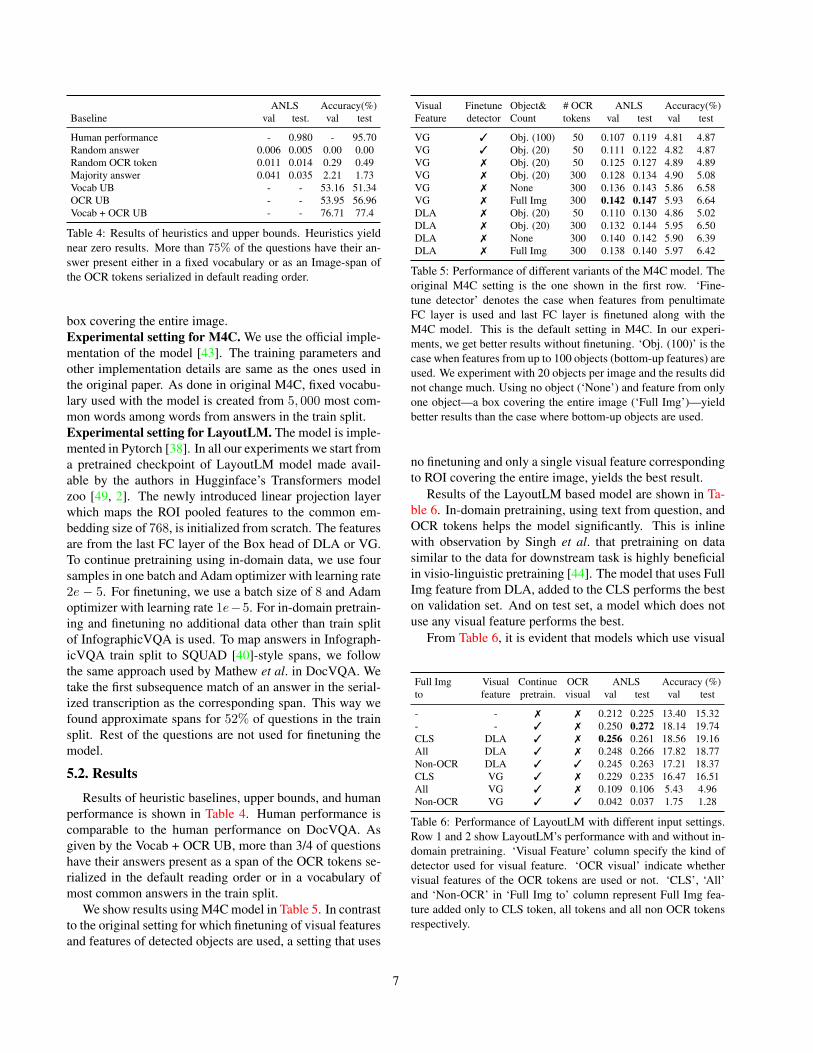
In Table 3 we give a summary of the detections usingthe two detectors on TextVQA, DocVQA and Infograph-icVQA. With DLA, we notice that many of its detections,especially when there is only one detection per image is a
Detector TextVQA DocVQA InfographicVQAAvg. <2 det.(%) Avg. <2 det.(%) Avg. <2 det.(%)
VG 28.8 0.0 4.1 43.9 7.4 23.9DLA 1.0 97.9 4.7 0.0 2.9 43.4
Table 3: Statistics of object detections using two detectors – VGand DLA. DLA is trained for document layout analysis and VG isan object detection model trained on Visual Genome. Avg. showsaverage number of detections per image. ‘ <2 det.(%)’ is the per-centage of images on which number of detected objects is less than2. Results show that DLA and VG which are suitable for documentimages and natural images respectively, detect much lesser objectinstances on infographics.
6
ANLS Accuracy(%)Baseline val test. val test
Human performance - 0.980 - 95.70Random answer 0.006 0.005 0.00 0.00Random OCR token 0.011 0.014 0.29 0.49Majority answer 0.041 0.035 2.21 1.73Vocab UB - - 53.16 51.34OCR UB - - 53.95 56.96Vocab + OCR UB - - 76.71 77.4
Table 4: Results of heuristics and upper bounds. Heuristics yieldnear zero results. More than 75% of the questions have their an-swer present either in a fixed vocabulary or as an Image-span ofthe OCR tokens serialized in default reading order.
box covering the entire image.Experimental setting for M4C. We use the official imple-mentation of the model [43]. The training parameters andother implementation details are same as the ones used inthe original paper. As done in original M4C, fixed vocabu-lary used with the model is created from 5, 000 most com-mon words among words from answers in the train split.Experimental setting for LayoutLM. The model is imple-mented in Pytorch [38]. In all our experiments we start froma pretrained checkpoint of LayoutLM model made avail-able by the authors in Hugginface’s Transformers modelzoo [49, 2]. The newly introduced linear projection layerwhich maps the ROI pooled features to the common em-bedding size of 768, is initialized from scratch. The featuresare from the last FC layer of the Box head of DLA or VG.To continue pretraining using in-domain data, we use foursamples in one batch and Adam optimizer with learning rate2e − 5. For finetuning, we use a batch size of 8 and Adamoptimizer with learning rate 1e−5. For in-domain pretrain-ing and finetuning no additional data other than train splitof InfographicVQA is used. To map answers in Infograph-icVQA train split to SQUAD [40]-style spans, we followthe same approach used by Mathew et al. in DocVQA. Wetake the first subsequence match of an answer in the serial-ized transcription as the corresponding span. This way wefound approximate spans for 52% of questions in the trainsplit. Rest of the questions are not used for finetuning themodel.
5.2. Results
Results of heuristic baselines, upper bounds, and humanperformance is shown in Table 4. Human performance iscomparable to the human performance on DocVQA. Asgiven by the Vocab + OCR UB, more than 3/4 of questionshave their answers present as a span of the OCR tokens se-rialized in the default reading order or in a vocabulary ofmost common answers in the train split.
We show results using M4C model in Table 5. In contrastto the original setting for which finetuning of visual featuresand features of detected objects are used, a setting that uses
Visual Finetune Object& # OCR ANLS Accuracy(%)Feature detector Count tokens val test val test
VG 3 Obj. (100) 50 0.107 0.119 4.81 4.87VG 3 Obj. (20) 50 0.111 0.122 4.82 4.87VG 7 Obj. (20) 50 0.125 0.127 4.89 4.89VG 7 Obj. (20) 300 0.128 0.134 4.90 5.08VG 7 None 300 0.136 0.143 5.86 6.58VG 7 Full Img 300 0.142 0.147 5.93 6.64DLA 7 Obj. (20) 50 0.110 0.130 4.86 5.02DLA 7 Obj. (20) 300 0.132 0.144 5.95 6.50DLA 7 None 300 0.140 0.142 5.90 6.39DLA 7 Full Img 300 0.138 0.140 5.97 6.42
Table 5: Performance of different variants of the M4C model. Theoriginal M4C setting is the one shown in the first row. ‘Fine-tune detector’ denotes the case when features from penultimateFC layer is used and last FC layer is finetuned along with theM4C model. This is the default setting in M4C. In our experi-ments, we get better results without finetuning. ‘Obj. (100)’ is thecase when features from up to 100 objects (bottom-up features) areused. We experiment with 20 objects per image and the results didnot change much. Using no object (‘None’) and feature from onlyone object—a box covering the entire image (‘Full Img’)—yieldbetter results than the case where bottom-up objects are used.
no finetuning and only a single visual feature correspondingto ROI covering the entire image, yields the best result.
Results of the LayoutLM based model are shown in Ta-ble 6. In-domain pretraining, using text from question, andOCR tokens helps the model significantly. This is inlinewith observation by Singh et al. that pretraining on datasimilar to the data for downstream task is highly beneficialin visio-linguistic pretraining [44]. The model that uses FullImg feature from DLA, added to the CLS performs the beston validation set. And on test set, a model which does notuse any visual feature performs the best.
From Table 6, it is evident that models which use visual
Full Img Visual Continue OCR ANLS Accuracy (%)to feature pretrain. visual val test val test
- - 7 7 0.212 0.225 13.40 15.32- - 3 7 0.250 0.272 18.14 19.74CLS DLA 3 7 0.256 0.261 18.56 19.16All DLA 3 7 0.248 0.266 17.82 18.77Non-OCR DLA 3 3 0.245 0.263 17.21 18.37CLS VG 3 7 0.229 0.235 16.47 16.51All VG 3 7 0.109 0.106 5.43 4.96Non-OCR VG 3 3 0.042 0.037 1.75 1.28
Table 6: Performance of LayoutLM with different input settings.Row 1 and 2 show LayoutLM’s performance with and without in-domain pretraining. ‘Visual Feature’ column specify the kind ofdetector used for visual feature. ‘OCR visual’ indicate whethervisual features of the OCR tokens are used or not. ‘CLS’, ‘All’and ‘Non-OCR’ in ‘Full Img to’ column represent Full Img fea-ture added only to CLS token, all tokens and all non OCR tokensrespectively.
7
ANLS
0.00
0.25
0.50
0.75
1.00
Overall Image-span Question-span Multi-span Non-extractive Text Table/list Figure Map Visual/Layout Counting Sorting Arithmetic
Human Vocab UB OCR UB Vocab + OCR UB LayoutLM M4C
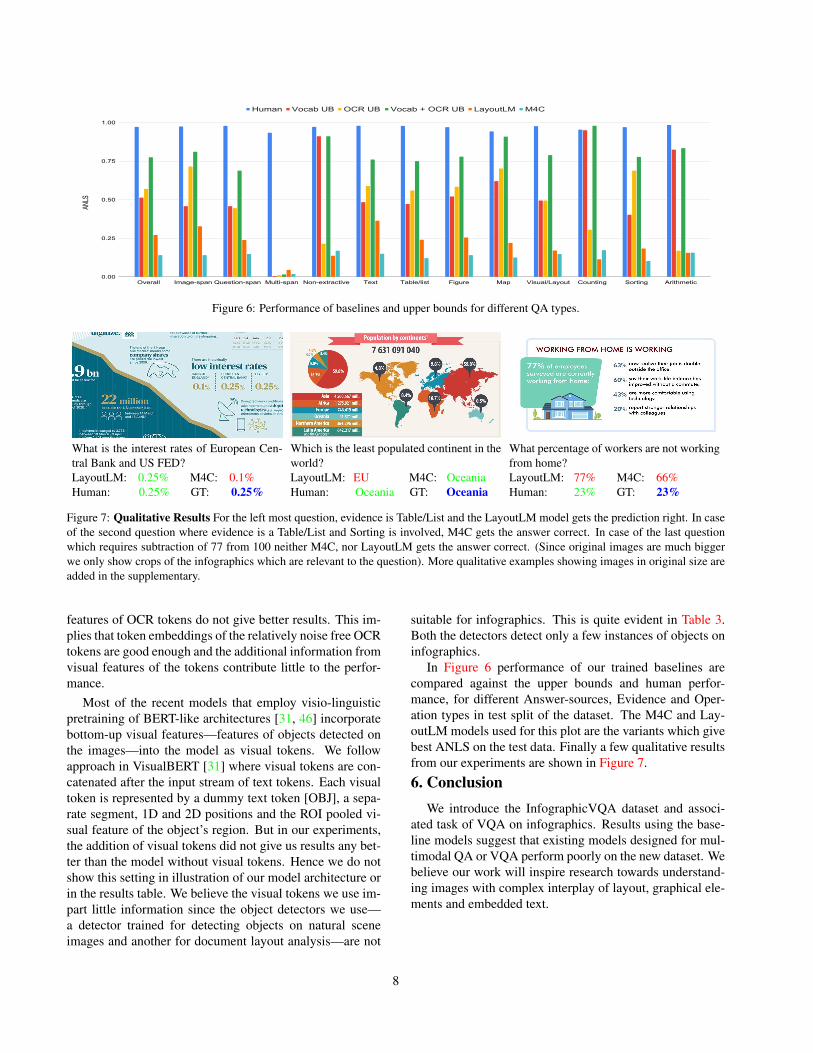
Figure 6: Performance of baselines and upper bounds for different QA types.
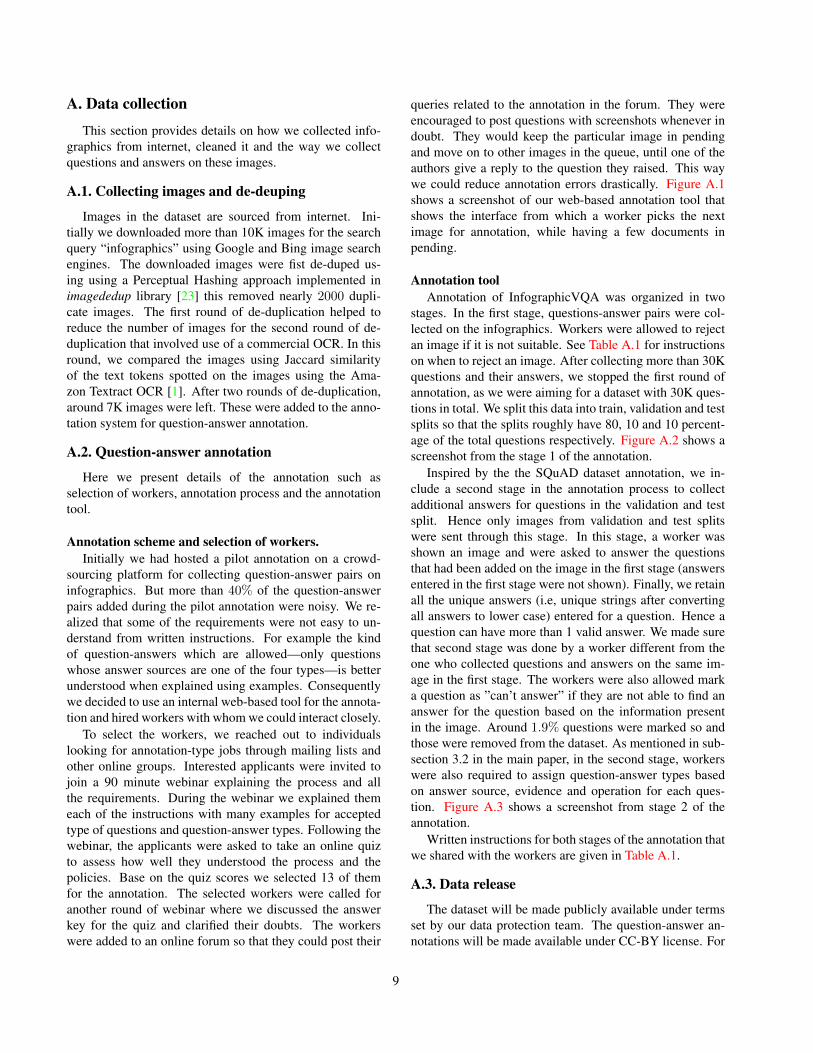
What is the interest rates of European Cen-tral Bank and US FED?LayoutLM: 0.25% M4C: 0.1%Human: 0.25% GT: 0.25%
Which is the least populated continent in theworld?LayoutLM: EU M4C: OceaniaHuman: Oceania GT: Oceania
What percentage of workers are not workingfrom home?LayoutLM: 77% M4C: 66%Human: 23% GT: 23%
Figure 7: Qualitative Results For the left most question, evidence is Table/List and the LayoutLM model gets the prediction right. In caseof the second question where evidence is a Table/List and Sorting is involved, M4C gets the answer correct. In case of the last questionwhich requires subtraction of 77 from 100 neither M4C, nor LayoutLM gets the answer correct. (Since original images are much biggerwe only show crops of the infographics which are relevant to the question). More qualitative examples showing images in original size areadded in the supplementary.
features of OCR tokens do not give better results. This im-plies that token embeddings of the relatively noise free OCRtokens are good enough and the additional information fromvisual features of the tokens contribute little to the perfor-mance.
Most of the recent models that employ visio-linguisticpretraining of BERT-like architectures [31, 46] incorporatebottom-up visual features—features of objects detected onthe images—into the model as visual tokens. We followapproach in VisualBERT [31] where visual tokens are con-catenated after the input stream of text tokens. Each visualtoken is represented by a dummy text token [OBJ], a sepa-rate segment, 1D and 2D positions and the ROI pooled vi-sual feature of the object’s region. But in our experiments,the addition of visual tokens did not give us results any bet-ter than the model without visual tokens. Hence we do notshow this setting in illustration of our model architecture orin the results table. We believe the visual tokens we use im-part little information since the object detectors we use—a detector trained for detecting objects on natural sceneimages and another for document layout analysis—are not
suitable for infographics. This is quite evident in Table 3.Both the detectors detect only a few instances of objects oninfographics.
In Figure 6 performance of our trained baselines arecompared against the upper bounds and human perfor-mance, for different Answer-sources, Evidence and Oper-ation types in test split of the dataset. The M4C and Lay-outLM models used for this plot are the variants which givebest ANLS on the test data. Finally a few qualitative resultsfrom our experiments are shown in Figure 7.
6. ConclusionWe introduce the InfographicVQA dataset and associ-
ated task of VQA on infographics. Results using the base-line models suggest that existing models designed for mul-timodal QA or VQA perform poorly on the new dataset. Webelieve our work will inspire research towards understand-ing images with complex interplay of layout, graphical ele-ments and embedded text.
8
A. Data collection
This section provides details on how we collected info-graphics from internet, cleaned it and the way we collectquestions and answers on these images.
A.1. Collecting images and de-deuping
Images in the dataset are sourced from internet. Ini-tially we downloaded more than 10K images for the searchquery “infographics” using Google and Bing image searchengines. The downloaded images were fist de-duped us-ing using a Perceptual Hashing approach implemented inimagededup library [23] this removed nearly 2000 dupli-cate images. The first round of de-duplication helped toreduce the number of images for the second round of de-duplication that involved use of a commercial OCR. In thisround, we compared the images using Jaccard similarityof the text tokens spotted on the images using the Ama-zon Textract OCR [1]. After two rounds of de-duplication,around 7K images were left. These were added to the anno-tation system for question-answer annotation.
A.2. Question-answer annotation
Here we present details of the annotation such asselection of workers, annotation process and the annotationtool.
Annotation scheme and selection of workers.Initially we had hosted a pilot annotation on a crowd-
sourcing platform for collecting question-answer pairs oninfographics. But more than 40% of the question-answerpairs added during the pilot annotation were noisy. We re-alized that some of the requirements were not easy to un-derstand from written instructions. For example the kindof question-answers which are allowed—only questionswhose answer sources are one of the four types—is betterunderstood when explained using examples. Consequentlywe decided to use an internal web-based tool for the annota-tion and hired workers with whom we could interact closely.
To select the workers, we reached out to individualslooking for annotation-type jobs through mailing lists andother online groups. Interested applicants were invited tojoin a 90 minute webinar explaining the process and allthe requirements. During the webinar we explained themeach of the instructions with many examples for acceptedtype of questions and question-answer types. Following thewebinar, the applicants were asked to take an online quizto assess how well they understood the process and thepolicies. Base on the quiz scores we selected 13 of themfor the annotation. The selected workers were called foranother round of webinar where we discussed the answerkey for the quiz and clarified their doubts. The workerswere added to an online forum so that they could post their
queries related to the annotation in the forum. They wereencouraged to post questions with screenshots whenever indoubt. They would keep the particular image in pendingand move on to other images in the queue, until one of theauthors give a reply to the question they raised. This waywe could reduce annotation errors drastically. Figure A.1shows a screenshot of our web-based annotation tool thatshows the interface from which a worker picks the nextimage for annotation, while having a few documents inpending.
Annotation toolAnnotation of InfographicVQA was organized in two
stages. In the first stage, questions-answer pairs were col-lected on the infographics. Workers were allowed to rejectan image if it is not suitable. See Table A.1 for instructionson when to reject an image. After collecting more than 30Kquestions and their answers, we stopped the first round ofannotation, as we were aiming for a dataset with 30K ques-tions in total. We split this data into train, validation and testsplits so that the splits roughly have 80, 10 and 10 percent-age of the total questions respectively. Figure A.2 shows ascreenshot from the stage 1 of the annotation.
Inspired by the the SQuAD dataset annotation, we in-clude a second stage in the annotation process to collectadditional answers for questions in the validation and testsplit. Hence only images from validation and test splitswere sent through this stage. In this stage, a worker wasshown an image and were asked to answer the questionsthat had been added on the image in the first stage (answersentered in the first stage were not shown). Finally, we retainall the unique answers (i.e, unique strings after convertingall answers to lower case) entered for a question. Hence aquestion can have more than 1 valid answer. We made surethat second stage was done by a worker different from theone who collected questions and answers on the same im-age in the first stage. The workers were also allowed marka question as ”can’t answer” if they are not able to find ananswer for the question based on the information presentin the image. Around 1.9% questions were marked so andthose were removed from the dataset. As mentioned in sub-section 3.2 in the main paper, in the second stage, workerswere also required to assign question-answer types basedon answer source, evidence and operation for each ques-tion. Figure A.3 shows a screenshot from stage 2 of theannotation.
Written instructions for both stages of the annotation thatwe shared with the workers are given in Table A.1.
A.3. Data release
The dataset will be made publicly available under termsset by our data protection team. The question-answer an-notations will be made available under CC-BY license. For
9
research and educational uses, the images in the dataset willbe available for download as single zip file. For other uses,a list of original URLs for all the images in the dataset willbe provided.
B. Additional Statistics and Analysis ofInfographicVQA dataset
In this section we provide additional statistics and anal-ysis of the InfographicVQA dataset. This section extendsSection 3 in the main paper.
To analyze the topics covered by images in Infograph-icVQA, we used the Latent Dirichlet Allocation (LDA) [8]model. We used the LDA implementation in Gensim li-brary [41]. Since our dataset comprises images, the textrecognized from the images using an OCR are used for thetopic modelling. Table B.1 shows that images in Infograph-icVQA dataset cover a wide range of topics such as energy,war, health and social media. In Figure B.1 we show a visu-alization of the top 20 topics in the dataset, visualized usingthe pyLDAvis tool [34].
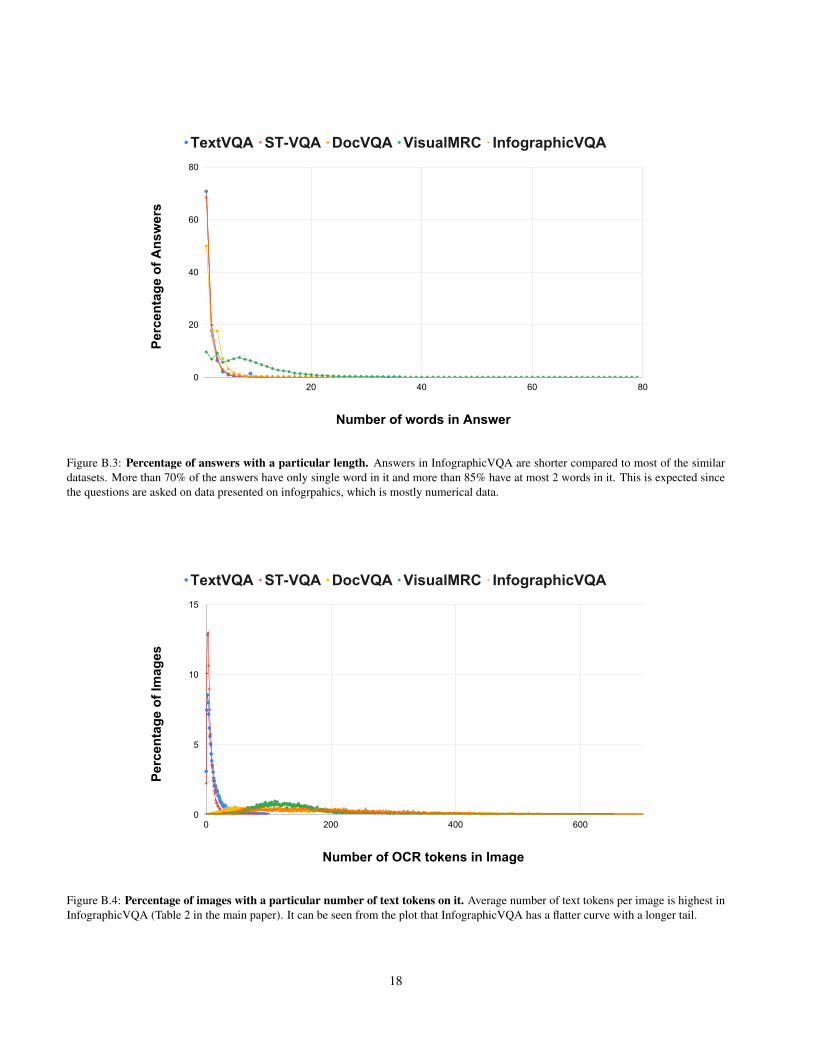
In Figure B.2, we plot the distribution of question lengthsfor questions in InfographicVQA dataset and other similardatasets — TextVQA [45], ST-VQA [7], DocVQA [36] andVisualMRC [47]. Similar plots for answer lengths and num-ber of OCR tokens are shown in Figure B.3 and Figure B.4respectively.
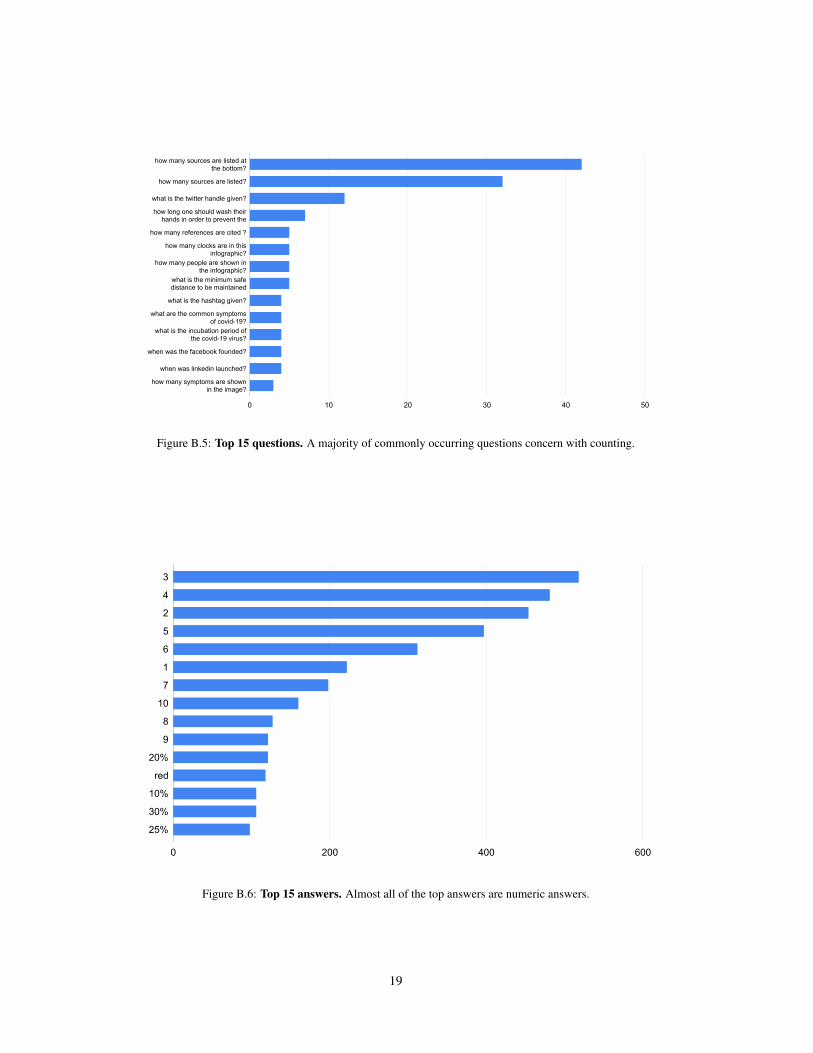
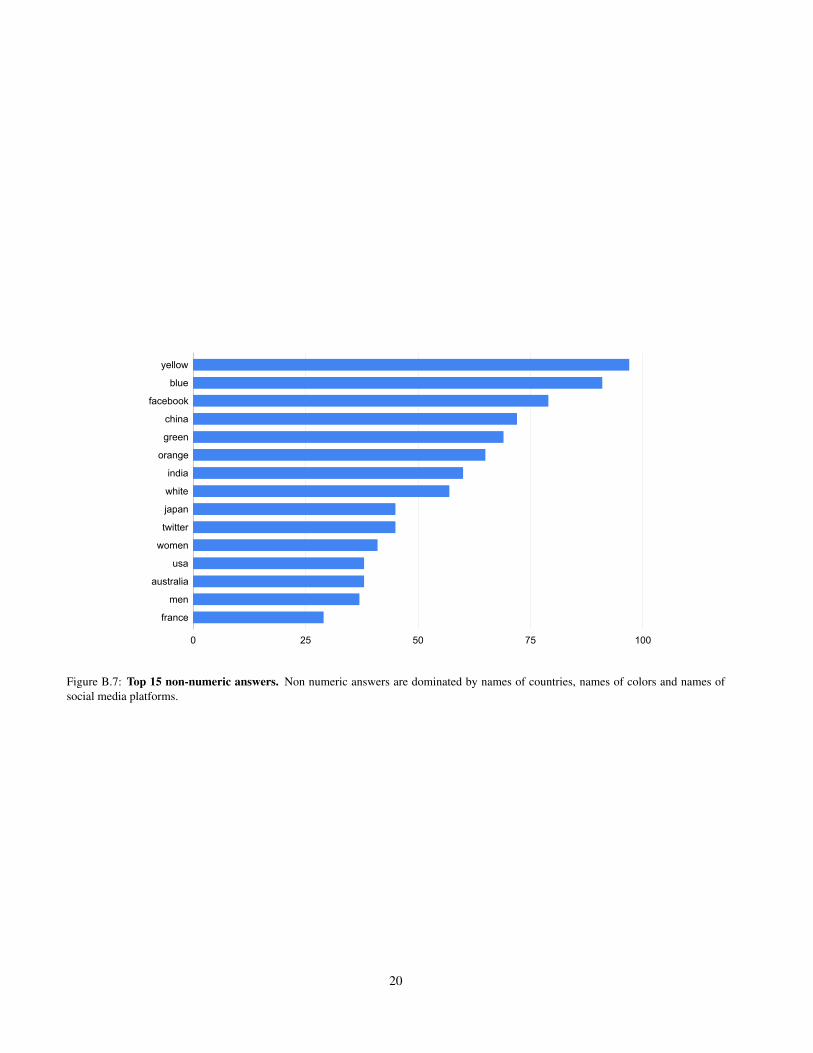
Top-15 questions in InfographicVQA dataset based onoccurrence frequency are shown in Figure B.5. Top-15 an-swers and top-15 non-numeric answers are shown in Fig-ure B.6 and Figure B.7 respectively.
For TextVQA dataset, for all statistics we use only thepublicly available data splits. For statistics and analysis in-volving OCR tokens, for InfographicVQA we use OCR to-kens spotted by Amazon Textract OCR (we will be mak-ing these OCR results publicly available along with ourdataset). For TextVQA and ST-VQA we use OCR tokensprovided as part of data made available in MMF frame-work [43]. For DocVQA and VisualMRC we use OCRrecognition results made available as part of the official datareleases.
C. More details on experimentsC.1. Evaluation
Since more than 70% of the answers in the datasetare taken verbatim from the text present in the image,we decided to keep the evaluation protocol same as theone used for ST-VQA [7] and DocVQA [36] benchmarks.These benchmarks where answers are compulsorily ex-tracted from the text on the images, authors propose to useAverage Normalized Levenshtein Similarity (ANLS) as theprimary evaluation metric. The metric was originally in-troduced for evaluating VQA on ST-VQA. As the authors
of ST-VQA state, ANLS “responds softly to answer mis-matches due to OCR imperfections”.
The below definition for ANLS is taken from ST-VQApaper.
In Equation C.1 N is the total number of questionsand M the number of GT answers per question. aij arethe the ground truth answers where i = {0, ..., N}, andj = {0, ...,M}, and oqi the predicted answer for the ith
question qi. Then, the final score is defined as:
ANLS =1
N
N∑i=0
(max
js(aij , oqi)
)(C.1)
s(aij , oqi) =
{(1−NL(aij , oqi)) if NL(aij , oqi) < τ
0 if NL(aij , oqi) > τ
where NL(aij , oqi) is the Normalized Levenshtein dis-tance between the lower-cased strings aij and oqi (noticethat the normalized Levenshtein distance is a value between0 and 1). We then define a threshold τ = 0.5 to filter NLvalues larger than the threshold. The intuition behind thethreshold is that if an output has a normalized edit distanceof more than 0.5 to an answer, it is highly unlikely that theanswer mismatch is due to OCR error.
In addition to ANLS, we also evaluate the performancein terms of Accuracy which is the percentage of questionsfor which the predicted answer match exactly with at leastone of the ground truth answers. Note that for both theANLS and Accuracy computation, the ground truth answersand the predicted answers are converted to lowercase.
C.2. Experimental setup for M4C
This section provides additional details about the exper-imental setup we used for the M4C [21] model. We usedthe official implementation available as part of the MMFmultimodal learning framework [43].
We trained our models on 4, NVIDIA RTX 2080TiGPUs. The maximum number of decoding steps used forthe iterative answer prediction module is 12. The multi-modal transformer block had 4 transformer layers, with 12attention heads. The dropout ratio for the transformer blockwas 0.1. We used Adam optimizer. The batch size was 128and we trained the models for 24, 000 iterations. We useda base learning rate of 1e − 04, a warm-up learning factorof 0.2 and 2, 000 warm-up iterations. We used a learningrate decay of 0.1. Gradients were clipped when L2 normexceeds 0.2.
C.3. Experimental setup forLayoutLM
Preparing QA data for finetuning LayoutLM. We fine-tune LayoutLM model for SQuAD [40] style extractive QA
10
wherein start and end tokens of a span is predicted. Forthis, we need to prepare LayoutLM training data in SQuAD-style format where answer is marked as a span of the textpresent on the infographic image. We serialize the OCRtokens spotted on each image in the natural reading order.Then we check if a ground truth answer can be found as asubsequence of the serialized text. In cases where an an-swer has multiple subsequence matches with the serializedtext, the first match is taken as the answer span. If no matchis found, the particular question is not used finetuning themodel. This approach of finding answer spans from an-swers is inspired by the similar approach used by authorsof TriviaQA [24]. The same has been used by authors ofDocVQA as well for finetuning a BERT QA model for spanprediction. Unlike substring matching in TriviaQA we lookfor subsequence matches as proposed by DocVQA authors.Substring matches can result in many false matches. SinceInfographicVQA has lot of numeric answers false matchesare even more likely. For example if the answer is “3” (themost common answer in InfographicVQA dataset), if we goby substring matching, it will match with a 3 in ‘300’ and‘3m’.
D. Additional Qualitative Examples
In Figure D.1– Figure D.7, we show qualitative exam-ples covering multiple types of answers, evidences and op-erations which we discuss in Section 3.3 of the main paper.These results supplement the qualitative results we show inSection 5.2 in the main paper.
References[1] Amazon Textract. https://aws.amazon.com/
textract/. Accessed: 2021-08-16.[2] Huggingface’s Models. https://huggingface.co/
models. Accessed: 2021-08-16.[3] stacked attention networks for image question answering.[4] Peter Anderson, Xiaodong He, Chris Buehler, Damien
Teney, Mark Johnson, Stephen Gould, and Lei Zhang.Bottom-Up and Top-Down Attention for Image Captioningand Visual Question Answering, 2017.
[5] Peter Anderson, Xiaodong He, Chris Buehler, DamienTeney, Mark Johnson, Stephen Gould, and Lei Zhang.Bottom-up and top-down attention for image captioning andvisual question answering. In CVPR, 2018.
[6] Srikar Appalaraju, Bhavan Jasani, Bhargava Urala Kota,Yusheng Xie, and R. Manmatha. Docformer: End-to-endtransformer for document understanding, 2021.
[7] Ali Furkan Biten, Ruben Tito, Andres Mafla, Lluis Gomez,Marcal Rusinol, Ernest Valveny, C.V. Jawahar, and Dimos-thenis Karatzas. Scene Text Visual Question Answering. InICCV, 2019.
[8] David M. Blei, Andrew Y. Ng, and Michael I. Jordan. Latentdirichlet allocation. J. Mach. Learn. Res., 3:993–1022, 2003.
[9] M. A. Borkin, A. A. Vo, Z. Bylinskii, P. Isola, S. Sunkavalli,A. Oliva, and H. Pfister. What Makes a Visualization Mem-orable? IEEE Transactions on Visualization and ComputerGraphics, 19(12):2306–2315, 2013.
[10] Z. Bylinskii, Sami Alsheikh, Spandan Madan, A. Recasens,Kimberli Zhong, H. Pfister, F. Durand, and A. Oliva. Under-standing infographics through textual and visual tag predic-tion. ArXiv, abs/1709.09215, 2017.
[11] R. Chaudhry, S. Shekhar, U. Gupta, P. Maneriker, P. Bansal,and A. Joshi. Leaf-qa: Locate, encode attend for figure ques-tion answering. In WACV, 2020.
[12] Yen-Chun Chen, Linjie Li, Licheng Yu, Ahmed El Kholy,Faisal Ahmed, Zhe Gan, Yu Cheng, and Jingjing Liu.UNITER: learning universal image-text representations.CoRR, abs/1909.11740, 2019.
[13] Michael A. A. Cox and Trevor F. Cox. MultidimensionalScaling, pages 315–347. Springer Berlin Heidelberg, 2008.
[14] Jacob Devlin, Ming-Wei Chang, Kenton Lee, and KristinaToutanova. BERT: Pre-training of Deep Bidirectional Trans-formers for Language Understanding. In ACL, 2019.
[15] Dheeru Dua, Yizhong Wang, Pradeep Dasigi, GabrielStanovsky, Sameer Singh, and Matt Gardner. DROP:A Reading Comprehension Benchmark Requiring DiscreteReasoning Over Paragraphs. In NAACL-HLT, 2019.
[16] Łukasz Garncarek, Rafał Powalski, Tomasz Stanisławek,Bartosz Topolski, Piotr Halama, and Filip Gralinski. Lam-bert: Layout-aware language modeling using bert for infor-mation extraction. arXiv preprint arXiv:2002.08087, 2020.
[17] Y. Goyal, T. Khot, D. Summers-Stay, D. Batra, and D.Parikh. Making the V in VQA Matter: Elevating the Roleof Image Understanding in Visual Question Answering. InCVPR, 2017.
[18] Danna Gurari, Qing Li, Abigale J Stangl, Anhong Guo, ChiLin, Kristen Grauman, Jiebo Luo, and Jeffrey P Bigham.Vizwiz grand challenge: Answering visual questions fromblind people. In CVPR, 2018.
[19] Kaiming He, Georgia Gkioxari, Piotr Dollar, and Ross Gir-shick. Mask r-cnn. In CVPR, 2017.
[20] Himanshu. Detectron2 for document layout analysis.https://github.com/hpanwar08/detectron2.git, 2020.
[21] Ronghang Hu, Amanpreet Singh, Trevor Darrell, and Mar-cus Rohrbach. Iterative answer prediction with pointer-augmented multimodal transformers for textvqa. In CVPR,2020.
[22] Drew A. Hudson and Christopher D. Manning. GQA: anew dataset for compositional question answering over real-world images. CoRR, abs/1902.09506, 2019.
[23] Tanuj Jain, Christopher Lennan, Zubin John, and DatTran. Imagededup. https://github.com/idealo/imagededup, 2019.
[24] Mandar Joshi, Eunsol Choi, Daniel Weld, and Luke Zettle-moyer. TriviaQA: A Large Scale Distantly Supervised Chal-lenge Dataset for Reading Comprehension. In ACL, 2017.
[25] Kushal Kafle, Brian Price, Scott Cohen, and ChristopherKanan. DVQA: Understanding Data Visualizations viaQuestion Answering. In CVPR, 2018.
11
[26] Samira Ebrahimi Kahou, Vincent Michalski, Adam Atkin-son, Akos Kadar, Adam Trischler, and Yoshua Bengio. Fig-ureqa: An annotated figure dataset for visual reasoning.arXiv preprint arXiv:1710.07300, 2017.
[27] Vahid Kazemi and Ali Elqursh. Show, ask, attend, and an-swer: A strong baseline for visual question answering. arXivpreprint arXiv:1704.03162, 2017.
[28] Aniruddha Kembhavi, Minjoon Seo, Dustin Schwenk,Jonghyun Choi, Ali Farhadi, and Hannaneh Hajishirzi. AreYou Smarter Than A Sixth Grader? Textbook Question An-swering for Multimodal Machine Comprehension. In CVPR,2017.
[29] Ranjay Krishna, Yuke Zhu, Oliver Groth, Justin Johnson,Kenji Hata, Joshua Kravitz, Stephanie Chen, Yannis Kalan-tidis, Li-Jia Li, David A. Shamma, Michael S. Bernstein, andLi Fei-Fei. Visual Genome: Connecting Language and Vi-sion Using Crowdsourced Dense Image Annotations. Int. J.Comput. Vision, 2017.
[30] Nathan Landman. Towards abstractive captioning of info-graphics. Master’s thesis, Massachusetts Institute of Tech-nology, Massachusetts Institute of Technology, 2018.
[31] Liunian Harold Li, Mark Yatskar, Da Yin, C. Hsieh, and Kai-Wei Chang. VisualBERT: A Simple and Performant Baselinefor Vision and Language. ArXiv, abs/1908.03557, 2019.
[32] Yulin Li, Yuxi Qian, Yuchen Yu, Xiameng Qin, ChengquanZhang, Yan Liu, Kun Yao, Junyu Han, Jingtuo Liu, and ErruiDing. Structext: Structured text understanding with multi-modal transformers, 2021.
[33] Min Lu, Chufeng Wang, Joel Lanir, Nanxuan Zhao,Hanspeter Pfister, Daniel Cohen-Or, and Hui Huang. Ex-ploring Visual Information Flows in Infographics. In ACMCHI, 2020.
[34] Ben Mabey. pyLDAvis. https://github.com/bmabey/pyLDAvis, 2021.
[35] Spandan Madan, Zoya Bylinskii, Matthew Tancik, Adria Re-casens, Kimberli Zhong, Sami Alsheikh, Hanspeter Pfister,Aude Oliva, and Fredo Durand. Synthetically trained iconproposals for parsing and summarizing infographics. arXivpreprint arXiv:1807.10441, 2018.
[36] Minesh Mathew, Dimosthenis Karatzas, and C. V. Jawahar.DocVQA: A Dataset for VQA on Document Images. InWACV, 2020.
[37] Anand Mishra, Shashank Shekhar, Ajeet Kumar Singh, andAnirban Chakraborty. OCR-VQA: Visual question answer-ing by reading text in images. In ICDAR, 2019.
[38] Adam Paszke, Sam Gross, Francisco Massa, Adam Lerer,James Bradbury, Gregory Chanan, Trevor Killeen, ZemingLin, Natalia Gimelshein, Luca Antiga, Alban Desmaison,Andreas Kopf, Edward Yang, Zachary DeVito, Martin Rai-son, Alykhan Tejani, Sasank Chilamkurthy, Benoit Steiner,Lu Fang, Junjie Bai, and Soumith Chintala. Pytorch: Animperative style, high-performance deep learning library. InNeurIPS. 2019.
[39] Rafał Powalski, Łukasz Borchmann, Dawid Jurkiewicz,Tomasz Dwojak, Michał Pietruszka, and Gabriela Pałka. Go-ing full-tilt boogie on document understanding with text-image-layout transformer. arXiv preprint arXiv:2102.09550,2021.
[40] Pranav Rajpurkar, Jian Zhang, Konstantin Lopyrev, andPercy Liang. SQuAD: 100,000+ Questions for MachineComprehension of Text. In Proceedings of the 2016 Confer-ence on Empirical Methods in Natural Language Processing,pages 2383–2392, 2016.
[41] Radim Rehurek and Petr Sojka. Software Framework forTopic Modelling with Large Corpora. In LREC 2010 Work-shop on New Challenges for NLP Frameworks, 2010.
[42] Shaoqing Ren, Kaiming He, Ross Girshick, and Jian Sun.Faster R-CNN: Towards Real-Time Object Detection withRegion Proposal Networks. In NeurIPS. 2015.
[43] Amanpreet Singh, Vedanuj Goswami, Vivek Natarajan, YuJiang, Xinlei Chen, Meet Shah, Marcus Rohrbach, DhruvBatra, and Devi Parikh. MMF: A multimodal framework forvision and language research. https://github.com/facebookresearch/mmf, 2020.
[44] Amanpreet Singh, Vedanuj Goswami, and D. Parikh. Arewe pretraining it right? Digging deeper into visio-linguisticpretraining. ArXiv, abs/2004.08744, 2020.
[45] Amanpreet Singh, Vivek Natarjan, Meet Shah, Yu Jiang,Xinlei Chen, Devi Parikh, and Marcus Rohrbach. TowardsVQA Models That Can Read. In CVPR, 2019.
[46] Weijie Su, X. Zhu, Y. Cao, B. Li, Lewei Lu, Furu Wei, andJifeng Dai. Vl-bert: Pre-training of generic visual-linguisticrepresentations. ArXiv, abs/1908.08530, 2020.
[47] Ryota Tanaka, Kyosuke Nishida, and Sen Yoshida. Vi-sualmrc: Machine reading comprehension on document im-ages. arXiv preprint arXiv:2101.11272, 2021.
[48] Ashish Vaswani, Noam Shazeer, Niki Parmar, Jakob Uszko-reit, Llion Jones, Aidan N Gomez, Ł ukasz Kaiser, and IlliaPolosukhin. Attention is All you Need. In NeurIPS. 2017.
[49] Thomas Wolf, Lysandre Debut, Victor Sanh, Julien Chau-mond, Clement Delangue, Anthony Moi, Pierric Cistac, TimRault, Remi Louf, Morgan Funtowicz, Joe Davison, SamShleifer, Patrick von Platen, Clara Ma, Yacine Jernite, JulienPlu, Canwen Xu, Teven Le Scao, Sylvain Gugger, MariamaDrame, Quentin Lhoest, and Alexander M. Rush. Hugging-face’s transformers: State-of-the-art natural language pro-cessing, 2020.
[50] Yuxin Wu, Alexander Kirillov, Francisco Massa, Wan-YenLo, and Ross Girshick. Detectron2. https://github.com/facebookresearch/detectron2, 2019.
[51] Y. Wu, M. Schuster, Z. Chen, Quoc V. Le, MohammadNorouzi, Wolfgang Macherey, M. Krikun, Yuan Cao, Q.Gao, Klaus Macherey, Jeff Klingner, Apurva Shah, M. John-son, X. Liu, L. Kaiser, S. Gouws, Y. Kato, Taku Kudo, H.Kazawa, K. Stevens, G. Kurian, Nishant Patil, W. Wang, C.Young, J. Smith, Jason Riesa, Alex Rudnick, Oriol Vinyals,G. S. Corrado, Macduff Hughes, and J. Dean. Google’s neu-ral machine translation system: Bridging the gap betweenhuman and machine translation. ArXiv, abs/1609.08144,2016.
[52] Yiheng Xu, Minghao Li, Lei Cui, Shaohan Huang, Furu Wei,and Ming Zhou. LayoutLM: Pre-training of Text and Lay-out for Document Image Understanding. ACM SIGKDD, Jul2020.
[53] Yang Xu, Yiheng Xu, Tengchao Lv, Lei Cui, Furu Wei,Guoxin Wang, Yijuan Lu, Dinei Florencio, Cha Zhang,
12
Wanxiang Che, et al. Layoutlmv2: Multi-modal pre-trainingfor visually-rich document understanding. arXiv preprintarXiv:2012.14740, 2020.
[54] Semih Yagcioglu, Aykut Erdem, Erkut Erdem, and NazliIkizler-Cinbis. RecipeQA: A Challenge Dataset for Mul-timodal Comprehension of Cooking Recipes. In EMNLP,2018.
[55] Zhengyuan Yang, Yijuan Lu, Jianfeng Wang, Xi Yin, DineiFlorencio, Lijuan Wang, Cha Zhang, Lei Zhang, and JieboLuo. TAP: Text-Aware Pre-training for Text-VQA and Text-Caption, 2020.
[56] Xu Zhong, Jianbin Tang, and Antonio Jimeno Yepes. Pub-LayNet: largest dataset ever for document layout analysis. InICDAR, 2019.
13
Stage1 1 instructions Stage 2 instructions
1. You need to add questions and corresponding answersbased on the given image.
2. Make sure the questions you ask can be answered purelybased on the content in the image
3. Try to minimize questions based on textual content.Frame questions which require you to connect multipleelements such as text, structured elements like tables, datavisualizations and any other visual elements.
4. On infographics with numerical data, try to frame ques-tions which require one to do basic arithmetic, countingor comparisons
5. You are allowed to reject the image if,
(a) bad resolution images/ illegible text
(b) image is an infographic template with dummy text
(c) content is almost entirely in a non English language
6. The text which forms your answer must be
(a) found verbatim in the image as a contiguous se-quence of tokens in the reading order
(b) found verbatim in the question as a contiguous se-quence of tokens
(c) formed by multiple text pieces where each ‘piece’ isfound verbatim in the image as contiguous sequenceof text tokens. In such a case when you add theanswer separate each item by a comma and a whitespace.
(d) a number such as 2, 2.2, 2/2 etc..
1. You need to enter answer for the questions shown basedon the given image
2. if you cannot find answer to the question based on the im-age, flag the question as ”cant answer”
3. For each question add the following question-answertypes appropriately. There are three categories ofquestion-answer types - Evidence, Operation, andAnswer-source. It is possible that a question can havemore than one source of answer, more than one type ofoperation, or more than one type of evidence associatedwith it.
(a) Answer source : Following are different types ofsources possible:
i. Image-Span: answer is found verbatim in theimage as a contiguous sequence of tokens inthe reading order
ii. Question-Span: similar to Image-span butfound from question.
iii. Multi-Span: formed by multiple text pieceswhere each ‘piece’ is found verbatim in the im-age as contiguous sequence of text tokens (i.e,each piece is an Image-span).
iv. Non-extractive: answer is a numerical answerand is not found verbatim on the text on theimage or the question.
(b) Evidence : Following are different types of evi-dences possible:
i. Text: answer is derived purely by reading textfound in the image.
ii. Table/List: finding answer requires one to un-derstand a tabular or list type structure
iii. Visual/Layout: requires one to look for visualaspects(colors, names of objects etc.) or layoutof the image to arrive at the answer.
iv. Figure: requires understanding a figure, a plot,a visualization or a schematic.
v. Map: answer is based on a geographical map
(c) Operation : if answering the question requires oneof the following discrete operations:
i. Counting: requires to count somethingii. Arithmetic: requires to do basic arithmetic
operations (sumsubtractmultiplydivide) to findthe answer.
iii. Sorting: requires to find sort numbers or needto compare numbers
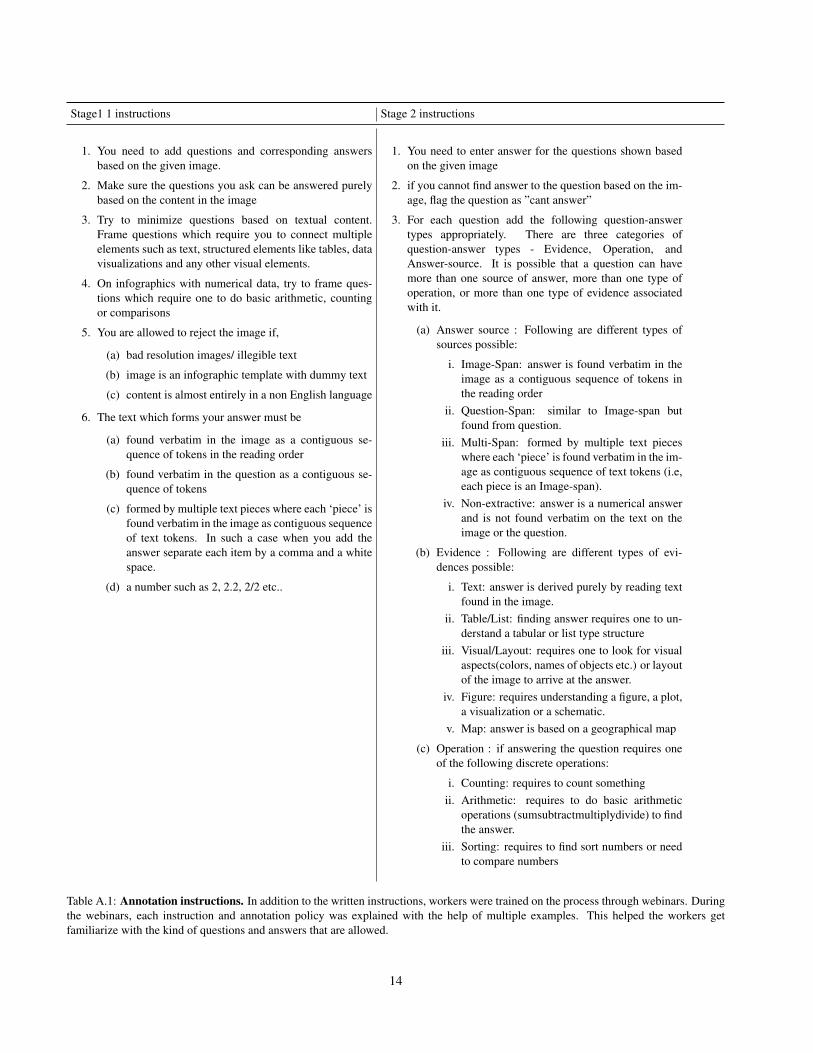
Table A.1: Annotation instructions. In addition to the written instructions, workers were trained on the process through webinars. Duringthe webinars, each instruction and annotation policy was explained with the help of multiple examples. This helped the workers getfamiliarize with the kind of questions and answers that are allowed.
14
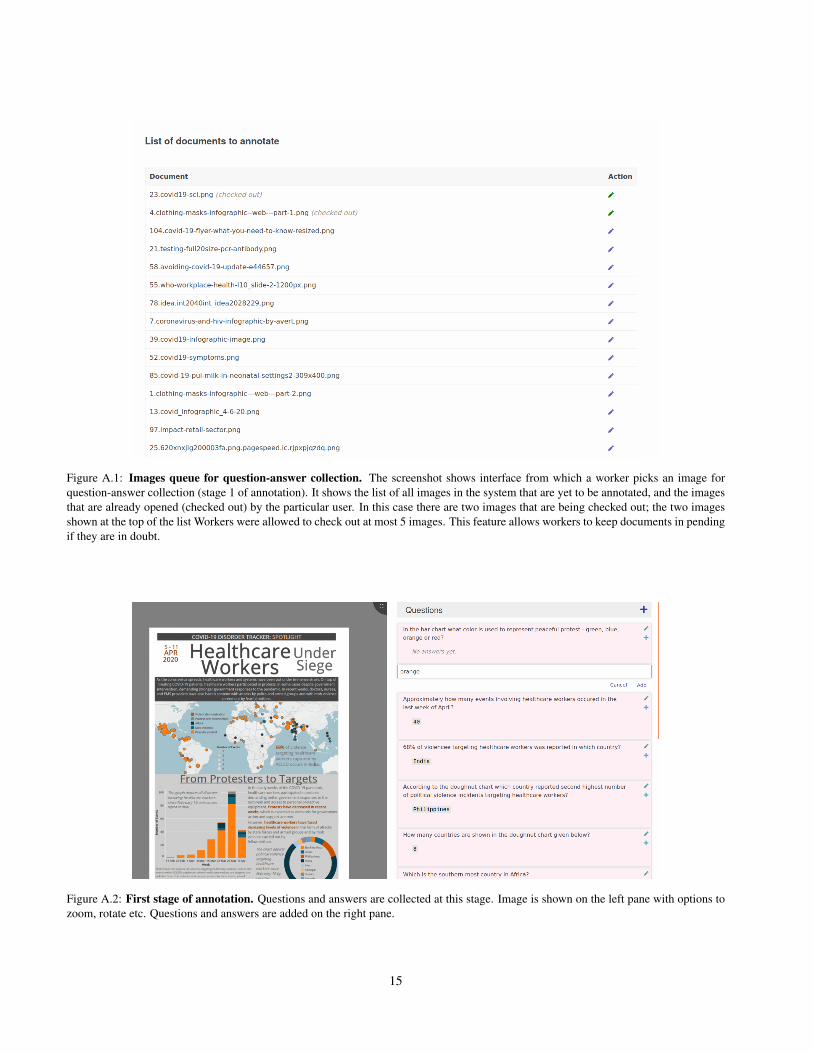
Figure A.1: Images queue for question-answer collection. The screenshot shows interface from which a worker picks an image forquestion-answer collection (stage 1 of annotation). It shows the list of all images in the system that are yet to be annotated, and the imagesthat are already opened (checked out) by the particular user. In this case there are two images that are being checked out; the two imagesshown at the top of the list Workers were allowed to check out at most 5 images. This feature allows workers to keep documents in pendingif they are in doubt.
Figure A.2: First stage of annotation. Questions and answers are collected at this stage. Image is shown on the left pane with options tozoom, rotate etc. Questions and answers are added on the right pane.
15
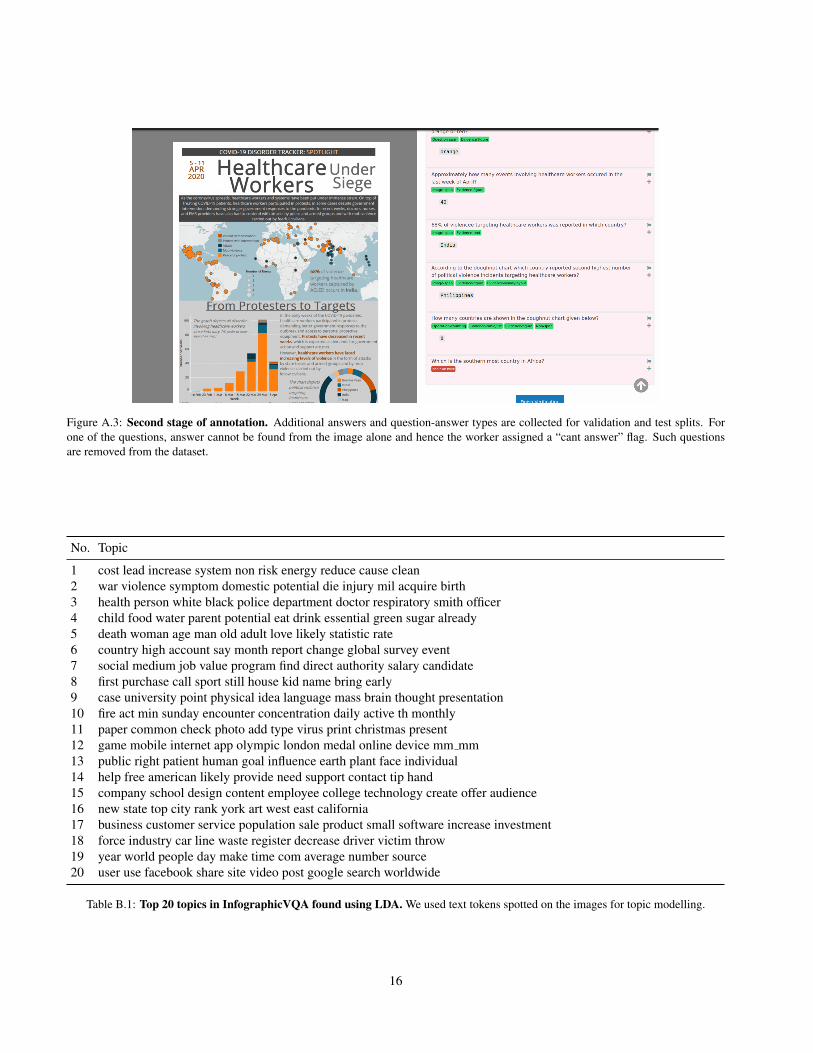
Figure A.3: Second stage of annotation. Additional answers and question-answer types are collected for validation and test splits. Forone of the questions, answer cannot be found from the image alone and hence the worker assigned a “cant answer” flag. Such questionsare removed from the dataset.
No. Topic
1 cost lead increase system non risk energy reduce cause clean2 war violence symptom domestic potential die injury mil acquire birth3 health person white black police department doctor respiratory smith officer4 child food water parent potential eat drink essential green sugar already5 death woman age man old adult love likely statistic rate6 country high account say month report change global survey event7 social medium job value program find direct authority salary candidate8 first purchase call sport still house kid name bring early9 case university point physical idea language mass brain thought presentation10 fire act min sunday encounter concentration daily active th monthly11 paper common check photo add type virus print christmas present12 game mobile internet app olympic london medal online device mm mm13 public right patient human goal influence earth plant face individual14 help free american likely provide need support contact tip hand15 company school design content employee college technology create offer audience16 new state top city rank york art west east california17 business customer service population sale product small software increase investment18 force industry car line waste register decrease driver victim throw19 year world people day make time com average number source20 user use facebook share site video post google search worldwide
Table B.1: Top 20 topics in InfographicVQA found using LDA. We used text tokens spotted on the images for topic modelling.
16
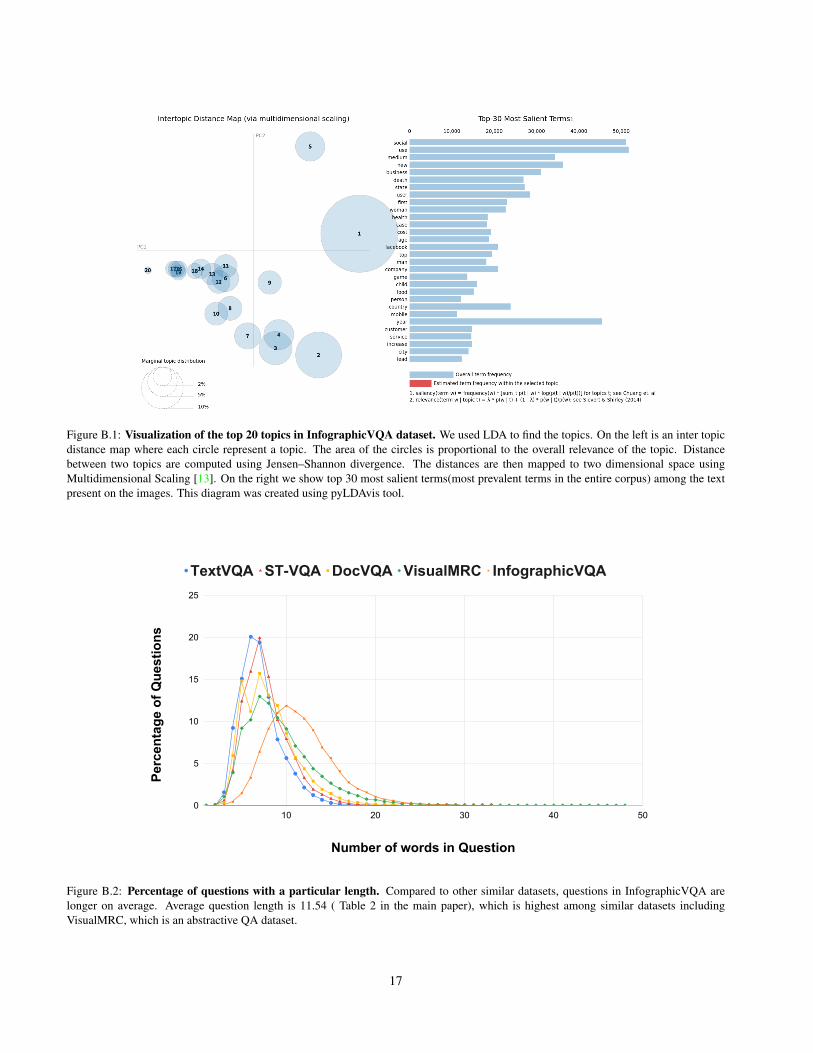
Figure B.1: Visualization of the top 20 topics in InfographicVQA dataset. We used LDA to find the topics. On the left is an inter topicdistance map where each circle represent a topic. The area of the circles is proportional to the overall relevance of the topic. Distancebetween two topics are computed using Jensen–Shannon divergence. The distances are then mapped to two dimensional space usingMultidimensional Scaling [13]. On the right we show top 30 most salient terms(most prevalent terms in the entire corpus) among the textpresent on the images. This diagram was created using pyLDAvis tool.
Number of words in Question
Perc
enta
ge o
f Que
stio
ns
0
5
10
15
20
25
10 20 30 40 50
TextVQA ST-VQA DocVQA VisualMRC InfographicVQA
Figure B.2: Percentage of questions with a particular length. Compared to other similar datasets, questions in InfographicVQA arelonger on average. Average question length is 11.54 ( Table 2 in the main paper), which is highest among similar datasets includingVisualMRC, which is an abstractive QA dataset.
17
Number of words in Answer
Perc
enta
ge o
f Ans
wer
s
0
20
40
60
80
20 40 60 80
TextVQA ST-VQA DocVQA VisualMRC InfographicVQA
Figure B.3: Percentage of answers with a particular length. Answers in InfographicVQA are shorter compared to most of the similardatasets. More than 70% of the answers have only single word in it and more than 85% have at most 2 words in it. This is expected sincethe questions are asked on data presented on infogrpahics, which is mostly numerical data.
Number of OCR tokens in Image
Perc
enta
ge o
f Im
ages
0
5
10
15
0 200 400 600
TextVQA ST-VQA DocVQA VisualMRC InfographicVQA
Figure B.4: Percentage of images with a particular number of text tokens on it. Average number of text tokens per image is highest inInfographicVQA (Table 2 in the main paper). It can be seen from the plot that InfographicVQA has a flatter curve with a longer tail.
18
how many sources are listed at the bottom?
how many sources are listed?
what is the twitter handle given?
how long one should wash their hands in order to prevent the
how many references are cited ?
how many clocks are in this infographic?
how many people are shown in the infographic?
what is the minimum safe distance to be maintained
what is the hashtag given?
what are the common symptoms of covid-19?
what is the incubation period of the covid-19 virus?
when was the facebook founded?
when was linkedin launched?
how many symptoms are shown in the image?
0 10 20 30 40 50
Figure B.5: Top 15 questions. A majority of commonly occurring questions concern with counting.
3
4
2
5
6
1
7
10
8
9
20%
red
10%
30%
25%
0 200 400 600
Figure B.6: Top 15 answers. Almost all of the top answers are numeric answers.
19
yellow
blue
china
green
orange
india
white
japan
women
usa
australia
men
france
0 25 50 75 100
Figure B.7: Top 15 non-numeric answers. Non numeric answers are dominated by names of countries, names of colors and names ofsocial media platforms.
20
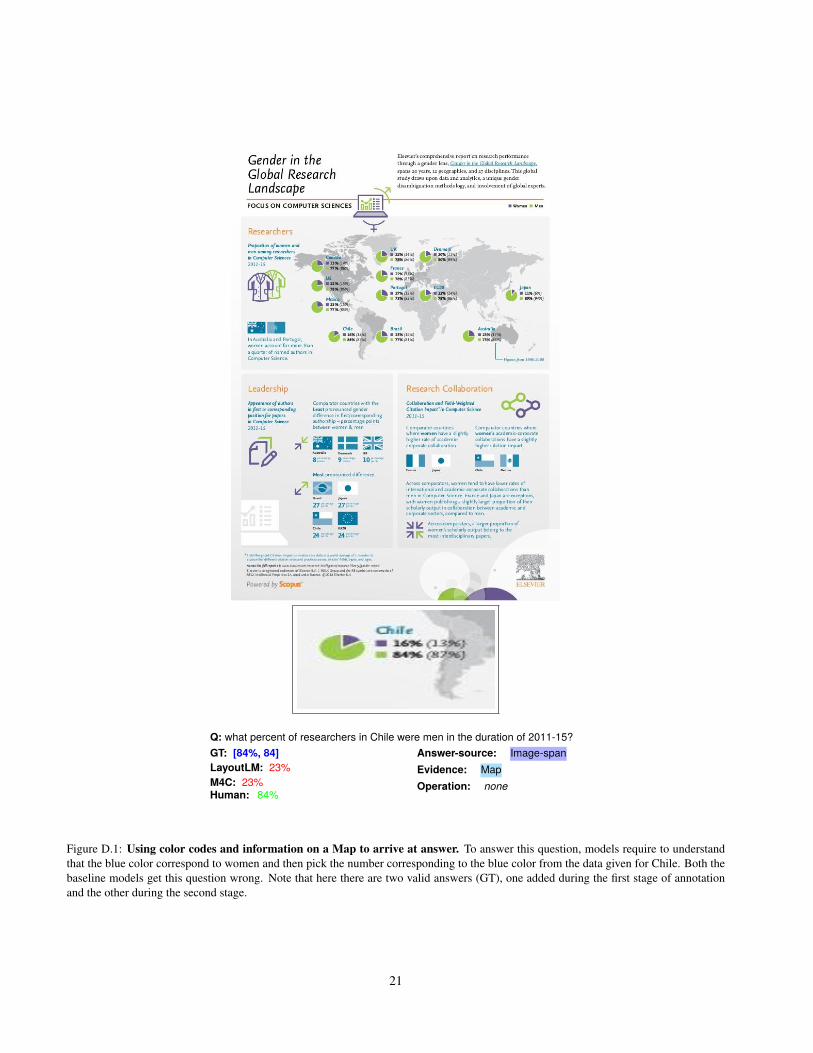
Q: what percent of researchers in Chile were men in the duration of 2011-15?GT: [84%, 84]LayoutLM: 23%M4C: 23%Human: 84%
Answer-source: Image-spanEvidence: MapOperation: none
Figure D.1: Using color codes and information on a Map to arrive at answer. To answer this question, models require to understandthat the blue color correspond to women and then pick the number corresponding to the blue color from the data given for Chile. Both thebaseline models get this question wrong. Note that here there are two valid answers (GT), one added during the first stage of annotationand the other during the second stage.
21
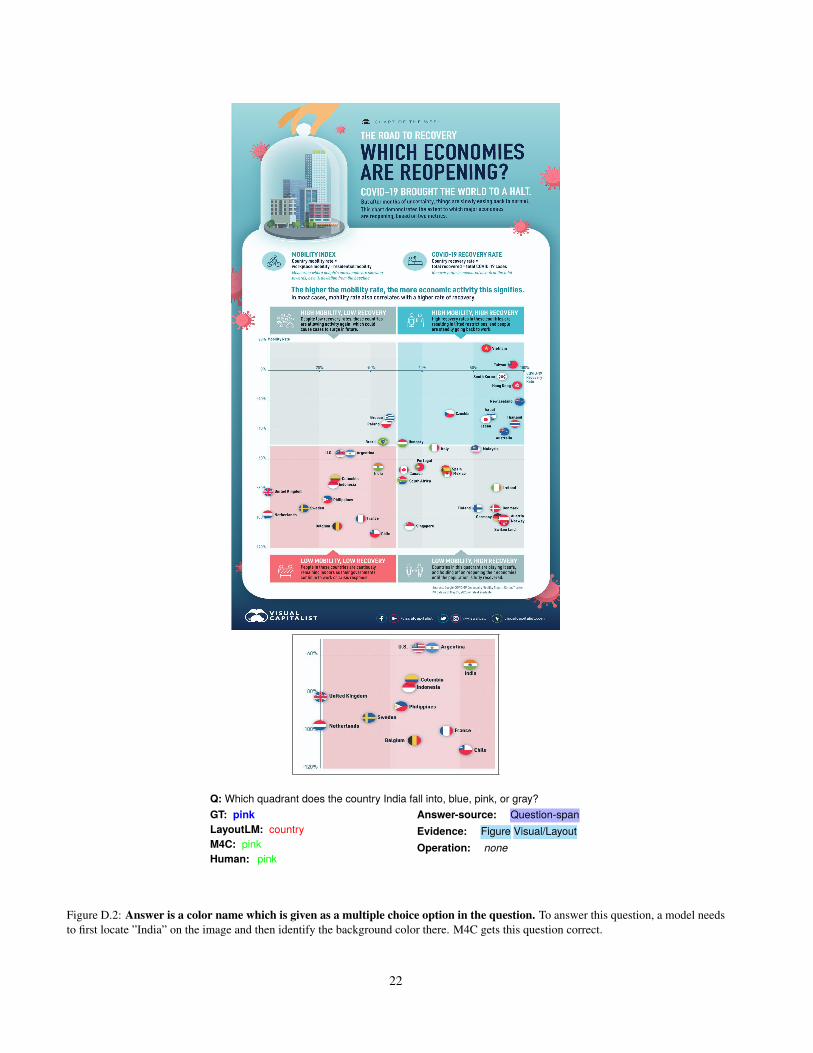
Q: Which quadrant does the country India fall into, blue, pink, or gray?GT: pinkLayoutLM: countryM4C: pinkHuman: pink
Answer-source: Question-spanEvidence: Figure Visual/LayoutOperation: none
Figure D.2: Answer is a color name which is given as a multiple choice option in the question. To answer this question, a model needsto first locate ”India” on the image and then identify the background color there. M4C gets this question correct.
22
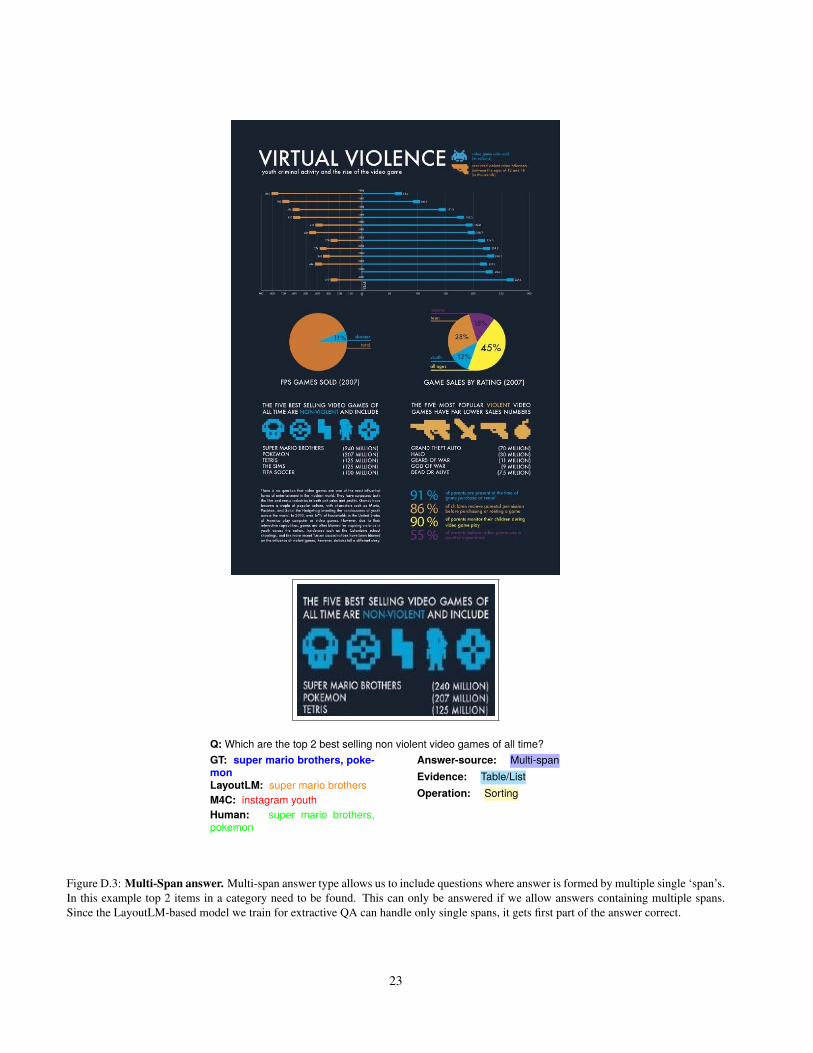
Q: Which are the top 2 best selling non violent video games of all time?GT: super mario brothers, poke-monLayoutLM: super mario brothersM4C: instagram youthHuman: super mario brothers,pokemon
Answer-source: Multi-spanEvidence: Table/ListOperation: Sorting
Figure D.3: Multi-Span answer. Multi-span answer type allows us to include questions where answer is formed by multiple single ‘span’s.In this example top 2 items in a category need to be found. This can only be answered if we allow answers containing multiple spans.Since the LayoutLM-based model we train for extractive QA can handle only single spans, it gets first part of the answer correct.
23
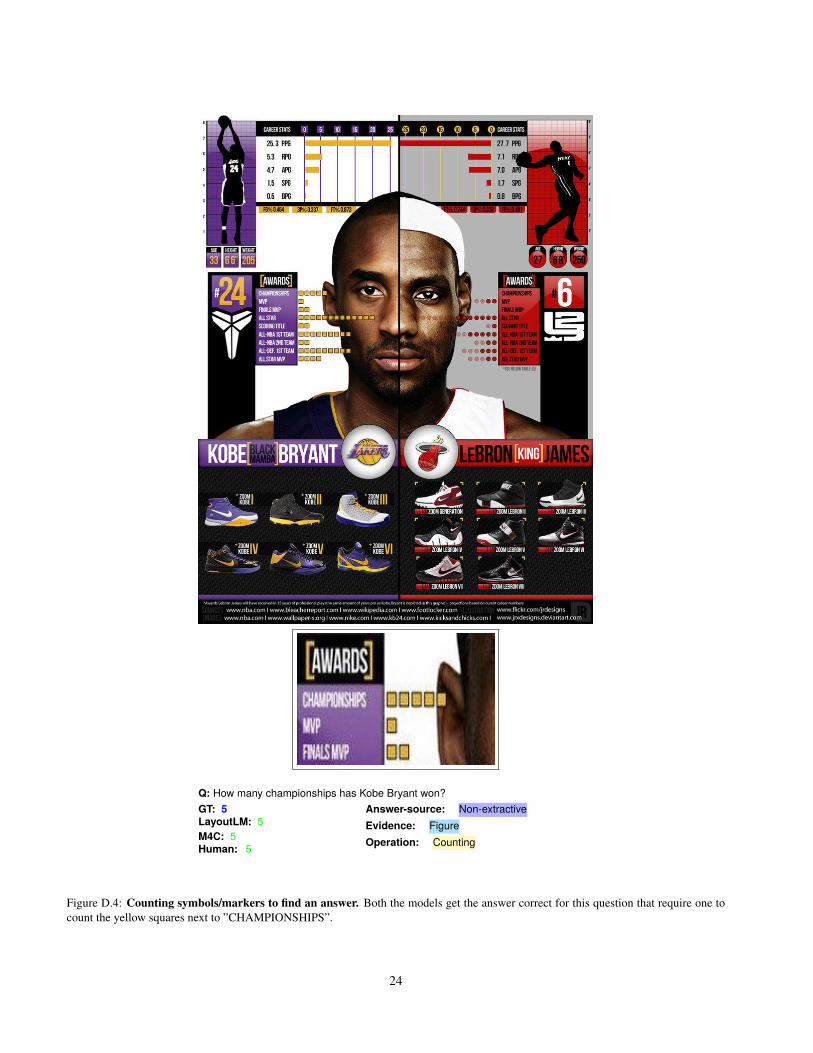
Q: How many championships has Kobe Bryant won?GT: 5LayoutLM: 5M4C: 5Human: 5
Answer-source: Non-extractiveEvidence: FigureOperation: Counting
Figure D.4: Counting symbols/markers to find an answer. Both the models get the answer correct for this question that require one tocount the yellow squares next to ”CHAMPIONSHIPS”.
24
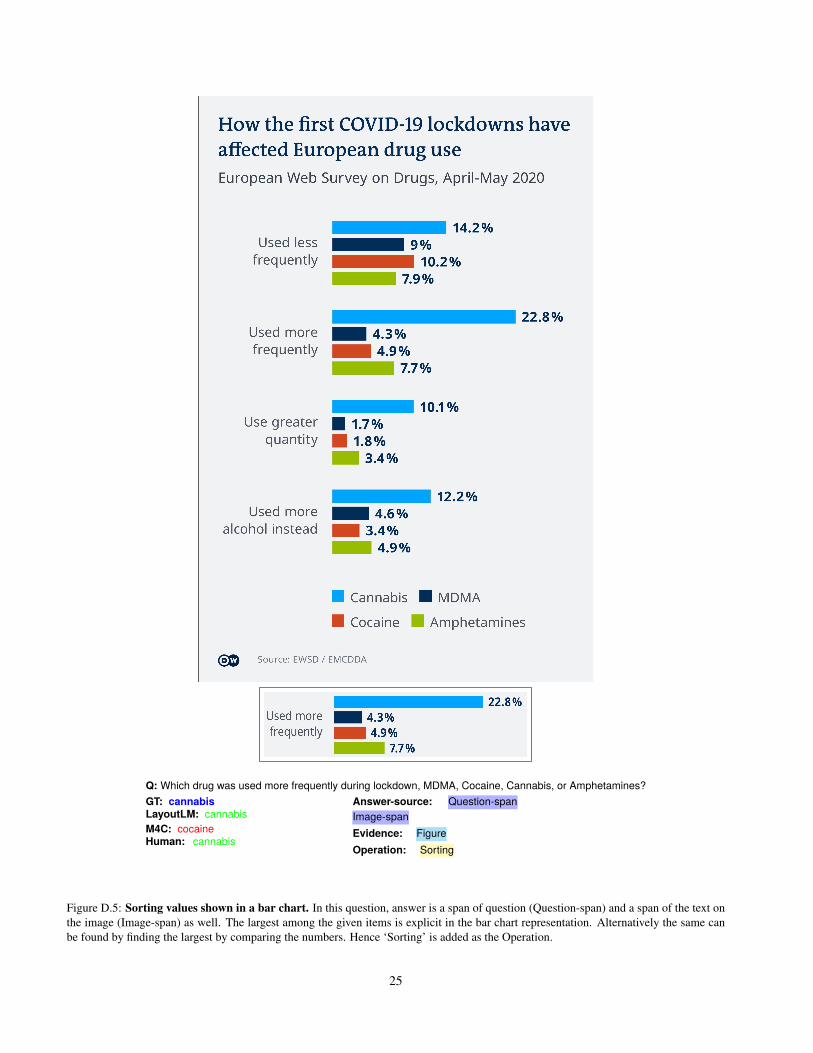
Q: Which drug was used more frequently during lockdown, MDMA, Cocaine, Cannabis, or Amphetamines?GT: cannabisLayoutLM: cannabisM4C: cocaineHuman: cannabis
Answer-source: Question-spanImage-spanEvidence: FigureOperation: Sorting
Figure D.5: Sorting values shown in a bar chart. In this question, answer is a span of question (Question-span) and a span of the text onthe image (Image-span) as well. The largest among the given items is explicit in the bar chart representation. Alternatively the same canbe found by finding the largest by comparing the numbers. Hence ‘Sorting’ is added as the Operation.
25
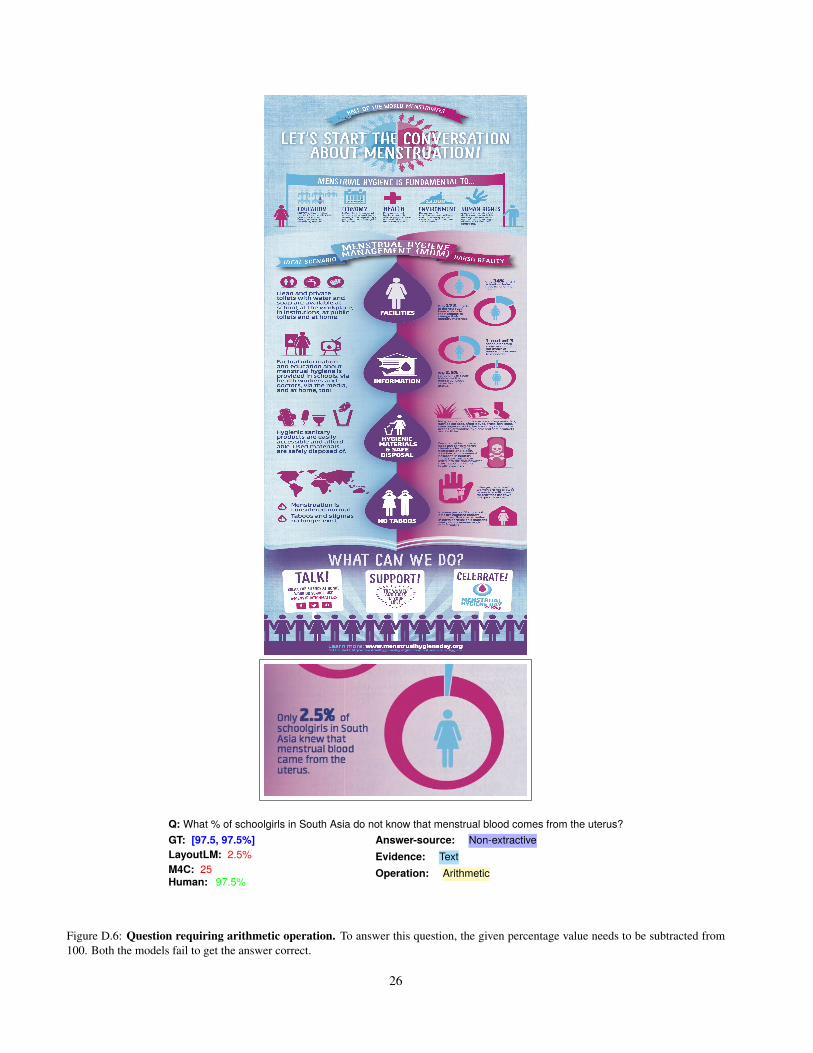
Q: What % of schoolgirls in South Asia do not know that menstrual blood comes from the uterus?GT: [97.5, 97.5%]LayoutLM: 2.5%M4C: 25Human: 97.5%
Answer-source: Non-extractiveEvidence: TextOperation: Arithmetic
Figure D.6: Question requiring arithmetic operation. To answer this question, the given percentage value needs to be subtracted from100. Both the models fail to get the answer correct.
26
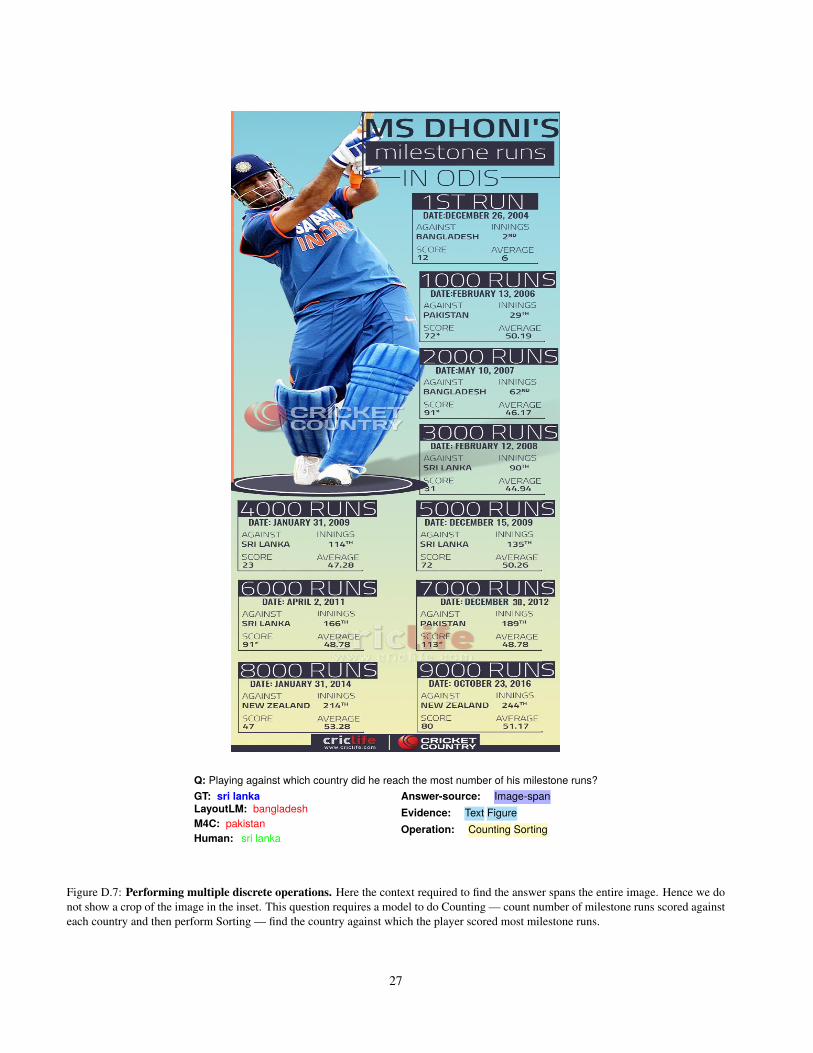
Q: Playing against which country did he reach the most number of his milestone runs?GT: sri lankaLayoutLM: bangladeshM4C: pakistanHuman: sri lanka
Answer-source: Image-spanEvidence: Text FigureOperation: Counting Sorting
Figure D.7: Performing multiple discrete operations. Here the context required to find the answer spans the entire image. Hence we donot show a crop of the image in the inset. This question requires a model to do Counting — count number of milestone runs scored againsteach country and then perform Sorting — find the country against which the player scored most milestone runs.
27