Embed Size (px)
Citation preview

Information and risk perception: Evidence from a randomized experiment
Sonia Akter Lee Kuan Yew School of Public Policy National University of Singapore
Research Questions
Lack of concern about the negative impacts of climate change acts as a barrier to adaptation
How people’s risk perception can be shifted? Can information work as a catalyst?
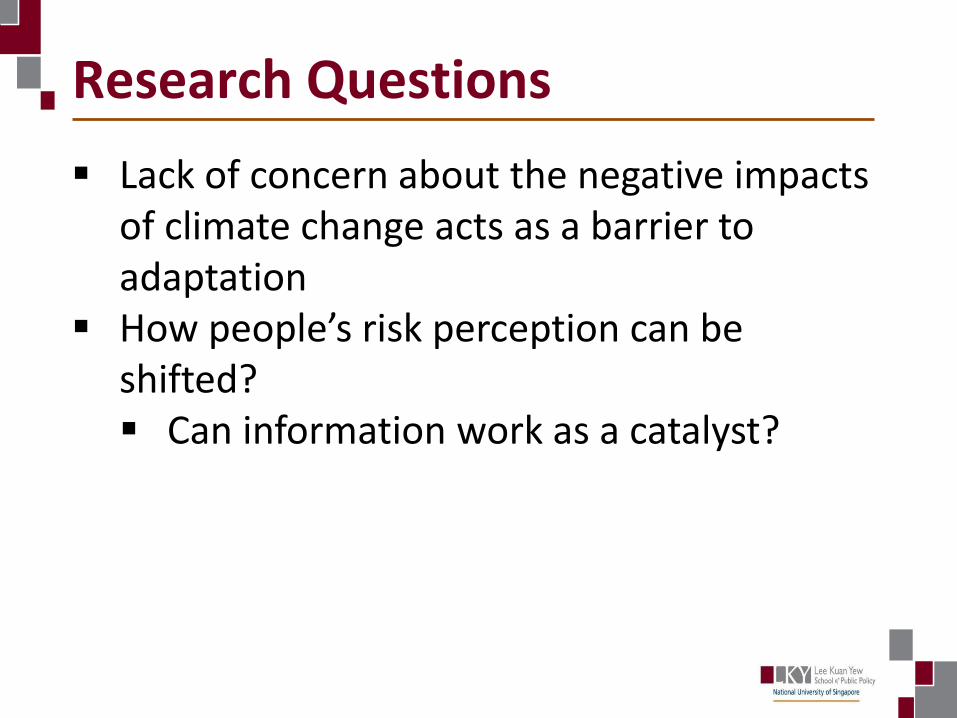
Study Area: Barguna District
District
5 Sub-District
18 Unions
50 Villages
121 Hamlets
408 Households
Primary male/female
Randomly selected
Randomly selected
Randomly selected
Randomly selected by tossing a coin
Randomly selected
A household survey was conducted in Barguna district from April to May 2016
Treatment Control
Information on CC NO Information on CC

The Treatment Card 1
Card 2
Card 3

• Two separate questionnaires were designed
• Treatment and Control questionnaires were same in all respects except for the section on CC information
• The treatment questionnaire was accompanied by an information booklet
• Each enumerator was given a set of questionnaires in random order
• After the selection of the respondent during the field interview, the enumerator randomly chose a questionnaire from the available set
Randomization Process


1. Concern about the harmful impacts of climate change • Do you worry or are you concerned about the harmful impacts
of climate change on your life and livelihood? (1=no or slightly worried; 2=moderately worried; 3=very or extremely worried)
2. Concern about the harmful impacts of cyclone • Do you worry or are you concerned about the harmful impacts
of cyclone on your life and livelihood? (1=no or slightly worried; 2=moderately worried; 3=very or extremely worried)
3. Likelihood of future cyclone • How frequently do you think a cyclone like Sidr might take
place in your area in the future? Once every ________ year • 68% replied “I don’t know”
Outcome Variables (1)
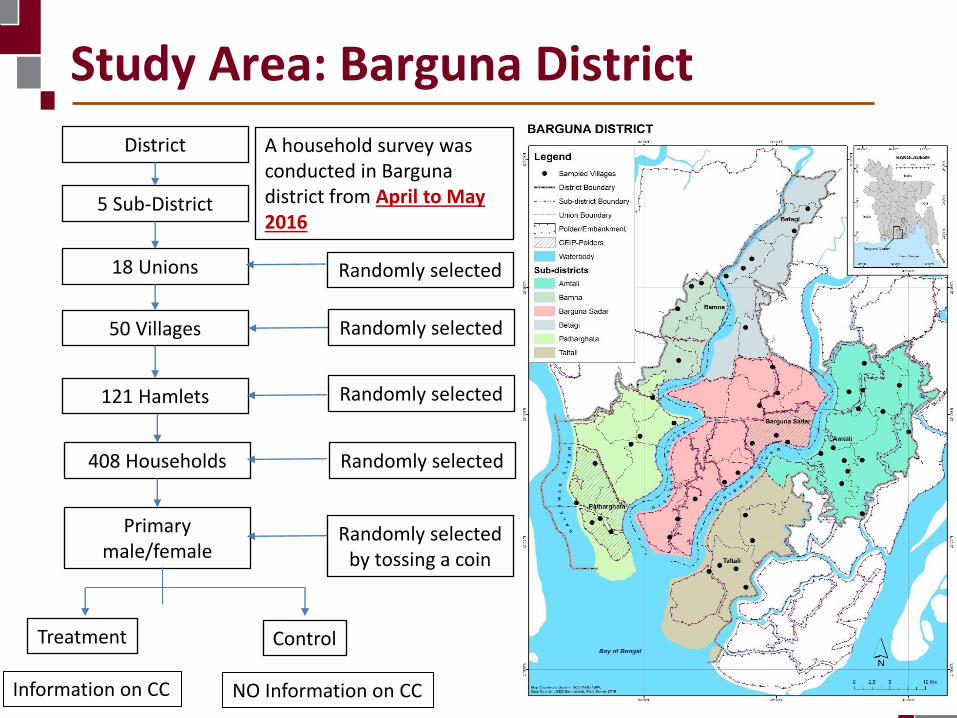
4. Change in the extent of salinity intrusion • What percentage of your cultivable land will be unusable due to
salinity intrusion in 10 years from now?______%
• Perceived change in salinity intrusion in farmland in 10 years from now
• Difference between perceived proportion minus current proportion
• 1 If perceived is greater than current
• 0 if perceived is less than or equal to current
Outcome Variables (2)
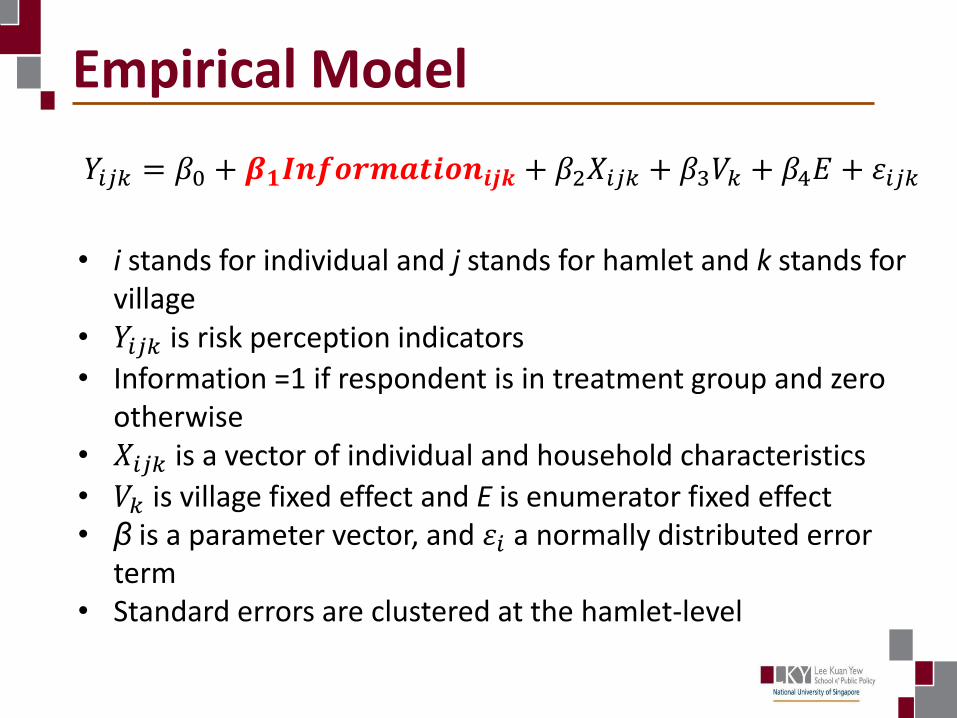
Empirical Model
𝑌𝑖𝑗𝑘 = 𝛽0 + 𝜷𝟏𝑰𝒏𝒇𝒐𝒓𝒎𝒂𝒕𝒊𝒐𝒏𝒊𝒋𝒌 + 𝛽2𝑋𝑖𝑗𝑘 + 𝛽3𝑉𝑘 + 𝛽4𝐸 + 𝜀𝑖𝑗𝑘
• i stands for individual and j stands for hamlet and k stands for
village • 𝑌𝑖𝑗𝑘 is risk perception indicators
• Information =1 if respondent is in treatment group and zero otherwise
• 𝑋𝑖𝑗𝑘 is a vector of individual and household characteristics
• 𝑉𝑘 is village fixed effect and E is enumerator fixed effect • β is a parameter vector, and 𝜀𝑖 a normally distributed error
term • Standard errors are clustered at the hamlet-level

Regression Results (1): Climate Change
CC Risk Perception Indicators Coeff (SE)
Information 0.31**
(0.15) Enumerator fixed effects
Village fixed effects Y
Individual characteristics Y
Household characteristics Y
N 397
Pseudo R2 0.23 Notes:
• Ordered probit model.
• Dependent variable=CC risk perception: 1=not at all or slightly
worried; 2=moderately worried; 3=extremely worried
• Robust standard errors clustered at the hamlet level are reported in
parentheses.
• p<0.01***, p<0.05**, p<0.10*
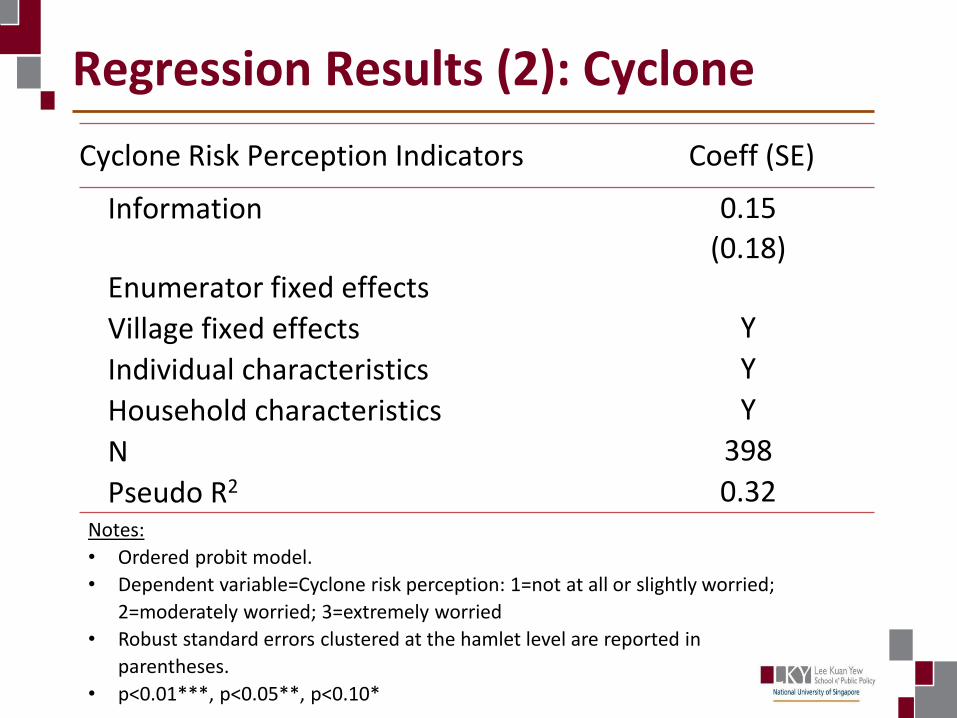
Regression Results (2): Cyclone
Cyclone Risk Perception Indicators Coeff (SE)
Information 0.15
(0.18) Enumerator fixed effects
Village fixed effects Y
Individual characteristics Y
Household characteristics Y
N 398
Pseudo R2 0.32 Notes:
• Ordered probit model.
• Dependent variable=Cyclone risk perception: 1=not at all or slightly worried;
2=moderately worried; 3=extremely worried
• Robust standard errors clustered at the hamlet level are reported in
parentheses.
• p<0.01***, p<0.05**, p<0.10*
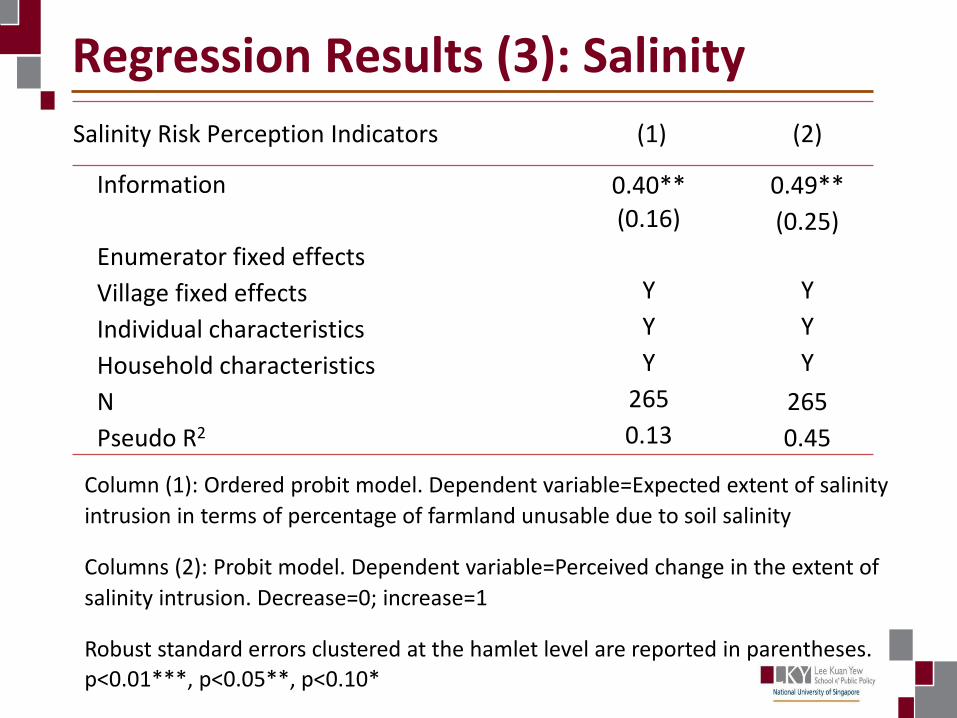
Regression Results (3): Salinity
Salinity Risk Perception Indicators (1) (2)
Information 0.40** 0.49**
(0.16) (0.25)
Enumerator fixed effects
Village fixed effects Y Y
Individual characteristics Y Y
Household characteristics Y Y
N 265 265
Pseudo R2 0.13 0.45
Column (1): Ordered probit model. Dependent variable=Expected extent of salinity
intrusion in terms of percentage of farmland unusable due to soil salinity
Columns (2): Probit model. Dependent variable=Perceived change in the extent of
salinity intrusion. Decrease=0; increase=1
Robust standard errors clustered at the hamlet level are reported in parentheses.
p<0.01***, p<0.05**, p<0.10*

Conclusions
• Exposure to information can shift risk perceptions about CC [at least temporarily]
• Measuring risk perception is challenging • Small sample size is a limitation of the study • Future research needs to be carried out:
• Large sample size • Temporary vs permanent shift