Embed Size (px)
Citation preview
Information Brief: Surveillance of Vector-borne Disease in the
U.S. MilitaryAsha Riegodedios
Staff EpidemiologistNavy and Marine Corps Public Health Center
[email protected] x3048
The views expressed in this presentation are those of the author and do not necessarily reflect the official policy or position of the Department of the Navy, Department of Defense, or the U. S.
Government.
Objectives
• Why do we do surveillance
• How do we do surveillance
• Malaria burden in the DOD/DON
• Lyme Disease burden in the DOD/DON
• Conclusion
Surveillance – Why do we do it
• For situational awareness locally and up the chain
• To inform decisions
• To support changes in intervention, treatment, control, and policy
• To enlist assistance as needed beyond already existing published resources
• SOFA agreements
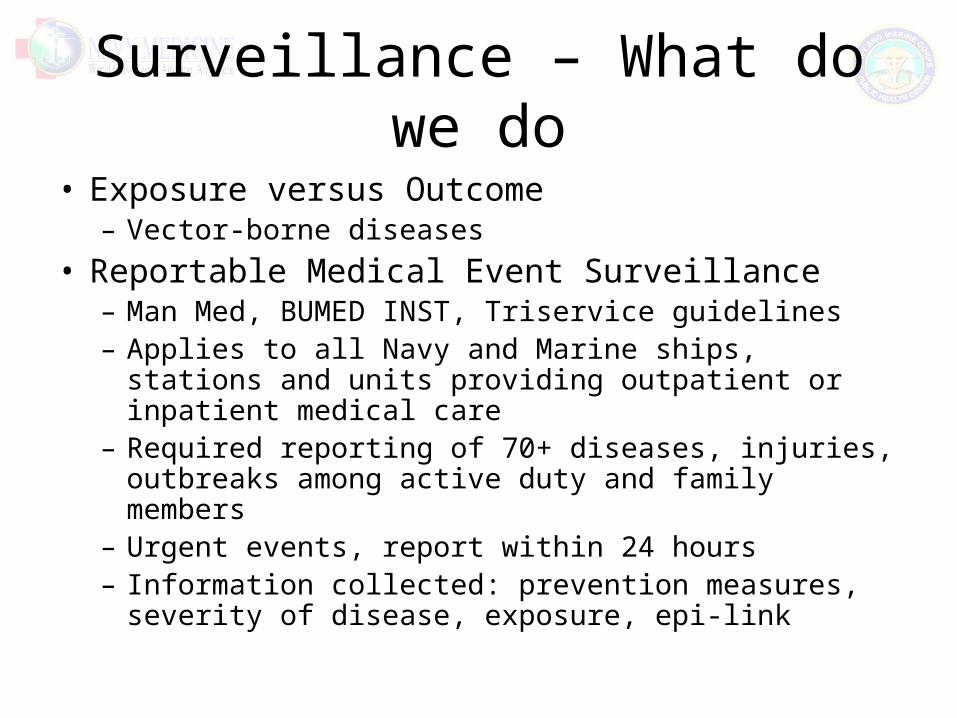
Surveillance – What do we do
• Exposure versus Outcome– Vector-borne diseases
• Reportable Medical Event Surveillance– Man Med, BUMED INST, Triservice guidelines – Applies to all Navy and Marine ships, stations and
units providing outpatient or inpatient medical care– Required reporting of 70+ diseases, injuries,
outbreaks among active duty and family members– Urgent events, report within 24 hours– Information collected: prevention measures, severity
of disease, exposure, epi-link
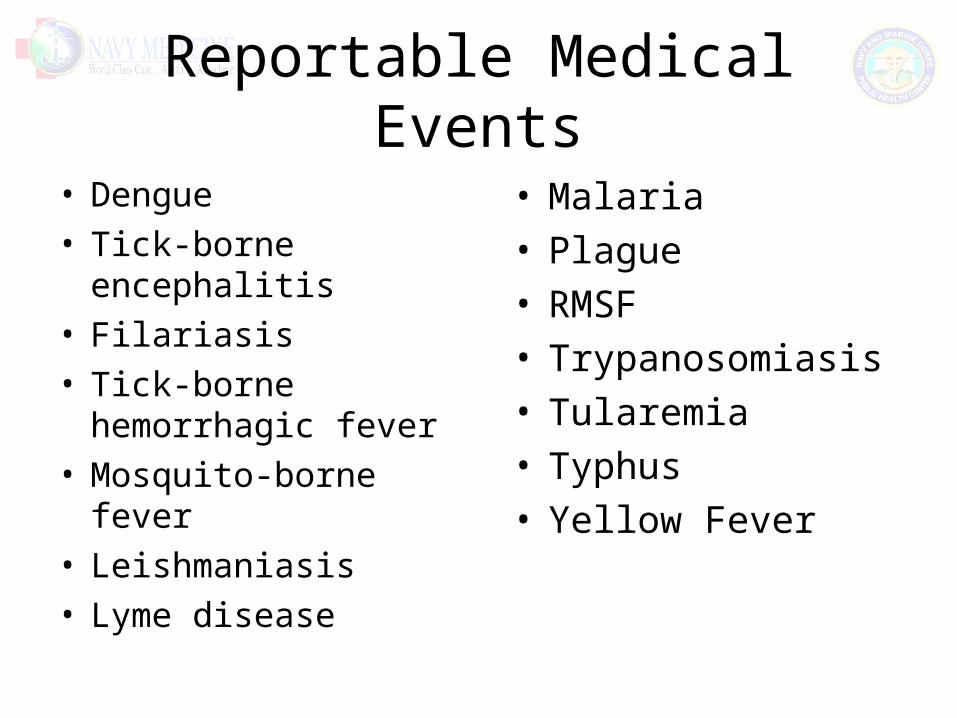
Reportable Medical Events
• Dengue• Tick-borne encephalitis• Filariasis• Tick-borne
hemorrhagic fever• Mosquito-borne fever• Leishmaniasis• Lyme disease
• Malaria• Plague• RMSF• Trypanosomiasis• Tularemia• Typhus• Yellow Fever
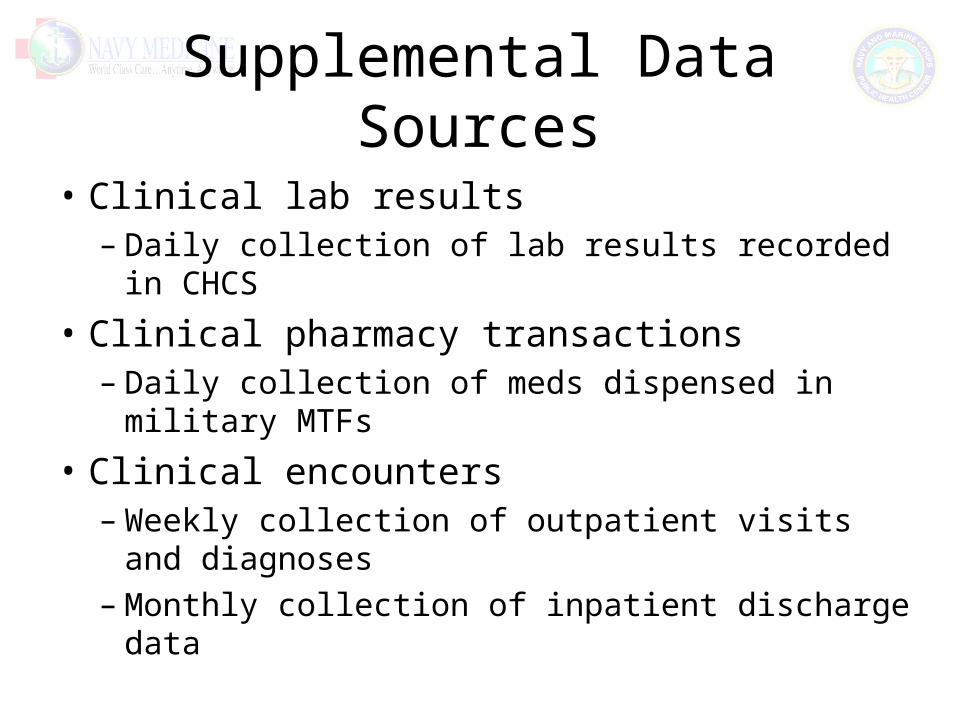
Supplemental Data Sources
• Clinical lab results– Daily collection of lab results recorded in CHCS
• Clinical pharmacy transactions– Daily collection of meds dispensed in military
MTFs
• Clinical encounters– Weekly collection of outpatient visits and
diagnoses– Monthly collection of inpatient discharge data

Malaria
Seeing a shift in disease burden over time
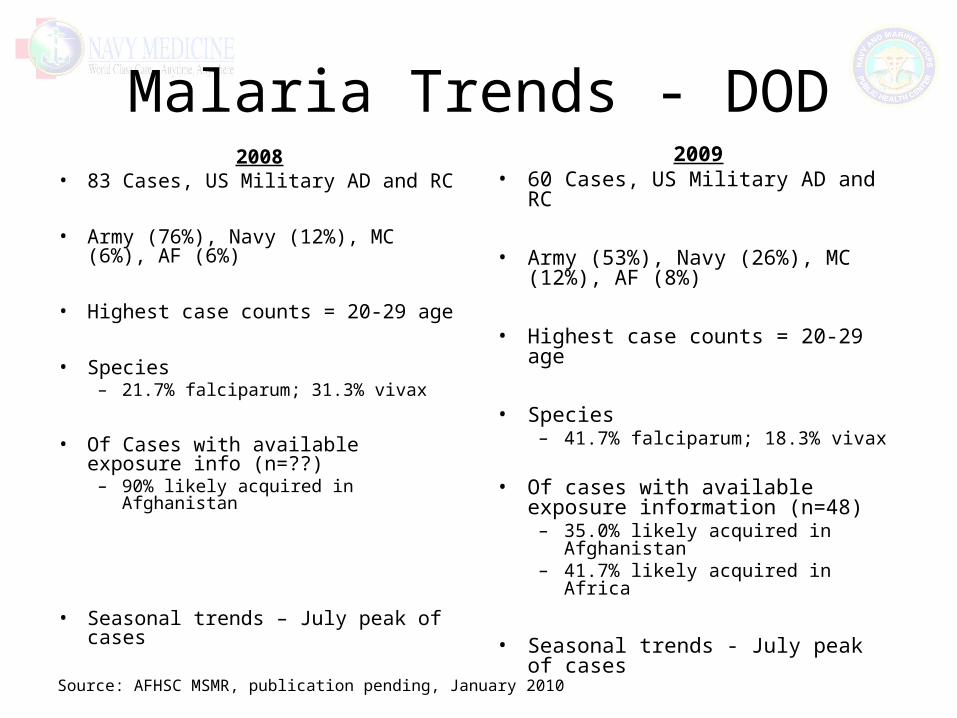
Malaria Trends - DOD2008
• 83 Cases, US Military AD and RC
• Army (76%), Navy (12%), MC (6%), AF (6%)
• Highest case counts = 20-29 age
• Species– 21.7% falciparum; 31.3% vivax
• Of Cases with available exposure info (n=??)
– 90% likely acquired in Afghanistan
• Seasonal trends – July peak of cases
2009• 60 Cases, US Military AD and RC
• Army (53%), Navy (26%), MC (12%), AF (8%)
• Highest case counts = 20-29 age
• Species– 41.7% falciparum; 18.3% vivax
• Of cases with available exposure information (n=48)
– 35.0% likely acquired in Afghanistan
– 41.7% likely acquired in Africa
• Seasonal trends - July peak of cases
Source: AFHSC MSMR, publication pending, January 2010
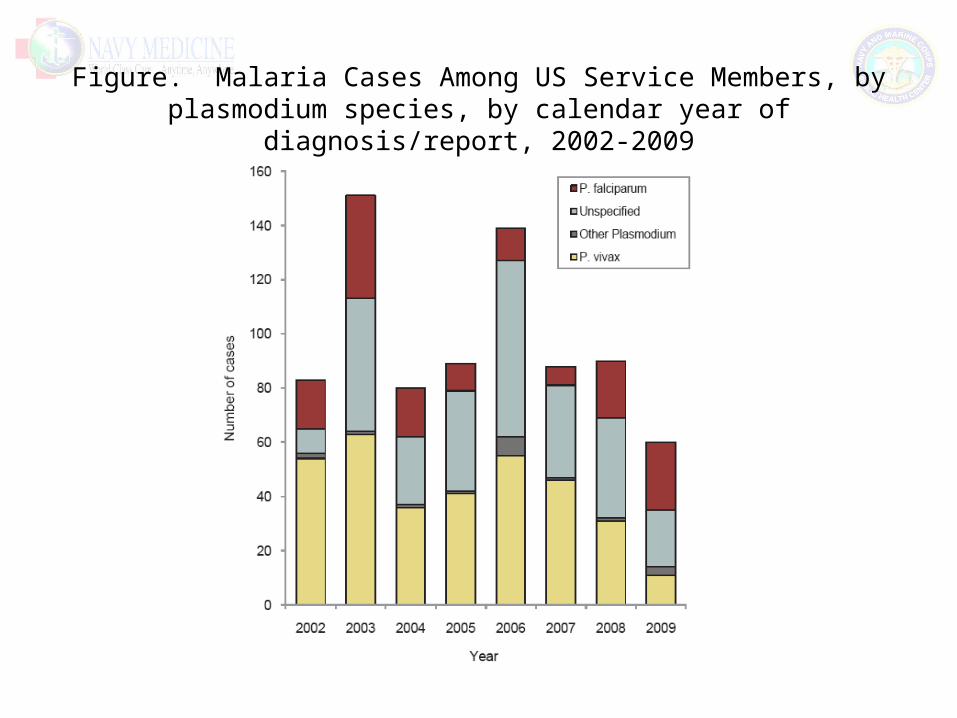
Figure. Malaria Cases Among US Service Members, by plasmodium species, by calendar year of diagnosis/report, 2002-2009
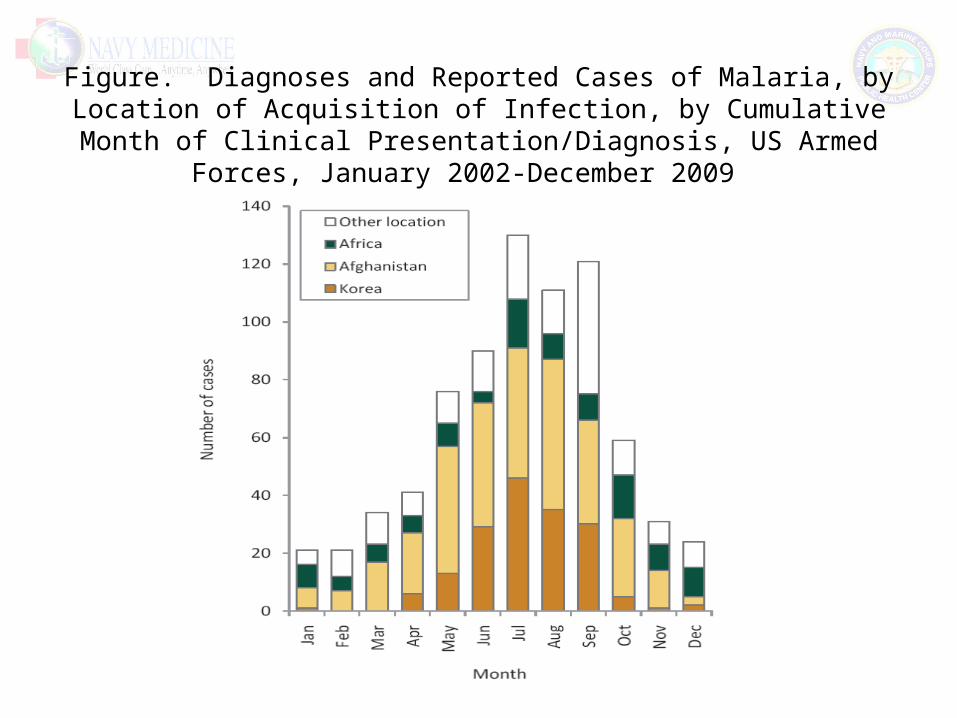
Figure. Diagnoses and Reported Cases of Malaria, by Location of Acquisition of Infection, by Cumulative Month of Clinical
Presentation/Diagnosis, US Armed Forces, January 2002-December 2009
Malaria Trends - Afghanistan
• Exposure in Afghanistan continues to occur
• 336 cases, US Military, 2002-2008
• Highest case counts among 20-29 age group
• Majority of cases were Army (90.5%)
• Breakout by occupational specialty
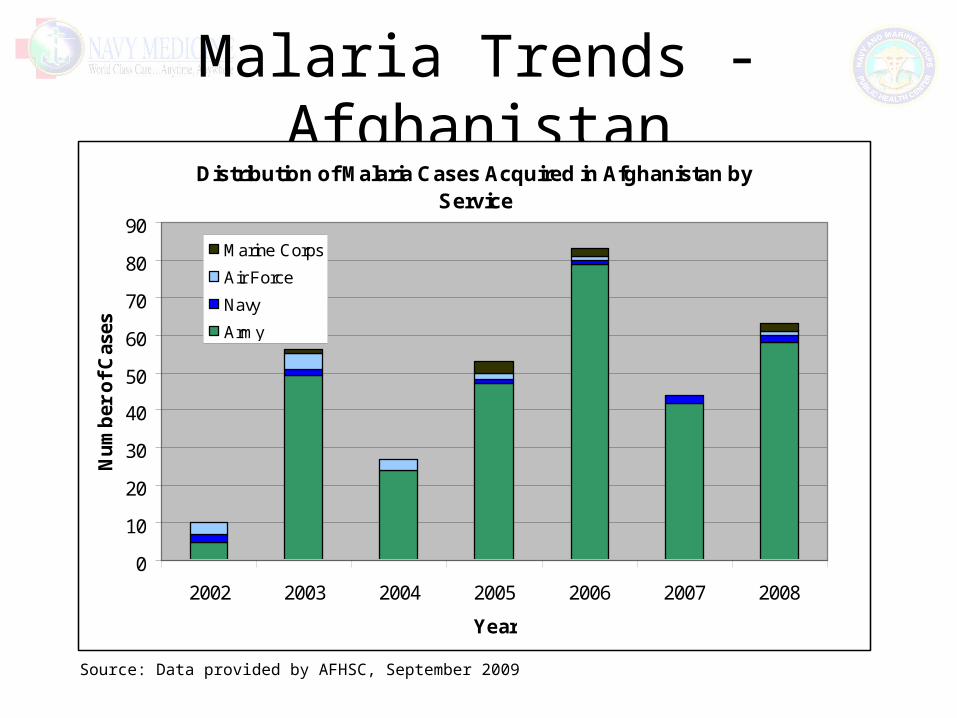
Malaria Trends - AfghanistanDistribution of Malaria Cases Acquired in Afghanistan by
Service
0
10
20
30
40
50
60
70
80
90
2002 2003 2004 2005 2006 2007 2008
Year
Nu
mb
er o
f C
ases
Marine Corps
Air Force
Navy
Army
Source: Data provided by AFHSC, September 2009
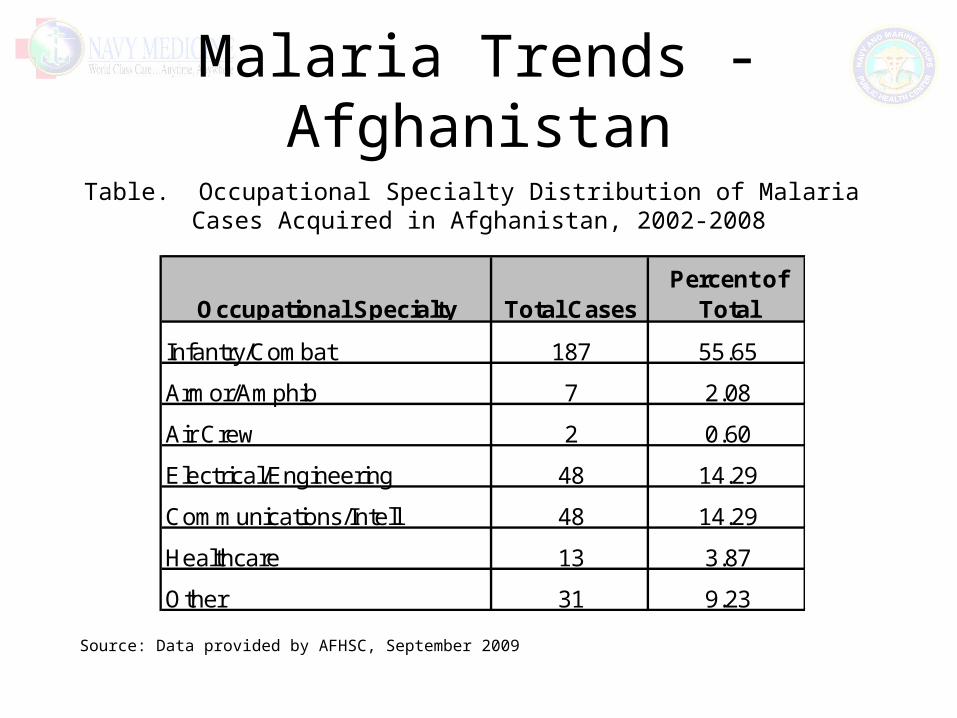
Malaria Trends - Afghanistan
Occupational Specialty Total CasesPercent of
Total
Infantry/Combat 187 55.65
Armor/Amphib 7 2.08
Air Crew 2 0.60
Electrical/Engineering 48 14.29
Communications/Intell 48 14.29
Healthcare 13 3.87
Other 31 9.23
Table. Occupational Specialty Distribution of Malaria Cases Acquired in Afghanistan, 2002-2008
Source: Data provided by AFHSC, September 2009
Malaria Trends – Navy/MC
• 73 cases, Active Duty, 2005-2009– 7 to 19 cases per year– Rate: 1-6 cases per 100,000 persons per year
• Marine Corps showed higher rates than Navy 2005-2007• Navy showed higher rates than Marine Corps 2008 & 2009• Rates were highest among persons age 40 and older• Species
– 30% unknown– 47% falciparum; 20% vivax; 4% ovale
• Of cases with available exposure information (n=30)– 53% were duty related– 63% were likely acquired in Africa
• Seasonal trends not readily apparent
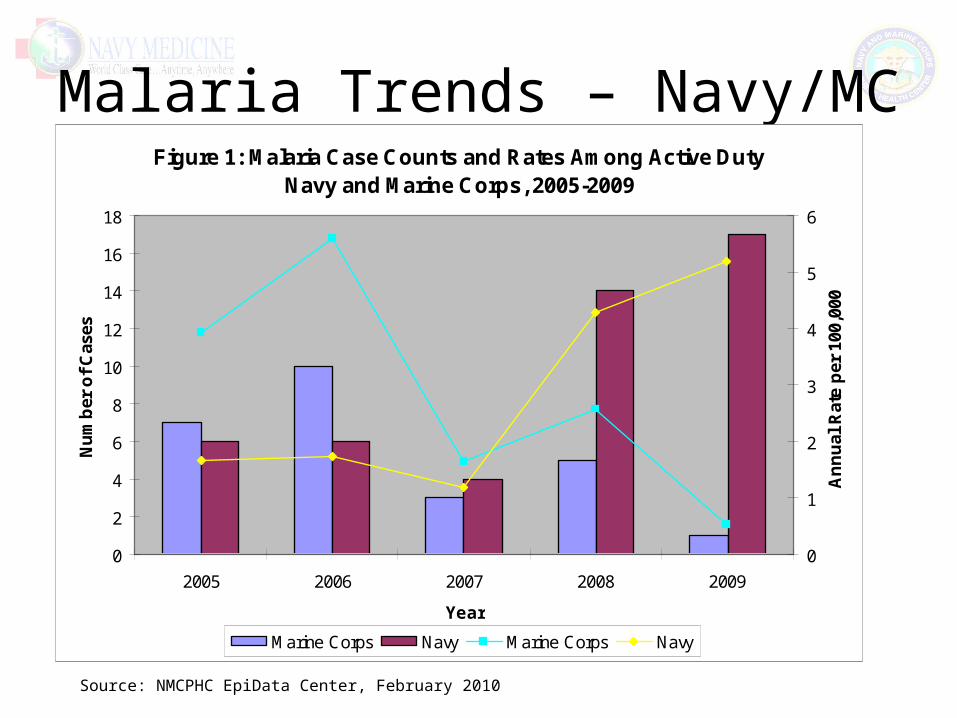
Malaria Trends – Navy/MC
Source: NMCPHC EpiData Center, February 2010
Figure 1: Malaria Case Counts and Rates Among Active Duty Navy and Marine Corps, 2005-2009
0
2
4
6
8
10
12
14
16
18
2005 2006 2007 2008 2009
Year
Nu
mb
er o
f C
ases
0
1
2
3
4
5
6
An
nu
al R
ate
per
100
,000
Marine Corps Navy Marine Corps Navy
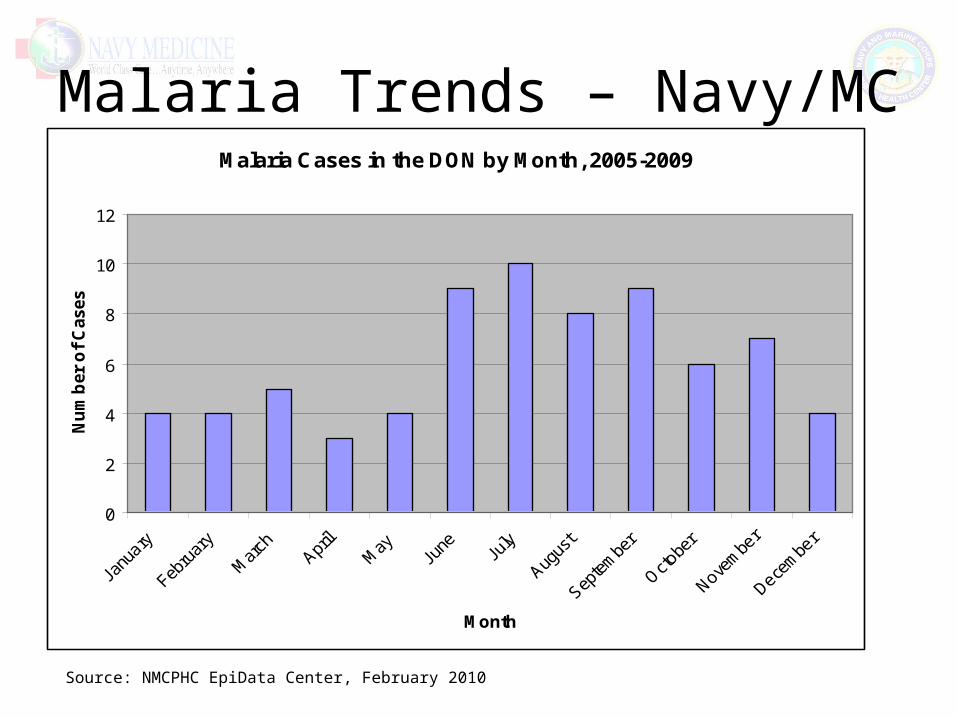
Malaria Trends – Navy/MC
Source: NMCPHC EpiData Center, February 2010
Malaria Cases in the DON by Month, 2005-2009
0
2
4
6
8
10
12
Month
Nu
mb
er o
f C
ases
Lyme Disease
• Difficult disease to monitor due to non-specific clinical presentation and laboratory testing
• Estimated burden of disease is not easily attainable
• Trends over time are the focus of our surveillance analyses
Lyme Disease Trends - DOD
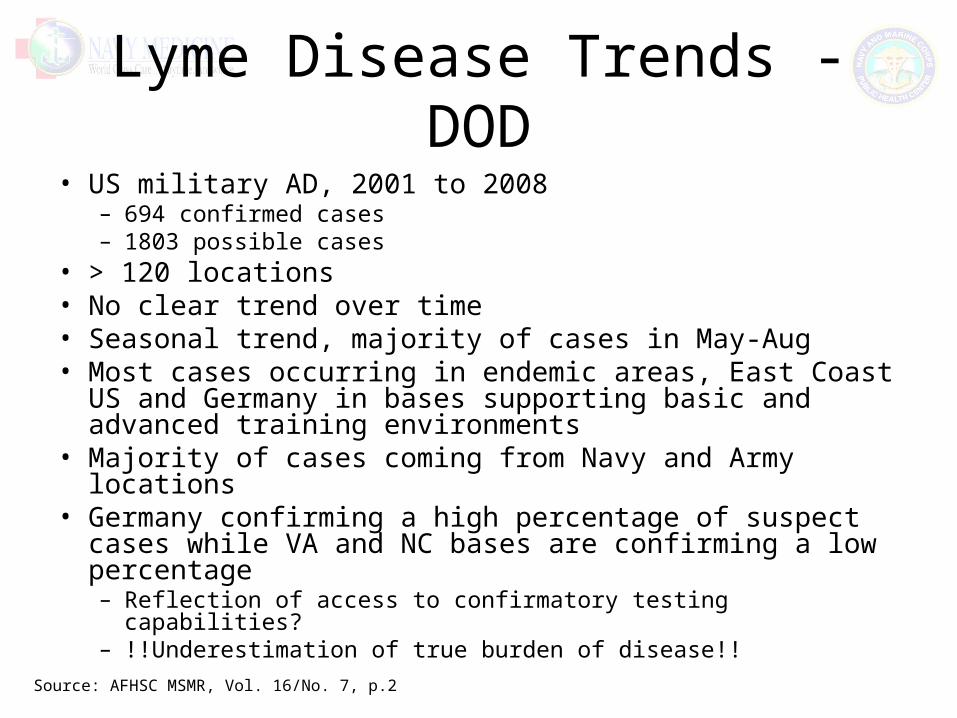
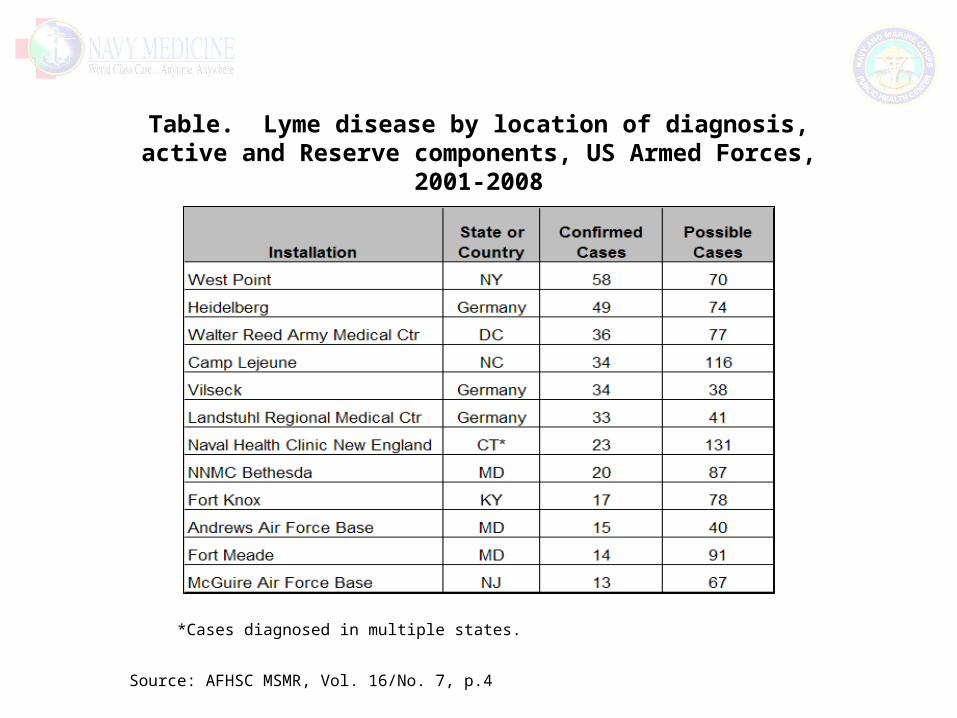
• US military AD, 2001 to 2008– 694 confirmed cases– 1803 possible cases
• > 120 locations • No clear trend over time• Seasonal trend, majority of cases in May-Aug• Most cases occurring in endemic areas, East Coast US
and Germany in bases supporting basic and advanced training environments
• Majority of cases coming from Navy and Army locations• Germany confirming a high percentage of suspect cases
while VA and NC bases are confirming a low percentage– Reflection of access to confirmatory testing capabilities?– !!Underestimation of true burden of disease!!
Source: AFHSC MSMR, Vol. 16/No. 7, p.2
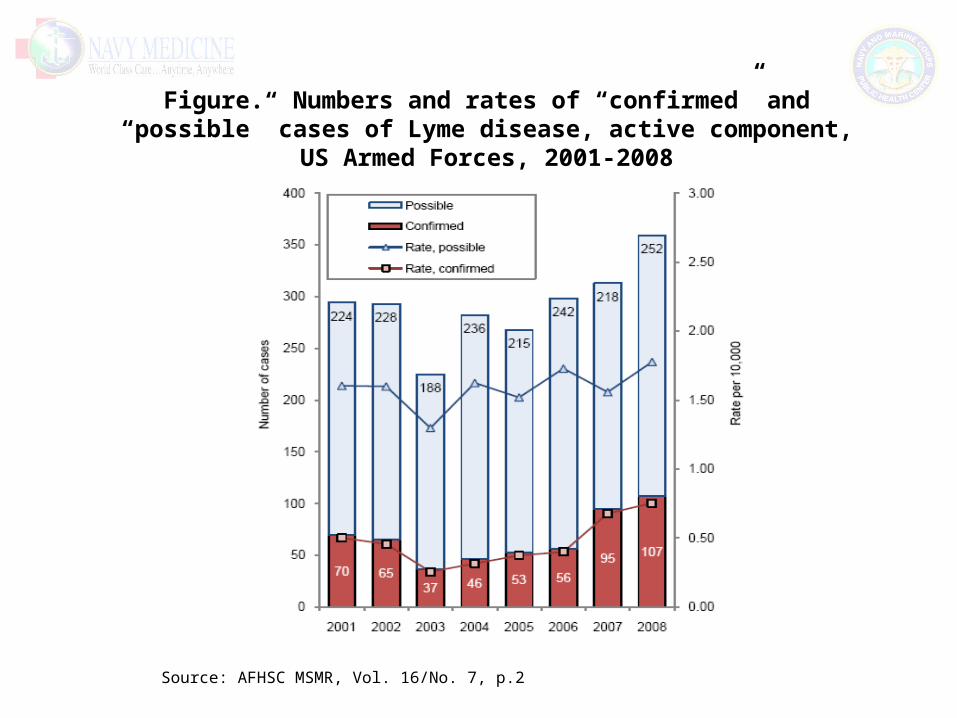
Source: AFHSC MSMR, Vol. 16/No. 7, p.2
Figure. Numbers and rates of “confirmed” and “possible” cases of Lyme disease, active component, US Armed Forces, 2001-2008
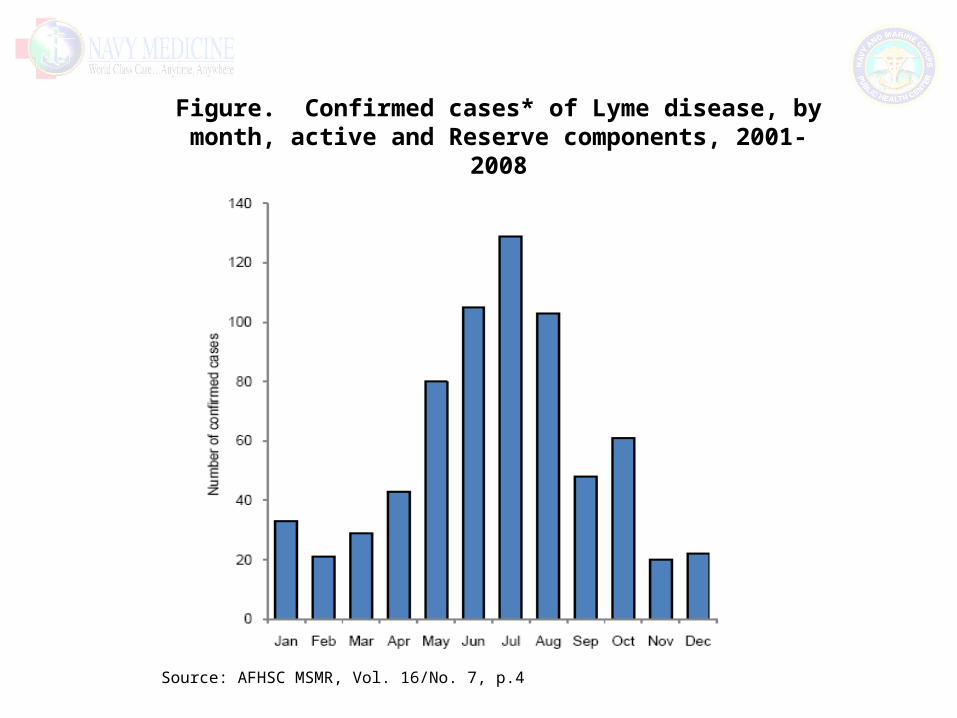
Source: AFHSC MSMR, Vol. 16/No. 7, p.4
Figure. Confirmed cases* of Lyme disease, by month, active and Reserve components, 2001-2008
Source: AFHSC MSMR, Vol. 16/No. 7, p.4
Table. Lyme disease by location of diagnosis, active and Reserve components, US Armed Forces, 2001-2008
*Cases diagnosed in multiple states.
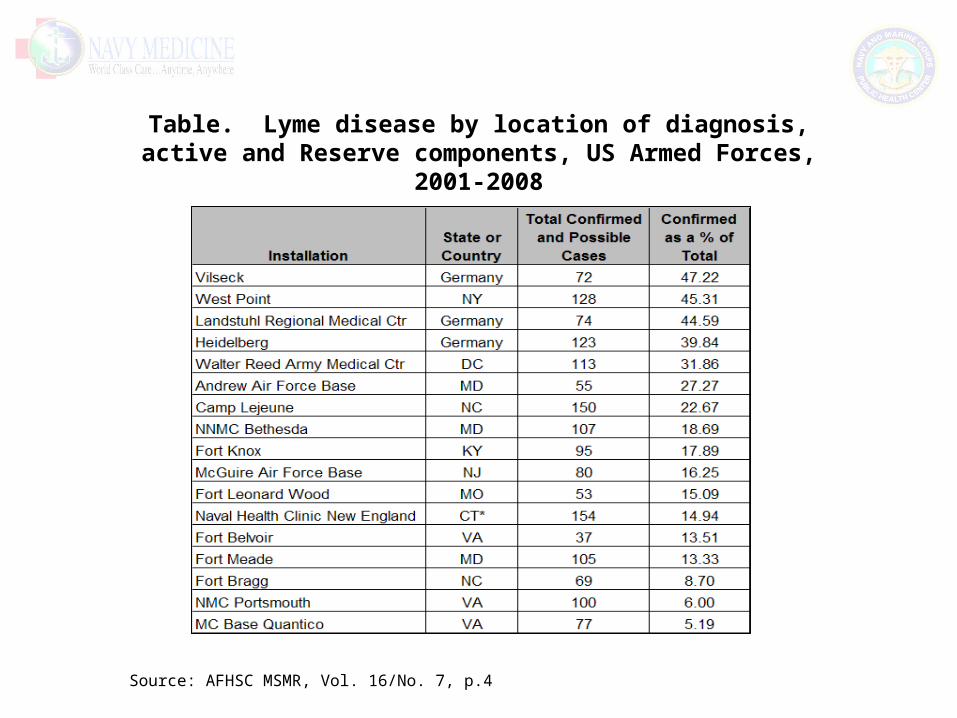
Source: AFHSC MSMR, Vol. 16/No. 7, p.4
Table. Lyme disease by location of diagnosis, active and Reserve components, US Armed Forces, 2001-2008
Lyme Disease Trends – Navy/MC
• 2335 cases, DON ben, 2004-Oct 2009• Bencat
– 35% Active Duty– 2% Recruit/Cadet– 63% are family, retirees, and others
• Seasonal trend, peak in Jun-Jul• San Diego CA among the top three
facilities diagnosing lyme dz, yet biggest burden of dz is seen in East US
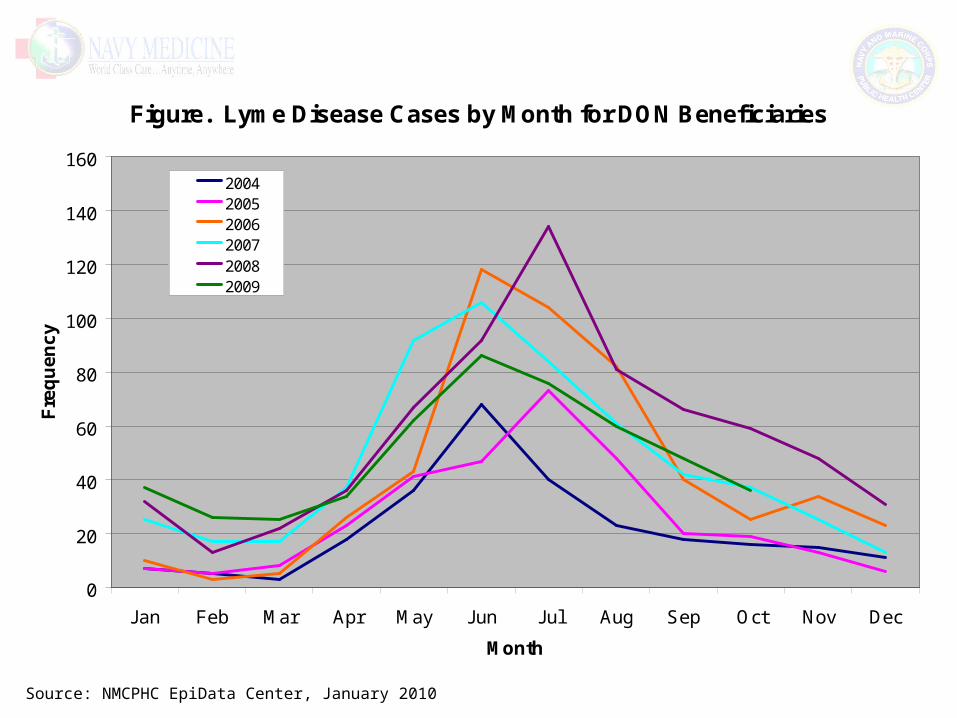
Source: NMCPHC EpiData Center, January 2010
Figure. Lyme Disease Cases by Month for DON Beneficiaries
0
20
40
60
80
100
120
140
160
Jan Feb Mar Apr May Jun Jul Aug Sep Oct Nov Dec
Month
Fre
qu
en
cy
200420052006200720082009
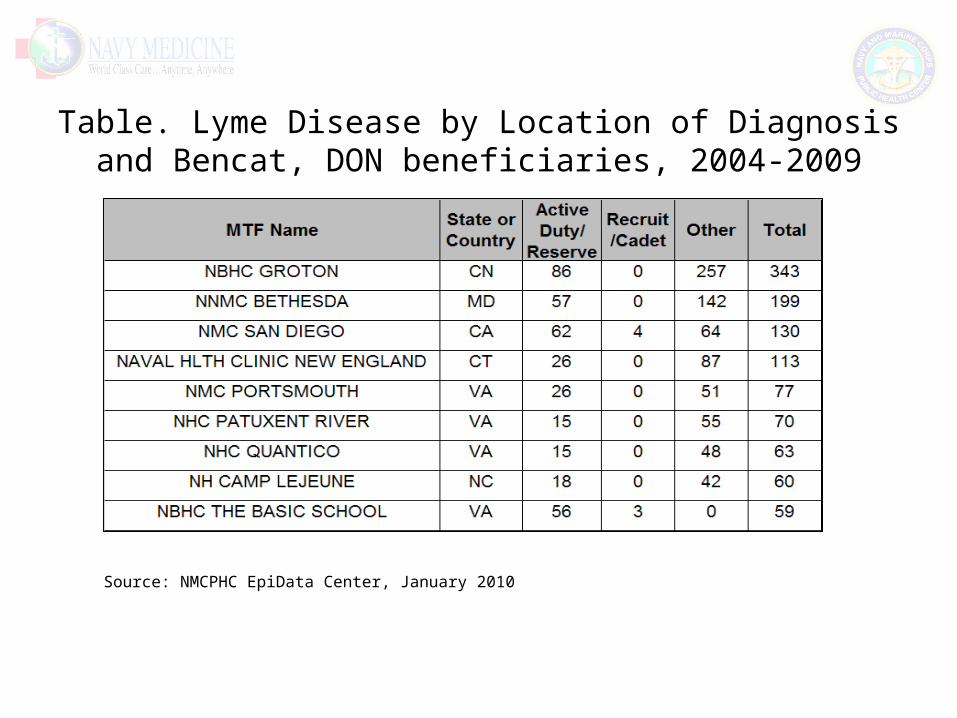
Table. Lyme Disease by Location of Diagnosis and Bencat, DON beneficiaries, 2004-2009
Source: NMCPHC EpiData Center, January 2010
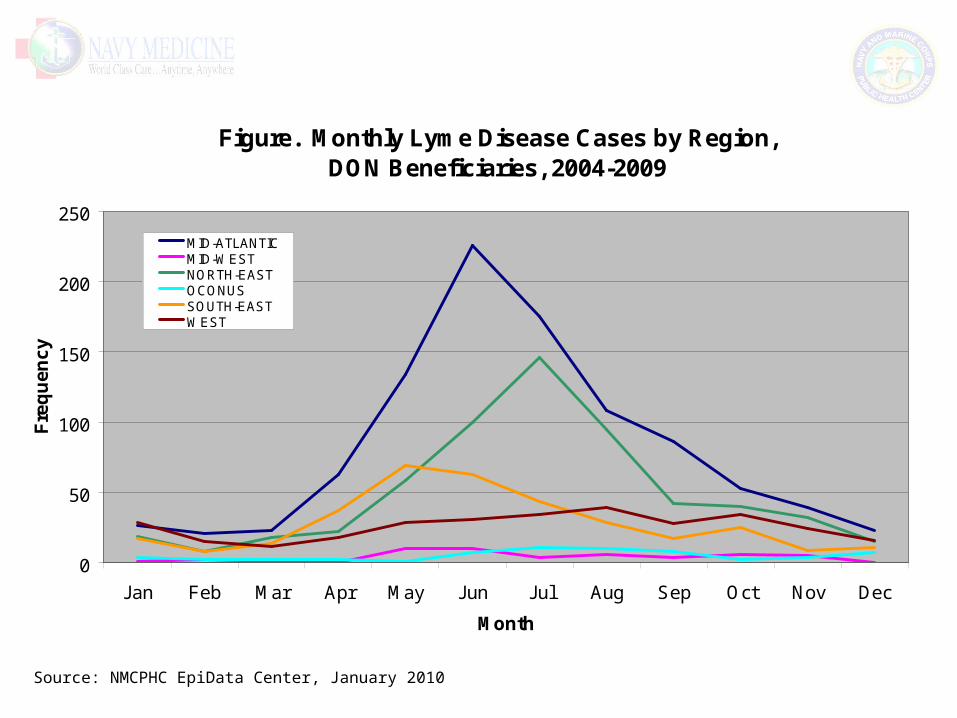
Figure. Monthly Lyme Disease Cases by Region, DON Beneficiaries, 2004-2009
0
50
100
150
200
250
Jan Feb Mar Apr May Jun Jul Aug Sep Oct Nov Dec
Month
Fre
qu
en
cy
MID-ATLANTICMID-WESTNORTH-EASTOCONUSSOUTH-EASTWEST
Source: NMCPHC EpiData Center, January 2010
Conclusions
• Surveillance data coupled with existing data sources provide good idea of burden of disease
• Can and is being used to inform leadership decisions• Malaria burden in the DOD is shifting
– Decrease in Korea acquired cases while Afghanistan acquired cases continue to occur, increase in Africa acquired cases
– While malaria in MC appears to be controlled, Navy malaria burden is increasing, likely attributed to Africa exposure
• Lyme Disease– Clinical course and lack of lab testing present a challenge in
describing burden– Trends using all existing datasources don’t show unexpected
trends

Acknowledgements
• LCDR Brian Prendergast• Mrs. Gosia Nowak• Ms. Ashleigh McCabe• Ms. Jessica Sharkey• Ms. Rosa Ergas• Ms. Laura Horne• Maj Chris Perdue• CDR Annette Von Thun• NMCPHC Epi Data Center staff• AFHSC staff