Embed Size (px)
Citation preview
INFORMATION TECHNOLOGY INFRASTRUCTURE LIBRARY PROBLEM
MANAGEMENT PRACTICES IN HIGHER EDUCATION:
A MATURITY MODEL APPROACH
By
Peter Allyn Jurhs
A thesis
submitted in partial fulfillment
of the requirements for the degree of
Master of Science in Management Information Systems
Boise State University
March 2009
BOISE STATE UNIVERSITY GRADUATE COLLEGE
DEFENSE COMMITTEE APPROVAL
of the thesis submitted by
Peter Allyn Jurhs Thesis Title: Information Technology Infrastructure Library Problem Management Practices in Higher Education: A Maturity Model Approach Defense Date: 19 March 2009 The following individuals have read and discussed the thesis submitted by Peter Allyn Jurhs, and they have deemed it satisfactory for a master’s degree by the proportion of votes designated by the program. Rob Anson, Ph.D. Chair, Supervisory Committee Wita Wojtkowski, Ph.D. Member, Supervisory Committee Sharon Tabor, Ph.D. Member, Supervisory Committee

iii
DEDICATION
For my wonderfully supportive and understanding family: Adria, Grace, and Brock
iv
ACKNOWLEDGEMENTS
This work would not have been possible without the guidance, structure, and
insight from my advisor, Dr. Rob Anson. Committee Members, Dr. Sharon Tabor’s and
Dr. Wita Wojtkowski’s, assistance and input was invaluable throughout the process of
completing my thesis.
A special thank you must go to my wife for proof reading the numerous revisions.
It was a daunting task which she took on with grace. She proved to be extremely helpful.
Also, I must thank Arnie Olsen, my father-in-law, for proof reading a draft of my thesis.
My co-workers at Boise State University provided priceless feedback and input
into the survey design and wording. Their assistance was greatly appreciated.
v
AUTOBIOGRAPHICAL SKETCH OF THE AUTHOR
I grew up in McMinnville, Oregon with my parents and younger brother.
I attended Northwest Nazarene University 1994 to 1998 and received a Bachelors of
Science in Engineering Physics.
After College, I had a few odd jobs including PC manufacturing at Micron
Electronics. In 1999, I started working for MCI Worldcom through a temp agency.
I supported HP Pavilion computers, DeskJet Printers, and early PhotoSmart product.
I continued to work for MCI Worldcom for the next year.
In April of 2000, I was hired as a Technical Support Specialist (TSS) by Boise
State University. As a TSS, I performed first and second level technical support. My
duties included answering phone calls, emails, and resolving issues either over the phone
or by onsite visit.
Just over a year later, I was promoted to Lead TSS. The new duties included
supervising 10 Full-Time TSS staff, 4 to 5 students, and scheduling Help Desk coverage.
Another key aspect of the Lead TSS job is being the technical reference for the TSS,
Student Help Desk staff, and Network Administrators.
In 2005, I began my course work to complete a Masters of Science in
Management Information Systems degree while working full-time for Boise State
University. This thesis is the culmination of my work on this degree.
vi
ABSTRACT
This study addresses the movement from a traditional to an ITSM approach for
Help Desk services in Higher Education. The central goal of the study was the
development of a Problem Management Maturity Model. The Problem Management
Maturity Model was constructed by reviewing the Information Technology Infrastructure
Library Problem Management literature for core components to include in the model.
The data collected from surveys of Help Desk managers was used to place Higher
Education institutions on the specific level of the Problem Management Maturity Model.
Several different hypotheses about predictors for Problem Management maturity were
tested but none proved to successfully predict process maturity. Nevertheless, the
resulting Problem Management Maturity Model can be used to support continuous
process improvement for Problem Management processes.

vii
TABLE OF CONTENTS
DEDICATION ............................................................................................................ iii
ACKNOWLEDGEMENTS ........................................................................................ iv
AUTOBIOGRAPHICAL SKETCH OF THE AUTHOR ........................................... v
ABSTRACT ................................................................................................................ vi
LIST OF TABLES ...................................................................................................... iii
LIST OF FIGURES .................................................................................................... iv
LIST OF ABBREVIATIONS ..................................................................................... v
INTRODUCTION ...................................................................................................... 1
Background ..................................................................................................... 2
Goals for Research Study ................................................................................ 4
LITERATURE REVIEW ........................................................................................... 7
ITIL Component Overview ............................................................................. 7
Review Case Studies on IT Service Operations ............................................. 11
Review of ITIL Related Empirical Studies ..................................................... 12
Review of ITSM Research .............................................................................. 13
Review of Criteria Catalog Analysis .............................................................. 14
Review of Capability Maturity Model Integration ......................................... 16
METHODOLOGY ..................................................................................................... 19
Phase 1: Develop Problem Management Model ............................................. 19
Problem Management Maturity Model ................................................ 20
iv
Phase 2: Refine and Test the Validity of the Problem Management Model ... 22
Phase 3: Survey of Higher Education Institutions .......................................... 22
Limitations of Methodology ........................................................................... 23
RESULTS ................................................................................................................... 22
Response Information ..................................................................................... 22
Results Comparison to the PMM Model ........................................................ 23
Categorical and Overall Maturity Results ........................................... 23
Comparison of Incident and Problem Management Results ............... 25
Maturity Level Results .................................................................................... 26
Mitigating Factors ........................................................................................... 28
Size ...................................................................................................... 29
Support Structure Type ....................................................................... 31
Institution Type ................................................................................... 32
DISCUSSION ............................................................................................................. 33
LIMITATIONS ........................................................................................................... 40
APPLICATION TO PRACTICE ................................................................................ 42
Real World Applications for the PMM Model ............................................... 42
Change Management Introduction ...................................................... 42
Application of Problem Management at Boise State .......................... 43
FUTURE RESEARCH ............................................................................................... 47
WORKS CITED ......................................................................................................... 48
APPENDIX A ............................................................................................................. 52
Criteria for Quality Problem Management
v
APPENDIX B ............................................................................................................. 59
PMM Model Results
APPENDIX C ............................................................................................................. 61
List of Surveyed Organizations
GLOSSARY ............................................................................................................... 63
iii
LIST OF TABLES
Table 1. ITIL Version 3 Processes & Functions ........................................................ 10
Table 2. Example of Manifestation of Criteria Catalog ............................................. 15
Table 3. Population Information on Institution Type and HDI Membership ............ 22
Table 4. Number of Institutions for Student Population ............................................ 22
Table 5. PMM Model Categorical Scores for the Results ......................................... 24
Table 6. Overall Result Scores for Respondents ....................................................... 25
Table 7. Analysis of Variance for Incident Management and Problem Management
Maturity ........................................................................................................... 26
Table 8. Maturity Groupings with Other Factors ....................................................... 27
Table 9. Example Response to Number of Employees by Type ............................... 29
Table 10. Size Divisions per Criteria ......................................................................... 30
Table 11. Problem Process Maturity versus Student Population ............................... 30
Table 12. Problem Process Maturity versus Full Time Equivalent ........................... 31
Table 13. Problem Process Maturity versus Primary Support Center FTE ............... 31
Table 14. Analysis of Variance on Support Organization Type ................................ 32
Table 15. Analysis of Variance on Institution Type .................................................. 32
Table 16. Utilization of CMDB Overall Maturity Results ........................................ 35
Table 17. Analysis of Agree - Disagree Responses ................................................... 37
Table 18. Overall Categorical Scores versus Boise State University’s Scores .......... 45
Table B1. PMM Model Results with Calculations ................................................... 60
iv
LIST OF FIGURES
Figure 1: ITSM Relationship Model .......................................................................... 9
Figure 2. CMMI Maturity Levels .............................................................................. 17
Figure 3. Problem Management Maturity Model ...................................................... 21
Figure 4. Maturity Self Assessment ........................................................................... 28
Figure 5. Histogram of the Entire PMM Model Response Set .................................. 34
Figure 6. Staff Involvement with Problem Management ........................................... 39
v
LIST OF ABBREVIATIONS
Abbreviation Description
CMDB Configuration Management Database
CMM Capability Maturity Model
CMMI Capability Maturity Model Integrated
CMMI-SVC Capability Maturity Model Integrated for Services
HDI Help Desk Institute
HEF Higher Education Forum
ITIL Information Technology Infrastructure Library
ITSM Information Technology Service Management
itSMF Information Technology Service Management Forum
PMM Problem Management Maturity
PDCA Plan-Do-Check-Act
1
INTRODUCTION
Information Technology and business are difficult to align. Why is this so? At
first glance it would seem that this is a frivolous question, however it is the primary
question to be answered by organizations since the early days of electronic computing.
Information Technology Service Management is a philosophy used to manage the
Information Technology within an organization, which, at heart is focused on the
customer’s viewpoint. The aim of Information Technology Service Management (ITSM)
is to assist the Information Technology unit of an organization to better understand the
business. In reverse, ITSM allows the business to leverage its Information Technology
capital to achieve business goals. It is believed that ITSM can align the services provided
by Information Technology and the business itself.
ITSM is a concept for managing Information Technology. The concept is
implemented with a process driven approach and with a keen eye on continually
improving the processes. One process-based framework for developing an ITSM
approach is the Information Technology Infrastructure Library (ITIL). ITIL is one of the
most popular methods for improving services in Europe (Ann, 2007) and has been
gaining popularity in North America.
Both ITSM and ITIL have a very broad focus and impact on the organization.
The general overall impact of implementing ITIL has been thoroughly studied. The
information provided by those studies however, has only considered the whole. This
study considered Problem Management, a specific portion of the foundation for ITIL-
2
based ITSM. Problem Management is interesting because it assists with the
identification of service flaws. These flaws can significantly reduce the usability,
availability, and serviceability for the customer. Problem Management has been typically
considered a bolt-on component to an ITIL implementation, and therefore, it has not been
considered a key component for a process improvement. Nevertheless, it is of interest to
better understand the value proposition provided by Problem Management to the
organization and the other ITIL processes.
Problem Management in Higher Education was selected as the area of focus of
this thesis for two reasons. First, as yet no study of Problem Management had been
undertaken. Higher Education was chosen because of the author’s work experience at a
university (see autobiographical sketch, v). Secondly, a broad but small group of initial
respondents with similar business goals was needed which Higher Education institutions
matched.
Background
Traditional Information Technology (IT) practices are built on a technology and
technology-provider focused approach where the technology and the needs of the IT
department drive the solutions. As IT becomes more and more essential to the
organization, the traditional model fails to serve the strategic needs of the overall
organization. In the book, “Does IT matter?,” Carr (2004) argues that IT is becoming a
commodity within the global economy and is no longer a differentiator between
companies and therefore repeats the same path as railroads, electricity, and highways did
before IT. Therefore, IT is an essential component of business today and is becoming an
3
ordinary but complex utility for the businesses of tomorrow. It is time for the paradigm
of IT in organizations to change to embrace their dependence on IT and work at
developing IT by focusing more on services provided to customers than the technologies
that provide the services.
IT Service Management (ITSM) instead transitions the management of IT from
technology to the services provided to the customer. With ITSM, the business needs
become the driver and the customer becomes the focus. The goal is to align IT and
business strategy, or more optimistically, make IT an enabler of business goals. There is
a strong emphasis upon getting the back-office processes in line to deliver IT services
that support the creation of value within the enterprise. This emphasis continues the
drive towards the commoditization of IT but creates a stronger dependence on the
services provided by IT. As Nicholas Carr (2004) implied, how often does one worry if
the power will be on when the switch is flipped for the light? ITSM supports this
movement in IT by adding a layer of abstraction to the delivery of IT. One should think
of ITSM as picking where the outlets in the wall will be and the types of light fixtures
that will be used. The customer does not care how the power is delivered but simply that
the required service is provided (i.e. it lights the room or runs the dishwasher).
ITSM allows the service provider to provide ubiquitous IT services with an
increased reliability and supportability while working to provide the new services
required by the organization. Let’s consider an example of an IT service that has become
a utility. One of the most universal and mature IT services provided today is email.
Almost everyone has at least one email address. ITSM allows the IT organization to use
4
process and controls to provide the email service either through in-sourcing or
outsourcing. These practices from ITSM allow the support organization, especially a
Help Desk, to focus on the quality of the service. The Help Desk using the framework
provided by ITSM models can work with the service owner to manage change in the
system and provide valued input about problems with the service. A Help Desk, by
tracking information related to the inquiries about the email service, could provide valued
input on the trends in the inquiries to identify potential or existing problems with the
service.
In this scenario, the customer does not care if the email system is Microsoft
Exchange, Google Gmail, or Novell GroupWise but only that the email messages are
delivered. Additionally, a customer cares that they can report an issue with service and
that the customer’s expectations (as set by the Help Desk) are met 100% of the time.
Using ITSM to reduce the inconsistency in language between IT and the business
improves communication. The improved communication and realistic expectations set
by ITSM can allow the organization to focus on either enhancing existing services (i.e.
adding automated distribution of reports from an ERP system via email) or developing
new services to meet the business’ requirements.
Goals for Research Study
This study addresses the movement from a traditional to an ITSM approach for
Help Desk services in Higher Education. To the extent that implementing prescribed
ITSM practices will benefit an organization, there must be some means to determine the
extent of ITSM implementation. This research proposes and tests a maturity scale for
5
organizations implementing ITSM in terms of core best practices drawn from the ITIL
framework for ITSM. Using the ITIL framework, the research examines the Problem
Management process at a practical level with a special focus placed on the Help Desk
services viewpoint. The examination of Problem Management was accomplished by
surveying Help Desk Managers at a sampling of Higher Education institutions.
The creation and testing of a practical model for Problem Management for smaller
organizations (10,000 to 20,000 students), is an outcome of the research. The goals of
this research project are:
• To build a method to assess the extent of implementing ITIL Problem
Management best practices
• Prioritize practices to implement which will increase best practice alignment
• Provide a resource for even the smallest organizations to enter into ITIL and
continue to improve.
In the real world, implementing all aspects of ITIL is a costly and difficult undertaking
for even the largest institution. This study hopes to eliminate some of the barriers to
getting the most out of the institution’s ITSM investment.
The research has put some real world information about using ITIL Problem
Management process framework in the hands of the decision makers, especially Help
Desk managers. Armed with this real world information about Problem Management in
Higher Education the decision makers can make timely corrections or additions to their
Problem Management processes that have a significant positive impact on the process.
6
Problem Management at higher education institutions, in the Help Desk or
Customer/User Support departments, is of primary interest for the study. Higher
education institutions must support diverse IT infrastructures usually with very limited
resources. These constraints require IT departments to find creative ways to improve
services. Problem Management may provide the best possible opportunity for return on
investment without significant expenditures on tools or other systems to support ITSM.
7
LITERATURE REVIEW
Research literature on ITSM, ITIL, and IT operations is varied in context and
focus. The literature covers six distinct areas: an ITIL component overview, case studies
(on IT operations), empirical studies, a review of the state of ITSM Service Operation
research, a review of the criteria catalog approach, and a review of Capability Maturity
Model Integration (CMMI).
ITIL Component Overview
There are various open and proprietary frameworks to build an ITSM approach,
such as Capability Maturity Model Integration (CMMI), Control Objectives for
Information and related Technology (COBIT), and Microsoft Operations Framework
(MOF). However, the most widely applied framework is Information Technology
Infrastructure Library (ITIL), currently in version 3 (ITILv3). The reason is this: ITILv3
provides a best practice-based framework to implement, operate, support, and improve IT
services. The British Office of Government Commerce originally developed ITIL (Tan,
Cater-Steel, Toleman, & Seaniger, 2007). The IT Service Management Forum (itSMF)
coordinated the update to version 3 of ITIL (Bon, et al. 2007).
ITIL is a conceptual framework - it does not prescribe how to perform a certain
process. “ITIL books are descriptive not prescriptive, meaning they focus on processes
and organizational structures that have been shown to be effective, rather than offering
instructions on how to implement these practices” (Flora, 2008). This aspect of ITIL
8
makes it difficult for an organization to determine both what practical process to put in
place and to what extent it has been successful in implementing the best practice.
ITIL has been used to build British Standard BSI 15000, which was in turn used
to build the International Organization for Standardization ISO 20000 standard. ISO
standards propose a compliance-based approach to ITSM with strong alignment to ITIL.
“Indeed, as the ITIL represents best practice, rather than a formal specification it is not
meaningful to claim ‘compliance’, due to the wide interpretation that this could possibly
mean” (Breslin, 2004). The compliance requirements for these standards are well outside
the scope of this research.
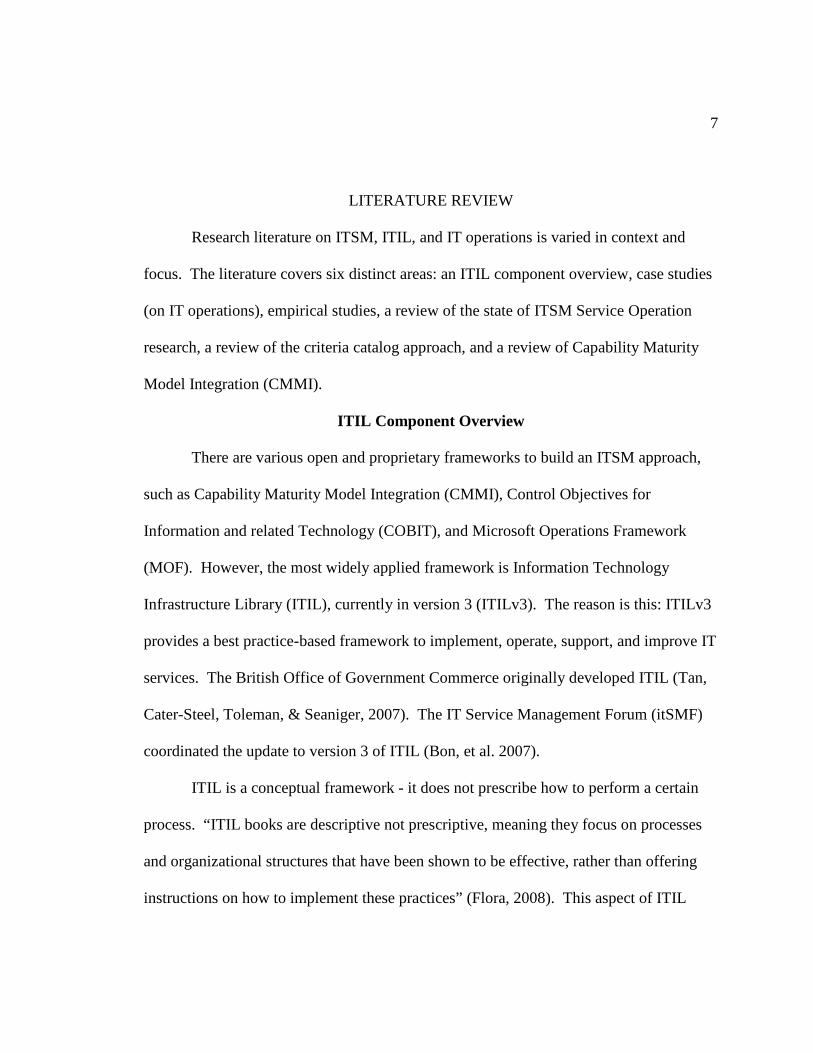
Figure 1 shows the relationship between ITSM, ITIL and key ITILv3
components. ITILv3 is comprised of 5 volumes or sets of related process guidelines
(Office of Government Commerce, 2008). This study is focused on Service Operation.
“The purpose of Service Operation is to deliver agreed levels of service to users” (Alison,
et al. 2007). Services managed by Service Operation processes are in “production” in a
traditional IT model. This is the stage where the customer and/or business is using and
receiving value from the services provided by IT.
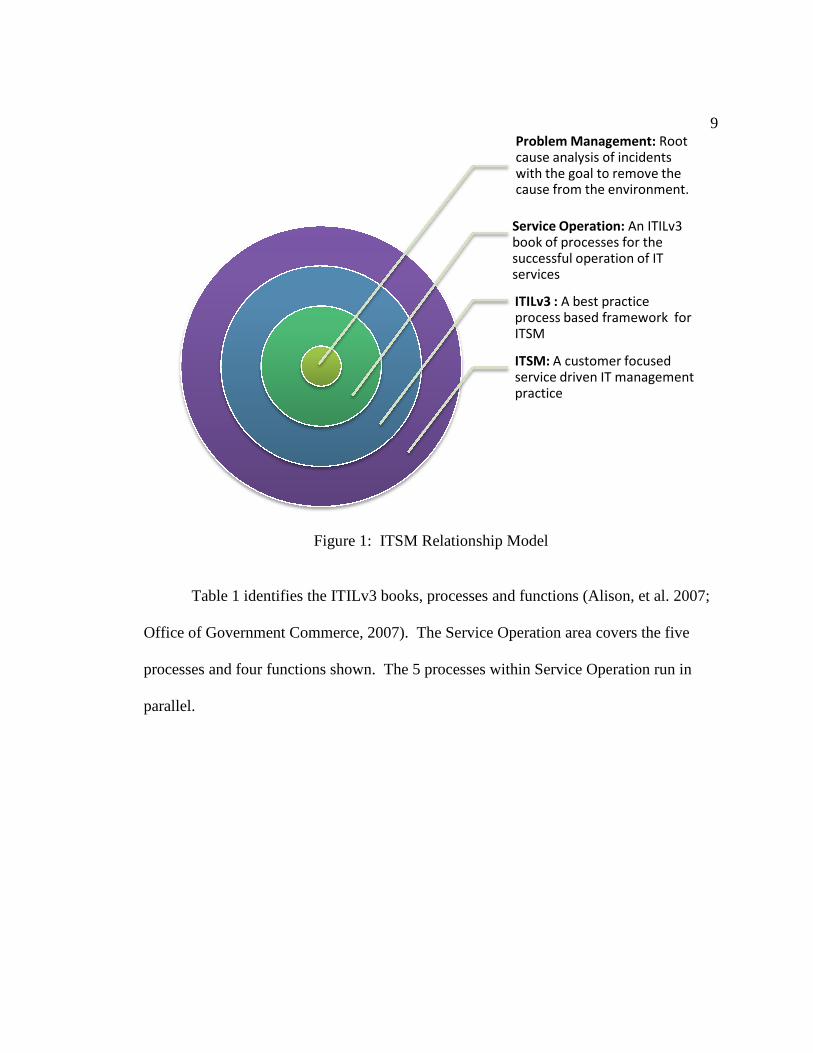
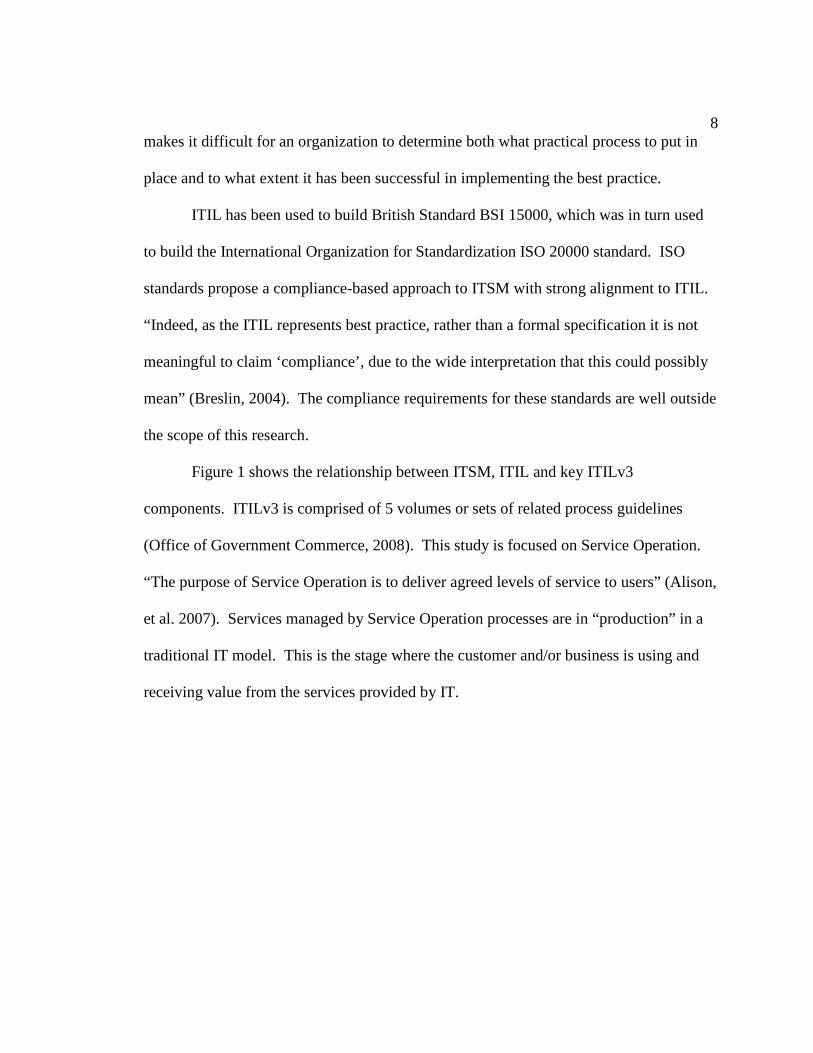
Table 1 identifies the ITILv3 books, processes and functions
Office of Government Commerce, 2007
processes and four functions
parallel.
Figure 1: ITSM Relationship Model
Table 1 identifies the ITILv3 books, processes and functions (Alison,
ent Commerce, 2007). The Service Operation area covers the five
functions shown. The 5 processes within Service Operation run in
Problem Management:
cause analysis of incidents with the goal to remove the cause from the environment.
Service Operation:
book of processes for the successful operation of IT services
ITILv3 : A best practice process based framework for ITSM
ITSM: A customer focused service driven IT management practice
9
(Alison, et al. 2007;
area covers the five
The 5 processes within Service Operation run in
Problem Management: Root cause analysis of incidents with the goal to remove the cause from the environment.
Service Operation: An ITILv3 book of processes for the successful operation of IT
A best practice process based framework for
A customer focused service driven IT management
10
Table 1. ITIL Version 3 Processes & Functions ITILv3 Book Processes & Functions Service Strategy Strategy Generation, Financial Management, Demand Management, Service Portfolio
Management
Service Design Service Catalogue Management, Service Level Management, Capacity Management, Availability Management, IT Service Continuity Management, Information Security Management, Supplier Management
Service Transition
Transition Planning and Support, Change Management, Service Asset and Configuration Management, Release and Deployment Management, Service Validation and Testing, Evaluation, Knowledge Management
Service Operation Processes Functions Event Management, Incident Management, Problem Management, Access Management, Request fulfillment
Service Desk, Technical Management, Application Management, IT Operations Management (IT Operations Control & Facilities Management)
Continual Service Improvement (CSI)
7-step Improvement Process, Service Reporting, Service Measurement
One important trigger for Problem Management is an incident, which is “an
unplanned interruption to an IT service or reduction in the quality of an IT Service” (Bon,
et al. 2007, p.134). Problems usually emerge from one or more incidents with an
unknown cause. The goal of Problem Management is to “prevent problems and
incidents, eliminate repeating incidents, and minimize the impact of incidents that cannot
be prevented” (Bon, et al. 2007, p.140). Incident Management provides the structure for
resolving incidents by working to restore service as quickly as possible. Although
processes like Incident Management can trigger Problem Management, it still stands on
its own as an individual process. By analogy, Incident Management is like calling the
firefighters to come put out the fire, while Problem Management is like installing smoke
detectors, sprinklers, and publicizing fire prevention. Problem Management provides
value by reducing the number of errors in the IT infrastructure providing the services,
which should reduce the number of incidents related to the services (Office of
Government Commerce, 2004; Office of Government Commerce, 2007)
11
Review Case Studies on IT Service Operations
A number of case studies illustrate the positive and negative impacts on
organizations, which add process and structure to their Service Operation functions.
However, most of the case studies do not address ITIL specifically. Instead they
emphasize introducing structured and repeatable processes such as those prescribed by
ITIL. The Service or Help Desk is frequently the area of focus for these studies.
Davis and Maxwell (2004) outlined the steps the University of West Florida took
to consolidate its Help Desk from many points of contact to a single point of contact and
information for the University. As a result, the Help Desk was seen as an asset to the
organization by the removal of the requirement for the customer to select the correct
location to call for assistance.
In the article, “Help Desk, Beyond Evolution: The Transformation of the
Princeton University Help Desk,” the author focused on adding tools to improve the
service of the organization (Jones, 1996, pp. 81-83). The introduction of new tools will
always disrupt the current processes for an organization, so the introduction of a new tool
drove Princeton to redesign their processes. The resulting process was well received and
“even the most incorrigible employees” liked the new method by the end of the first week
(Jones, 1996, p. 82). The new system was a success for Princeton because it built a more
collaborate environment by removing the old paper based method. Electronic records of
the calls also had the added advantage of starting Princeton down the road to building a
formalized Incident Management process.
12
In the article, “ITIL as common practice reference model for IT service
management: formal assessment and implications for practice,” the authors performed
four case studies on different ITIL implementation projects in German organizations
(Hochstein, Zarnekow, & Brenner, 2005, pp. ). These case studies examined the
outcomes of ITIL implementations to demonstrate the benefits and deficiencies of ITIL.
The authors found that, “… the use of ITIL is obviously cost effective, certainly in the
companies and organisations considered in the case studies” (Hochstein, et al. 2005, p. 4).
Incident and Change Management were considered in two of the case studies while the
other two case studies focused on ITILv2 Service Support book. The Service Support
book contains the processes: Configuration Management, Change Management, Incident
Management, Problem Management, and Release Management (Office of Government
Commerce, 2004). There is no discussion of Problem Management specifically.
Review of ITIL Related Empirical Studies
An effort has been placed on substantiating ITIL as beneficial and aligning IT and
the business, which should result in a quality service provided to the customers. The
ITIL authors boldly state that its processes can provide better alignment, but the writers
do not provide any empirical evidence to validate this theory (England, 2006). There are
several studies in which it is shown that IT service management via ITIL does provide
measurable benefits to the organization.
Potgieter, Botha, and Lew (2004) undertook one such study. They endeavored to
study if there was an improvement in customer service as the number of ITIL related
activities increased in an organization. The authors contrasted an organization’s
13
perception of service quality with the number of calls per user, before, during, and after
adding ITIL processes. They concluded, “That both customer satisfaction and
operational performance improve as the activities in the ITIL framework increases”
(Cater-Steel & Pollard, 2008; Potgieter, et al. 2004). A weakness of this study is the
limited depth of specific individual topics and failure to address the benefits of individual
processes such as Problem Management. This limited depth did not provide any
opportunities for the authors to explore which particular ITIL activities have the most
impact for the organizations studied. Also, the use of the subjective measure, customer
satisfaction, makes it difficult to objectively compare with other studies.
According to Cater-Steel & Pollard, “to date there has been little research
undertaken into ITIL implementation” (2008, p. 3). Additionally, all of the ITIL
implementation research has taken place internationally in reports from Potgieter, Botha,
and Lew in South Africa, Hochstein, Zarnekow, & Brenner in Germany, and Cater-Steel,
Toleman, and Tan in Australia, United Kingdom and New Zealand (Cater-Steel &
Pollard, 2008). Four years earlier, Potgieter, et al. (2004) also asserted, “very little
academic material exists” on ITIL or other ITSM frameworks. This factor limits the
amount of empirical research information available about ITSM and specifically ITIL,
and thus increases the possible impact of a study of Problem Management in Higher
Education.
Review of ITSM Research
There are a number of articles that address the broader area of trends in ITSM
industry and research. For example, Galup, Quan, Dattero, & Conger (2007, p. 49) assert
14
that, “Despite the significant growth of ITSM practice in industry, little scholarly work
exists on this topic.” In their review of ITSM research, the authors set the stage of how
critical services (in general) are to the industrialized nations around the world. Services
are critical to industrialized nations because their economies have moved from being
heavily based in agriculture and manufacturing to a service based economy. The authors
continue to discuss several different service management frameworks that IT could be
using but do not endorse any particular model.
Additionally, Cater-Steel and Toleman (2007) assert that IT students will demand
a quality education including ITSM because the students are endeavoring to improve
their job opportunities. With the IT industry continuing to embrace ITSM, Higher
Education institutions must, therefore, embrace ITSM and start including it in their
curriculum. The need for solid classroom instruction, as well as informed industry
practice, must be supported by solid and well-rounded research.
Review of Criteria Catalog Analysis
Benner, Radisic, & Schollmeyer (2002) presented a model for evaluating service
management processes in their paper entitled, “A Criteria Catalog Based Methodology
for Analyzing Service Management Processes.” The authors used a criteria based catalog
approach, which takes a body of knowledge about a best practice (in this case ITIL) and
allows one to break it down into individual components and evaluate existing processes
against the best practice model. The resulting output is a numerical value showing how
the process relates to the best practice model. The numerical result can be used to
produce a set of recommended changes to bring the process used by the organization into
15
better alignment with the best practice model. The authors state that the criteria based
catalog can be changed to fit the business needs for the process but the catalog is purely
based on the best practice model provided by ITIL. ITIL was not intended to be taken at
face value. It was intended to be adapted to the institution’s unique needs.
Benner, et al. (2002) recommended using a criteria based model for analyzing the
characteristics of a process. Their method requires an organization to use a process
framework like ITIL to build a scenario-independent, domain-specific, criteria catalog.
They reference tools like the itSMF ITIL Self Assessment to speed the development of
the criteria based catalog. Lastly, one has to adapt the catalog to one’s needs by adding
or removing criteria and then applying it to one’s scenario. The lack of a pre-existing
criteria catalog for Problem Management would require a person to develop tools to
perform the measurement. It could be a difficult and time-consuming process.
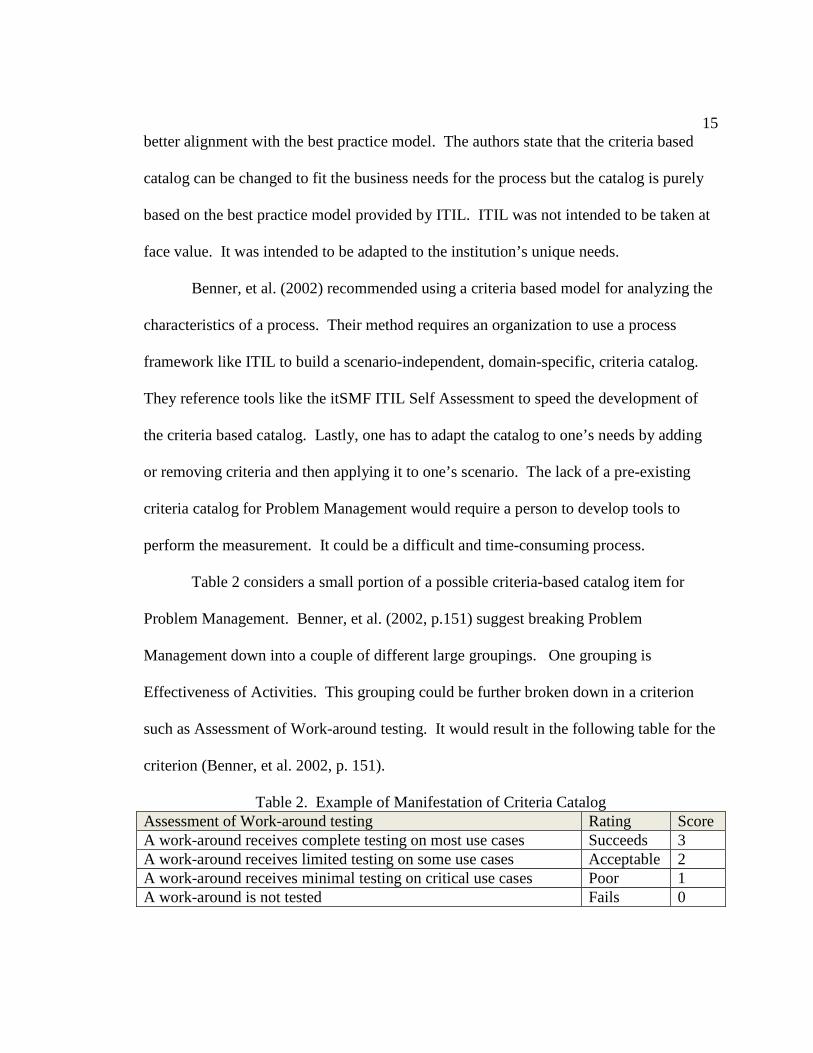
Table 2 considers a small portion of a possible criteria-based catalog item for
Problem Management. Benner, et al. (2002, p.151) suggest breaking Problem
Management down into a couple of different large groupings. One grouping is
Effectiveness of Activities. This grouping could be further broken down in a criterion
such as Assessment of Work-around testing. It would result in the following table for the
criterion (Benner, et al. 2002, p. 151).
Table 2. Example of Manifestation of Criteria Catalog Assessment of Work-around testing Rating Score A work-around receives complete testing on most use cases Succeeds 3 A work-around receives limited testing on some use cases Acceptable 2 A work-around receives minimal testing on critical use cases Poor 1 A work-around is not tested Fails 0
16
The Assessment of Work-around testing was encompassed in the Problem
Management Maturity model to be presented in this study using Quality Assurance for
the results (Appendix A, item G). Looking at each possible level for item G, there are
four cases for testing a work-around. The levels outlined in the model are the
development of experience and logical iterations of states of attributes. It is possible to
have a significantly large number of combinations of these states using a criteria catalog.
It is important to note that most of the states will be illogical combinations of events and
therefore can be disregarded. The logical combinations of attributes to produce states
should be sufficiently represented by the model presented in this thesis.
Most of the model presented in this paper contains criteria that would break down
into several different items in a criteria based catalog. Although, an item such as priority
of Problem Tickets (Appendix A, item H) in itself is a single criterion for a criteria
catalog.
The criteria catalog produces a fine grained look into one’s process but it requires
an appreciably more time consuming assessment activity. It requires one to develop or
locate a generic process catalog, customize it to meet the desired scenario, and then to
apply it. The model to be presented in this study provides a quick peek into the maturity
of a process where the criteria catalog makes one linger in the details to gain any basic
understanding of the process and its traits.
Review of Capability Maturity Model Integration
The path to quality IT services is through rigorous processes (Persse, 2006).
“Process maturity” is a way to measure the capabilities and deficiencies of these
17
processes. Grouping a set of capabilities and deficiencies will allow one to build a
maturity level. Being able to measure process maturity allows the organization to
identify gaps or deficiencies to work on while keeping the aspects of the process that
function properly.
Capability Maturity Model Integration (CMMI) was developed by the Software
Engineering Institute (SEI) at Carnegie Mellon University (Persse, 2006). It was birthed
out of several groups using the Capability Maturity Model (CMM) for software
engineering, systems engineering, and integrated product and process development
separately, then realizing the need for a single integrated model (Persse, 2006).
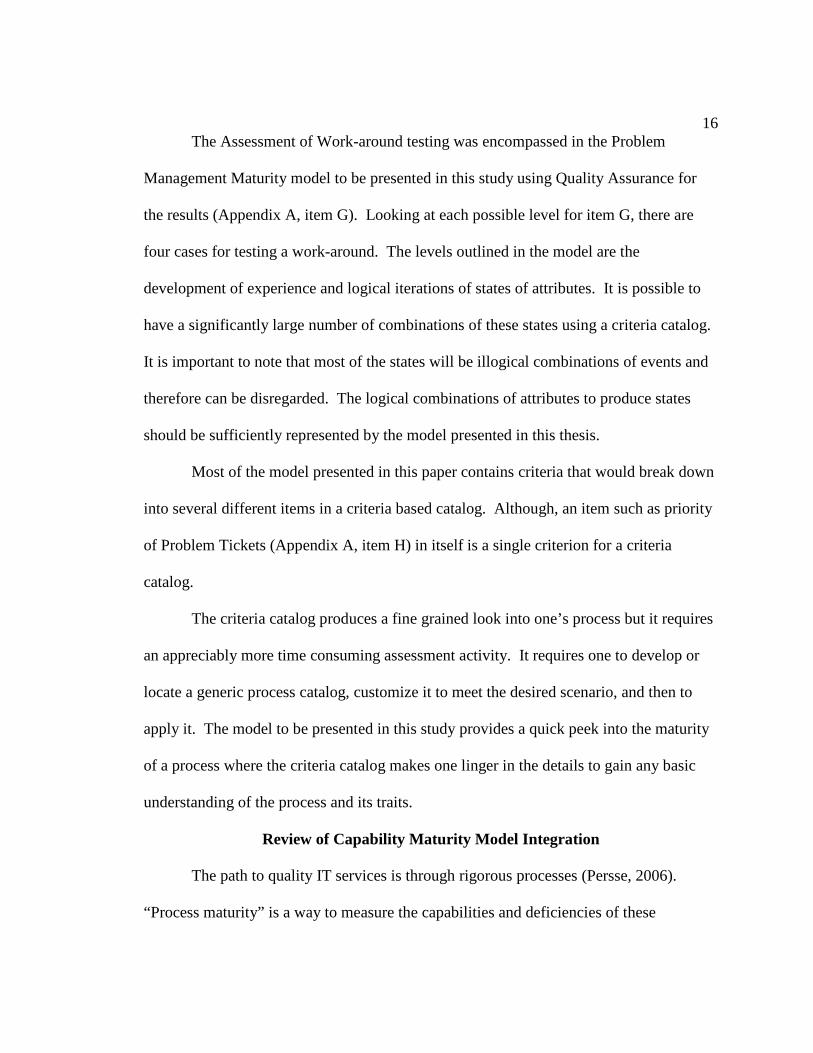
Figure 2 shows the different maturity levels for CMMI via a stage model
(Godfrey, 2004). The model demonstrates the different maturity levels and how they
build on the previous level.
Figure 2. CMMI Maturity Levels (Godfrey, 2004)
18
Capability Maturity Model Integration for Services (CMMI-SVC) is an extension
of the traditional CMMI. It is nearing completion, scheduled for release mid-March 2009
(CMMI for Services, 2009). Historically, CMMI was created to improve the results for
software and systems development, and therefore has been difficult to customize and flex
to meet the needs of a service organization such as a Primary Support Center. CMMI for
Services is the first iteration by the authors of CMMI trying to resolve this deficiency in
CMMI.
Considering the maturity of CMMI-SVC, even in a draft format, one cannot
ignore the possible impact a CMMI could have for organizations supporting services.
CMMI-SVC and ITIL have a similar structure and process. Also, their purpose is the
same, to identify the required change to the IT infrastructure to resolve or remove the root
cause of the problem.
CMMI-SVC does not break each aspect down into isolated events or actions but
the end goal is the same to improve the service delivered to the customer. It validates the
model presented in this paper by addressing the same aspects of process requirements.
19
METHODOLOGY
The methods used to complete this research project have been broken down into
three distinct phases. The phases are: develop Problem Management model, refine and
test the validity of the Problem Management model, and survey of Higher Education
Institutions. After developing and refining the model, a short survey was built and sent
out to Higher Education institutions in the Survey of Higher Education Institutions phase.
These phases are discussed below.
Phase 1: Develop Problem Management Model
The ITIL framework’s non-prescriptive nature, while providing flexibility to
customize the process for the organization, does not lead the Help Desk manager to know
what the next logical step would be to continue to improve the process.
To develop a Problem Management Maturity (PMM) model, the ITIL Problem
Management process portions of the ITIL v2 Service Support book (Office of
Government Commerce, 2004) and ITIL v3 Service Operations book (Office of
Government Commerce, 2007) were reviewed thoroughly. The foundational and key
components for a successful Problem Management process were extracted from the text
by reviewing the sections of the Problem Management chapter. The foundational and
key components were then used to ascertain the related portions of the process, and then
tied together in the model. This resulted in a list of ten criteria for Problem Management
(See Appendix A). The CMMI model provided the basis for the stage model format.
20
Problem Management Maturity Model
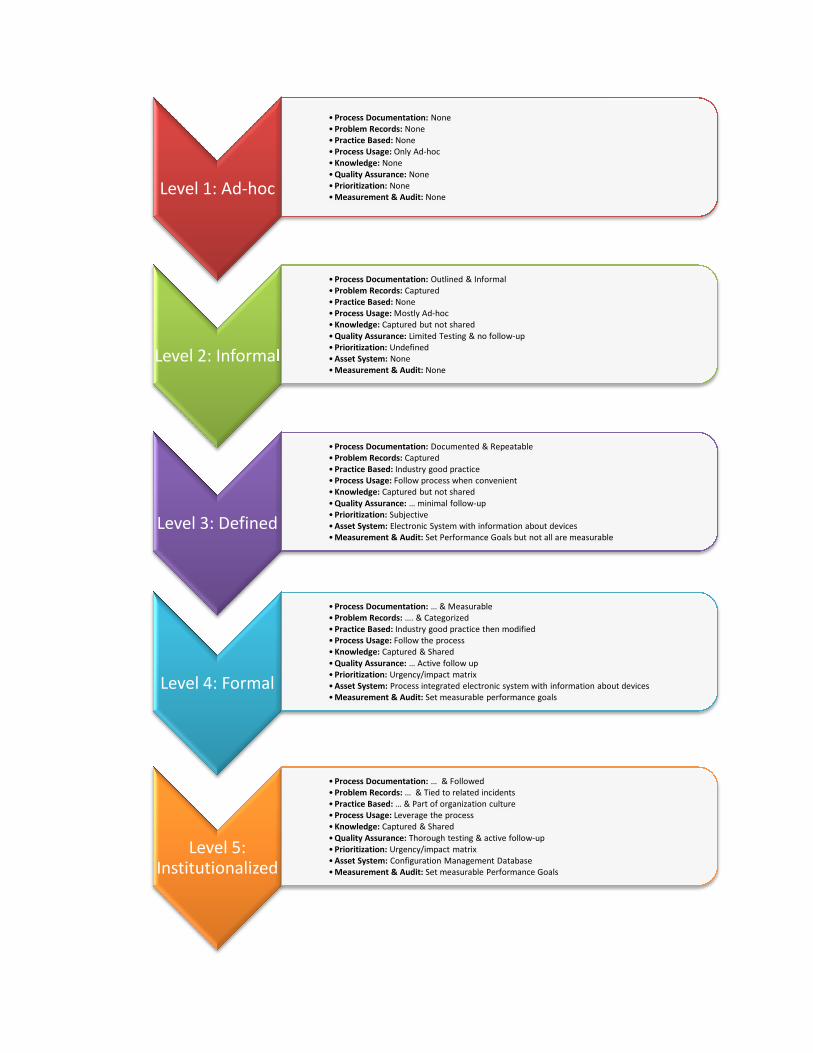
Figure 3 is a stage model representing maturity of a Problem Management
Process based on the list of criteria developed from reviewing ITIL Problem Management
materials. The criteria were placed into five distinct levels of development. Each level
builds on the previous level by either adding to the criteria or replacing an undesirable
criterion state with a more desirable state. These scale questions address the qualities of a
“mature” Problem Management process. A more mature process was defined as one
which meets a greater number of criteria such as being well documented, consistently
repeatable, measurable, and reliably implemented.
21
Figure 3. Problem Management Maturity Model
Level 1: Ad-hoc
Level 2: Informal
Level 3: Defined
Level 4: Formal
Level 5: Institutionalized
• Process Documentation: None
• Problem Records: None
• Practice Based: None
• Process Usage: Only Ad-hoc
• Knowledge: None
• Quality Assurance: None
• Prioritization: None
• Measurement & Audit: None
• Process Documentation: Outlined & Informal
• Problem Records: Captured
• Practice Based: None
• Process Usage: Mostly Ad-hoc
• Knowledge: Captured but not shared
• Quality Assurance: Limited Testing & no follow-up
• Prioritization: Undefined
• Asset System: None
• Measurement & Audit: None
• Process Documentation: Documented & Repeatable
• Problem Records: Captured
• Practice Based: Industry good practice
• Process Usage: Follow process when convenient
• Knowledge: Captured but not shared
• Quality Assurance: … minimal follow-up
• Prioritization: Subjective
• Asset System: Electronic System with information about devices
• Measurement & Audit: Set Performance Goals but not all are measurable
• Process Documentation: … & Measurable
• Problem Records: …. & Categorized
• Practice Based: Industry good practice then modified
• Process Usage: Follow the process
• Knowledge: Captured & Shared
• Quality Assurance: … Active follow up
• Prioritization: Urgency/impact matrix
• Asset System: Process integrated electronic system with information about devices
• Measurement & Audit: Set measurable performance goals
• Process Documentation: … & Followed
• Problem Records: … & Tied to related incidents
• Practice Based: … & Part of organization culture
• Process Usage: Leverage the process
• Knowledge: Captured & Shared
• Quality Assurance: Thorough testing & active follow-up
• Prioritization: Urgency/impact matrix
• Asset System: Configuration Management Database
• Measurement & Audit: Set measurable Performance Goals
Set Performance Goals but not all are measurable
Process integrated electronic system with information about devices
22
Phase 2: Refine and Test the Validity of the Problem Management Model
With the end result in mind, the model needed to be as clear and concise as possible. The
list of criteria was peer reviewed by two members of the Help Desk Institute staff. Each
person’s frank and helpful comments were used to refine and enhance the model. In
addition, the Help Desk manager at Boise State University and the Lead Technical
Support Specialist reviewed the list of criteria in an effort to validate it against members
of the target audience. The result was an updated model comprised of ten criteria
categories with several statements to match to an organization.
The model of ten criteria categories was converted into a survey. The survey was
tested and reviewed by the Help Desk staff at Boise State University. Their input and
points of confusion were used to clarify and refine the questions. The end result was a
highly readable survey with little need for interpretation by the survey participants.
Phase 3: Survey of Higher Education Institutions
The survey based on the PMM Model was delivered to the Help Desk managers
of seventy-eight higher education. A complete list of institutions is available in
Appendix C. The institutions are located throughout the entire USA with one located in
Canada. The schools were pulled from members of the Help Desk Institute (HDI) Higher
Education Forum (HEF), a list of Western Athletic Conference members, and Boise State
University peer institutions.
The research began with a survey using the scale questions outlined in Appendix
A. The survey also included questions to collect background information about the
institution and query the perceived effectiveness of the Problem Management process.
23
The results were compared with the PMM model. The comparison to the scale allowed
the classification of the Problem Management maturity at each school.
It was suggested that the time expected to complete the survey (about 20 minutes)
would limit the return from the group survey. In an effort to provide the best data set
possible, an incentive was offered to encourage participants to complete the survey. The
incentive was $25, $15, or $10 gift certificates for Starbuck or iTunes. A window of
opportunity was available to complete the survey to be eligible to enter the drawing for
the gift certificates. Winners were selected at random from the pool of people that
submitted their information for the drawing.
Limitations of Methodology
The members of the HDI HEF have demonstrated a desire to pursue improved
ITSM practices for their organization by becoming members of the HDI organization.
This may not equate to implementation based experience of Problem Management
practices. However, the desire to work towards improved ITSM practices may lead to a
more knowledgeable outlook on the subject.
An online survey delivered via email is a common method for organizations to
gather information. Some of the recipients of this survey may receive many requests to
take online surveys from other organizations or people per month. Therefore, the time
available to respond to a survey, while being limited already, was even further divided.
Another factor to consider is the topic and email soliciting participation did not capture
the recipients’ attention; and thereby, was never regarded as something the recipient
should complete.
22
RESULTS
The results section first discusses the survey response, including information
about the population and response rate. Second, PMM Model was used to categorize the
results. Third, respondent maturity is evaluated. Finally, several potential mitigating
factors are discussed.
Response Information
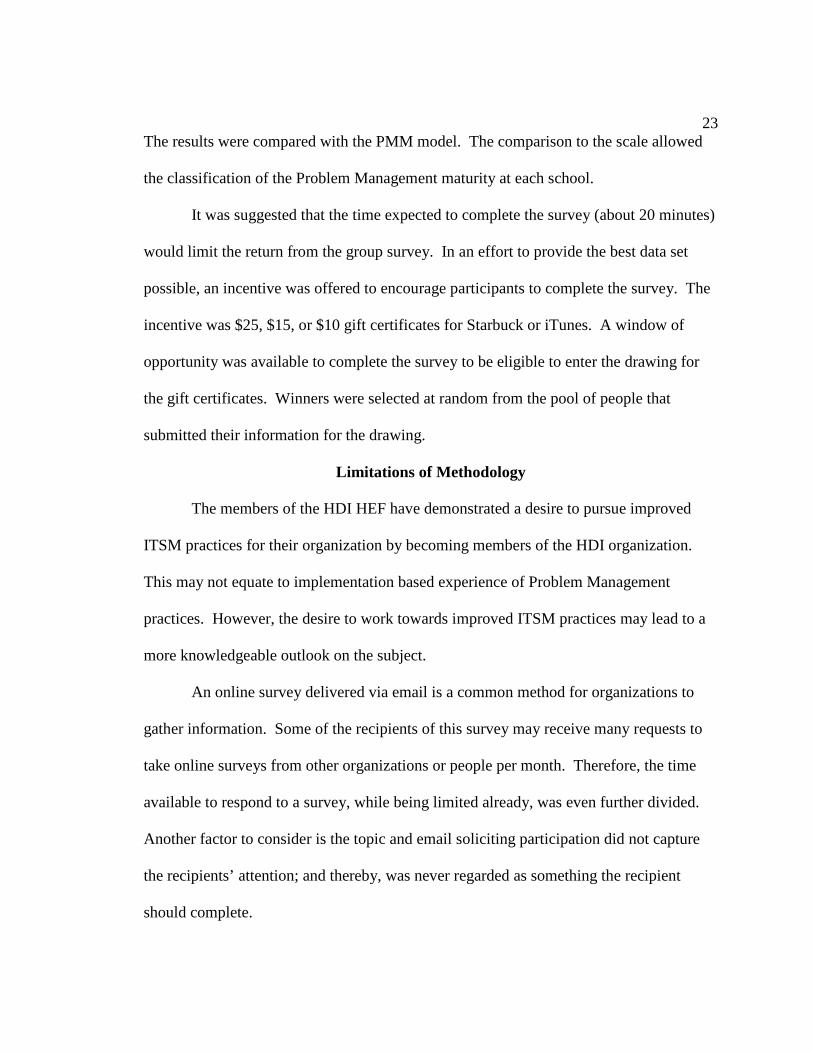
The survey was sent to 78 managers of the institution’s Primary Support Center.
The 78 managers included institutions from across the USA and one university from
Canada. Twenty-five completed responses were returned, equating to a 32% return rate.
Tables 3 and 4 provide an overview the demographics for the respondents.
Table 3. Population Information on Institution Type and HDI Membership Institution Type and HDI Members 7 Private 18 public 16 responses from the 27 Help Desk Institute Higher Education Forum Members
Table 4. Number of Institutions for Student Population
Institution Size
Number of Institutions
Student Population
Full Time Equivalent Average
Full Time Equivalent
Range
Small 6 <8999 2431 793 - 4448 Medium 9 >9000 2759 1248 - 8860
Large 9 >20,000 5823 1362 - 19663
23
Results Comparison to the PMM Model
Categorical and Overall Maturity Results
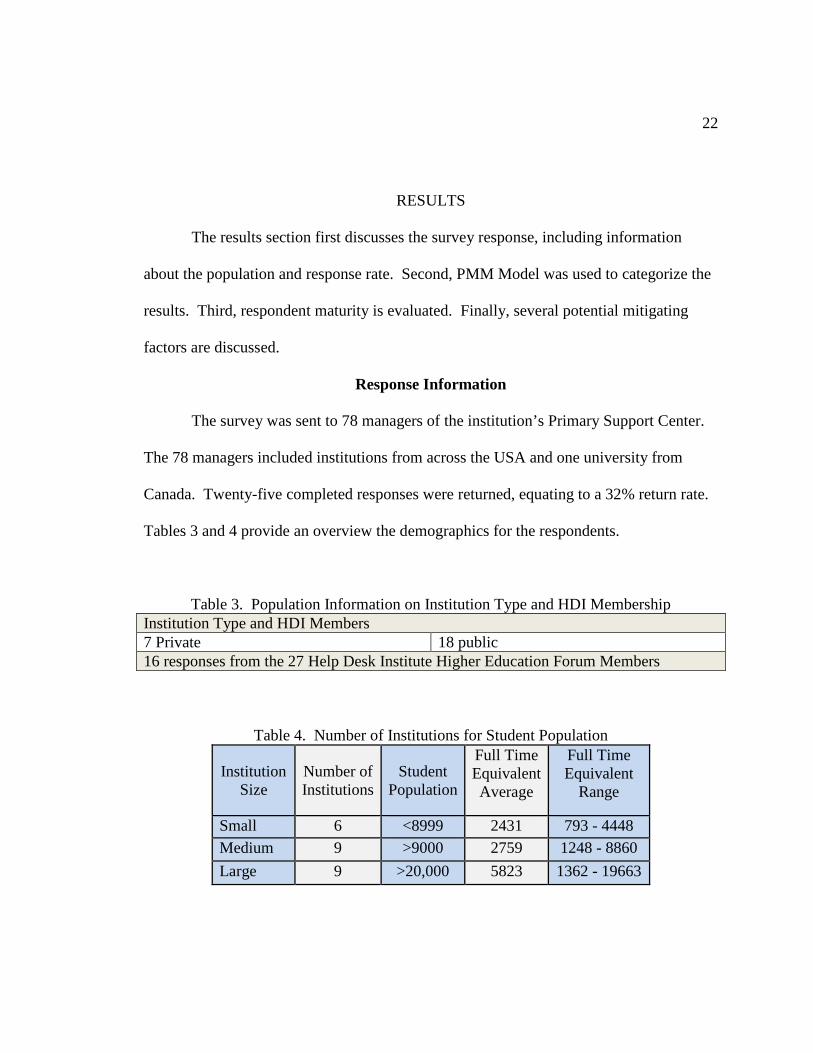
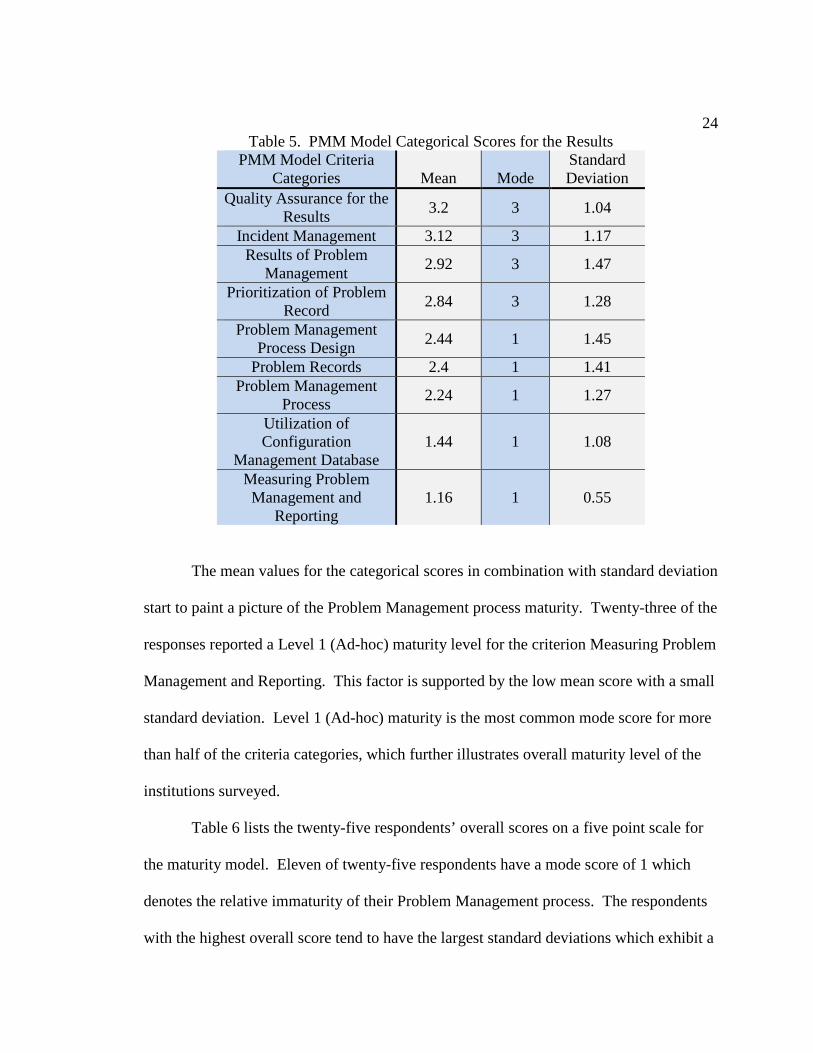
Table 5 illustrates the overall categorical Maturity Chart mode scores on a 5 point
scale for all the responses. The most common responses were ones and twos on the five
point scale for process maturity (higher scores represent greater levels of maturity). The
overall average score for all but two categories was below the Level 3 (Defined) PMM
model level. In addition, the mode category score for Utilization of Configuration
Management Database and Measuring Problem Management and Reporting were at
Level 1 (Ad-hoc). The mode information shows that most of the respondents
experienced immature portions of the Problem Management process. Moreover, there
are four criteria categories with a standard deviation larger than 1.25, demonstrating a
highly inconsistent maturity per category among the surveyed organizations.
24
Table 5. PMM Model Categorical Scores for the Results PMM Model Criteria
Categories Mean Mode Standard Deviation
Quality Assurance for the Results
3.2 3 1.04
Incident Management 3.12 3 1.17 Results of Problem
Management 2.92 3 1.47
Prioritization of Problem Record
2.84 3 1.28
Problem Management Process Design
2.44 1 1.45
Problem Records 2.4 1 1.41 Problem Management
Process 2.24 1 1.27
Utilization of Configuration
Management Database 1.44 1 1.08
Measuring Problem Management and
Reporting 1.16 1 0.55
The mean values for the categorical scores in combination with standard deviation
start to paint a picture of the Problem Management process maturity. Twenty-three of the
responses reported a Level 1 (Ad-hoc) maturity level for the criterion Measuring Problem
Management and Reporting. This factor is supported by the low mean score with a small
standard deviation. Level 1 (Ad-hoc) maturity is the most common mode score for more
than half of the criteria categories, which further illustrates overall maturity level of the
institutions surveyed.
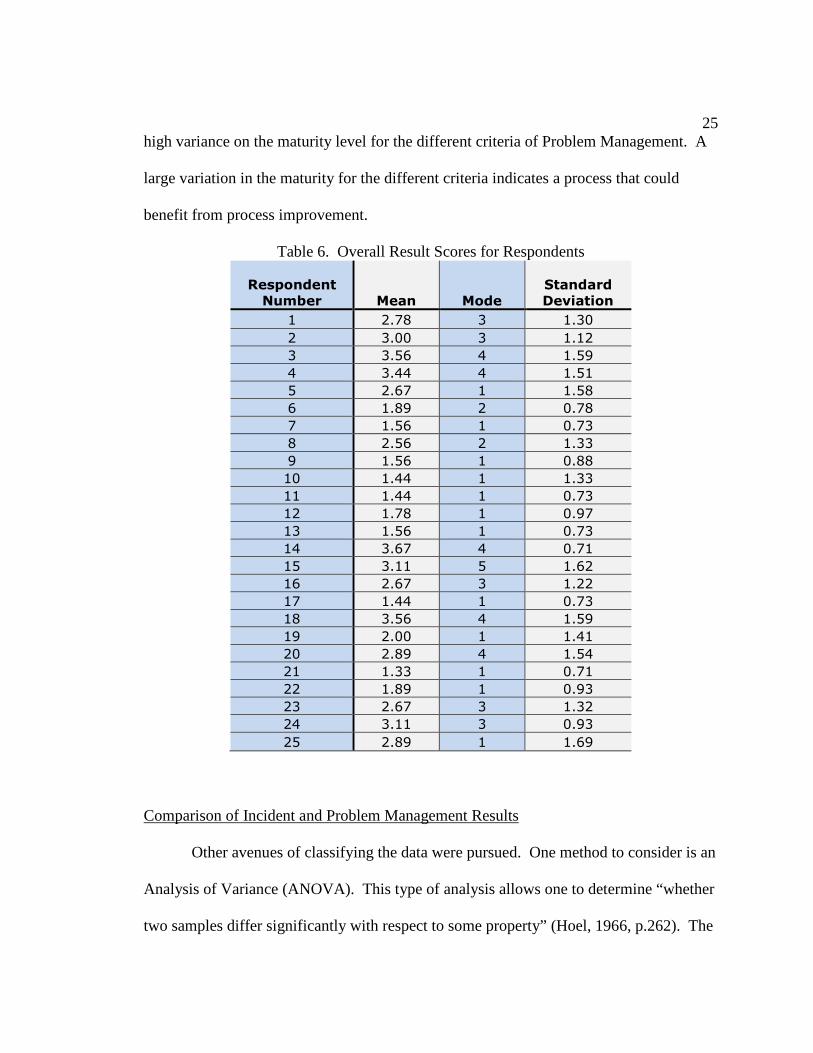
Table 6 lists the twenty-five respondents’ overall scores on a five point scale for
the maturity model. Eleven of twenty-five respondents have a mode score of 1 which
denotes the relative immaturity of their Problem Management process. The respondents
with the highest overall score tend to have the largest standard deviations which exhibit a
25
high variance on the maturity level for the different criteria of Problem Management. A
large variation in the maturity for the different criteria indicates a process that could
benefit from process improvement.
Table 6. Overall Result Scores for Respondents
Respondent
Number Mean Mode
Standard
Deviation
1 2.78 3 1.30
2 3.00 3 1.12
3 3.56 4 1.59
4 3.44 4 1.51
5 2.67 1 1.58
6 1.89 2 0.78
7 1.56 1 0.73
8 2.56 2 1.33
9 1.56 1 0.88
10 1.44 1 1.33
11 1.44 1 0.73
12 1.78 1 0.97
13 1.56 1 0.73
14 3.67 4 0.71
15 3.11 5 1.62
16 2.67 3 1.22
17 1.44 1 0.73
18 3.56 4 1.59
19 2.00 1 1.41
20 2.89 4 1.54
21 1.33 1 0.71
22 1.89 1 0.93
23 2.67 3 1.32
24 3.11 3 0.93
25 2.89 1 1.69
Comparison of Incident and Problem Management Results
Other avenues of classifying the data were pursued. One method to consider is an
Analysis of Variance (ANOVA). This type of analysis allows one to determine “whether
two samples differ significantly with respect to some property” (Hoel, 1966, p.262). The
26
analysis used here focused on the simplest form of an ANOVA; in which, “observations
are classified into groups on the basis of a single property” (Hoel, 1966, p. 263). The
ANOVA calculation is “testing a null hypothesis that several population means are
equal” (Daniel & Terrell, 1983, p.250).
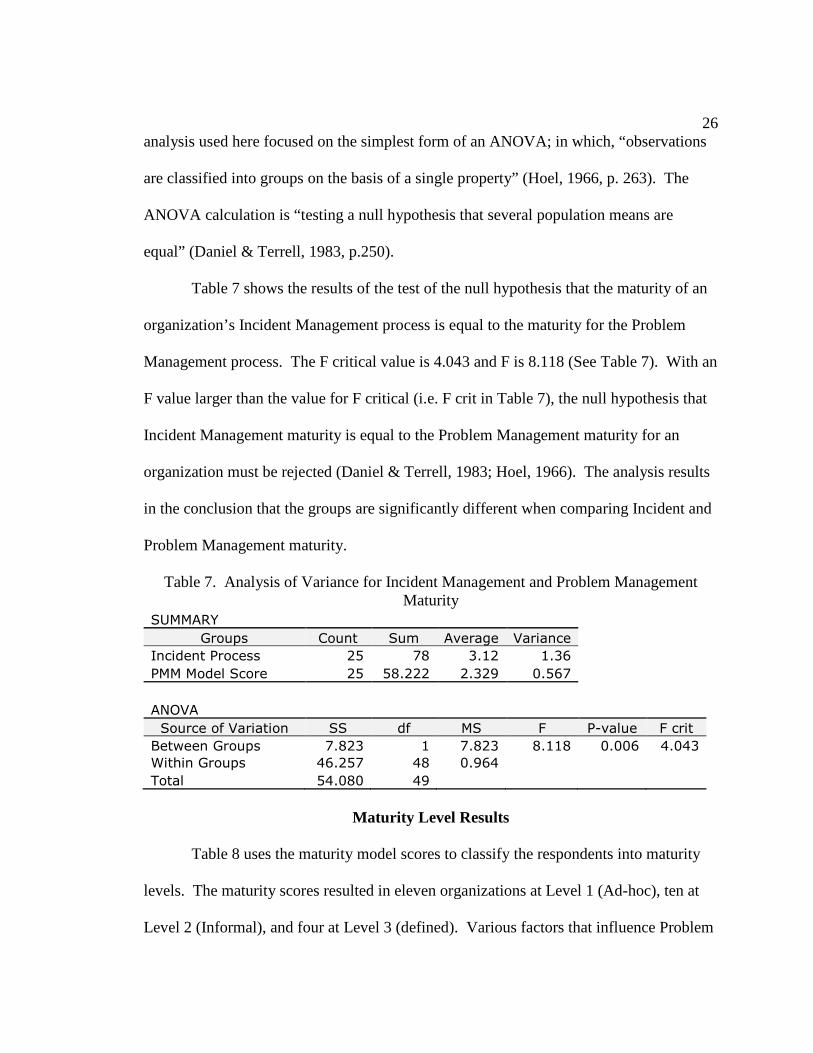
Table 7 shows the results of the test of the null hypothesis that the maturity of an
organization’s Incident Management process is equal to the maturity for the Problem
Management process. The F critical value is 4.043 and F is 8.118 (See Table 7). With an
F value larger than the value for F critical (i.e. F crit in Table 7), the null hypothesis that
Incident Management maturity is equal to the Problem Management maturity for an
organization must be rejected (Daniel & Terrell, 1983; Hoel, 1966). The analysis results
in the conclusion that the groups are significantly different when comparing Incident and
Problem Management maturity.
Table 7. Analysis of Variance for Incident Management and Problem Management Maturity
SUMMARY
Groups Count Sum Average Variance
Incident Process 25 78 3.12 1.36
PMM Model Score 25 58.222 2.329 0.567
ANOVA
Source of Variation SS df MS F P-value F crit
Between Groups 7.823 1 7.823 8.118 0.006 4.043
Within Groups 46.257 48 0.964
Total 54.080 49
Maturity Level Results
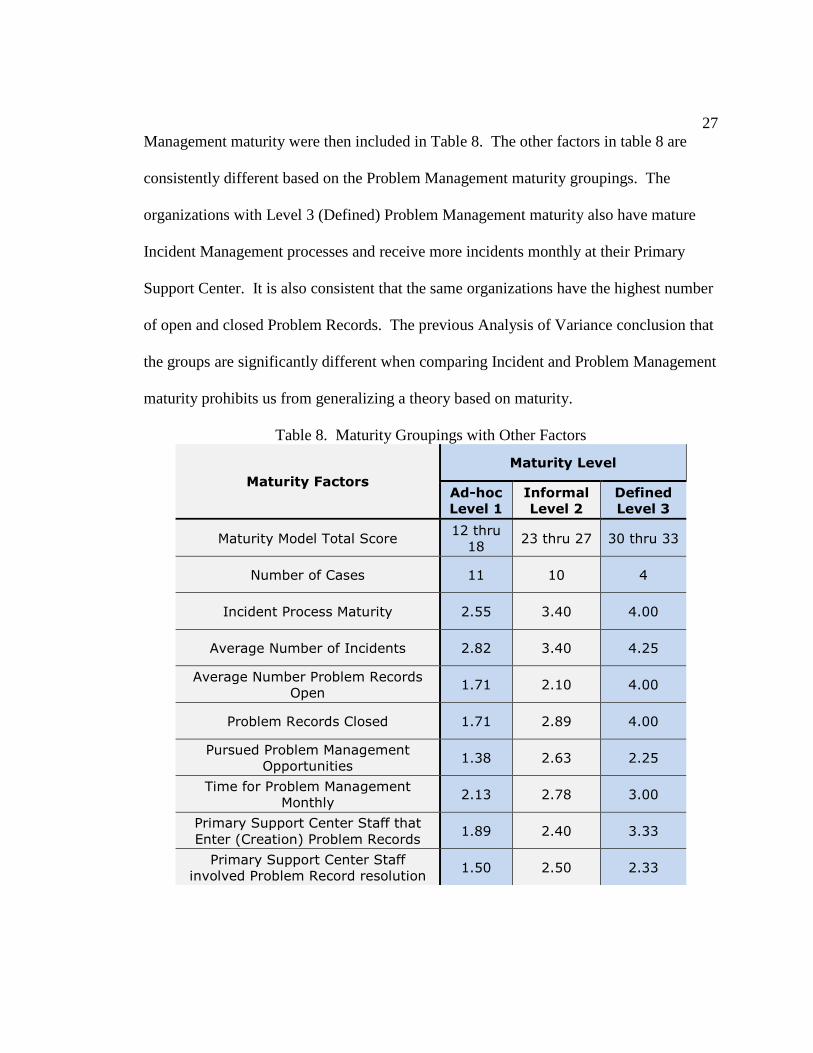
Table 8 uses the maturity model scores to classify the respondents into maturity
levels. The maturity scores resulted in eleven organizations at Level 1 (Ad-hoc), ten at
Level 2 (Informal), and four at Level 3 (defined). Various factors that influence Problem
27
Management maturity were then included in Table 8. The other factors in table 8 are
consistently different based on the Problem Management maturity groupings. The
organizations with Level 3 (Defined) Problem Management maturity also have mature
Incident Management processes and receive more incidents monthly at their Primary
Support Center. It is also consistent that the same organizations have the highest number
of open and closed Problem Records. The previous Analysis of Variance conclusion that
the groups are significantly different when comparing Incident and Problem Management
maturity prohibits us from generalizing a theory based on maturity.
Table 8. Maturity Groupings with Other Factors
Maturity Factors
Maturity Level
Ad-hoc
Level 1
Informal
Level 2
Defined
Level 3
Maturity Model Total Score 12 thru
18 23 thru 27 30 thru 33
Number of Cases 11 10 4
Incident Process Maturity 2.55 3.40 4.00
Average Number of Incidents 2.82 3.40 4.25
Average Number Problem Records
Open 1.71 2.10 4.00
Problem Records Closed 1.71 2.89 4.00
Pursued Problem Management
Opportunities 1.38 2.63 2.25
Time for Problem Management
Monthly 2.13 2.78 3.00
Primary Support Center Staff that
Enter (Creation) Problem Records 1.89 2.40 3.33
Primary Support Center Staff
involved Problem Record resolution 1.50 2.50 2.33
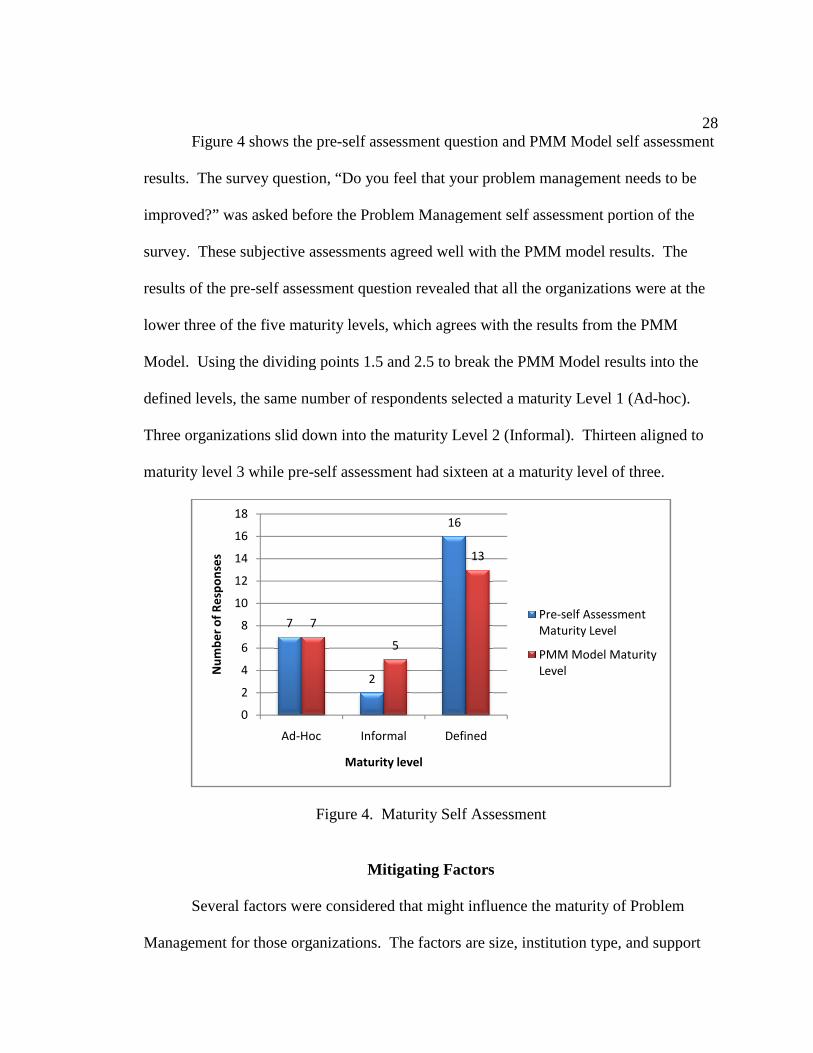
Figure 4 shows the pre
results. The survey question, “
improved?” was asked before the Problem Management self assessment portion of the
survey. These subjective assessments agreed well
results of the pre-self assessment
lower three of the five maturity levels
Model. Using the dividing points
defined levels, the same number of r
Three organizations slid down into the maturity Level 2 (
maturity level 3 while pre
Several factors were considered that
Management for those organizations. The factors are size, institution type, and support
7
0
2
4
6
8
10
12
14
16
18
Ad-Hoc
Nu
mb
er
of
Re
spo
nse
s
shows the pre-self assessment question and PMM Model self assessment
The survey question, “Do you feel that your problem management needs to be
” was asked before the Problem Management self assessment portion of the
These subjective assessments agreed well with the PMM model results.
self assessment question revealed that all the organization
lower three of the five maturity levels, which agrees with the results from
Using the dividing points 1.5 and 2.5 to break the PMM Model results in
same number of respondents selected a maturity Level
ns slid down into the maturity Level 2 (Informal). Thirteen aligned
pre-self assessment had sixteen at a maturity level
Figure 4. Maturity Self Assessment
Mitigating Factors
Several factors were considered that might influence the maturity of Problem
Management for those organizations. The factors are size, institution type, and support
2
16
7
5
13
Hoc Informal Defined
Maturity level
Pre-self Assessment
Maturity Level
PMM Model Maturity
Level
28
question and PMM Model self assessment
anagement needs to be
” was asked before the Problem Management self assessment portion of the
with the PMM model results. The
organizations were at the
from the PMM
break the PMM Model results into the
espondents selected a maturity Level 1 (Ad-hoc).
hirteen aligned to
of three.
influence the maturity of Problem
Management for those organizations. The factors are size, institution type, and support
self Assessment
Maturity Level
PMM Model Maturity
29
organization type. It was found, however, that none of these mitigating factors
influenced the Problem Management maturity level.
Size
A hypothesis about Problem Management in Higher Education was that an
organization’s size affects the maturity of the Problem Management process. It was
believed that larger organizations would tend toward into a more structured environment
and therefore develop a more mature Problem Management process.
The Integrated Postsecondary Education Data System (IPEDS) database
(http://nces.ed.gov/IPEDS/) was used to gather data student population and Full-time
equivalent staff by assigned position criteria. Additionally, the survey gathered
information about the number of full-time, part-time and student employees for the
Primary Support Center. This information was compiled to build an overall Full-time
equivalent (FTE) count for the Primary Support Center. The respondent could have
selected answers as shown in Table 9 below.
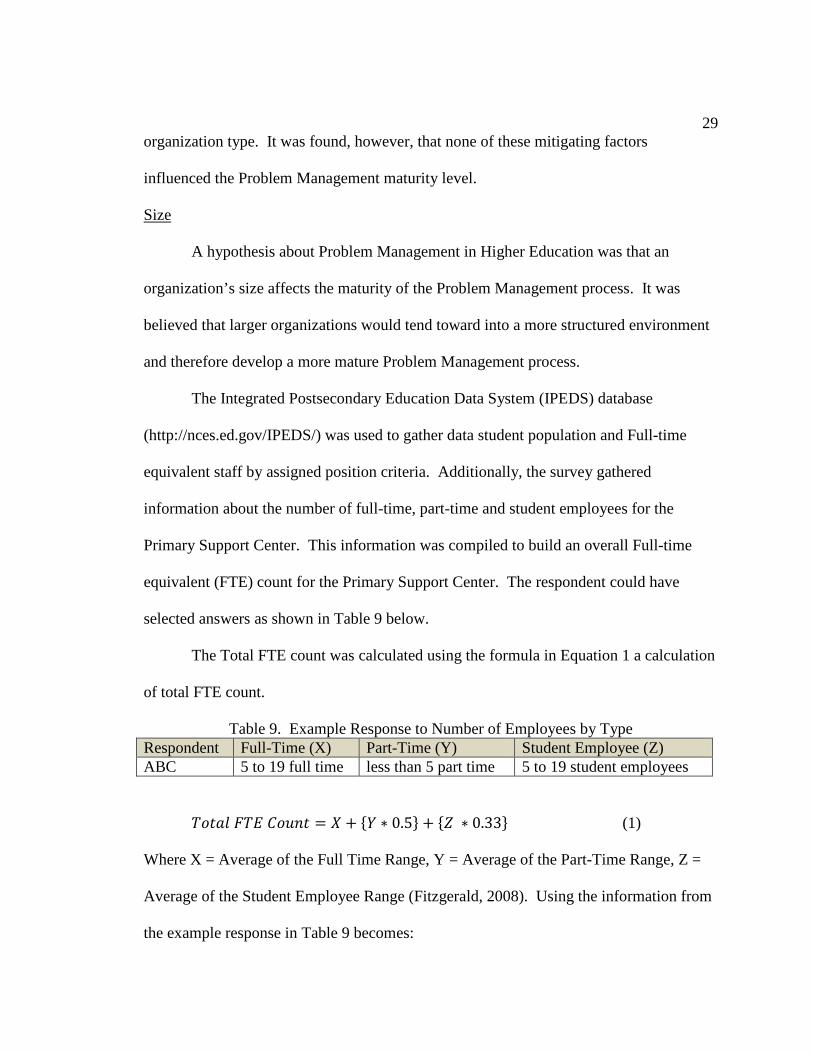
The Total FTE count was calculated using the formula in Equation 1 a calculation
of total FTE count.
Table 9. Example Response to Number of Employees by Type Respondent Full-Time (X) Part-Time (Y) Student Employee (Z) ABC 5 to 19 full time less than 5 part time 5 to 19 student employees
����� ��� ��� � � �� � 0.5� � �� � 0.33� (1) Where X = Average of the Full Time Range, Y = Average of the Part-Time Range, Z =
Average of the Student Employee Range (Fitzgerald, 2008). Using the information from
the example response in Table 9 becomes:
30
����� ��� ��� � ����� � ����
� � 0.5� � ������ � 0.33� (2)
This example results in the following calculation:
����� ��� ��� � 12 � 1.25 � 3.96 � 17.21 % 17 ��� (3)
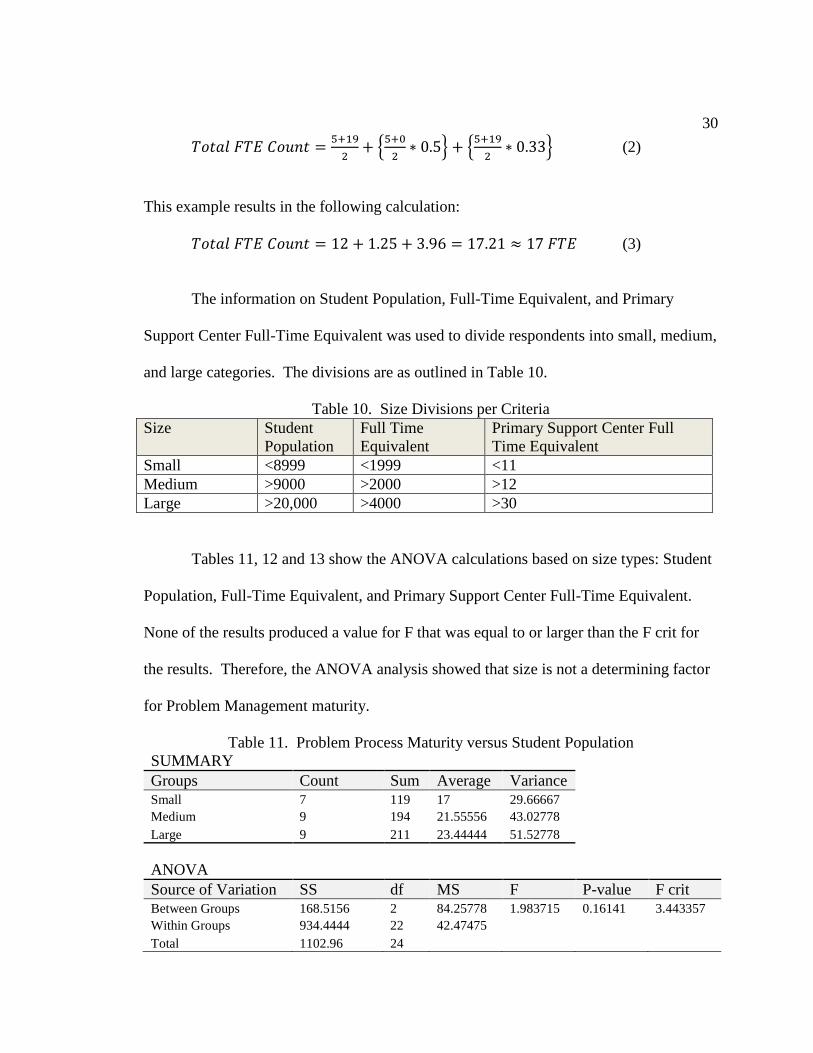
The information on Student Population, Full-Time Equivalent, and Primary
Support Center Full-Time Equivalent was used to divide respondents into small, medium,
and large categories. The divisions are as outlined in Table 10.
Table 10. Size Divisions per Criteria Size Student
Population Full Time Equivalent
Primary Support Center Full Time Equivalent
Small <8999 <1999 <11 Medium >9000 >2000 >12 Large >20,000 >4000 >30
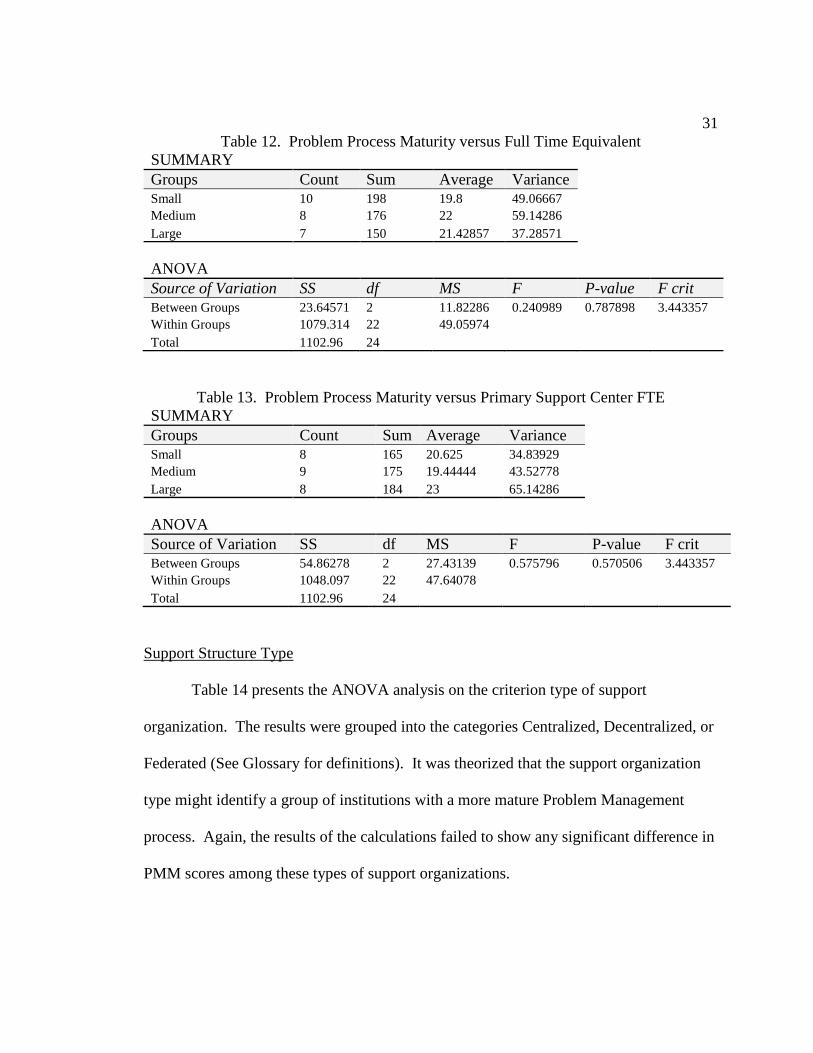
Tables 11, 12 and 13 show the ANOVA calculations based on size types: Student
Population, Full-Time Equivalent, and Primary Support Center Full-Time Equivalent.
None of the results produced a value for F that was equal to or larger than the F crit for
the results. Therefore, the ANOVA analysis showed that size is not a determining factor
for Problem Management maturity.
Table 11. Problem Process Maturity versus Student Population SUMMARY Groups Count Sum Average Variance Small 7 119 17 29.66667 Medium 9 194 21.55556 43.02778 Large 9 211 23.44444 51.52778
ANOVA Source of Variation SS df MS F P-value F crit Between Groups 168.5156 2 84.25778 1.983715 0.16141 3.443357 Within Groups 934.4444 22 42.47475 Total 1102.96 24
31
Table 12. Problem Process Maturity versus Full Time Equivalent SUMMARY Groups Count Sum Average Variance Small 10 198 19.8 49.06667 Medium 8 176 22 59.14286 Large 7 150 21.42857 37.28571
ANOVA Source of Variation SS df MS F P-value F crit Between Groups 23.64571 2 11.82286 0.240989 0.787898 3.443357 Within Groups 1079.314 22 49.05974 Total 1102.96 24
Table 13. Problem Process Maturity versus Primary Support Center FTE SUMMARY Groups Count Sum Average Variance Small 8 165 20.625 34.83929 Medium 9 175 19.44444 43.52778 Large 8 184 23 65.14286
ANOVA Source of Variation SS df MS F P-value F crit Between Groups 54.86278 2 27.43139 0.575796 0.570506 3.443357 Within Groups 1048.097 22 47.64078 Total 1102.96 24
Support Structure Type
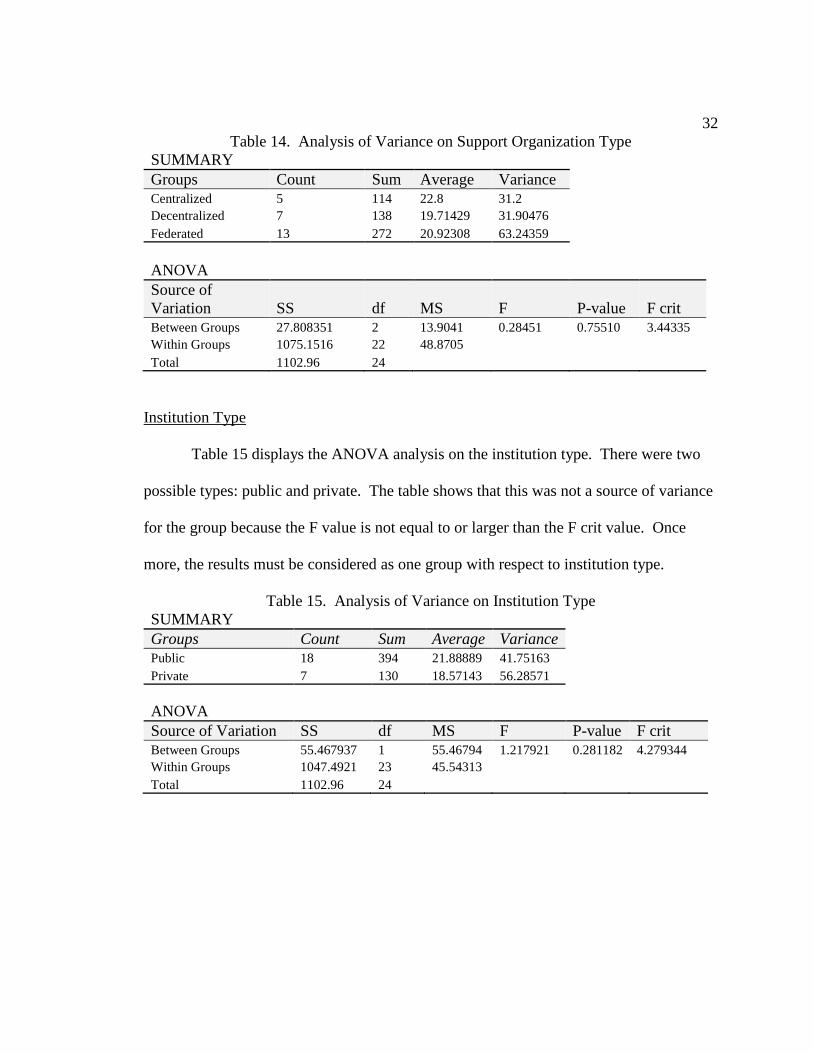
Table 14 presents the ANOVA analysis on the criterion type of support
organization. The results were grouped into the categories Centralized, Decentralized, or
Federated (See Glossary for definitions). It was theorized that the support organization
type might identify a group of institutions with a more mature Problem Management
process. Again, the results of the calculations failed to show any significant difference in
PMM scores among these types of support organizations.
32
Table 14. Analysis of Variance on Support Organization Type SUMMARY Groups Count Sum Average Variance Centralized 5 114 22.8 31.2 Decentralized 7 138 19.71429 31.90476 Federated 13 272 20.92308 63.24359
ANOVA Source of Variation SS df MS F P-value F crit Between Groups 27.808351 2 13.9041 0.28451 0.75510 3.44335 Within Groups 1075.1516 22 48.8705 Total 1102.96 24
Institution Type
Table 15 displays the ANOVA analysis on the institution type. There were two
possible types: public and private. The table shows that this was not a source of variance
for the group because the F value is not equal to or larger than the F crit value. Once
more, the results must be considered as one group with respect to institution type.
Table 15. Analysis of Variance on Institution Type SUMMARY Groups Count Sum Average Variance Public 18 394 21.88889 41.75163 Private 7 130 18.57143 56.28571
ANOVA Source of Variation SS df MS F P-value F crit Between Groups 55.467937 1 55.46794 1.217921 0.281182 4.279344 Within Groups 1047.4921 23 45.54313 Total 1102.96 24
33
DISCUSSION
The development of a high level maturity scale for Problem Management was a
primary goal of this research. The author of this work posits that this scale would be a
valuable measuring tool for organizations’ building improved Problem Management
processes. According to Deming’s Plan-Do-Check-Act (PDCA) model, the last two steps
(Check-Act) require one to verify the process outcomes which occurred as planned in the
beginning of the process and then, act on the information gained (Deming, 1994;
Scherkenbach, 1992). If the PMM model and Deming’s PDCA model were combined,
one could build a Problem Management process via an iterative approach using the
maturity scale to check the results of the process and then act to improve the process.
These concepts are the basis for the processes outlined in the fifth ITILv3 book,
Continual Service Improvement.
Another benefit of the PMM model is to identify areas that could possibly have
the largest process improvement impact for their organization. With the area(s) for
process improvement identified, the organization can focus effort on how to improve the
process instead of debating what to improve
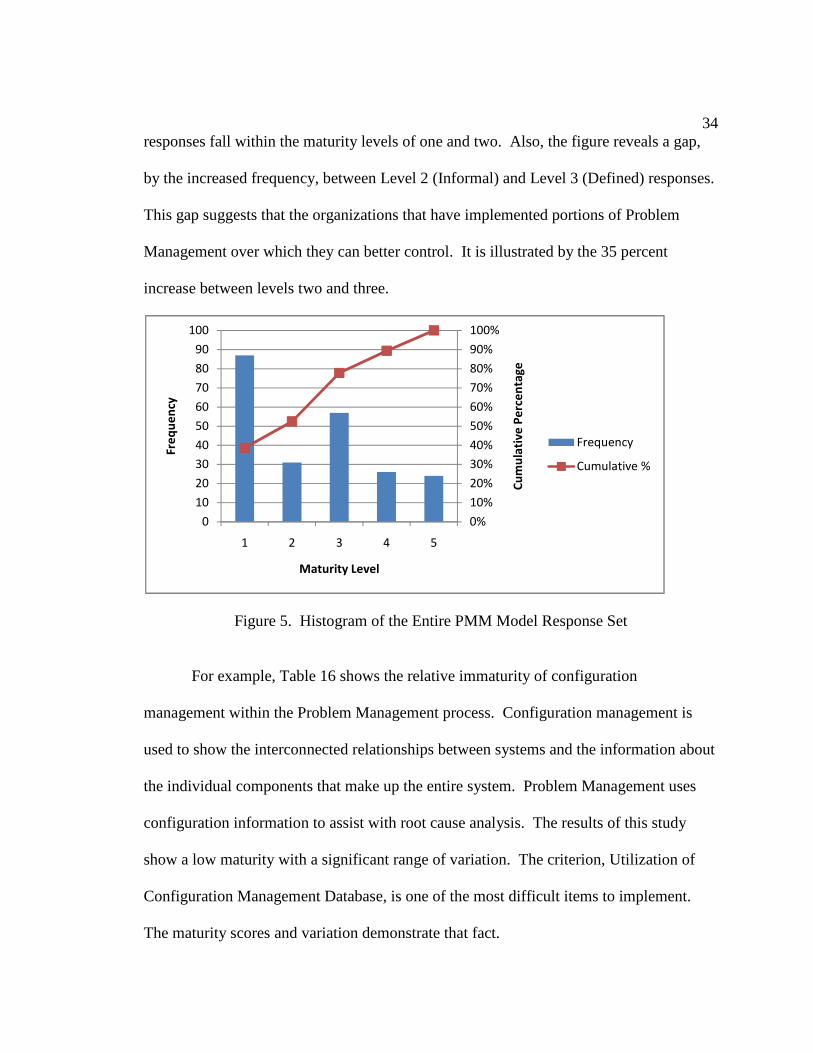
Figure 5 is a histogram of the entire PMM Model response set from all 25
respondents. The high frequency of Level 1 (Ad-hoc) responses indicates that there are
many respondents which have hardly taken a first step toward improving their Problem
Management process. It also illustrates the overall Problem Management maturity for
most organizations is still an emerging and developing topic. Over 52 percent of the
34
responses fall within the maturity levels of one and two. Also, the figure reveals a gap,
by the increased frequency, between Level 2 (Informal) and Level 3 (Defined) responses.
This gap suggests that the organizations that have implemented portions of Problem
Management over which they can better control. It is illustrated by the 35 percent
increase between levels two and three.
Figure 5. Histogram of the Entire PMM Model Response Set
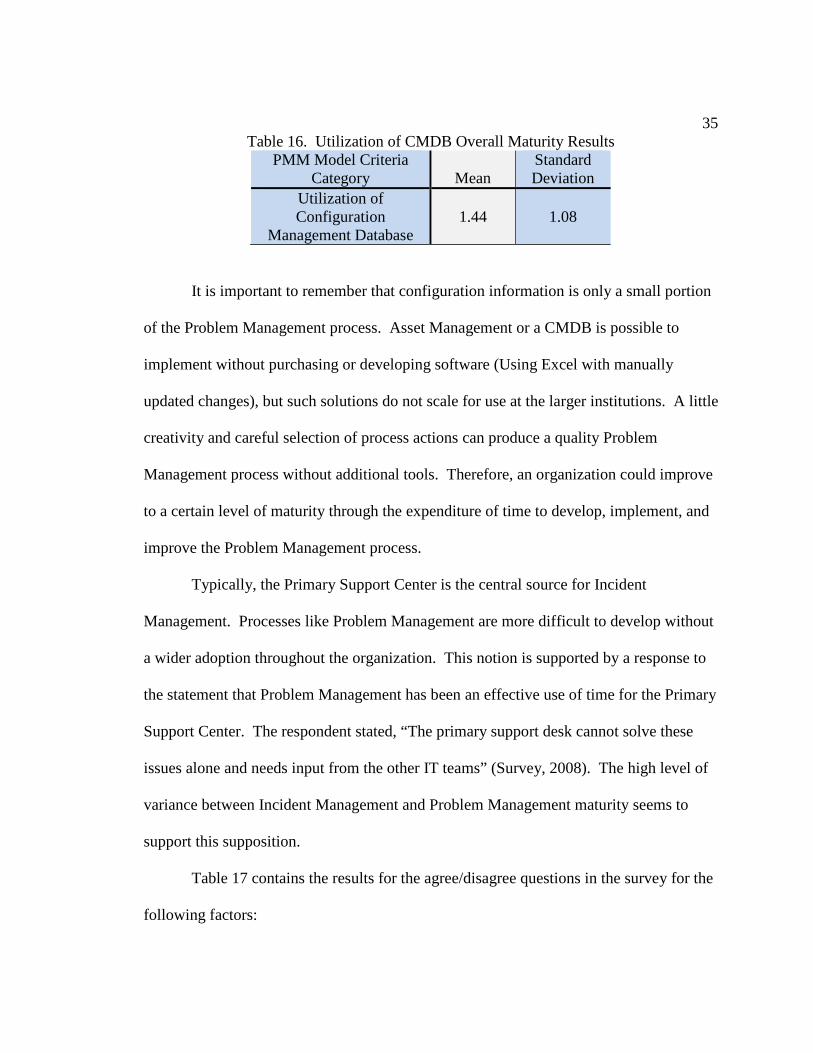
For example, Table 16 shows the relative immaturity of configuration
management within the Problem Management process. Configuration management is
used to show the interconnected relationships between systems and the information about
the individual components that make up the entire system. Problem Management uses
configuration information to assist with root cause analysis. The results of this study
show a low maturity with a significant range of variation. The criterion, Utilization of
Configuration Management Database, is one of the most difficult items to implement.
The maturity scores and variation demonstrate that fact.
0%
10%
20%
30%
40%
50%
60%
70%
80%
90%
100%
0
10
20
30
40
50
60
70
80
90
100
1 2 3 4 5
Cu
mu
lati
ve
Pe
rce
nta
ge
Fre
qu
en
cy
Maturity Level
Frequency
Cumulative %
35
Table 16. Utilization of CMDB Overall Maturity Results PMM Model Criteria
Category Mean Standard Deviation
Utilization of Configuration
Management Database 1.44 1.08
It is important to remember that configuration information is only a small portion
of the Problem Management process. Asset Management or a CMDB is possible to
implement without purchasing or developing software (Using Excel with manually
updated changes), but such solutions do not scale for use at the larger institutions. A little
creativity and careful selection of process actions can produce a quality Problem
Management process without additional tools. Therefore, an organization could improve
to a certain level of maturity through the expenditure of time to develop, implement, and
improve the Problem Management process.
Typically, the Primary Support Center is the central source for Incident
Management. Processes like Problem Management are more difficult to develop without
a wider adoption throughout the organization. This notion is supported by a response to
the statement that Problem Management has been an effective use of time for the Primary
Support Center. The respondent stated, “The primary support desk cannot solve these
issues alone and needs input from the other IT teams” (Survey, 2008). The high level of
variance between Incident Management and Problem Management maturity seems to
support this supposition.
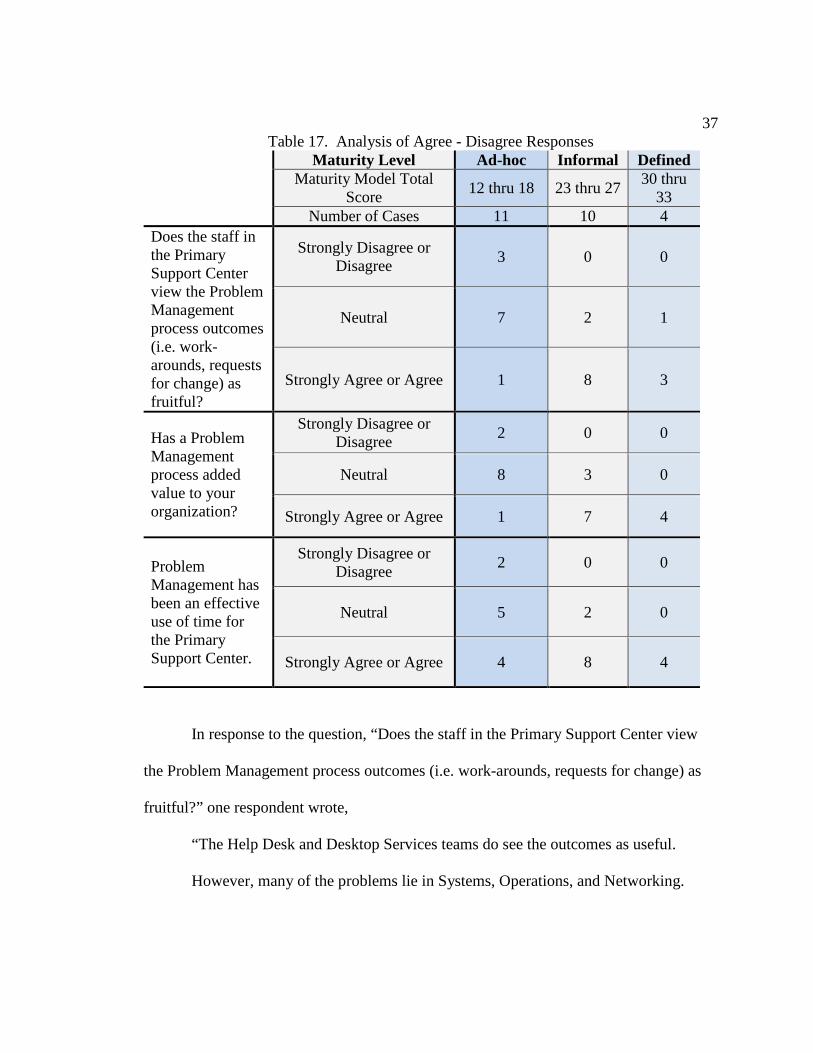
Table 17 contains the results for the agree/disagree questions in the survey for the
following factors:
36
• Does the staff in the Primary Support Center view the Problem Management
process outcomes (i.e. work-arounds, requests for change) as fruitful?
• Has a Problem Management process added value to your organization?
• Do you agree or disagree with the following statement? Problem Management
has been an effective use of time for the Primary Support Center.
As an organization’s process becomes more mature; they continue to better understand
the value proposition provided from Problem Management as they can benefit in their
own organization. This factor is demonstrated in Table 17 by the reduction of disagree or
neutral responses to the questions listed above.
37
Table 17. Analysis of Agree - Disagree Responses Maturity Level Ad-hoc Informal Defined
Maturity Model Total Score
12 thru 18 23 thru 27 30 thru
33 Number of Cases 11 10 4
Does the staff in the Primary Support Center view the Problem Management process outcomes (i.e. work-arounds, requests for change) as fruitful?
Strongly Disagree or Disagree
3 0 0
Neutral 7 2 1
Strongly Agree or Agree 1 8 3
Has a Problem Management process added value to your organization?
Strongly Disagree or Disagree
2 0 0
Neutral 8 3 0
Strongly Agree or Agree 1 7 4
Problem Management has been an effective use of time for the Primary Support Center.
Strongly Disagree or Disagree
2 0 0
Neutral 5 2 0
Strongly Agree or Agree 4 8 4
In response to the question, “Does the staff in the Primary Support Center view
the Problem Management process outcomes (i.e. work-arounds, requests for change) as
fruitful?” one respondent wrote,
“The Help Desk and Desktop Services teams do see the outcomes as useful.
However, many of the problems lie in Systems, Operations, and Networking.
38
Members of those teams do not see the process outcomes as necessary and often
do not provide the follow-thru needed to thoroughly close a Problem ticket.”
This is an interesting response because the groups with direct customer contact grasp the
value of Problem Management. Problem Management is much more than fixing the root
cause of an issue with a technology. A key facet of Problem Management is capturing
knowledge. It is clear from the statement above that the Systems, Operations, and
Networking teams may not fully understand the impact of following the process.
Captured knowledge can be used to allow faster resolution of incidents which leads to
more time to work on other tasks or projects.
One survey response was an admonition that tracking problem tickets is a
significant success for the organization. The respondent went on to write, “These are as
useful for the technical staff and the university community as the Problems reported as
seen by our users in the self-service support portal,” which is a great demonstration of
using process to explain IT’s value to the customer. This organization has created a layer
of transparency to allow the users to easily see if they may be affected by a known error
in their computing environment.
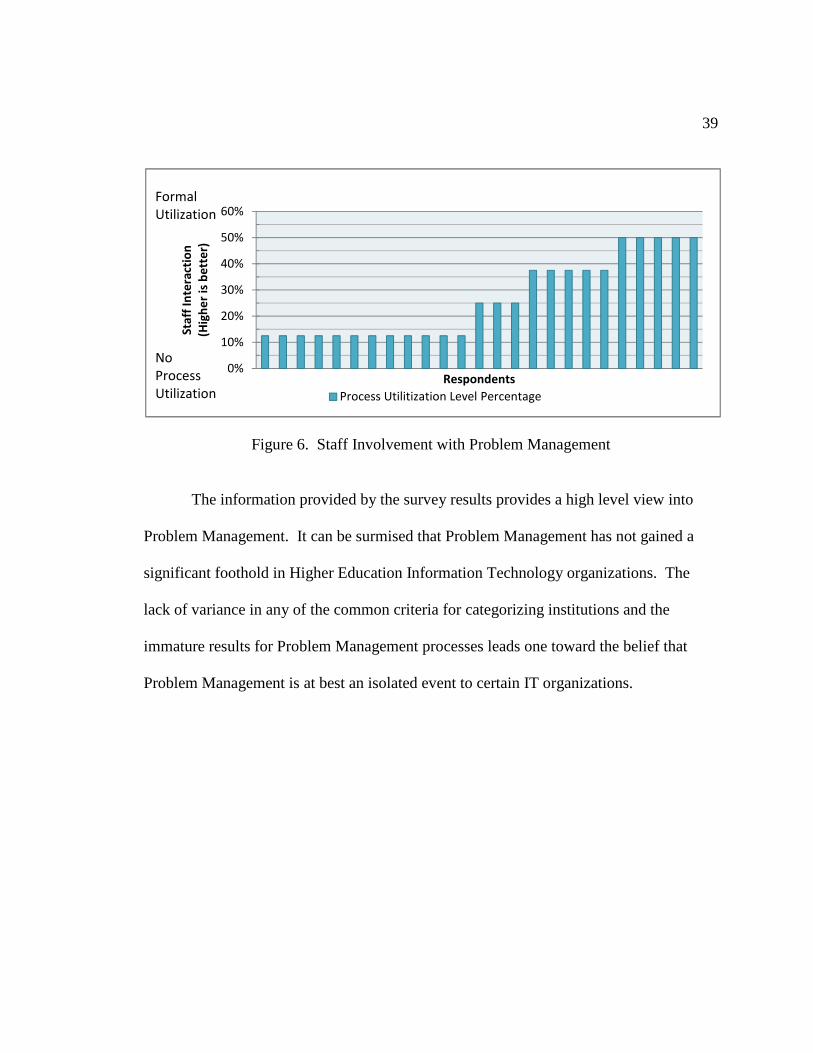
Figure 6 outlines the results for the staff’s involvement in Problem Management.
The respondents’ staff used about 12% to 50% of the opportunities to interact with the
process. Even the most mature organizations underutilize the staff interaction with the
process. Yet again, the data shows that Problem Management processes are immature
and not properly utilized.
39
Figure 6. Staff Involvement with Problem Management
The information provided by the survey results provides a high level view into
Problem Management. It can be surmised that Problem Management has not gained a
significant foothold in Higher Education Information Technology organizations. The
lack of variance in any of the common criteria for categorizing institutions and the
immature results for Problem Management processes leads one toward the belief that
Problem Management is at best an isolated event to certain IT organizations.
0%
10%
20%
30%
40%
50%
60%
Sta
ff I
nte
ract
ion
(Hig
he
r is
be
tte
r)
Respondents
Process Utilitization Level Percentage
No
Process
Utilization
Formal
Utilization
40
LIMITATIONS
The results from the survey pointed out three possible condition combinations
(i.e. states) to add to the model:
• Problem records are captured and tied to related Incidents but not categorized
• Organizational Problem Management process has not been developed
• The work-arounds and requests for change receive limited testing and active
follow-up is performed with Problem Management reporting measurements.
The added state for Problem Records of captured and tied to related Incidents but not
categorized is unusual. The state is not an inconceivable combination of activities for
problem record. It seems to be an unlikely occurrence from the author’s point of view
but it was brought into focus by the survey results.
The added state for Organizational Problem Management of the process has not
been developed was an oversight in the model development. All the other stages for
Organizational Problem Management required the organization to have a documented
process. There was no option in the model to report that there was no process.
The added state for work-arounds and requests for change of received limited
testing and active follow-up was performed with Problem Management reporting and
measurements was added to the model. It was a logical iteration that was missed during
the model design phase. Upon review of the results, it became apparent that it was a
logical state to perform quality assurance on problem resolutions. The combination of
41
limited testing and active follow-up could provide the most value with the least amount
of investment.
The criterion for Adoption of Problem Management proved to be answered
inconsistently. The method used to solicit the information about the staff’s involvement
with Problem Management combines three interrelated topics. It was intended that the
respondent would logically pick one answer from each of the three aspects because some
of the options were mutually exclusive. Unfortunately, the survey did not enforce the
mutual exclusivity so the resulting data did not map to the model. Therefore, this study
cannot confirm the validity of the Adoption of Problem Management portion of the PMM
Model.
The model brought forward in this study provides a solid quick assessment tool.
The overview nature of the model does not provide process implementation details. It
could be used to start development on a shell or skeletal process but one will have to use
other sources to complete the development. The PMM Model’s purpose is as an
assessment tool.
42
APPLICATION TO PRACTICE
This maturity model can be used by organizations to set realistic goals for
building and improving a Problem Management process. It can be used as a checklist of
items necessary to include in the process. It would be quite difficult to build and
introduce a process that works at an Institutional level. An organization can use the
PMM model to validate the process maturity during development which would then
allow that organization to introduce a successful process.
Combining the PMM model maturity scale and the PDCA model yields an
especially compelling tool to help an organization successfully add a continual service
improvement process for Problem Management for their organizational structure. It
introduces a couple of topics at an individual process level which can then be tackled
successfully. Being able to successfully introduce a process to an organization and then
improve the process will further expand the returns on the investment.
Real World Applications for the PMM Model
Change Management Introduction
One respondent provided a real world tale about how they were driven to a
process based approach for their support organization.
“Our networking group decided to do an upgrade to an electrical panel, but
neglected to tell anyone that the network would be down on a Saturday morning
very early since it was only going to take half an hour to complete. The upgrade
did not go as planned and power to the platform was out for more than 6 hours.
43
Because no one knew about the upgrade, no one notified the academic side of the
house that there might be issues. Online exams had been scheduled and could not
be canceled. All servers were down and the server group had no way of providing
service. This led to the creation of our change management committee. All RFC
must now be reviewed and approved before any changes can be acted on.”
While it does not directly relay information about Problem Management at the
organization, it does demonstrate the need to manage IT from the customer’s point of
view and expectations.
Application of Problem Management at Boise State
The researcher was charged with developing a Problem Management process
while working for Boise State University. The initial task was to recommend a process to
the User Services Manager. The recommendation was then up for review and discussion.
It proved to be a challenge to use the existing tools and Incident process to introduce a
Problem Management process.
It became apparent to the researcher that change must be managed: not change in
technology, but change in human processes. The effort to develop the new process was
as much about building the new tool for the department as it was about managing people
and their expectations and disagreements with the new process.
A process was developed with two key aspects in mind. The first aspect was
selecting the best combination of process and what could be introduced as new
requirements without overwhelming the staff. Another key driver was the fact that only
44
minimal changes could be requested to existing systems and no money was available to
purchase new systems to support the new process.
An iterative approach was selected to implement the new Problem Management
process. This approached allowed the introduction of a process that had key important
components but still needed further improvements to become a robust mature process.
The key process requirements were selected to develop the structure of the process. The
following key process actions were selected for inclusion in the initial Problem
Management process:
• Problem Identified
• Open Problem Ticket
• Document Known Error
• Set Priority and Make Assignment
• Diagnose the Issue
• Escalate Based on Categorization and Prioritization
• Develop Workaround
• Submit a Request for Change
• Close Problem Ticket
Boise State University has recently introduced a new knowledge base for its IT staff
to use. A core value of Problem Management was providing information for the staff to
use during Incident Management, so creation of new articles in the knowledge base was
specifically highlighted during the process development.
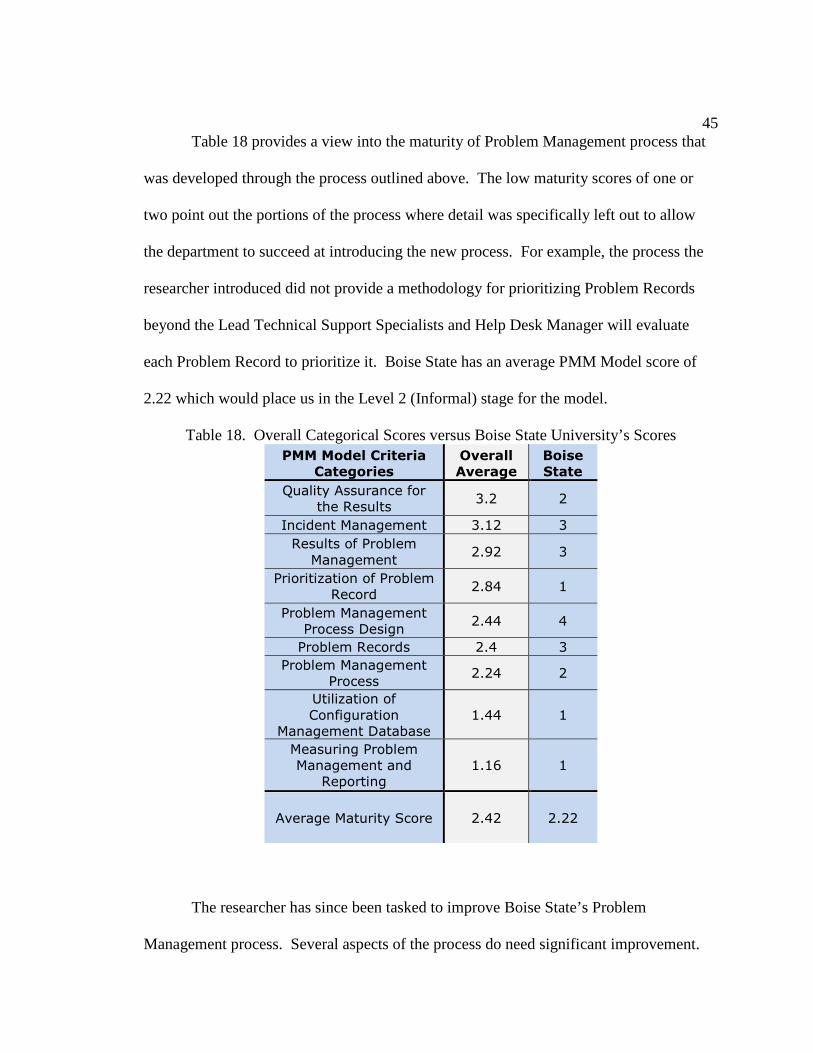
45
Table 18 provides a view into the maturity of Problem Management process that
was developed through the process outlined above. The low maturity scores of one or
two point out the portions of the process where detail was specifically left out to allow
the department to succeed at introducing the new process. For example, the process the
researcher introduced did not provide a methodology for prioritizing Problem Records
beyond the Lead Technical Support Specialists and Help Desk Manager will evaluate
each Problem Record to prioritize it. Boise State has an average PMM Model score of
2.22 which would place us in the Level 2 (Informal) stage for the model.
Table 18. Overall Categorical Scores versus Boise State University’s Scores PMM Model Criteria
Categories
Overall
Average
Boise
State
Quality Assurance for
the Results 3.2 2
Incident Management 3.12 3
Results of Problem
Management 2.92 3
Prioritization of Problem
Record 2.84 1
Problem Management
Process Design 2.44 4
Problem Records 2.4 3
Problem Management
Process 2.24 2
Utilization of
Configuration
Management Database
1.44 1
Measuring Problem
Management and
Reporting
1.16 1
Average Maturity Score 2.42 2.22
The researcher has since been tasked to improve Boise State’s Problem
Management process. Several aspects of the process do need significant improvement.
46
Management has identified measureable and meaningful goals as a key aspect to add to
the enhanced process. There are several aspects under consideration for the goals:
• What are reasonable time frames to identify reasonable workarounds or request
for change?
• How do we measure goals for the individual, department, or IT organization?
• How do we measure time allocated to staff for Problem Management?
The PMM model was used to select the correct actions for the Problem Management
process. The current process is at a Level 2 (Informal) maturity using the PMM model,
so a significant improvement can be seen by moving to a Level 3 (Defined) maturity.
Time is needed to build a set of goals for Problem Management that match the
department’s goals, which can be measured and provide meaning. One example of a goal
could be that User Services identifies two problems per month. This is a measurable
goal, but the significance of this goal is highly dependent on the department’s or
organization’s goals. In this case, Boise State wants to drive usage of the Problem
Management process so the goal has meaning. This goal may no longer of consequence
in a year, but an iterative approach via the PDCA process would allow Boise State to
update or remove the goal at any time according to the business needs.
47
FUTURE RESEARCH
The scope of the survey conducted for this research was limited to the validation
of the PMM Model. The next step is to move to a wider survey to gather more data about
Problem Management. The additional data could be used to identify trends for Problem
Management; further study could go even deeper to assess the usefulness of Problem
Management.
The maturity results are for only North American universities. It could be
interesting to broaden the study to an international scope to gain a better view of Problem
Management in Higher Education. Another avenue to consider is researching Problem
Management in business and government which could result in a comparison between the
three organization types.
There are a limited number of studies on individual ITIL processes. ITIL has a
number of different processes none of which have been studied with any depth. The
methods used to research Problem Management could be applied to any other ITIL
process.
48
WORKS CITED
Alison, C., Ashley, H., Colin, R., Ivor, M., John, W., & Stuart, R. (2007). An
Introductory Overview of ITIL® V3. UK: The UK Chapter of the itSMF.
Ann, A. (2007, October 23). ITIL's Service Bureau Approach to IT Yields Big Benefits,
Say Experts. Retrieved Feburary 15, 2009, from IT Business Edge:
http://www.itbusinessedge.com/blogs/tve/?p=213
Benner, M., Radisic, I., & Schollmeyer, M. (2002). A Criteria Catalog Based
Methodology for Analyzing Service Management Processes. Managemetn
technologies for E-commerce and E-business applications: 13th IFIP/IEEE
International Workship on Distributed Systems; Operations and Management ,
145-157.
Bon, J. v. (Ed.). (2007). IT Service Management Based on ITIL V3: A Pocket Guide (First
edition ed.). Zaltbommel, Netherlands: Van Haren Publishing.
Breslin, P. (2004, April). ISO / IEC 20000 - Publications. Retrieved August 10, 2008,
from ISO/IEC 20000 Certification web site :
http://www.isoiec20000certification.com/publications/index.asp
Carr, N. G. (2004). Does IT matter? : Information Technology and the Corrosion of
Competitive Advantage. Boston: Harvard Business School Press.
Cater-Steel, A. P., & Pollard, C. E. (2008). Conflicting views on ITIL implementation:
managed as a project – or business as usual? 2008 International Conference on
49
Information Resources Management . Niagara Falls, Ontario, Canada: CONF-
IRM 2008.
Cater-Steel, A., & Toleman, M. (2007). Education for IT Service Management Standards.
(K. Jakobs, Ed.) International Journal of IT Standards and Standardization
Research , 5 (2), 27-41.
CMMI for Services. (2009, March 05). Retrieved March 05, 2009, from Software
Engineering Institute: http://www.sei.cmu.edu/cmmi/models/CMMI-Services-
status.
Daniel, W. W., & Terrell, J. C. (1983). Business Statistics (3rd Edition ed.). Boston:
Houghton Mifflin Company.
Davis, R., & Maxwell, S. (2004). The Comprehensive IT Help Desk: A Single Point-of-
Contact for the University Community. In Proceedings of the 32nd Annual ACM
SIGUCCS Conference on User Services (Baltimore, MD, USA, October 10 - 13,
2004) (pp. 37-39). New York, NY: ACM.
Deming, W. E. (1994). The New Economics for Industry, Government, Education.
Cambridge, MA: The MIT Press.
England, R. (2006, June 11). The Emperor has no clothes. Where is the evidence for
ITIL? Retrieved July 17, 2008, from The IT Skeptic:
http://www.itskeptic.org/node/21
Fitzgerald, M. (2008). 2008 Comparison Survey. Colorado Springs, CO: Higher
education Forum.
50
Flora, B. (2008, June 15). Using ITIL to Drive Business Innovation. Retrieved August 9,
2008, from CIO Magazine:
http://advice.cio.com/brian_flora/using_itil_to_drive_business_innovation
Galup, S., Quan, J. J., Dattero, R., & Conger, S. (2007). Information technology service
management: an emerging area for academic research and pedagogical
development. In Proceedings of the 2007 ACM SIGMIS CPR Conference on
Computer Personnel Doctoral Consortium and Research Conference: the Global
information Technology Workforce (St. Louis, Missouri, USA, April 19 - 21,
2007) (pp. 46-52). New York, NY: ACM.
Godfrey, S. (2004, August 9). GSFC's On-Line Training. Retrieved February 17, 2009,
from NASA Goddard Space Flight Center:
http://software.gsfc.nasa.gov/docs/What%20is%20CMMI.ppt
Hochstein, A., Zarnekow, R., & Brenner, W. (2005). ITIL as Common Practice
Reference Model for IT Service Management: Formal Assessment and
Implications for Practice. The 2005 IEEE International Conference on e-
Technology, e-Commerce and e-Service, 2005. EEE '05. Proceedings (pp. 704-
710). IEEE.
Hoel, P. G. (1966). Elementary Statistics. New York: John Wiley & Sons, Inc.
Jones, C. F. (1996). Desk, Beyond Evolution: The Transformation of the Princeton
University Help. In Proceedings of the 24th Annual ACM SIGUCCS Conference
on User Services (Chicago, Illinois, United States, November 09 - 12, 1997) (pp.
81-83). New York, NY: ACM.
51
Office of Government Commerce. (2008). OCG - ITIL. Retrieved June 21, 2008, from
Office of Government Commerce: http://www.ogc.gov.uk/guidance_itil_4899.asp
Office of Government Commerce. (2007). Service Operation. London: The Stationery
Office.
Office of Government Commerce. (2004). Service Support (Seventh Impression 2004
ed.). London: The Stationary Office.
Persse, J. R. (2006). Process Improvement Essentials. Beijing: O'Reilly.
Potgieter, B. C., Botha, J. H., & Lew, C. (2004). Evidence that use of the ITIL framework
is effective. Proceedings of the 17th Annual Conference of the National Advisory
Committee on Computing Qualifications, 6th - 9th July 2004 (pp. 161-168).
Hamilton, N.Z.: National Advisory Committee on Computing Qualifications.
Scherkenbach, W. W. (1992). The Deming Route to Quality and Productivity Road Maps
and Roadblocks (13th Printing ed.). Washington D.C.: CEEPress Books.
Tan, W.-G., Cater-Steel, A., Toleman, M., & Seaniger, R. (2007). Implementing
Centralised IT Service Management: Drawing Lessons from the Public Sector.
ACIS2007 Proceedings of the 18th Australasian Conference on Information
Systems (pp. 1060-1068). Toowoomba, Australia: The University of Southern
Queensland.

52
APPENDIX A
Criteria for Quality Problem Management
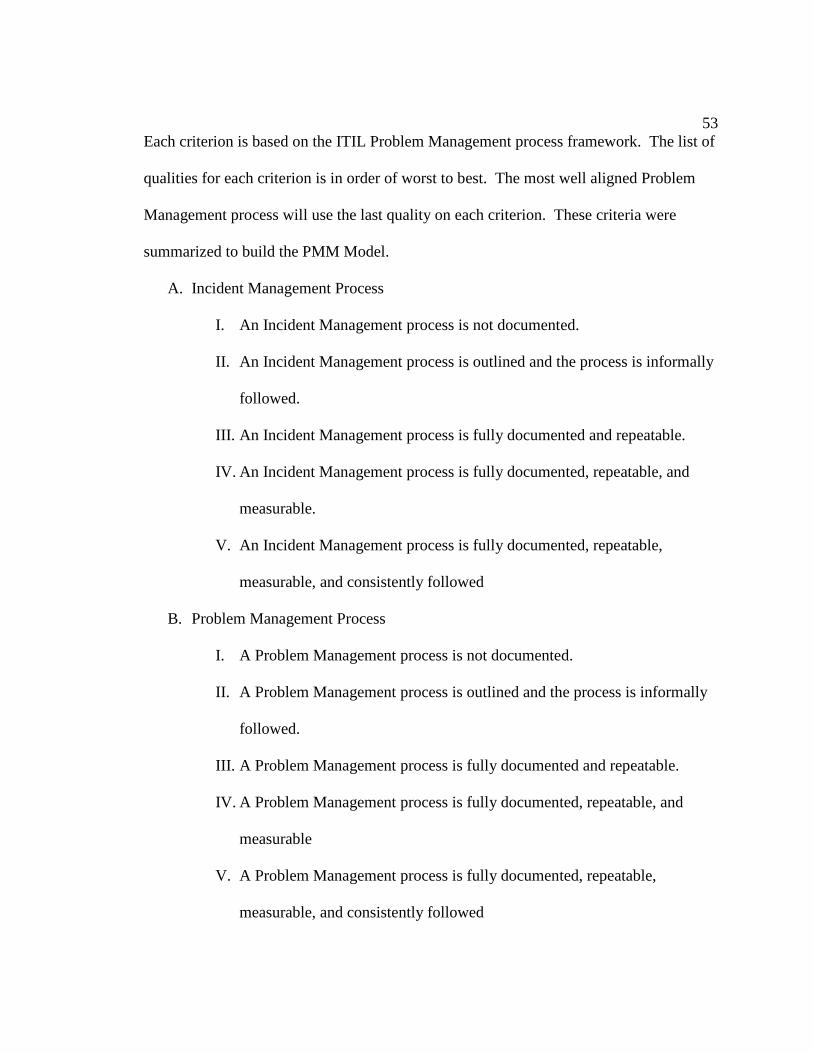
53
Each criterion is based on the ITIL Problem Management process framework. The list of
qualities for each criterion is in order of worst to best. The most well aligned Problem
Management process will use the last quality on each criterion. These criteria were
summarized to build the PMM Model.
A. Incident Management Process
I. An Incident Management process is not documented.
II. An Incident Management process is outlined and the process is informally
followed.
III. An Incident Management process is fully documented and repeatable.
IV. An Incident Management process is fully documented, repeatable, and
measurable.
V. An Incident Management process is fully documented, repeatable,
measurable, and consistently followed
B. Problem Management Process
I. A Problem Management process is not documented.
II. A Problem Management process is outlined and the process is informally
followed.
III. A Problem Management process is fully documented and repeatable.
IV. A Problem Management process is fully documented, repeatable, and
measurable
V. A Problem Management process is fully documented, repeatable,
measurable, and consistently followed
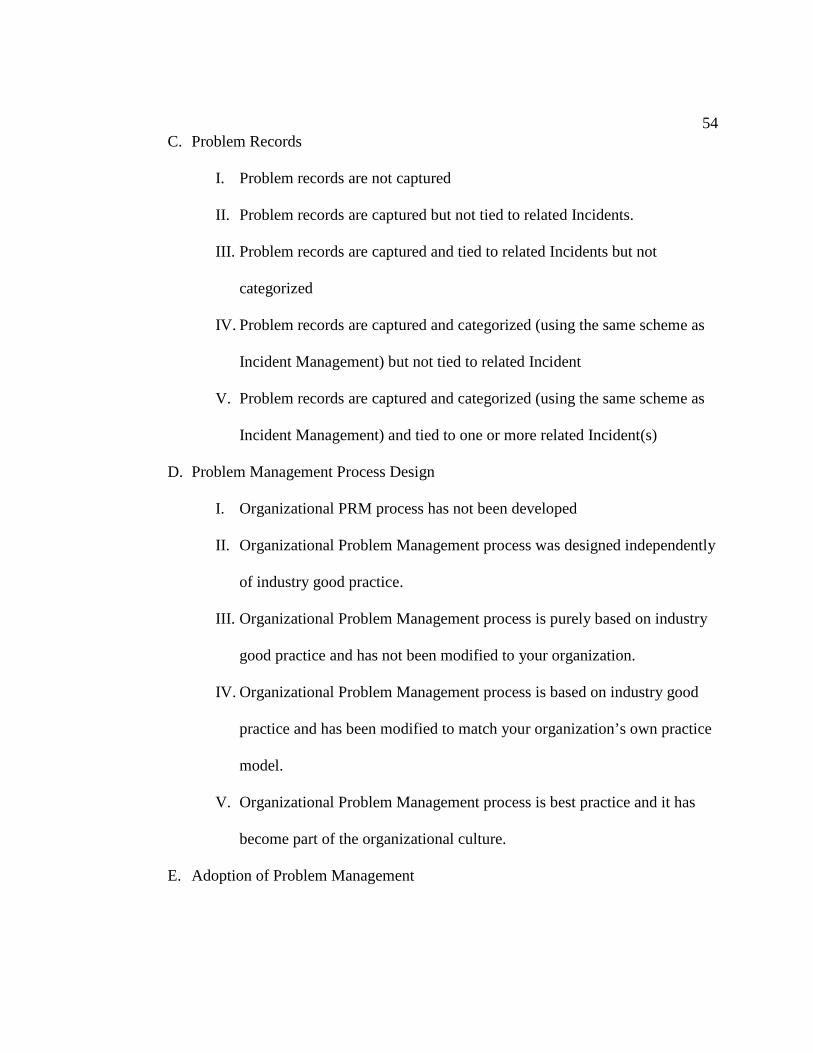
54
C. Problem Records
I. Problem records are not captured
II. Problem records are captured but not tied to related Incidents.
III. Problem records are captured and tied to related Incidents but not
categorized
IV. Problem records are captured and categorized (using the same scheme as
Incident Management) but not tied to related Incident
V. Problem records are captured and categorized (using the same scheme as
Incident Management) and tied to one or more related Incident(s)
D. Problem Management Process Design
I. Organizational PRM process has not been developed
II. Organizational Problem Management process was designed independently
of industry good practice.
III. Organizational Problem Management process is purely based on industry
good practice and has not been modified to your organization.
IV. Organizational Problem Management process is based on industry good
practice and has been modified to match your organization’s own practice
model.
V. Organizational Problem Management process is best practice and it has
become part of the organizational culture.
E. Adoption of Problem Management
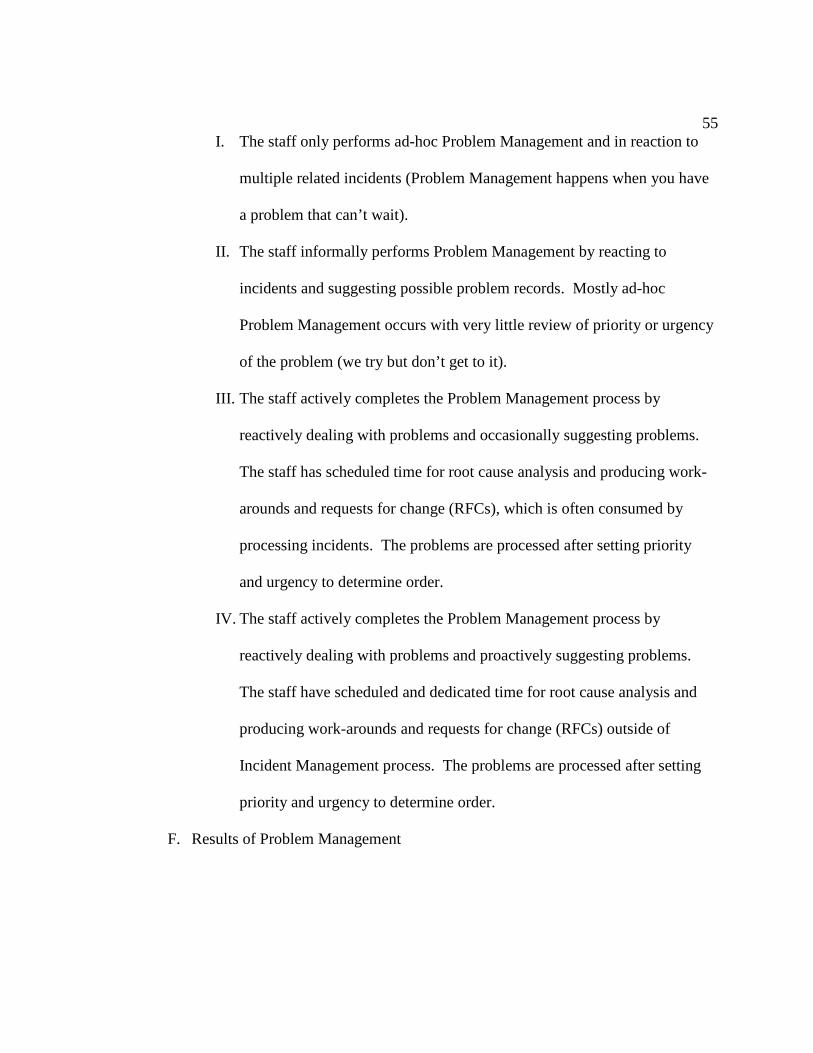
55
I. The staff only performs ad-hoc Problem Management and in reaction to
multiple related incidents (Problem Management happens when you have
a problem that can’t wait).
II. The staff informally performs Problem Management by reacting to
incidents and suggesting possible problem records. Mostly ad-hoc
Problem Management occurs with very little review of priority or urgency
of the problem (we try but don’t get to it).
III. The staff actively completes the Problem Management process by
reactively dealing with problems and occasionally suggesting problems.
The staff has scheduled time for root cause analysis and producing work-
arounds and requests for change (RFCs), which is often consumed by
processing incidents. The problems are processed after setting priority
and urgency to determine order.
IV. The staff actively completes the Problem Management process by
reactively dealing with problems and proactively suggesting problems.
The staff have scheduled and dedicated time for root cause analysis and
producing work-arounds and requests for change (RFCs) outside of
Incident Management process. The problems are processed after setting
priority and urgency to determine order.
F. Results of Problem Management
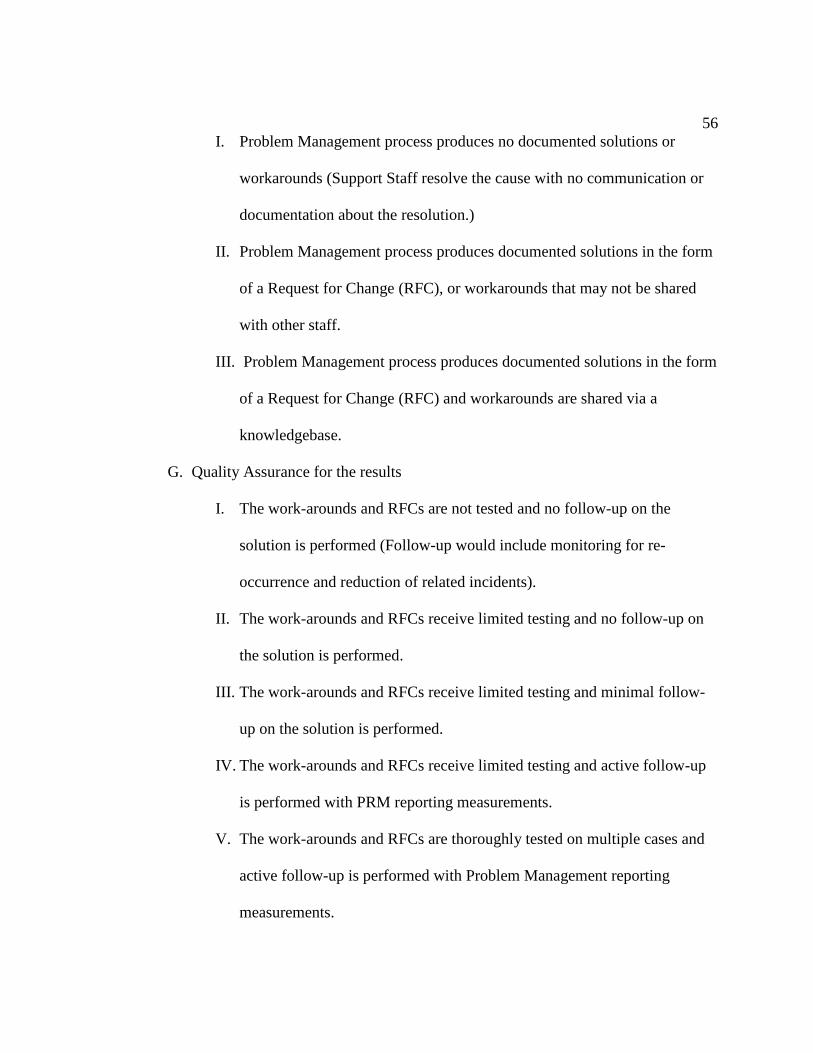
56
I. Problem Management process produces no documented solutions or
workarounds (Support Staff resolve the cause with no communication or
documentation about the resolution.)
II. Problem Management process produces documented solutions in the form
of a Request for Change (RFC), or workarounds that may not be shared
with other staff.
III. Problem Management process produces documented solutions in the form
of a Request for Change (RFC) and workarounds are shared via a
knowledgebase.
G. Quality Assurance for the results
I. The work-arounds and RFCs are not tested and no follow-up on the
solution is performed (Follow-up would include monitoring for re-
occurrence and reduction of related incidents).
II. The work-arounds and RFCs receive limited testing and no follow-up on
the solution is performed.
III. The work-arounds and RFCs receive limited testing and minimal follow-
up on the solution is performed.
IV. The work-arounds and RFCs receive limited testing and active follow-up
is performed with PRM reporting measurements.
V. The work-arounds and RFCs are thoroughly tested on multiple cases and
active follow-up is performed with Problem Management reporting
measurements.
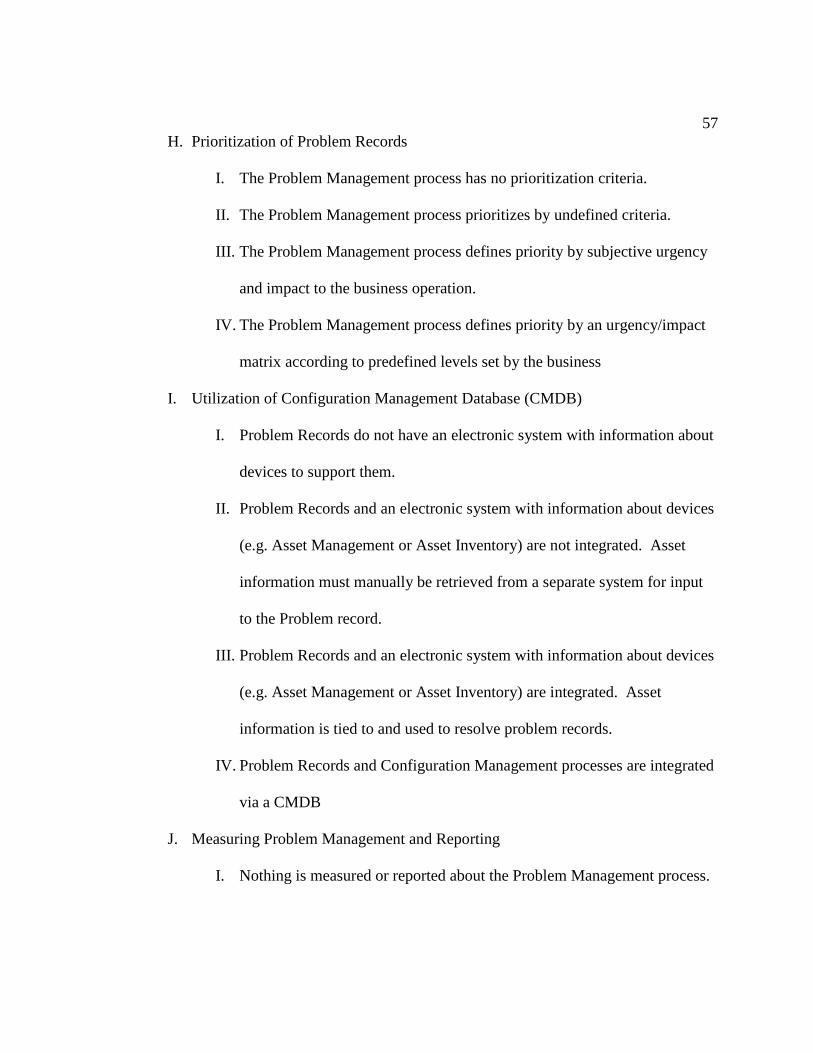
57
H. Prioritization of Problem Records
I. The Problem Management process has no prioritization criteria.
II. The Problem Management process prioritizes by undefined criteria.
III. The Problem Management process defines priority by subjective urgency
and impact to the business operation.
IV. The Problem Management process defines priority by an urgency/impact
matrix according to predefined levels set by the business
I. Utilization of Configuration Management Database (CMDB)
I. Problem Records do not have an electronic system with information about
devices to support them.
II. Problem Records and an electronic system with information about devices
(e.g. Asset Management or Asset Inventory) are not integrated. Asset
information must manually be retrieved from a separate system for input
to the Problem record.
III. Problem Records and an electronic system with information about devices
(e.g. Asset Management or Asset Inventory) are integrated. Asset
information is tied to and used to resolve problem records.
IV. Problem Records and Configuration Management processes are integrated
via a CMDB
J. Measuring Problem Management and Reporting
I. Nothing is measured or reported about the Problem Management process.
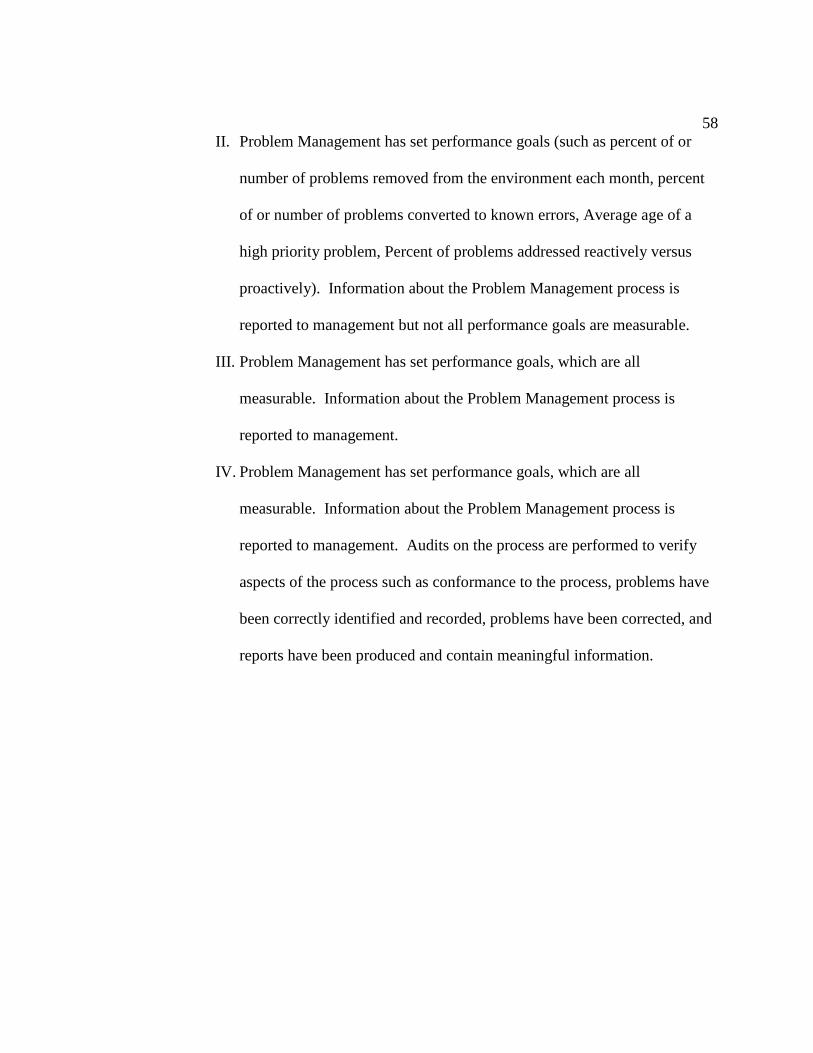
58
II. Problem Management has set performance goals (such as percent of or
number of problems removed from the environment each month, percent
of or number of problems converted to known errors, Average age of a
high priority problem, Percent of problems addressed reactively versus
proactively). Information about the Problem Management process is
reported to management but not all performance goals are measurable.
III. Problem Management has set performance goals, which are all
measurable. Information about the Problem Management process is
reported to management.
IV. Problem Management has set performance goals, which are all
measurable. Information about the Problem Management process is
reported to management. Audits on the process are performed to verify
aspects of the process such as conformance to the process, problems have
been correctly identified and recorded, problems have been corrected, and
reports have been produced and contain meaningful information.

59
APPENDIX B
PMM Model Results
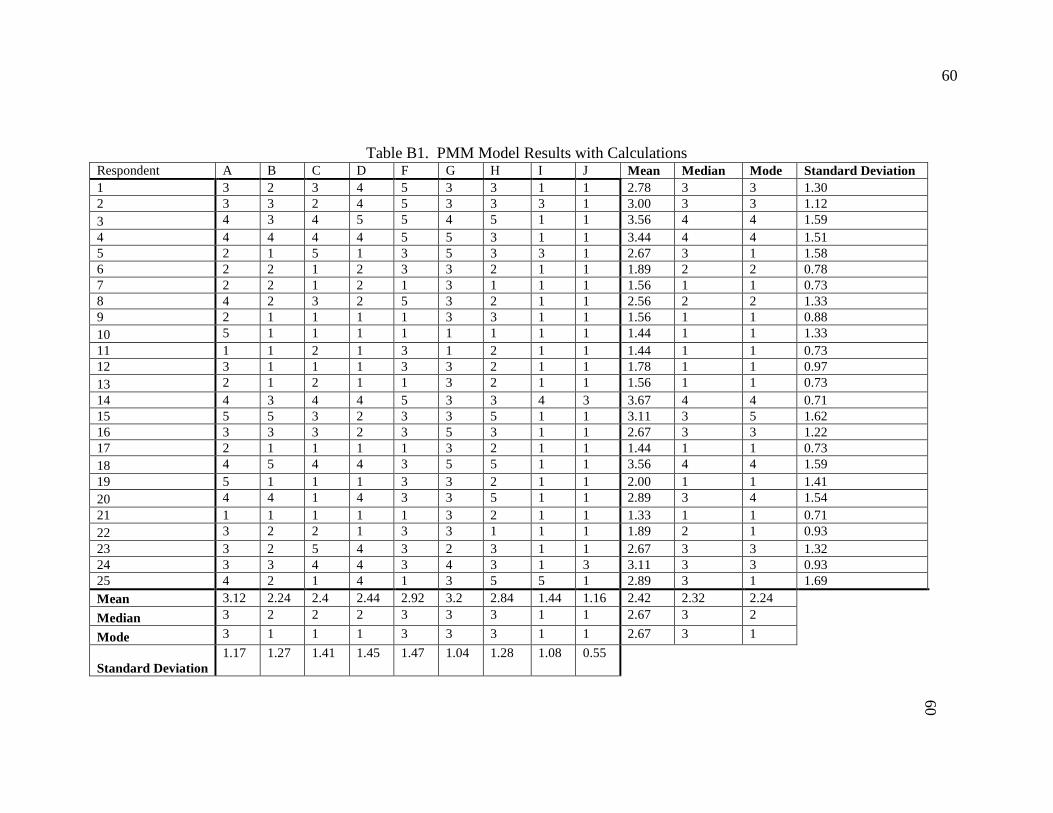
60
60
Table B1. PMM Model Results with Calculations Respondent A B C D F G H I J Mean Median Mode Standard Deviation 1 3 2 3 4 5 3 3 1 1 2.78 3 3 1.30 2 3 3 2 4 5 3 3 3 1 3.00 3 3 1.12 3 4 3 4 5 5 4 5 1 1 3.56 4 4 1.59 4 4 4 4 4 5 5 3 1 1 3.44 4 4 1.51 5 2 1 5 1 3 5 3 3 1 2.67 3 1 1.58 6 2 2 1 2 3 3 2 1 1 1.89 2 2 0.78 7 2 2 1 2 1 3 1 1 1 1.56 1 1 0.73 8 4 2 3 2 5 3 2 1 1 2.56 2 2 1.33 9 2 1 1 1 1 3 3 1 1 1.56 1 1 0.88 10 5 1 1 1 1 1 1 1 1 1.44 1 1 1.33 11 1 1 2 1 3 1 2 1 1 1.44 1 1 0.73 12 3 1 1 1 3 3 2 1 1 1.78 1 1 0.97 13 2 1 2 1 1 3 2 1 1 1.56 1 1 0.73 14 4 3 4 4 5 3 3 4 3 3.67 4 4 0.71 15 5 5 3 2 3 3 5 1 1 3.11 3 5 1.62 16 3 3 3 2 3 5 3 1 1 2.67 3 3 1.22 17 2 1 1 1 1 3 2 1 1 1.44 1 1 0.73 18 4 5 4 4 3 5 5 1 1 3.56 4 4 1.59 19 5 1 1 1 3 3 2 1 1 2.00 1 1 1.41 20 4 4 1 4 3 3 5 1 1 2.89 3 4 1.54 21 1 1 1 1 1 3 2 1 1 1.33 1 1 0.71 22 3 2 2 1 3 3 1 1 1 1.89 2 1 0.93 23 3 2 5 4 3 2 3 1 1 2.67 3 3 1.32 24 3 3 4 4 3 4 3 1 3 3.11 3 3 0.93 25 4 2 1 4 1 3 5 5 1 2.89 3 1 1.69 Mean 3.12 2.24 2.4 2.44 2.92 3.2 2.84 1.44 1.16 2.42 2.32 2.24
Median 3 2 2 2 3 3 3 1 1 2.67 3 2
Mode 3 1 1 1 3 3 3 1 1 2.67 3 1
Standard Deviation 1.17 1.27 1.41 1.45 1.47 1.04 1.28 1.08 0.55

61
APPENDIX C
List of Surveyed Organizations
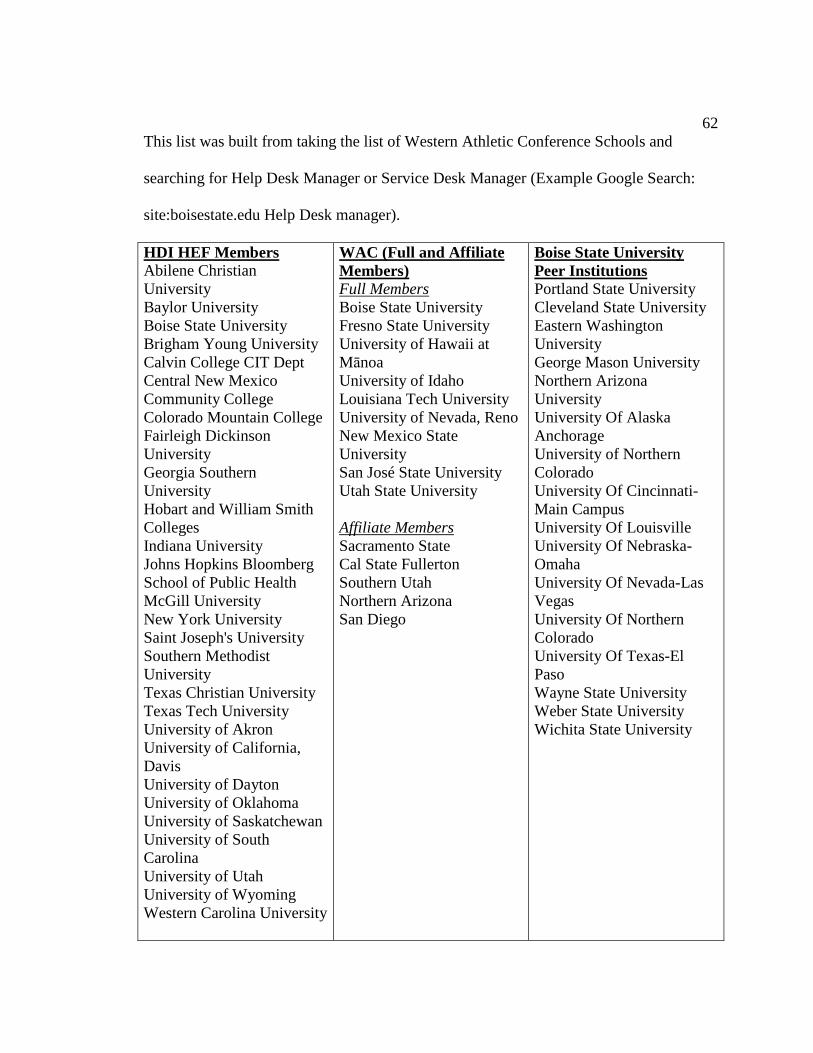
62
This list was built from taking the list of Western Athletic Conference Schools and
searching for Help Desk Manager or Service Desk Manager (Example Google Search:
site:boisestate.edu Help Desk manager).
HDI HEF Members Abilene Christian University Baylor University Boise State University Brigham Young University Calvin College CIT Dept Central New Mexico Community College Colorado Mountain College Fairleigh Dickinson University Georgia Southern University Hobart and William Smith Colleges Indiana University Johns Hopkins Bloomberg School of Public Health McGill University New York University Saint Joseph's University Southern Methodist University Texas Christian University Texas Tech University University of Akron University of California, Davis University of Dayton University of Oklahoma University of Saskatchewan University of South Carolina University of Utah University of Wyoming Western Carolina University
WAC (Full and Affiliate Members) Full Members Boise State University Fresno State University University of Hawaii at Mānoa University of Idaho Louisiana Tech University University of Nevada, Reno New Mexico State University San José State University Utah State University Affiliate Members Sacramento State Cal State Fullerton Southern Utah Northern Arizona San Diego
Boise State University Peer Institutions Portland State University Cleveland State University Eastern Washington University George Mason University Northern Arizona University University Of Alaska Anchorage University of Northern Colorado University Of Cincinnati-Main Campus University Of Louisville University Of Nebraska-Omaha University Of Nevada-Las Vegas University Of Northern Colorado University Of Texas-El Paso Wayne State University Weber State University Wichita State University
63
GLOSSARY
Centralized. A centralized support organization will contain a majority of the institutions' support activities, particularly those regarding decision-making. Little IT support occurs outside of the central support organization's purview.
Customer. Any person, either internal (institution employee) or external, who is
supported by your support center. Decentralized. A decentralized support organization will disperse the support activities
throughout the institution. Several similar support organization structures will exist throughout the institution with very little coordination occurring between them. Core services (such as the network or phone infrastructures) could be managed by a single entity across the entire institution.
Federated. A federated support organization will have a central core support
organization, but units or departments across the institution may also have support offices that have some level of autonomy. A key advantage for this model is that support is provided by people tied to the unit or department. The United States of America is an example of a federated organization.
Incident. Any reduction or interruption to the standard operation of a service, which can
result in a decrease in the quality of the service. Major Incident. An incident with a high impact, or potentially high impact, which
requires a response that is above and beyond that given to normal incidents. Typically, these incidents require cross-company coordination, management escalation, the mobilization of additional resources, and increased communications.
Problem. Unknown underlying cause of one or more Incident. Support Organization. Encompasses one or more support centers as well as other
departments involved in a support organization. Support Center. Most specific level where support is delivered. There may be one or
more of these within a support organization. Example names for a support center could be Help Desk, Service Desk, User Services, or Customer Support.