Embed Size (px)
Citation preview
THE ASSESSMENT OF ATTITUDES TOWARDA QUALITY OF WORKING LIFE PROGRAM
Item Type text; Dissertation-Reproduction (electronic)
Authors BRANDON, RICHARD WILLIAM
Publisher The University of Arizona.
Rights Copyright © is held by the author. Digital access to this materialis made possible by the University Libraries, University of Arizona.Further transmission, reproduction or presentation (such aspublic display or performance) of protected items is prohibitedexcept with permission of the author.
Download date 09/05/2018 19:49:28
Link to Item http://hdl.handle.net/10150/298718
INFORMATION TO USERS
This reproduction was made from a copy of a document sent to us for microfilming. While the most advanced technology has been used to photograph and reproduce this document, the quality of the reproduction is heavily dependent upon the quality of the material submitted.
The following explanation of techniques is provided to help clarify markings or notations which may appear on this reproduction.
1. The sign or "target" for pages apparently lacking from the document photographed is "Missing Page(s)". If it was possible to obtain the missing page(s) or section, they are spliced into the film along with adjacent pages. This may have necessitated cutting through an image and duplicating adjacent pages to assure complete continuity.
2. When an image on the film is obliterated with a round black mark, it is an indication of either blurred copy because of movement during exposure, duplicate copy, or copyrighted materials that should not have been filmed. For blurred pages, a good image of the page can be found in the adjacent frame. If copyrighted materials were deleted, a target note will appear listing the pages in the adjacent frame.
3. When a map, drawing or chart, etc., is part of the material being photographed, a definite method of "sectioning" the material has been followed. It is customary to begin filming at the upper left hand corner of a large sheet and to continue from left to right in equal sections with small overlaps. If necessary, sectioning is continued again—beginning below the first row and continuing on until complete.
4. For illustrations that cannot be satisfactorily reproduced by xerographic means, photographic prints can be purchased at additional cost and inserted into your xerographic copy. These prints are available upon request from the Dissertations Customer Services Department.
5. Some pages in any document may have indistinct print. In all cases the best available copy has been filmed.
University Microfilms
International 300N.Zeeb Road Ann Arbor, Ml 48106

8223003
Brandon, Richard William
THE ASSESSMENT OF ATTITUDES TOWARD A QUALITY OF WORKING LIFE PROGRAM
The University of Arizona PH.D. 1982
University Microfilms
International 300 N. Zeeb Road, Ann Arbor, MI 48106
Copyright 1982
by
Brandon, Richard William
All Rights Reserved

PLEASE NOTE:
In all cases this material has been filmed in the best possible way from the available copy. Problems encountered with this document have been identified here with a check mark V .
1. Glossy photographs or pages
2. Colored illustrations, paper or print
3. Photographs with dark background
4. Illustrations are poor copy
5. Pages with black marks, not original copy
6. Print shows through as there is text on both sides of page
7. Indistinct, broken or small print on several pages ^
8. Print exceeds margin requirements
9. Tightly bound copy with print lost in spine
10. Computer printout pages with indistinct print
11. Page(s) lacking when material received, and not available from school or author.
12. Page(s) seem to be missing in numbering only as text follows.
13. Two pages numbered . Text follows.
14. Curling and wrinkled pages
15. Other
University Microfilms
international


THE ASSESSMENT OF ATTITUDES TOWARD A QUALITY
OF WORKING LIFE PROGRAM
by
Richard William Brandon
A Dissertation Submitted to the Faculty of the
DEPARTMENT OF COUNSELING AND GUIDANCE
In Partial Fulfillment of the Requirements For the Degree of
DOCTOR OF PHILOSOPHY
In the Graduate College
THE UNIVERSITY OF ARIZONA
1 9 8 2
@ Copyright 1982 Richard William Brandon

*
THE UNIVERSITY OF ARIZONA GRADUATE COLLEGE
As members of the Final Examination Committee, we certify that we have read
the dissertation prepared by RICHARD WIT.T.TAM BRANDON
entitled THE ASSESSMENT OF ATTITUDES TOWARD A QUALITY OF
WORKING LIFE PROGRAM
and recommend that it be accepted as fulfilling the dissertation requirement
for the Degree of DOCTOR OF PHIIX5SOPHY
A /V
Date
<==?/// /J?' Date '
6"- // Z-Date
S- II - 72 Date
S - / N / ? Date
Final approval and acceptance of this dissertation is contingent upon the candidate's submission of the final copy of the dissertation to the Graduate College.
I hereby certify that I have read this dissertation prepared under my direction and recommend that it be accepted as fulfilling the dissertation requirement.
issertation Director Date r
STATEMENT BY AUTHOR
This dissertation has been submitted in partial fulfillment of requirements for an advanced degree at The University of Arizona and is deposited in the University Library to be made available to borrowers under rules of the Library.
Brief quotations from this dissertation are allowable without special permission, provided that accurate acknowledgment of source is made. Requests for permission for extended quotation from or reproduction of this manuscript in whole or in part may be granted by the copyright holder.
SIGNED: k
ACKNOWLEDGMENTS
When I first embarked upon the journey of my doctoral studies,
the task seemed insurmountable. As I recall the many stepping stones
leading to fruition with this dissertation, I know I will celebrate
this major completion in my life for weeks, months and years to come.
I can only hope that my family members, friends and colleagues trust
how I appreciate their support and assistance, and realize that these
words cannot express the degree of my gratitude.
I am indebted, among others, to the following people:
~ My major doctoral committee, whose personal and professional
assistance was critical throughout my graduate studies. Dr. Oscar
Christensen reminded me that it was OK to narrow the focus to the
achievable. Dr. Koger Daldrup continually endorsed my holding onto
"Rick" as I blossomed in my professional life. Special thanks goes to
Dr. Gordon Harshman, chairman of my committee throughout my four years
of work in Tucson. My chief advisor, friend and counselor (for those
times I needed to be told to relax and trust more in my competence),
he provided indepth feedback and guidance for this project, opening
himself up to me far beyond the call of duty.
— Dr. Neal Herrick, my committee member and mentor, who provided
the initial spark for this study through his involving me in the early
stages of the Pima County Quality of Working Life experiment. A
pioneer in workplace reform, Neal offered countless hours of stimulating
iii

substantive discussion, ongoing enthusiasm and encouragement. His end
less dedication and commitment to the value of humanizing the lives of
those around him have been an inspiration during our association; I will
carry his influence with me throughout my career.
— Clyde Feldman, my close friend and guide in what was relatively
unknown terrain. Clyde's crucial expertise as my computer programmer
and statistics consultant was transcended only by his response to my
needs at a moment's notice (often at the expense of his own), his con
stant reassurance that there was "no problem," and his willingness to
become ray partner in pondering the quantitative questions, sharing in
the excitement of discovery.
— Dr. Robert Wrenn, for being the most understanding and giving
employer and friend anyone could hope for.
— Charles Huckleberry, Martin Lujan and the employees of the
Department of Transportation of Pima County for their openness to this
research endeavor.
— The panel of judges and additional measurement consultants for
donating their time, effort and expertise: Tom Hoffman, Tom Patterson,
Jim Whiteside, Marj Holiman, Rick Zucker, Mark Meyers, Martin Lujan,
Neal Herrick, Gordon Harshman, Clyde Feldman, John Luiten and
Dr. Daryll Sabers.
— Hazel Gillie, for her diligence and technical input during her
superb typing of the final manuscript.
— My friends, who have understood and accepted by absence (and
at times struggled with my presence) in times of "dissertation fever."
Special appreciation goes to Marj Holiman, friend and colleague, who
V
has shared in my journey and growth for four years, and to Julie Newhouse
for giving me space when I needed it and helping to keep the coast
clear. It's rewarding to know my friends share in my joy.
— My beloved family, who have always rooted for me, regardless of
the miles between us. They are a source of confidence that I am a
"winner." I thank my father, mother, brothers and sister for the world
they helped to create for me, and their invitations for me to be happy
and successful in it.
Finally, I wish to express particular gratitude to Karen New-
house, my partner and best friend, whose caring, trust and patience
have truly been "for better or worse." She has given steady love
despite my mood, timely nudges to acknowledge my realistic limitations,
permission for me to be gentler with myself, cherished escape and
release, hope and faith in a light at the end of the tunnel, innumerable
hours of typing with eyes at half-mast, and her rare breed of quiet <r
strength when I felt I had none left of my own. This dissertation
would not have been completed without Karen's love, support and
presence.
TABLE OF CONTENTS
Page
LIST OF TABLES ix
ABSTRACT xi
1. RATIONALE FOR THE STUDY 1
Context of the Study .. ....... 1 The Turbulent Environment 2 Economic Stagnation 2 Crisis of Worker Attitudes ..... ... 3 Changing Role of Unions ... 6 The Challenge to Organizations ........... 8
The Quality of Working Life Movement . 10 QWL as a Unique Experiment 10
QWL Differentiated from Related Trends ......... 13 A Comprehensive QWL Model ............. 1 Organizational, Development and QWL ......... 16 Quality Circles, and QWL .............. l8 Participatory Management and QWL .......... 19 Sociotechnical Systems, Job Redesign and QWL .... 20 Alternative Economic Structures and QWL ...... 22 Labor-Management Committees and QWL 23 Summary 23
Historical Background of the Study 2k National Perspective 24 Pima County Perspective 25.
Statement of the Problem 26 Purpose of the Study 26 Objectives of the Study 27
General Significance of the Study 27 The Importance of QWL Research ........... 27 The Gap in Current QWL Assessment Research ..... 29 The Need for Attitude Measurement in QWL Research . 31 Existing QWL Attitude Assessment .. 33 Significance of the Study for Pima County ..... 35
2. REVIEW OF THE LITERATURE 36
Attitude Theory ...... 37 Nature of Attitudes ................ 39 Attitude Formation and Change 39 Social Attitudes and Social Psychology Research . . *+0
vi

vii
TABLE OF CONTENTS—ContinueJ
?age
Attitude Measurement 4l Psychological Measurement and Testing . 42 Educational Measurement and Evaluation . 43 Attitude Assessment ...... 44
Survey of Literature for CWL-Related Attitude Scales . . 51 Summary 55
3. PROCEDURES 56
P r e p a r a t i o n . . . . . . . . . . . . . . . . . . . . . . 5 6 Preliminary Literature Review . 56 Population 56 Organization Entry . 57 Sampling 57
Scale Construction 59 Generation of Initial Attitude Statements 60 Conceptual Classification of Statements » 6l Format Selection .................. 68 Item Writing and Editing . 74 Content Validity Sorting by Judges ......... 75 Questionnaire Design 76
Scale Administration 79 Evaluation 79 S u m m a r y . . . . . . . . . . . . . . . . . . . . . . . . 8 0
4. RESULTS AND DISCUSSION 8l
General Results ............ 8l Sample .............. 8l Scale Characteristics ...... 82
The Factor Structure of the QWLAS 89 Initial Investigation of Original Subscales .... 92 Confirmatory Factor Analysis 101 Exploratory Factor Analysis ............ 110
Item Analysis and Development of the QWLAS Short Form . 114 General Item Analysis • 114 Selection of the QWLAS Short Form 117
Reliability of the QWLAS 121 Validity of the QWLAS 124
Face Validity 125 Content Validity 125 Criterion Validity .... 126 Construct Validity .......... 128
Summary ......... 135
viii
TABLE OF CONTENTS—Continued
Page
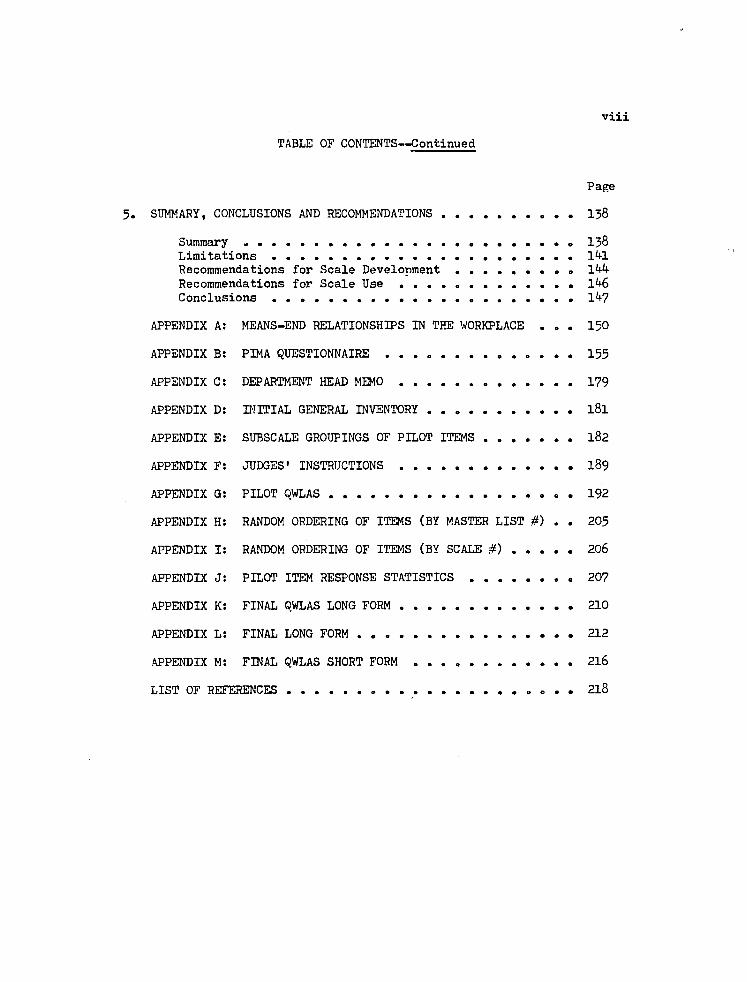
5. SUMMARY, CONCLUSIONS AND RECOMMENDATIONS 138
Summary ........ 138 Limitations 1 1 Recommendations for Scale Development lMt-Recommendations for Scale Use 146 Conclusions IV7
APPENDIX A: MEANS-END RELATIONSHIPS IN THE WORKPLACE ... 150
APPENDIX B: PIMA QUESTIONNAIRE 155
APPENDIX C: DEPARTMENT HEAD MEMO 179
APPENDIX D: INITIAL GENERAL INVENTORY l8l
APPENDIX E: SUBSCALE GROUPINGS OF PILOT ITEMS 182
APPENDIX F: JUDGES' INSTRUCTIONS 189
APPENDIX G: PILOT QWLAS 192
APPENDIX H: RANDOM ORDERING OF ITEMS (BY MASTER LIST #) . . 205
APPENDIX I: RANDOM ORDERING OF ITEMS (BY SCALE #) 206
APPENDIX J: PILOT ITEM RESPONSE STATISTICS 207
APPENDIX K: FINAL QWLAS LONG FORM 210
APPENDIX L: FINAL LONG FORM 212
APPENDIX M: FINAL QWLAS SHORT FORM 216
LIST OF REFERENCES 218
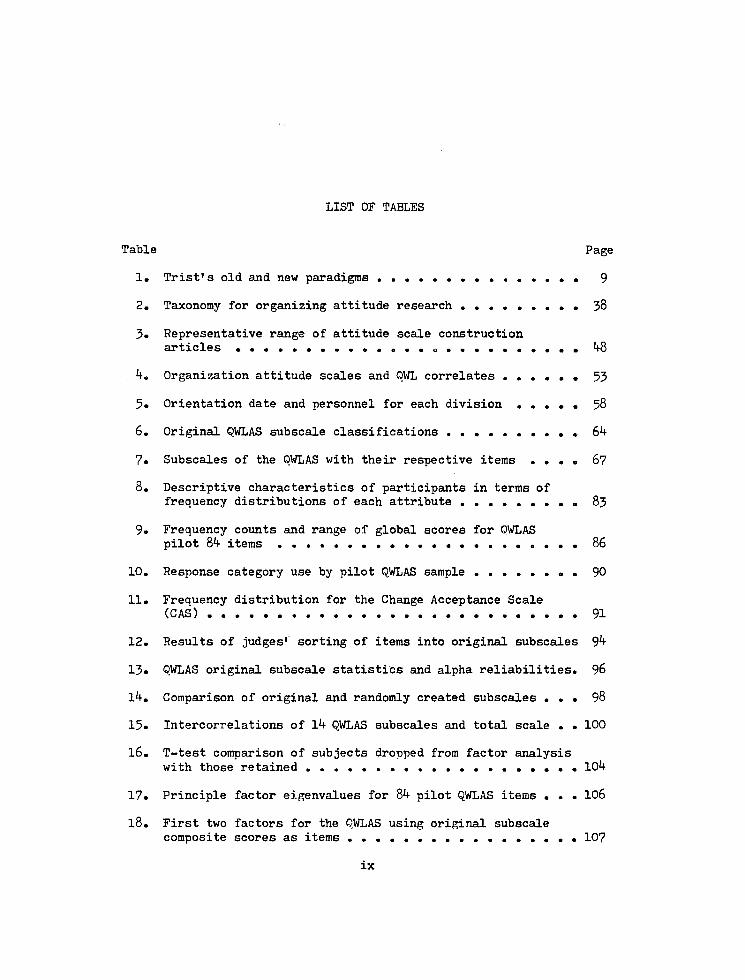
LIST OF TABLES
Table Page
1. Trist's old and new paradigms 9
2. Taxonomy for organizing attitude research 38
3. Representative rangs of attitude scale construction a r t i c l e s . . . . . . . . . . . . . . . . . . . . 4 8
k. Organization attitude scales and OWL correlates . 53
5. Orientation date and personnel for each division ..... 58
6. Original QWLAS subscale classifications . „ 64
7. Subscales of the QWLAS with their respective items .... 67
8. Descriptive characteristics of participants in terms of frequency distributions of each attribute .... 83
9. Frequency counts and range of global scores for QWLAS pilot 84 items .............. 86
10. Response category use by pilot QWLAS sample . 90
11. Frequency distribution for the Change Acceptance Scale (CAS) 91
12. Results of judges' sorting of items into original subscales 9k
13» QWLAS original subscale statistics and alpha reliabilities. 96
14. Comparison of original and randomly created subscales ... 98
15. Intercorrelations of 14 QWLAS subscales and total scale . . 100
16. T-test comparison of subjects dropped from factor analysis with those retained .................... 104
17. Principle factor eigenvalues for 84 pilot QWLAS items ... 106
18. First two factors for the OWLAS using original subscale composite scores as items ..... 10?
ix
X
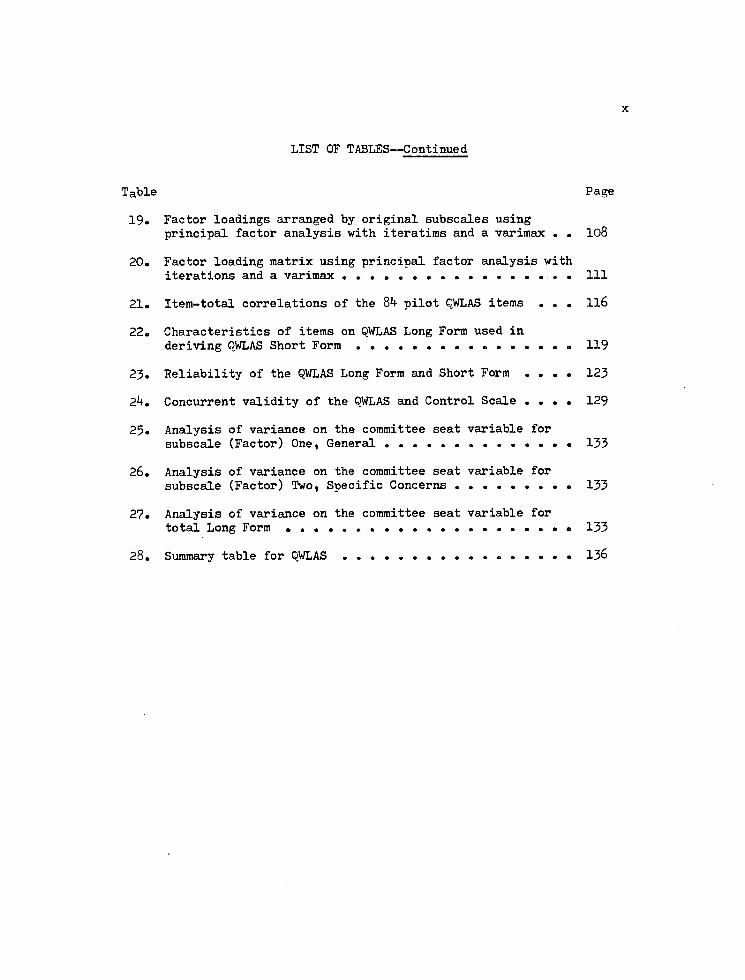
LIST OF TABLES—Continued
Table Page
19. Factor loadings arranged by original subscales using principal factor analysis with iteratiras and a varimax . . 108
20. Factor loading matrix using principal factor analysis with iterations and a varimax ................. Ill
21. Item-total correlations of the 8b pilot QWLAS items ... 116
22. Characteristics of items on QWLAS Long Form used in deriving QWLAS Short Form 119
23. Reliability of the QWLAS Long Form and Short Form .... 123
2 . Concurrent validity of the QWLAS and Control Scale .... 129
25. Analysis of variance on the committee seat variable for subscale (Factor) One, General 133
26. Analysis of variance on the committee seat variable for subscale (Factor) Two, Specific Concerns 133
27. Analysis of variance on the committee seat variable for total Long Form ....................o 133
28. Summary table for QWLAS 136
ABSTRACT
The purpose of this study was to construct and field-test a
standardized instrument for assessing the attitudes of employees toward
a Quality of Working Life (QWL) program. The QWL movement is one re
sponse to the increasing demand for organizational change efforts, an
intervention which elects worker representatives to jointly-established
union-management committee structures, thereby democratizing the work
place.
The instrument finalized was the Quality of Working Life Atti
tude Scale (QWLAS), a 29-item Likert-format inventory developed through
the administration of an 8 -item Pilot Form within the Department of
Transportation of Pima County, Arizona.
The following research questions were addressed: (1) What
basic factors comprise the concept of QWL attitude as measured by the
QWLAS?; (2) What items can comprise the final QWLAS Long Form and Short
Form without significantly lowering scale reliability?; (3) Is the
QWLAS a reliable psychological instrument?; and (k) Is the QWLAS a valid
psychological instrument?
A total of 179 respondents returned the completed Pilot Form,
and data analysis was performed utilizing the Statistical Package for
the Social Sciences. Confirmatory factor analysis employing a princi
pal factors analysis with a varimax rotation, as well as coefficient
alpha tests of internal consistency and subscale intercorrelations,
xi
xii
revealed that the rationally-derived initial subscales did not possess
sufficient factoral validity, homogeneity, or statistical independence
to warrant their being kept intact in the final QWLAS forms.
Exploratory factor analysis surfaced two interpretable factors,
the first being labeled General and consisting of 17 positively-worded
items concerning more global feelings and ideas about the theory of the
program. The second factor, Specific Concerns, consisted of 12
negatively-worded items about more practical realities of QWL. A 29-
item QWLAS Long Form and 1 -ite.m QWLAS Short Form were finalized around
these two components.
Cronbach's alpha estimate of reliability yielded high coeffi
cients of .96, .95 and .93 for the Pilot Form, Long Form, and Short
Form, respectively. All forms were reviewed favorably against face,
content, concurrent and construct validity. The QWLAS results suggest
it reliably and validly discriminates favorable versus unfavorable QWL
attitudes.
Recommendations include further factor validation and use of
the QWLAS to research attitudes toward QWL.
CHAPTER 1
RATIONALE FOR THE STUDY
Alvin Toffler's Future Shock (1970) warns of the rapidly-
accelerating pace of change characterizing our world, reflected in
futurists' admonition that "the evolutionary future of human beings is
bound up with the ability of their social organizations to cope with
an ever-changing environment" (Grabow and Heskin, 1976, p. 17)• Many
enterprises adopt approaches for meeting this challenge of becoming
organizations of the future (Fuller, 1980). The "Quality of Working
Life" (QWL) is a remedy gaining momentum in this country since the
expression was coined in 1972 (Keidel, 1980).
The general purpose of this study was to develop an instrument
for assessing employees' attitudes toward this promising organizational
change program. This chapter will describe QWL's context, relate it to
similar efforts to resolve workplace problems, and establish the need
for more adequate QWL attitude measurement. This review will provide
an understanding of the attitude referrent being studied and establish
QWL as a movement that warrants more sophisticated instrumentation to
accompany the research likely to be engendered in years to come.
Context of the Study
The key forces comprising the context of the QWL movement are
divided into four main sections: the turbulent environment faced by
1
2
organizations, economic stagnation, the crisis in worker attitudes, and
the changing role of unions.
The Turbulent Environment
Eric Trist (1978), past president of London's Tavistock Insti
tute, confronts today's organizations with the urgency of learning to
cope with a quality in the environment he calls "turbulence." Turbu
lence is responsible for many organizations* loss of any stable state,
manifest in growing interdependence, complexity, and uncertainty (Trist,
1977)• The turbulent environment is attributed to the breakneck speed
of change, described by Beckhard (1969) as dynamic explosions in know
ledge, technology, communications and economics.
Susman (1979) traces patterns of change in education, work
ethics, the nature of work, consumption and motivation, attitudes
towards authority, income and worker expectations. Rogers notes "dizzy
ing changes in science, technology, communications and social relation
ships" (Rogers, 1969, p. 303).
Robert Oppenheimer (1955) poignantly captures the present
condition:
. . . t h e c h a n g i n g s c a l e a n d s c o p e o f c h a n g e i t s e l f , s o t h a t t h e world alters as we walk in it, so that the years of men's life measure not some small growth or rearrangement or moderation of what he learned in childhood, but a great upheaval. What is new is that in one generation our knowledge of the natural world engulfs, upsets, and complements all knowledge of the natural world before (Oppenheimer, 1955, P« 1)•
Economic Stagnation
A second force changing the U.S. workplace is the economic
crisis we face, evidenced by high unemployment, inflation, trailing

3
wage gains compared to those abroad, public outcry about taxes, declin
ing basic industries such as steel and auto, and the productivity crunch
(Business Week, May 11, 1981). U.S. management is concerned with
domestic inflation and foreign competition (Keidel, 1980), and labor
unions are haunted by the threat of foreign competition that places a
plant's survival at stake (Kuper, 1977)- Zemke (1980) ironically re
calls when "Made in Japan" meant poor quality, and he refers to U.S.
industry as less able to set standards of quality, services, relia
bility, competitive pricing and sales.
The magnitude of the productivity problem was highlighted by
the first balance of payments deficit in 1972 (Herrick, 1980a), creating
a vital interest in anything that would allow us to compete in a
society of scarcity. The 1978 Economic Report to the President decried
the slowdown in productivity1s growth as "one of the most significant
economic problems in recent years" (Glaser, 1980, p. 71).
Crisis of Worker Attitudes
One scholar and practitioner in the field of organizational
change writes, "During the 1970's a great deal of attention was given
to 'worker dissatisfaction', the 'white collar woes' and the 'blue-
collar blues' ... which seem to be continuing trends into the 1980's"
(Herrick, 198lb, p. 26). This declining job satisfaction and morale
among the nation's employees is metaphorically expressed in the title
and concepts of Where Have All the Robots Gone? (Sheppard and Herrick,
1972). Such alienation, malaise, frustration and discontent comprise a
major cause for the QWL movement (Landen, 1981).
k
The decline of worker attitudes became more visible in the early
seventies because of several major events (Ronchi, 1980). A highly
automated and efficient General Motors assembly plant was scarred by a
strike of such bitterness and sabotage that it became known as "The
Lordstown Fiasco" (Miles, 1980). Elliot Richardson, Secretary of HEW,
commissioned a task force to study workplace attitudes, culminating in
the controversial report, Work in America (U.S. Department of Health,
Education, and Welfare, 1973)* Senator Edward Kennedy held Senate
hearings on worker alienation in 1972 (Hampton, Sumner and Webber, 1978),
and Terkel (1972) shocked the public with his recorded interviews por
traying the spiritual, psychological and bodily "violence" character
izing the American workplace.
Susman (1979) offers an indepth analysis of the structural and
cultural changes that have increased job dissatisfaction and the refusal
to accept alienation, boredom and lack of dignity as job-related norms.
He cites such factors as the different work ethic of a new generation,
changes in the nature and setting of work, patterns of consumption and
motivation, and responses to managerial authority. Maccoby and Terzi
(1979) explain the crucial historical currents as the migration from a
traditional, rural society to a modernized urban one, and the decline
of patriarchal values.
Several studies, such as those by Katzel and Yankelovich (1975)
and Cooper, et al. (1979)1 compare Depression generation attitudes with
those of the "baby boom" generation that comprises over forty percent
of the current labor pool (Business Week, May 11, 1981). These younger
members of the work force, born between 19 6 and the early 1960's,
5
entered the workplace during great prosperity and social upheaval, cul
minating in a new profile of job expectations. Spearheaded by the
University of Michigan's Institute for Social Research, several classic
national surveys tap attitudes along dimensions such as intrinsic
properties of jobs, emotional attitudes like authoritarianism, and life
issues such as mental health, excessive consumption of alcohol, and
family life (Quinn, et al., 1971; Quinn, et al., 1977).
Maccoby and Terzi (1979) review the findings of the Michigan
Survey of Working Conditions and Quality of Employment Survey of 1969,
1973« and 1977» reporting trends summarized below.
1. Work does remain important, but other areas of life are gaining
in significance, such as work/leisure enjoyment and personal growth.
2. Work is endorsed, but there is growing criticism of the quality
of work and actual fairness of reward, leading to withdrawal.
3. Workers are distrustful and therefore reluctant to share ideas.
k. There is a growing crisis of leadership, legitimacy and
authority, and less fright or automatic submission.
5. Workers believe hard work does not pay off.
6. Radical changes exist in job factors important to workers (such
as interesting work, opportunity to develop special skills, information
and authority, helpful co-workers and competent supervisors). Pay and
security placed lower in priority than ever before. Elsewhere, Yankelo-
vich (Business Week, May 11, 1981) contends that one new value group
rejects money as a substitute for self-fulfillment and that another
seeks money first, but only as the means to a certain lifestyle.
6
7. An increasingly educated and ambitious work force is dissatis
fied with the lack of opportunity to utilize knowledge and capacities.
8. A "new narcissism" exists among workers valuing self-fulfillment
and self-development.
Changing Role of Unions
The Quality of Working Life movement's impetus is partially
attributable to the decline and changing role of unions. This changing
profile of organized labor is an outgrowth of the growing futility of
an outmoded but increasingly adversarial posture between labor and
management and rising pressures on union leaders to secure more for
their rank-and-file members than traditional wages, benefits, and job
security.
The rise of industrial unionism in the 1930*s ended unfair
treatment at the workplace and gave workers a voice in security, equity,
wages and working conditions through collective bargaining, thereby
reducing corporate power over labor (Business Week, May 11, 1981).
Collective bargaining, the oldest and still most predominant model for
worker influence, is stunted by various shortcomings (Glueck, 1978). '
In particular, labor-management relations through collective bargaining
have become polarized, with negative stereotyping severely impeding
mutual progress and contributing to a decline of unionization in recent
years.
Mannweiler and Talbott (1977) review several investigations
describing labor-management conflict and note their common definitional
thread as a "win-lose" stance between opposing groups, caused by a real
7
or perceived incorapatability of needs, goals, and values. The end re
sult of such sharp adversarial relations is a caustic "we-they" attitude.
More specifically, within one's own group there are increased loyalties,
exaggerated self-righteousness and cohesion, acceptance of autocratic
leadership, and greater demand for a solid front, leading to intoler
ance for divergent views (Schein, 1978). Between groups there are
distorted perception and listening, hostility, aggression, single-
mindedness and negative stereotyping (Hollander and Hunt, 1967).
This adversarial relationship is dysfunctional in our turbulent
times when a new spirit of cooperation and awareness of mutual plight
seems essential. Leonard and Thanopoulos (1981) analyze fifty recently
published works in search of reasons for Japanese management's success,
and include as a key variable the relatively harmonious relations
between Japanese organized labor and management. Meanwhile, there are
mounting pressures for adjusting traditional patterns of interaction
(Kochan and Dyer, 1976) and a threat to legislate greater labor-
management cooperation (Lawler, 1979)• Thus, the influence of U.S.
unions wanes as they primarily maintain an antagonistic, competitive
posture towards management.
Although union strength has lasted as a means for obtaining
better pay, benefits and some working conditions, its viability is
limited as a catalyst for change in humanizing work because this area
of reform requires joint programs outside the formal bargaining process
(Kochan and Dyer, 1976). Traditional roles of unions do not seem to be
instrumental in freeing workers from the "mind-numbing, repetitive,

8
dehumanizing jobs" spurred by the Industrial Revolution (Cooper, 1980,
p. 1+88).
Unfortunately, "Unionism has done little to insert the worker
into his work or give him pride in quality" (Business Week, Kay 11,
1981, p. 89), and yet national surveys indicate employees want more pay,
benefits, and security. The bargaining process, hallmark of unionist
identity, is viewed by many union leaders, academics, and local union
activists as an inappropriate forum for addressing quality of work,
work humanization, job restructuring and productivity issues (Bluestone,
1973; Kochan, Lipsky and Dyer, 1975).
The Challenge to Organizations
This section has identified the technological, social, economic,
and political milieu which creates growing pressure for change within
organizations (Beckhard, 1969; Huse, 1980). The challenge to organiza
tions is to move beyond marginal innovation, to adopt radical new
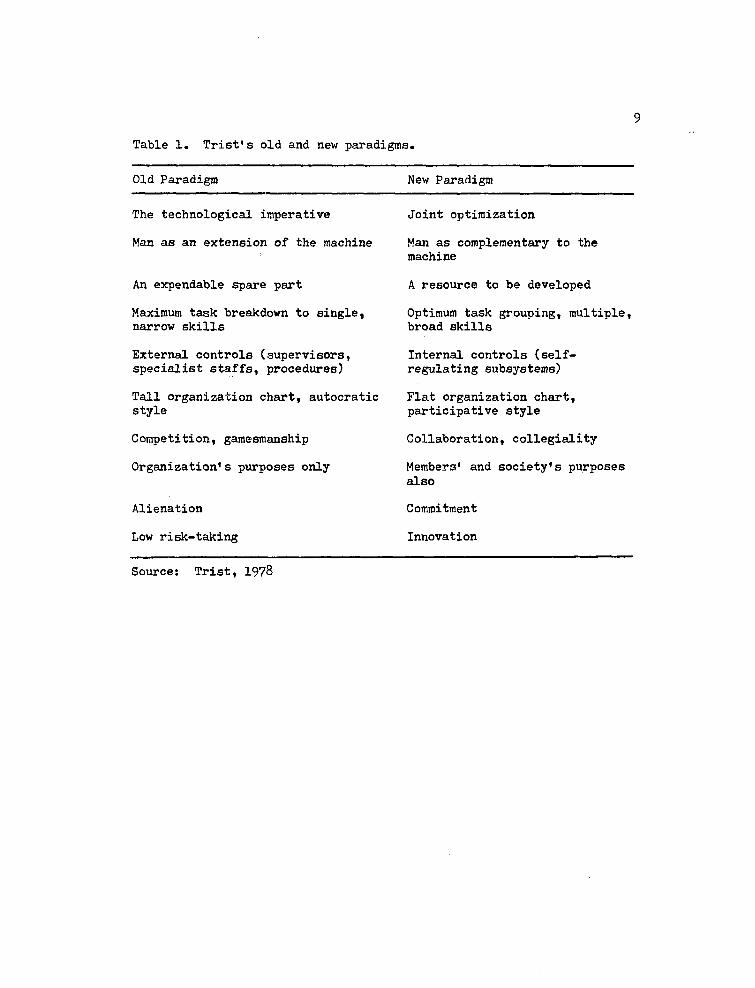
organizational values, forms and structures (Trist, 1977). Trist (1978)
advocates a "new paradigm," a social architecture designed to allow
institutions to evolve from their traditional techno-bureaucratic make
ups toward more socio-ecological models (see Table 1). Tannenbaum and
Davis (1978) and Thorsrud (1978) reinforce Trist's new paradigm in their
depiction of society in transition toward more humanistic, organic
values (Susman, 1979).
Change is inevitable, and hope for control and stability of its
whirlwind pace lies in. fostering two major dimensions: (1) a planning
and leadership process i;hat is interactive and participatory (Finch,
1977; Trist, 1977); and (2) work restructuring for greater individual
9
Table 1. Trist's old and new paradigms.
Old Paradigm New Paradigm
The technological imperative Joint optimization
Man as an extension of the machine Man as complementary to the machine
An expendable spare part A resource to be developed
Maximum task breakdown to single, Optimum task grouping, multiple, narrow skills broad skills
External controls (supervisors, Internal controls (self-specialist staffs, procedures) regulating subsystems)
Tall organization chart, autocratic Flat organization chart, style participative style
Competition, gamesmanship Collaboration, collegiality
Organization* s purposes only Members' and society's purposes also
Alienation Commitment
Low risk-taking Innovation
Source: Trist, 1978
10
and work group autonomy with resulting freedom, potential and capacity
for becoming "continuously adaptive learning mechanisms" (Emery and
Trist, 1973; Herbst, 1962).
The Quality of Working Life Movement
One response to the need for organizational change is the
Quality of Working Life (QWL) movement, which this study defines as the
recent U.S. practice of electing jointly-established labor-management
problem-solving groups. QWL's purpose with these formalized structures
is to elicit employee participation in workplace decisions about
policies, programs and procedures. QWL is an organization-wide, multi
level committee system that weaves collaborative, democratic influence
into the fabric of the organization.
QWL as a Unique Experiment
"Quality of working life" has been used as a catch-all phrase to
describe a variety of organizational structures and managerial
approaches, values and processes for humanizing the workplace. "QWL"
has become an umbrella code for most job change recommendations in the
organizational field (Bohlander, 1979). Huse quotes the broad concept
of "QWL" offered by Lippitt and Rumley (1977) as addressing the degree
to which work
provides an opportunity for an individual to satisfy a wide variety of personal needs, from the need to survive with some security to the need to interact with others, to have a sense of personal usefulness, to be recognized for achievement, and to have an opportunity to improve one's skills and knowledge (Huse, 1980, p. 237).
Going beyond the techniques typically advanced to improve em
ployee fulfillment, effective QWL experiments referred to in this study
11
provide more than piecemeal tampering with work schedules or jobs.
Katzell and Yankelovich conclude that "relatively limited programs, such
as job enrichment, participative decision-making, or incentive pay plans,
seem unlikely by themselves to create larger or enduring improvements in
both productivity and job satisfaction; they are better regarded as
possible ingredients. . . (Wacker and Nadler, 1980, p. 15).
This study, along with Herrick (1981c), isolates "pure" QWL
efforts based upon a group of experiments jointly sponsored by unions
and managements in the early and mid-seventies. A report of an organi
zation which sponsored several of these experiments suggests their
general characteristics as being:
. in unionized organizations;
. endorsed by the highest officers of managements and unions;
. created to establish cooperative labor-management structures to permit participation of employees in the design and implementation of organizational change;
. undertaken in a wide variety of major public and private organizations highly visible in their industry and sector;
. jointly 'owned', operated and run by the labor and management participants, without imposed interference, advocacy, or direction by either the National Quality of Work Center or its consultant representatives;
. continued as 'experiments' for from twelve to eighteen months;
. provided during the 'experimental' phase with expert consultant teams skilled in facilitating organizational change activity (Institute for Social Research, 1979, p. *0.
Huse (1980) notes the mutual involvement of both union and
management as the basic methodological approach establishing the QWL
movement as a significant departure from previous organizational change
endeavors. He summarizes the structural features as (1) a top level
joint union-management planning committee; (2) establishment of per
manent labor-management committees throughout the departments, plants,
or work units; (3) ad hoc cross-organizational problem-solving
12
committees to address specific projects; (4) external consultants with
behavioral science skills; and (5) external researchers separate from
the change agent.
This study adopts the concept of QWL as requiring an elective
system-wide influence structure created through a formal, joint labor-
management coalition (Declaration of Agreement by and Between the Board
of Supervisors and the Employees of Pima County, 1981; Agreement
Between United States Steel Corporation and the United Steel Workers of
America, August 1, 1980). The cooperative endeavor seeks to give indi
viduals greater autonomy in their jobs and groups of employees more
control over their working environment, by electing multi-level QWL
committees on which workers sit in equal representation with super
visors and managers. These structures develop and adhere to various
policies, procedures, and proposal-writing formats in order to achieve
consensus-based solutions to mutual, work-related concerns (Herrick,
1980b).
The two major thrusts of worker participation engendered by the
QWL systems are analogous to Abrahamsson's (1977) concepts of political
participation and socio-technical participation. The former involves
having a "say" in the actual management of the enterprise through on
going decisions about organization policies, programs, and procedures,
while the latter pertains to the kind of job restructuring for greater
autonomy, variety and productivity discussed by job design writers
(Susman, 1979; Trist and Bamforth, 1951)•
Accordingly, the Economic Development Administration (n.d., p.
7) writes:
13
While what work improvement goals are selected is important, how they are chosen is what really counts. The lasting force of any useful quality of work life effort is the creation of a process - a learning process - through which the various stakeholders in an organization (managers, supervisors, stewards, individual employees, union officials) learn how to work together ... that process is the essential gift ... that permits organizations to tap and utilize the skills and insights of the total work force.
QWL Differentiated from Related Trends
Various writers (Keidel, 1980; Srivastva, et al., 1975; Cummings
and Molloy, 1977) have sought to reduce the confusion about what QWL
actually is by ordering the common aspects of QWL approaches. These
catalogs are ambiguous since they simply group techniques employed as
part of various programs loosely called "QWL." Similarly, several sets
of human development principles have been forwarded as underlying QWL
approaches to workplace reform (Keidel, 1980; Herrick and Maccoby, 1975).
Huse (1980) synthesizes these basic categories as (1) adequate and fair
compensation; (2) safe and healthy environment; (3) development of
human capacities; CO growth and security; (5) social integration; (6)
constitutionalism; (7) the total lifespace; and (8) social relevance.
This section more clearly defines QWL as a unique organiza
tional change effort toward which attitudes can be assessed. Herrick's
(198la) comprehensive schemata will be presented below, consisting of
policies, working conditions, and outcomes compatible with the defini
tion of QWL adopted in this study. Secondly, QWL will be compared with
several trends in the organizational change field.
A Comprehensive QWL Model
Herrick's "The Means and End of Work" (198la) presents a uniform
theoretical schemata (see Appendix A for definitions), conceptualizing
QWL as a mutual benefit bargaining process engaged in by unions and
managements alongside adversary collective bargaining. Herrick pro
poses that the recent QWL movement in the U.S. is slowly fostering
recognition that collective bargaining alone is insufficient for achiev
ing human, organizational and political effectiveness, as well as the
less tangible end ~ human well-being.
This gap in today's workplace arises because negotiation and
contract enforcement only improve the working conditions of security
and equity. They neglect opportunities for increased worker individua
tion (autonomy) and participation necessary for a fuller work life,
according to well-accepted principles of human development (Herrick and
Maccoby, 1975). Herrick advocates decentralization, education and
cooperative self-interest as requisite policies to enable the opera
tional policy of democratization to be implemented.
"Democratization is the establishment, through the election of
workers and the appointment of supervisors, of worker-supervisor
standing committees for each organizational unit and/or problem-solving
teams cutting across organizational units" (Herrick, 198la, p. 620).
This formalized influence structure allows for the realization of worker
participation and individuation ignored by collective bargaining
(Kochan and Dyer, 1976). Herrick (1982a) elsewhere interrelates QWL's
requisite and operational policies as they are manifest in Arizona's
Pima County mutual benefit bargaining project.
15
The viability of QWL's mutual benefit bargaining as an alterna
tive model for American labor-management relations was foreshadowed by
Walton and McKersie's A Behavioral Theory of Labor Negotiations (1965).
They first discriminated distributive bargaining as oppositional compe
tition aimed at causing the other party to lose, and integrative
bargaining as a "win-win" process, concentrating upon the problem-
solving of common concerns.
Jain notes the U.S. Federal Mediation and Conciliation Service's
consideration of collaborative bargaining as "preventative mediation,"
a parallel to German Work Councils involving worker representatives and
company executives in the negotiation of shop-floor issues such as work
rules, production schedules, personnel matters, and even mergers and
plant closings. "If cooperative issues cannot be dealt with meaning
fully on a permanent basis within the framework of the existing collec
tive bargaining system, wouldn't it be advisable to supplement the
system with other institutional arrangements?" (Jain, 1980, p. 50).
Implicit in the concept of mutual interest bargaining is its
dual purpose — to achieve with equal emphasis the improvement of the
quality of working conditions for everyone and the improvement of the
quality and quantity of productivity. Ronchi (1980) calls this dual
focus of two inseparable goals the "conceptual masthead of the quality
of working life movement and, in an important sense, unique to it"
(Ronchi, 1980, p. *0. He notes that other approaches within the human-
relations movement assume a causal link between satisfaction and pro
ductivity, viewing a happy worker as a productive one. QWL, however,
relaxes this link, symbolically merging the interests of labor and
management, doing away with class distinctions, at least where the
issues are not best addressed in collective bargaining.
Organizational Development and QWL
Organizational Development (OD) is "an effort (1) planned, (2)
organization-wide, and (3) managed from the top to (4) increase organi
zation effectiveness and health through (5) planned interventions in
the organization's 'processes', using behavioral science knowledge"
(BeCkhard, 1969, p. 9). It is a long-range change in task and human
fulfillment specifically concerned with problem-solving, decision
making and renewal processes (Dickson, 1981), placing "emphasis upon
the culture of formal work teams with the assistance of a change agent
or catalyst. . . (French and Bell, 1973, P» 15).
Most OD involves management's contracting of external experts
in individual and group behavior. These practitioners utilize a common
assortment of OD methods aimed at philosophical ideals such as conflict
reduction, openness, and honesty (Rice, 1977). While supposedly long-
range, OD activity can often end up lacking follow-up and consisting
solely of an isolated strategy such as team building, survey-feedback,
process consultation, or a training experience.
Herrick (1981c) has outlined three main factors of QWL that
mark it as a significant departure from OD: (1) union involvement; (2)
structure; and (3) elections. Joint ownership of QWL by union and
management from the outset is critical for a mutual benefit effort.
Stability and likelihood of program permanence are enhanced through a
formal agreement between management and relevant unions. Kochan and
17
Dyer (1976) criticize OD's neglect of the role of unions, illustrating
the distinction between QWL's joint efforts and OD's management-
initiated strategies.
The structural nature of QWL, with its democratization through
committee systems, policies, and procedures, allows openness to change.
Trist (1977) explains OD's failure to address such structural and
political power by recalling the discipline's origins in the late
fifties within science-based industries. Since these corporations
demanded flexibility and innovation to cope with an increasingly tur
bulent environment, a premium was placed on individuals' reaching their
potential, teamwork, open interpersonal relations and organizational
climate change. Bennis (1968, p. 228) critiques OD's non-structural
nature: "I have yet to see an organization development program that
uses an interventional strategy other than an interpersonal one, and
this is serious when one considers that the most pivotal strategies of
change in our society are political, legal and technological."
The election of worker representatives to QWL's committee struc
ture democratizes the workplace, unlike organization development which
either restricts involvement to managers and supervisors or only
includes workers selected by management. Thus, OD'S "untouched work
force" (Trist, 1977) characterizes it as much less democratic and
system-wide than OWL, which is ironic because OD's practitioners seek
power equalization and opening up of all levels of organization norms
(Lukes, 197 ; Argyris, 1977).
Quality Circles and QWL
Originally called Quality Control Circles, Quality Circles
(QC's) were developed in Japan as structures through which volunteer
groups of labor and supervisors learned simple, statistical quality
control principles, problem identification and analysis procedures and
methods of presenting solutions to management (Patchin, 1981; Zemke,
1980). Dr. Kaoru Ishikawa of the University of Tokyo launched the
management plan in 1961 within manufacturing settings (Rendall, 1981),
at the inspiration of W. Edward Deming and J. M. Juran, two U.S.
quality control engineers (Dewar, 1980).
Since the early sixties, when only 200 employees were involved
in twenty registered QC's in Japan (Zemke, 1980), the International
Association of Quality Circles and its publication, the Quality Circles
Journal (IAQC, 1981), have been developed to further communication and
education in this field. Currently over ten million Japanese workers
are estimated to be involved (Batt, 1981), and since it was brought to
America by Lockheed, the concept has spread throughout the Western
world to hundreds of companies.
QWL and QC's promote similar productivity and satisfaction
results, and both tap the wellspring of worker knowledge through on
going labor-management meetings. However, most QC programs are initi
ated by management without active union participation (Batt, 1981), and
the typical QC is composed of volunteers who meet weekly with their
supervisor rather than being a formalized, democratically elective
system (Rendall, 1981). Finally, the original QC foci on productivity
increase, product quality, and cost containment have comprised the
primary thrust of American management, whereas OWL adopts the dual goals
of working condition improvement and productivity increase with equal
emphasis (Lujan and Brandon, 1981; Ronchi, 1980).
Participatory Management and QWL
Because OWL is a participation-based program, it is often con
fused with the more general term, "participatory management." Several
writers (Walker, 1980; Jain, 1980; Greenberg, 1975) have clarified the
differences in terms of theoretical and philosophical underpinnings,
structure and practical problems that characterize various types of
worker participation. Beyond OWL and similar shop-floor representation,
worker influence in decisions that affect jobs and work settings can
also be achieved through Board-level representation, and participative
managing styles of individual supervisors and managers.
Discussing participatory management, McDaniel and Ashmos (1980)
reveal its purposes of managing environmental complexity and expanding
levels of participation in decision-making to those who are closer to
the execution of the task. They also caution against risks such as too
little expertise on the part of participants, increased difficulty of
coordinating tasks, resultant difficulty in performance review, and the
tendency to depend excessively on quality personnel. Wadia (1980)
describes three common pitfalls plaguing participatory management as
(l) viewing it as an exclusive tool; (2) confusing it with democratizing
the workplace; and (3) manipulating it for managerial benefits. Despite
similarity to QWL in its objectives and spirit of decentralization,
participatory management lacks an elected, ongoing structure. There
fore, it is purely dependent upon the style preference of the individual
20
executive or supervisor who considers consulting subordinates for
input.
A more radical approach is the opening of Boards of Directors
seats to labor representatives, as Chrysler did in nominating Donald
Fraser, president of United Automobile Workers (Landen, 1981). This
move toward worker participation in managerial decision-making is a
"tremendous step forward in industrial relations" (Jain, 1980, p. V?).
However, Shaw (1980) traces the many obstacles to his success as a
trade union appointee to the Main Board of the Post Office Corporation
in 1978, such as the negative managerial philosophy toward participa
tion reflected in their refusal to involve him in issues basic to Post
Office success, whittling his influence to merely commenting upon
management-designed policies.
QWL experiments transcend the tokenism that beset Shaw's
travesty of a participation experience and they avoid participatory
management's dependence on chance, whim and piecemeal occurrences.
QWL's strengths stem from union involvement, structurally-grounded
democratization through committee systems, and e-lectiou-based, system-
wide representation.
Sociotechnical Systems, Job Redesign and QWL
Sociotechnical Systems (STS) analysis views individual and
organizational effectiveness as functions of "joint optimization" of
two interdependent subsystems of complex organizations, the technical
and social (Miles, 1980). Scientific management's mechanized concept
of work put disproportionate emphasis upon the technical dimension of
work through job breakdown and designing for efficiency, while the human
relations school overcompensated with its almost unilateral concern with
the social world of employees. STS analysis redesigns work and the
overall organization system to discover the "best match" between these
two fundamental, ideally complementary dimensions (Trist, 1977)•
Although job redesign is often discussed in the same breath as
STS, the former involves job rotation, enlargement and enrichment and
STS projects tend to be focused on redesigning work into semi-autonomous
work teams (Huse, 1980). Both approaches criticize traditional jobs,
high specialization, repetitive tasks, short cycle times, low variety,
low discretion, and mechanical pacing (Susman, 1979). Traditional job
design has a machine-concept of work with a structure revolving around
equipment, authoritarian, distrustful supervision and decreasing de
pendence on the worker (Peter, 1975). Job redesign operates upon the
principle of "reverse Taylorism" (Walker, 1980), re-uniting planning
and implementation to allow for worker self-enhancement, experience of
competence, and contribution to a valued product or service (Susman,
1979).
Both STS and job redesign are forms of work reorganization
(Wiseman, 1975) that are ideally included in QWL through Abrahamsson's
(1977) concept of sociotechnical participation, but these changes
typically occur without formalized work force input in the redesign
effort (Trist, 1977). Therefore, the terms are not interchangeable
with QWL. STS and job redesign share QWL's simultaneous concern with
the structure and process of work, the interface of technology and
people, and the disciplines enjoy a mutual group of research
22
contributors through the Tavistock Group (Trist and Bamforth, 1951;
Miller and Rice, 196?; Herbst, 197*+; Emery and Trist, 1973)* However,
STS and job redesign do not constitute QWL efforts in themselves,
because they do not necessitate an elective committee structure or
union involvement.
Alternative Economic Structures and QWL
While not intrinsic components of the system, many QWL projects
incorporate various types of alternative pay structures. The increased
productivity from QWL sometimes necessitates some sort of productivity
gains-sharing or profit-sharing scheme such as the Scanlon, Rucker
Share-of-Production, Lincoln or Common Interest Plans (Crawford, 1975;
Front, Wakely and Ruh, 197 5 Herrick, 1982a). To dispel suspicion that
QWL is a management tool to manipulate labor for greater productivity,
such plans distribute productivity or profit amongst employees.
Other times QWL's emphasis on work restructuring into semi-
autonomous teams or its policy of cooperative self-interest (see Appen
dix A) requires compatible pay scheme alterations. The changes advo
cated include moving from individual performance incentives to rewards
for group productivity and individual learning (Walton, 1978). As such,
there are added levels of pay for each new level of skill mastered, even
if the company does not actively utilize those skills and knowledge
(Peter, 1975).
Thus, many QWL experiments leave compensation and wages to the
already existing collective bargaining structures, but others build
into the program newer, alternative reward structures reinforcing the
goals and philosophy of the programs. Of course, alternative reward
systems can exist independently of QWL structures and are not mandatory
components of the program.
Labor-Management Committees and QWL
Many QWL experiments begin with, and retain a top-level Labor-
Management Committee (LMC) to plan and oversee the subsequent spread of
its multi-level, elected influence system. The 1970's saw a variety
of government-sponsored and other network-initiated programs to advance
the development of cooperative LMC endeavors, but most existed without
an accompanying influence structure (Clark, 1980; Maye, 1980; Susman,
1980; Mannweiler and Talbott, 1977).
LMC's are jointly formed by two distinct parties, the union and
the employer, typically within a collective bargaining environment, but
here the overlap with QWL as defined in this study ends, because most
have voluntary or appointed membership. Moreover, the vast majority
function only as executive level advisory committees, working on iso
lated problems as opposed to QWL's having an elected influence struc
ture that extends to the grass-roots level and formalizes an ongoing
proposal-writing process.
Summary
This section's detailing of QWL's nature and the characteristics
that distinguish it from other organizational change programs remedies
a major shortcoming of many change effort evaluations. Particularly,
research instrumentation requires a precise description of the
2k
components and uniqueness of the program being studied (Lawler, Nadler,
and Mirvis, 1978).
Historical Background of the Study
National Perspective
The United States followed the lead of West Germany, France,
the United Kingdom, India, Japan, and the Scandinavian countries with
its interest in joint labor-management problem-solving committees
(Cooper, 1980). Cherns (1975) broadly addresses democratization pro
jects, including LMC's, and ranks this country behind Sweden, Norway,
Holland, Denmark, Britain, France, Italy, Germany, Belgium, and Ireland.
Granting that the European stress on co-determination and Board room
representation does not necessarily lead to the shop-floor representa
tion to which QWL aspires (Kuper, 1977), the U.S. is, nevertheless,
relatively adolescent in its workplace reform.
A recent Business Week (Sept. 21, 1981) underscores QWL's spread
by citing the attendance at 1981's Toronto International Conference on
QWL of 1500 managers, unionists, consultants, academics, and government
officials, dwarfing its 1972 counterpart. The current case study count is
above 1000, up from 25 in the early seventies.
The 1978 Directory of Labor-Management Committees listed 1 3
private sector and 55 public sector LMC's, whereas present estimates
exceed 120 cases by the International Association of Machinists alone
and 90 programs inside General Motors (Batt, 1981). Twenty-five percent
of American businesses are believed to be involved in such programs
(Hlaweck, 1982). Though such reports inflate the spread of QWL due to
this study1s more stringent definition as requiring joint program
initiation and system-wide elected structures, QWL's growth is un
deniable. Herrick (1982b) adopts the stricter definition and compiles
reports of several "pure" QWL efforts within the public sector, as well
as some related projects.
While this study has sketched the general forces behind QWL on
the American scene, more detailed accounts of the historical signposts
of OWL are available elsewhere (Huse, 1980; Ronchi, 1980). Landen
(1981) targets two major events: (1) President Nixon's commissioning
of the National Center for Productivity and Quality of Working Life,
which was headed by the vice-president and stimulated the growth of
labor-management experiments and other non-profit QWL centers; and (2)
the widespread publicity on changing worker attitudes. Landen, a key
QWL proponent within General Motors, comprehensively traces the evolu
tion of QWL over 25 years along three tracks: society (foreign influence
and social events); General Motors* influence (among the first major
corporations to make a QWL commitment); and government involvement
(such as 1979's Lundine-Javitts Labor-Management Cooperative Act offer
ing financial support and motivation to further projects).
Pima County Perspective
In 1977, Pima County, Arizona, joined a group of eight states
and cities called Project Network which decided to start QWL programs.
A volunteer County Labor-Management Committee functioned for several
years in conjunction with the Human Resources Department and in "1980
the County received a grant from the U.S. Office of Personnel Adminis
tration to set up a pilot QWL department" (Herrick, 1980b, p. 2).
26
On May 30, 1980, the Department of Transportation and Flood Con
trol District became the first county government department in the
nation legitimately to elect a QWL committee structure, aiming at a
five-year grant-supported endeavor to involve the entire County in the
QWL program. This installment was followed by the 1981 initiation of
QWL in a second department, a nursing home called Posada del Sol, and
by the landmark election of a 29-member, County-wide Labor-Management
QWL committee. This latter analogue to the U.S. Contress is respon
sible for developing proposals to increase productivity and improve
working life quality, and is charged with implementing the QWL system
in the County's remaining 33 departments.
The historical development and social context of the QWL move
ment have gathered much momentum, but QWL is characterized by a relative
youth, resulting in inevitable shortcomings. One void is QWL's short
age of the fuller range of standardized assessment tools enjoyed by
other, more mature social movements. The importance of such measure
ment is addressed below as the next step in forwarding the "state of
the art" of QWL's spiraling influence in this country.
Statement of the Problem
Purpose of the Study
The major purpose of this study was to construct a standardized
instrument for assessing the attitudes of employees toward a public
sector Quality of Working Life program. While scale development in
volved the examination of the attitudes of respondents, the study's key
focus remained obtaining a Long and Short Form of the Quality of Working
27
Life Attitude Scale (QWLAS). The attitude data from Pima County
employees were primarily examined as part of final item selection and
for purposes of stimulating directions for further research.
Objectives of the Study
The umbrella purpose of constructing a Quality of Working Life
Attitude Scale (QWLAS) led to the following research questions:
1. What basic factors comprise the concept of QWL attitude as
measured by the QWLAS?
2. What items can comprise the final QWLAS Long Form and Short
Form without significantly lowering scale reliability?
3- Is the QWLAS a reliable psychological instrument?
k. Is the QWLAS a valid psychological instrument?
General Significance of the Study
This study adds to the field of organizational change by making
available a systematic instrument for assessing favorable and unfavor
able attitudes toward QWL experiments in the public sector, enabling
entry-level and ongoing awareness of program acceptance or resistance.
The Importance of QWL Research
Considerable attention is given by QWL and other approaches to
improving organizational effectiveness and the quality of working con
ditions® Social scientists studying the introduction of organization
change by unions and managements demand useful assessment methodology
and instrumentation to interpret program effects, establish causal
connections between the program and its results, and generalize findings
28
to other settings (Lawler, et al., 1978). Such investigation helps to
verify program results, understand planned change processes, and
develop theories to explain change (Stone, 1980).
Recognizing the risky nature of introducing organization change
efforts, Lawler et al. (1978) advocates a stronger role for research on
conditions optimal for various approaches to organizational reform. He
summarizes the need for valid assessment to:
1. Provide credible information on the successes and limitations of different change approaches so that the theory and practice of organization change can be improved;
2. Provide data on how various situational factors in the organization and its environment moderate effectiveness of change programs;
3. Guide social action to improve the quality of work life and the effectiveness of organizations;
k. Aid in the implementation of practices intended to improve organizational effectiveness and the quality of work life (Lawler, et al., 1978, p. 4).
French, Bell, and Zawacki (1978) note the scarcity of scientifi
cally respectable research evaluating organization change programs,
describing the need to empirically test those findings which are too
frequently offered in anecdotal, informal terms. Cummings, et al.
(1977) criticize 58 work experiments on the basis of inadequate change
program descriptions, lack of theory-based evaluation criteria,
utilization of measures with questionable reliability and validity,
and faulty research designs. These findings and Leedy's (197 ) exten
sive coverage of the requirements for disciplined practical research
give rise to the classical questions about the feasibility of scien
tific research within the field of organization change (Greiner and
Barnes, 1970; French and Bell, 1973)•
29
Benne, Chin, and Bennis (1976) confront the organization change
agent with the difficulty of retaining scientific objectivity while
intervening in the change process for favorable outcomes. Susman and
Evered (1978, p. 582) maintain that the real "crisis in organizational
science" transcends this conflict between social scientist and social
practitioner roles, and is attributable to the inappropriateness of
even attempting to adopt strict scientific methodology within an on
going social system experiment#
Still, most researchers believe in the possibility of obtaining
objective, reliable and valid results. Whether they stress case study
paradigms (Yin, 1981) or emphasize the capacity of various quasi-
experimental and other designs to reduce potential experimenter bias
(White and Mitchell, 1978), most writers reinforce the need for de
veloping rigorous, formal research methodologies (Kimberly and Nielsen,
1978; Beckhard and Lake, 1978; Reicken, 1978).
The Gap in Current QWL Assessment Research
The productivity crisis spawning QWL experiments in this country
also accounts for the lop-sided emphasis in most QWL evaluation and
research upon accountability-oriented, economic-based outcome measures.
Most measurement methodologies stress gross financial outcomes of
increased economic effectiveness (Macy and Mirvis, 1976) or rises in
productivity (Susman, 1979; Huckleberry, 1981). Herrick (1975) pio
neered the expansion of the scope of OWL assessment beyond this
conventional, bottom-line approach of cost of output and volume of
production with his identification of "work force indicators," a set of
behaviorally measureable variables affected by QWL experiments. He
advocates the recognition of factors like accrued sick leave, promotions
from within, and accident rate (Herrick 1980b) as indirect, yet sig
nificant measures of productivity gains. Macy and Mirvis (1976) further
Herrick's work toward obtaining a newer, standardized methodology for
measuring productivity gains in behavioral-economic terms.
Available literature reveals a heavy emphasis in QWL research
upon evaluation of positive effects upon work "according to both
economic/technical and human/social criteria" (Maccoby, 19751 p. i).
This frantic scramble to document accountability can be at the expense
of employee support, and QWL research should provide insight into the
dynamics of change. These foci demand inquiry into qualitative as well
as quantitative data, the use of "soft" as well as "hard" measures of
effectiveness (French et al., 1978) and exploration of the processes of
organizational change (Keidel, 1980). Measurement and observation of a
change effort should capture more than its outcomes, but also the pro
cesses by which the change is planned and implemented (Seashore, 1979).
Many research designs do reflect a bias for understanding the
human side of a strategy's evaluation in addition to the strictly
quantitative, economic bottom-line data (Porras and Berg, 1978). Case
study approaches, for instance, focus upon qualitative dimensions like
the processes underlying change (Walton, 1972; Yin, 1981; Davis and
Cherns, 1975b). This shift from pure outcome research to a search for
causal links (Lawler, et al., 1978) requires indepth tracing of pro
cesses within individual sites (Keidel, 1980) and the adoption of
31
longitudinal studies (Seashore and Bowers, 1978; Beckhard and Lake,
1978). Both thrusts include attitude assessment.
The Need for Attitude Measurement in QWL Research
While QWL outcome research is critical for understanding change
efforts, data which focus only on changes in general job satisfaction,
work conditions, and productivity ignore the human fulfillment and
change process dimensions of the experiment. Lawler et al. (1978)
explicitly recognizes the measurement of individual attitudes and
beliefs as one of six key components of organizational assessment,
along with outcomes; individual and group behavior; job characteristics,
technology and organization structure; individual and group character
istics; and the external environment.
"Attitude" is defined by Kerlinger (1973) as an "organized pre
disposition to think, feel, perceive toward a referent or cognitive
object. It is an enduring structure of beliefs that predisposes the
individual to behave selectively towards the attitude referents"
(Kerlinger, 1973, p. 95). Remmers (195 , p. 16) describes attitudes
as greater determinants of behavior than cognitive understanding alone.
He envisions attitudes as central variables in the development of a
"science of society" and views the fulfillment of psychology and social
science as dependent on learning to measure and cultivate attitudes
conducive to social change, public responsibility, free inquiry and the
extension of democracy.
Some attitude assessment exists within QWL literature, as re
viewed below. Attitude literature primarily addresses job satisfaction

32
and work conditions which necessitate programs like QWL, and involves
pre-post measurement of attitude about work as influenced by QWL. There
is a need in current literature for more attention to the critical role
played by QWL participant attitudes towards the change program itself,
which is the focus of this study. If QWL is a democratic tool, the
employees of such a participation-based effort are the carpenters whose
attitudes are critical.
Literature in the field of organizational change demonstrates
great concern for the level of involvement in, and commitment to, the
change effort (Huse, 1980). This theoretical thrust provides a ratio
nale for addressing attitudes of program participants towards the
project itself, and for more fully appreciating the detrimental impact
of their neglect upon program success, even where there are monumental
productivity gains.
Lewin's (1951) classic force field analysis theory permits
examination of the wide range of forces driving for acceptance of change
and those forces restraining movement from the status quo. His diag
nostic perspective reflects the need to assess and address forces
resisting change rather than merely increasing those pushing for change
(Argyris, 1971). One potentially devastating set of resisting forces
can be the attitudes of individuals toward OWL projects from inception
throughout their duration.
Spier (1973) reviews a variety of strategies for working with
data produced from a force field analysis and cautions against altering
the equilibrium of forces in the direction of change by strengthening
or adding forces driving for change implementation. These tactics
create tensions that are met by an increase in the restraining forces,
in the form of resistance. A more stable, tension-free approach is
accepted to be the removal or diminishment of opposing forces. Since
unfavorable worker and supervisor attitudes toward OWL comprise a key
restraining force to change the assessment of these attitudes is essen
tial to a program's success.
Existing OWL Attitude Assessment
Some limited literature exists on QWL attitudes, focusing spe
cifically on participants accepting or resisting the QWL program. This
work consists primarily of burdensome interview formats (Herrick, 198lb)
or autobiographical accounts of reactions by organization members
(Herrick and Ronchi, 1982). Other works are comprised of theoretical
hypotheses about dispositions conducive to a "participatory democratic
consciousness" (Frost, et al., 197p« 93)» and speculations about the
nature of different groups' QWL objections and appreciations (Herrick,
1972). Still lacking is an empirically-based, systematic assessment of
attitudes of various groups toward QWL initiatives.
Some extensive opinion surveys exist, but they tend to assess
dimensions of interest other than the needed examination of reactions
toward the change effort itself. Various surveys inventorying atti
tudes about working conditions and organizational climate have been
championed by the Institute for Social Research at the University of
Michigan (Bowers and Franklin, 1977; Haussler, et al., 1977; Franklin,
et al., 1977). Seashore (1979) discriminates between these explorations
of the work-related attitudes and their impact on work-related behaviors

3^
like turnover and absenteeism, and a second, newer group of attitude
studies. These more recent surveys relate job satisfaction and emo
tional attitudes, such as authoritarianism, to more general indicators
of well-being such as mental health, physical health and non-work
attitudes. They are exemplified by the "Quality of Employment Survey"
(Quinn and Staines, 1977)* "The Survey of Working Conditions" (Ouinn,
et al., 1971), "The Pima County QWL Questionnaire" (see Appendix B) and
other studies (Margolis, et al., 197 ; Kahn, 196*0.
Thus, existing QWL-related scales are actually surveys that do
not assess favorable and unfavorable QWL attitudes useful in deter
mining acceptance or resistance to the change effort, but instead seek
to determine program outcomes and effects. General Motors does have a
QWL Survey (General Motors, 1982), but as Gershenfeld (1982) has noted,
most existing instruments are not available to the public because they
are regarded by corporations as trade secrets. The literature review
in Chapter 2 of this study will describe an extensive survey taken of
existing attitude measures which failed to uncover any instrument
resembling the QWLAS.
While some QWL research addresses the problems in question
here, the "state-of-the-art" still lacks what Edwards (1957) describes
as a quick, valid, standardized instrument that can be administered on
a group basis in order to show degree of affect. Such an instrument
would move us beyond working only with several vocal individuals or
inferring attitudes from overt behaviors.
There is a need for a publicly available QWL attitude scale
enabling program initiators to "take the temperature" of experiments
in progress and to predict the likelihood of their survival in organi
zations considering their adoption. The scale could also benefit
program developers in adapting OWL systems, orientations and supportive
training to be more responsive to employees' reactions and attitudes.
Significance of the Study for Pima County
The significance of this study for the Pima County QWL project
included its contribution to adjustment and acceptance within the
Department of Transportation, by facilitating expression of QWL opinions
by all employees, both more and less vocal, who might otherwise not
communicate their feelings about the program. This unfreezing of com
munication channels about QWL was believed to be healthier than the
assumption that the democratic experiment was being well-received by
County workers.
The study also resulted in the l*f-item QWLAS Short Form which
may be incorporated into the broader research package that is being
administered in Pima County on an ongoing basis.

CHAPTER 2
REVIEW OF THE LITERATURE
Unlike the relatively focused body of literature accompanying
QWL's early stages of development, the literature involving attitudes
is overwhelming in its volume, historical continuity, and span of re
lated disciplines, including sociology, psychology, social psychology,
and education. Martens (1979) contends that the abundance of measure
ment scales illustrates the importance attached to attitudes toward a
wide range of subjects. Even 30 years ago, Kahn (1951) acknowledged
that any extensive review of attitude literature was an unrealistically
mammoth endeavor.
The words of Gordon W. Allport (1935)t pioneering social
psychologist, usher in the first chapter of Edwards' (1957) classic
Techniques of Attitude Scale Construction:
The concept of attitude is probably the most distinctive and indispensible concept in contemporary American social psychology. No other term appears more frequently in experimental and theoretical literature (Edwards, 1957, p« xvi).
A literature review congruent with this study's purpose of
constructing an attitude scale demands a broader focus than instrument
development. Disciplined scale construction is enriched by awareness
of the entire field of attitudes, so that the investigator understands
the role of attitude measurement within its proper context. Since the
scope of this study does not permit a detailed review of the field,
36
37
this chapter assists the aspiring attitude researcher by presenting a
guide to attitude literature. The two areas of attitude theory and
attitude measurement are organized into sub-categories, depicted in
Table 2, with citings of several representative, widely used sources.
This taxonomy of attitude literature will be followed by the
results of an extensive survey of existing attitude scales in search of
QWL-related instruments. While this discussion of QWL-oriented tools
is directly connected to the scale development purpose of this study,
the more comprehensive review of attitude literature is also pertinent
to this study.
Fishbein (1967) conceptualizes the three major facets of the
study of attitudes as theory, measurement, and change. However, Rogers
(1978) has noted that for all intents and purposes, theoretical material
on attitude formation and development is indistinguishable from attitude
change literature. Therefore, this review organizes attitude research
into the two major areas of attitude theory and attitude measurement.
Attitude Theory
The investigator in attitude assessment must become acquainted
with the literature on attitude theory, realizing that, "the distinction
between theory and measurement is an artificial one, and that neglect
of the theoretical assumptions which are made by the various methods of
measurement is likely to engender a form of false consciousness on the
part of the researcher which could lead him to misunderstand the nature
of the data that he has obtained" (Lemon, 1973, p. vii). Three sub
categories, though not entirely independent entities, comprise a
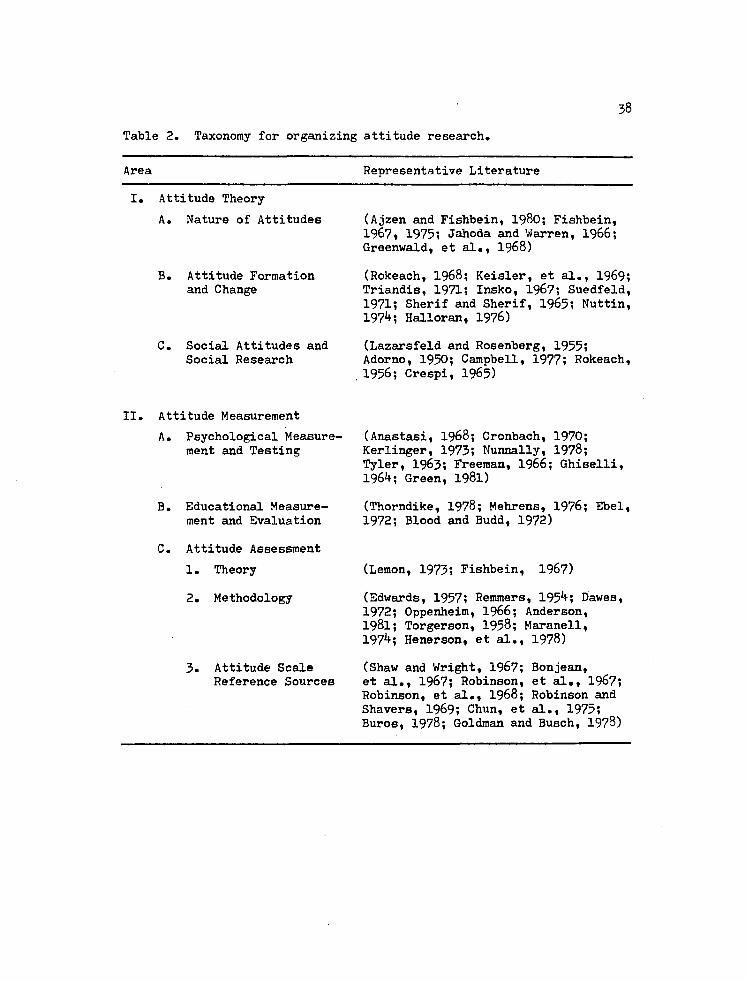
38
Table 2. Taxonomy for organizing attitude research.
Area Representative Literature
I. Attitude Theory
A. Nature of Attitudes
B. Attitude Formation and Change
C. Social Attitudes and Social Research
(Ajzen and Fishbein, 1980; Fishbein, 1967, 1975; Jahoda and Warren, 1966; Greenwald, et al., 1968)
(Rokeach, 1968; Keisler, et al., 1969; Triandis, 1971; Insko, 1967; Suedfeld, 1971; Sherif and Sherif, 1965; Nuttin, 197 ; Halloran, 1976)
(Lazarsfeld and Rosenberg, 1955; Adorno, 1950; Campbell, 1977; Rokeach, 1956; Crespi, 1965)
II. Attitude Measurement
A. Psychological Measurement and Testing
B. Educational Measurement and Evaluation
C. Attitude Assessment
1. Theory
2. Methodology
3. Attitude Scale Reference Sources
(Anastasi, 1968; Cronbach, 1970; Kerlinger, 1973; Nunnally, 1978; Tyler, 1963; Freeman, 1966; Ghiselli, 196 ; Green, 1981)
(Thorndike, 1978; Mehrens, 1976; Ebel, 1972; Blood and Budd, 1972)
(Lemon, 1973; Fishbein, 1967)
(Edwards, 1957; Remmers, 195 5 Dawes, 1972; Oppenheim, 1966; Anderson, 1981; Torgerson, 1958; Maranell, 197 ; Henerson, et al., 1978)
(Shaw and Wright, 1967; Bonjean, et al., 1967; Robinson, et al., 1967; Robinson, et al., 1968; Robinson and Shavers, 1969; Chun, et al., 1975; Buros, 1978; Goldman and Busch, 1978)
rational clustering of the proliferation of attitude theory literature
and provide grounding in (1) the nature of attitudes, (2) attitude for
mation and change, and (3) social attitudes and social psychology
research. These categories build a conceptual understanding of "atti
tude" as a unique phenomenon, an appreciation for the dynamics of
attitude development, and a commitment to the value of attitude measure
ment.
The Nature of Attitudes
Comprehension of the conceptual nature of attitudes requires
familiarization with historical foundations (Allport, 1935; Cantril,
1932; Symonds, 1927).as well as the more recent, comprehensive
anthologies of readings and attitude theory (Ajzen and Fishbein, 1980;
Fishbein , 1975; Greenwald, et al., 1968; Jahoda and Warren, 1966).
Various works clarify attitude's alternative definitions and concep
tualizations (Goldberg, 1955; Millward, n.d.; Schelble, 1977; Greenwald,
et al., 1968), discuss the relation of overt action and verbally ex
pressed attitudes (Thurstone, 195*0 and compare attitudes with important
adjunct phenomena such as values, traits, beliefs, opinions and
interests (Guilford, 195 ; Hennessy, 1970).
Attitude Formation and Change
Rogers' (1978) contention that attitude change literature
(Triandis, 1971; Halloran, 1976) and the theories of attitude formation
overlap is exemplified by consistency (Rosenberg, I960; McGuire, I960),
dissonance (Festinger, 1957; Brehm and Cohen, 1962), balance (Heider,
19 6; Newcomb, 1953) and congruity (Osgood and Tannenbaum, 1955;
ko
Rokeach and Rothman, 1965) approaches. Major works on attitude change
often consist of presentation of theorists' own models of attitude for
mation and change (Sherif and Sherif, 1965; Newcomb, 19 3; Rokeach,
1968). Similarly, writers presenting competing views of attitude
change adopt as their vehicle a comparison of various attitude develop
ment theories (Keisler, et al., 1969; Suedfeld, 1971; Insko, 1967;
Nuttin, 197 )•
Social Attitudes and Social Psychology Research
Social attitude research (Lazarsfeld and Rosenberg, 1955) is
the major activity within social psychology, in which the nature of
attitudes is studied and methods for assessing them are derived in
order to predict reactions of people to some group, social institution,
or social concept. Knowledge of specific attitudes and their method
of functioning can be combined with research about principles governing
attitude change to influence processes of socialization, as in propa
ganda, education, and therapy (Shaw and Wright, 1967)• Accordingly,
this third branch of attitude theory literature, as typified by Adorno's
standard work, The Authoritarian Personality (1950) studies social
attitudes with the intent of impacting favorably upon social, economic,
and political problems (Guilford, 195 ).
Various writers have defined social psychology as being the
scientific study of attitudes (Thomas and Znaniecki, 1918), or at least
as incorporating attitude measurement as its central problem (Allport,
1935; Lemon, 1973)• Much of the history of attitude research has been
aimed at learning about social attitudes and related issues, such as
41
particular ethnic attitudes (Goldberg, 1955; Horowitz, 1936; Campbell,
1977), persuasability and propaganda (Doob, 1935)» political or re
ligious dogmatism (Rokeach, 1956), radicalism-conservatism (Nelson,
1938) and anti-democratic attitudes (Remmers, 1963)*
Several offshoot areas related to social psychology attitude
research deserving mention are the utilization of large-scale surveys
within the market research field (Crespi, 1965), employee surveys of
job satisfaction and work-related feelings (Quinn, et al., 1971, 1977;
Habbe, 1961; Raube, 1951)1 and public opinion polling to forecast
elections or ascertain public sentiment on national and international
questions of a social, political, or economic nature (Chisman, 1976;
Murphy and Likert, 1967)« While such surveys are treated separately
from more focused attitude scales in Kerlinger's (1973) and Anastasi's
(1968) standard texts, their central role in social science research
renders them fruitful objects for study (Campbell and Katona, 1953)•
Attitude Measurement
The second broad facet of attitude research, attitude measure
ment, encompasses vast bodies of literature on (1) psychological
measurement and testing, (2) educational measurement and evaluation,
and the more esoteric, most pertinent sphere of the study, (3) attitude
assessment. Attitude assessment's background in psychological and
educational measurement justifies these latter disciplines being
addressed in this review.
In 1938, 0. K. Buros published The 1938 Mental Measurements
Yearbook, a comprehensive volume reviewing 331 psychological instruments.
E. F. Lindquist (1951) noted in 19 5 the urgent need for a comprehensive
handbook and textbook on the theory and methodology of educational
measurement. From this meager "state of the art" flowed a steady stream
of instruments, books and articles on measurement. A scan of the 582
test and measurement books listed in Buros' (1978) Eighth Mental
Measurements Yearbook fleshed out over 80 works on educational measure
ment, 50 books addressing psychological measurement, and about 10
volumes directly concerning attitude assessment. This list is not
complete, but it attests to the impossibility of exhaustively viewing
the measurement field within the parameters of this study.
Psychological Measurement and Testing
A History c-f Psychological Testing (Dubois, 1970) traces the
historical and philosophical roots of measurement. While psychology
prior to 1850 entailed a non-experimental, philosophical spirit of
inquiry, the early 1900*s brought vigorous efforts to expand the
discipline into a science by adopting the experimental method and
measurement as its chief experimental tool (Thorndike and Hagen 1955)•
Attitude scale construction's utilization of measurement cornerstones
of reliability, validity, and item analysis, and the role of measure
ment theory and method in understanding human behavior, create the
requirement for consulting standard texts in the field (Cronbach, 1970;
Freeman, 1966; Tyler, 1963; Ghiselli, 196*0.
Kerlinger's (1973) Foundations of Behavioral Research deserves
attention as an authority on research and the scientific method within
the behaviorally-related fields. Anastasi's (1968) Psychological
Testing assists readers in evaluating any type of psychological test

and correctly interpreting their results: "(1) through an understanding
of the principles of test construction, (2) through psychological
knowledge about the behavior being measured, and (3) through familiarity
with the field of available instruments" (Anastasi, 1968, p. v). Less
ambitious researchers may appreciate Green's (1981) "A Primer of Test
ing."
Educational Measurement and Evaluation
The overlap between psychological and educational measurement
theory and methods of test construction is apparent in the major pro
fessional publication, Educational and Psychological Measurement, as
well as numerous books encompassing both emphases (Mehrens and Ebel,
1967; Thorndike and Hagen, 1955; Nunnally, 1972). Nevertheless, the
two measurement fields' shared substantive material regarding relia
bility, validity and item analysis does not overshadow the distinctions
between them. Educational measurement focuses more upon application
of measurement theory to tests of individual ability, achievement and
other characteristics for the fostering of learning, evaluation of
instructional methods, educational placement and choice of studies or
occupation (Lindquist, 1951)•
The comprehensive work of Thorndike (1978) addresses test
design and construction; administration and processing; special types
of tests; measurement constructs such as reliability, validity, norms,
and scales; and the application of tests to educational programs.
Lindquist (1951) considers his text an advanced handbook of primary
source articles on the functions of measurement in education, the
construction of achievement tests, and measurement theory. Mehrens
Mf
and Ebel (1967) also offer selected articles encompassing the broader
topics of measurement theory and scaling, norms, reliability, validity,
and item analysis and selection. Additional suggested references
include Payne (197*0, Ebel (1972), and Mehrens (1976).
The achievement test emphasis of original educational measure
ment is retained in several less voluminous, teacher-directed evaluation
books (Blood and Budd, 1972; Pidgeon and Yates, 1968; Brown, 1971;
Bertrand and Cebula, 1980; Wood, I960). Attitude measurement investi
gators have found contributions of such more focused references to fall
in the sphere of item analysis and selection. Finally, useful perspec
tive is provided for both psychological and educational measurement
theory in original articles, such as those by Cronbach (1951) on the
coefficient alpha estimate of reliability, Cronbach and Meehl (1955)
on construct validity, and Campbell and FiBke (1959) on convergent and
divergent construct validity. These representative classic papers are
cited as encouragement for the attitude researcher to tap the vast
storehouse of direction and practical technique available outside the
realm of conventional textbooks and anthologies.
Attitude Assessment
Beyond literature about attitude theory and general measurement,
the specific field of attitude assessment is more relevant to this
study's aims of QWL scale construction. The difference in sophistica
tion between attitude theory and attitude assessment is a noticeable
one, according to Lemon (1973)» with assessment models demonstrating
much more rigor, being "derived from basic axiomatic systems of finite
mathematics or probability theory. . . He elaborates, "Current
theories of attitude formation and change do not possess the elegance
of such formal models . . . theoretical formulations often consist of
a series of apparently loosely worded statements, which endeavor to
describe empirical relationships, but which contain little by way of
explicit axioms or formal structure" (Lemon, 1973i P« 29). The areas
within attitude assessment literature include: (1) attitude assessment
theory; (2) attitude assessment methodology; and (3) attitude assessment
reference sources.
Theory. Besides Lemon's (1973) volume, major theoretical treat
ment of attitude assessment is offered by Fishbein (1967), who gathers
articles concerned with the "theory underlying attitude measurement
rather than with the measurement process per se" (Fishbein,1967, p« v).
Additional assessment theory is transferable from the general educa
tional and psychological measurement literature, as well as subsumed
within attitude books whose primary attention is upon methodology
(Remmers, 195 ; Shaw and Wright, 1967)#
Lazarsfeld and Barton (1951) describe the four progressive
stages of social science measurement as: (1) forming of an initial
image of the nature of the measurement concept; (2) determining the
basis for measurement by specifying the concept's relevant dimensions;
(3) searching for indicators to represent theoretical concepts in order
to translate these ideas into practice; and (k) combining the scores
from these identified indicators into indices which can represent the
underlying attitude. This final stage epitomizes the challenge of
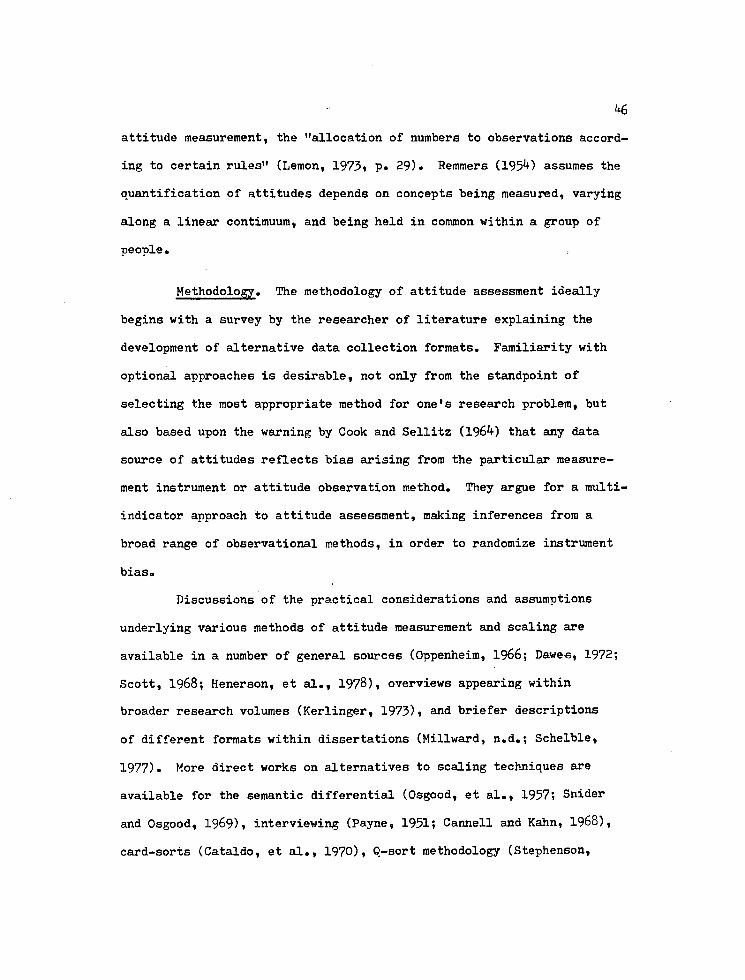
attitude measurement, the "allocation of numbers to observations accord
ing to certain rules" (Lemon, 1973, p. 29). Remmers (19511-) assumes the
quantification of attitudes depends on concepts being measured, varying
along a linear contimuum, and being held in common within a group of
people.
Methodology. The methodology of attitude assessment ideally
begins with a survey by the researcher of literature explaining the
development of alternative data collection formats. Familiarity with
optional approaches is desirable, not only from the standpoint of
selecting the most appropriate method for one's research problem, but
also based upon the warning by Cook and Sellitz (196*0 that any data
source of attitudes reflects bias arising from the particular measure
ment instrument or attitude observation method. They argue for a multi-
indicator approach to attitude assessment, making inferences from a
broad range of observational methods, in order to randomize instrument
bias.
Discussions of the practical considerations and assumptions
underlying various methods of attitude measurement and scaling are
available in a number of general sources (Oppenheim, 1966; Dawee, 1972;
Scott, 1968; Henerson, et al., 1978), overviews appearing within
broader research volumes (Kerlinger, 1973)1 and briefer descriptions
of different formats within dissertations (Millward, n.d.; Schelble,
1977)• More direct works on alternatives to scaling techniques are
available for the semantic differential (Osgood, et al., 1957; Snider
and Osgood, 1969), interviewing (Payne, 1951; Cannell and Kahn, 1968),
card-sorts (Cataldo, et al., 1970), Q-sort methodology (Stephenson,

1953i 1967; Jackson and Bidwell, 1959; Wittenborn, 1961), and more
indirect and unobtrusive ways of observing attitudes through naturally
occurring behavior (Kidder and Campbell, 1970; Webb, et al., 1966).
The basic method of attitude measurement is the self-report
approach of the attitude scale, "a set of symbols or numerals so con
structed that the symbols or numerals can be assigned by rule to the
individuals (or their behaviors) to whom the scale is applied, the
assignment being indicated by the individual's possession of whatever
the test is supposed to measure" (Kerlinger, 1973» p. 92).
The development and validation of adequate assessment scales
has been identified as a major factor needed for attitude improvement
in a variety of areas, such as attitudes toward educational research
(Isakson and Ellsworth, 1979), sexism (Benson and Vincent, 1980),
student opinions about school programs (Perney, 1975) and teacher atti
tudes towards mainstreaming (Reynolds and Greco, 1980). This researcher
reviewed a sample of about 30 articles describing the construction of
such attitude scales (see Table 3 for the range of attitude scale
referents), because they offer practical guidance on scale construc
tion concerns like scaling procedures, development of conceptual frame
works, item generation, design of the instrument, administration,
criteria for deleting items, reliability and validity.
Beyond references to attitude scaling found within measurement
theory volumes and journal articles, standard works on construction in
clude Edwards' Techniques of Attitude Scale Construction (1957)«
Remmers' Opinion and Attitude Measurement (195*0« and Oppenheim's
Questionnaire Design and Attitude Measurement (1966). One more recent
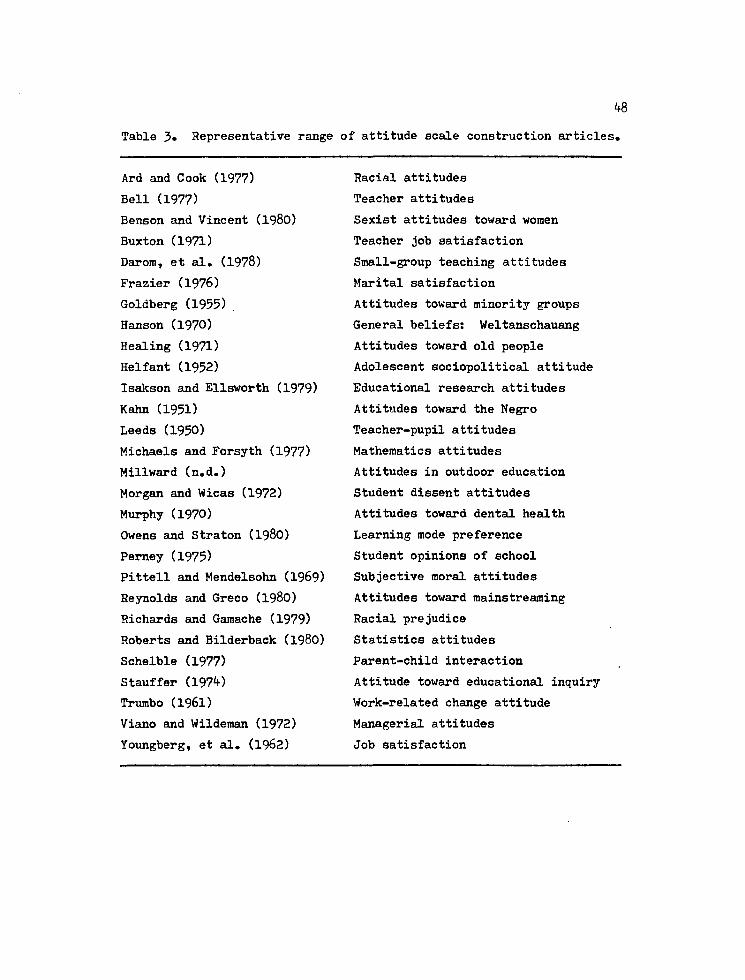
48
Table 3. Representative range of attitude scale construction articles.
Ard and Cook (1977)
Bell (1977)
Benson and Vincent (1980)
Buxton (1971)
Darom, et al. (1978)
Frazier (1976)
Goldberg (1955)
Hanson (1970)
Healing (1971)
Helfant (1952)
Isakson and Ellsworth (1979)
Kahn (1951)
Leeds (1950)
Michaels and Forsyth (1977)
Millward (n.d.)
Morgan and Wicas (1972)
Murphy (1970)
Owens and Straton (1980)
Perney (1975)
Pittell and Mendelsohn (1969)
Reynolds and Greco (1980)
Richards and Gamache (1979)
Roberts and Bilderback (1980)
Schelble (1977)
Stauffer (1974)
Trumbo (1961)
Viano and Wildeman (1972)
Youngberg, et al. (1962)
Racial attitudes
Teacher attitudes
Sexist attitudes toward women
Teacher job satisfaction
Small-group teaching attitudes
Marital satisfaction
Attitudes toward minority groups
General beliefs: Weltanschauang
Attitudes toward old people
Adolescent sociopolitical attitude
Educational research attitudes
Attitudes toward the Negro
Teacher-pupil attitudes
Mathematics attitudes
Attitudes in outdoor education
Student dissent attitudes
Attitudes toward dental health
Learning mode preference
Student opinions of school
Subjective moral attitudes
Attitudes toward mainstreaming
Racial prejudice
Statistics attitudes
Parent-child interaction
Attitude toward educational inquiry
Work-related change attitude
Managerial attitudes
Job satisfaction
treatment brings the reader up to date on attitude scale methodology as
applied to affective characteristics within schools (Anderson, 1981).
The historical foundations of the most popular scaling tech
niques are discovered in the early works on Thurstone's method of equal-
appearing intervals (Thurstone and Chave, 1929; Thurstone, 19 *6),
Likert's method of summated ratings (Likert, 1932; Murphy and Likert,
1937) and Guttman's scalogram analysis (Guttman, 19 i 19 5). Classic
comparisons of the two most widely used approaches of Likert and
Thurstone include early reviews by Edwards (1957)* Edwards and Kenney
(19 6) and Ferguson (19 1).
Torgerson (1958) offers a more mathematical, indepth analysis
of widely recognized scaling methods, and Maranell's (197*0 sourcebook
draws together primary source papers from a wide spectrum of sociologi
cal and psychological journals and books. Shepard, Romney, and Nerlove
(1972) represent the more recent emphasis upon multi-dimensional as
opposed to uni-dimensional scaling.
Attitude Scale Reference Sources. The imformation explosion in
sociological and psychological research literature has culminated in a
staggering wealth of attitude assessment instruments. Thankfully, the
attitude researcher need not spend long hours combing the literature,
duplicating search efforts of others, or needlessly devoting energy
toward developing an assessment tool when one may already exist for his
purposes. Backer (1972) presents a reference guide of "people, publi
cations and projects which might serve as resources for locating
psychological tests or information about them" (Backer, 1972, p. 751),

but his compendium does not focus specifically enough upon attitudes and
his scope extends beyond presenting volumes in which attitude scale
compilations may be found. Therefore, several widely used and more
remote attitude scale reference sources deserve mention.
Scales for the Measurement of Attitudes (Shaw and Wright, 1967)
is the seminal work in the field, widely respected for its reprinting
and research-oriented descriptions of 176 attitude scales. The instru
ments are classified according to topic areas of attitudes towards
social practices, social issues, international issues, abstract con
cepts, political and religious attitudes, ethnic and national groups,
significant others and social institutions.
Sociological Measurements: Inventory of Scales and Indices
(Bonjean, et al., 1967) provides a content analysis of four major socio
logical journals covering the period of 195* -1965 and classifies the
located attitude measures into numbered categories within 78 conceptual
areas, complete with supportive bibliographies of studies which discuss
or utilize the instruments. A series of Institute for Social Research
reference sources includes collections and descriptions of 90 Measures
of Political Attitudes (Robinson, Rusk and Head, 1968), 77 Measures of
Occupational Attitudes and Occupational Characteristics (Robinson,
Athanasiou and Head, 1969) and Measures of Social Psychological
Attitudes (Robinson and Shaver, 1969).
The best-known volumes compiling testing instruments are the
more general, comprehensive Buros series. The most recent Eighth Mental
Measurements Yearbook (Buros, 1978) offers multiple critical reviews
and references for thousands of published tests of ability, aptitude,

personality, educational achievement, and attitudes. No specific sec
tion presents attitude scales, available in Measures for Psychological
Assessment (Chun, et al., 1975)# The Directory of Unpublished Experi
mental Mental Measures (Goldman and Busch, 1978) attempts to do for non-
commercially-produced assessment instruments what Buros has done for
commercially-produced, standardized mental measures, and the collection
does include a section of 78 attitude instruments. Minimal attitude
scale references are available in the lesser-known volumes, A Source
book for Mental Health Measures (Comrey, et al., 1973)1 The Mental
Examiner's Source Book (Davis and Forey, 1975) and a guide to human
relations training instruments compiled by Pfeiffer and his colleagues
(Pfeiffer, et al., 1976).
Survey of Literature for QWL-Related Attitude Scales
The literature review for this study would be incomplete without
reference to existing attitude scales similar to the one being con
structed here, and such a review evidences the need for the present
research. An extensive survey of the major reference sources for atti
tude scales produced no instrument resembling the QWLAS. This fact is
regretful since QWL's uniquely social character, explicitly-stated
goals and values, and distinctive structures and procedures make it an
especially rich, fertile object for attitude measurement.
The standard volumes. Scales for the Measurement of Attitudes
(Shaw and Wright, 1967), The Eighth Mental Measurements Yearbook (Buros,
1978), Measures of Social Psychological Attitudes (Robinson and Shaver,
1969) and Measures of Political Attitudes (Robinson, et al., 1968),
document only a handful of instruments even remotely related to OWL.
These scales are limited to tapping general job satisfaction and union-
management attitudes, rather than focusing on cooperative endeavors such
as LMC's or OWL,demonstrating the infancy of joint change efforts in
this country.
Despite extensive presentations of seemingly-relevant organiza
tion and job-related measures, the same lack of scales for use in
cooperative labor-management initiatives characterizes Sociological
Measurement: An Inventory of Scales and Indices (Bonjean, et al., 1967)
and Measures of Occupational Attitudes and Occupational Characteristics
(Robinson, et al., 1969). Table k suggests the conceptual areas and
categorizes a number of existing scales as presented in the Bonjean
volume which may have some relevance to various components of Herrick1s
(198la) OWL schemata. The absence of any mention of "democratization"
attests to the lack of scales dealing specifically with cooperative
influence structures. Similarly, the ISR-inventoried scales (Robinson,
et al., 1969) do not address structured mutual benefit bargaining, and
instead target indirectly-related variables such as supervisory and
leadership styles, union-management attitudes, work ethics, general job
satisfaction, work conditions, and alienation. Closeness of supervision,
degree of control and decentralization of decision-making are only
rarely mentioned, and even then, their context is interpersonally-based
participative management styles rather than structurally-based OWL
mechanisms.
Chun's guide to over 5000 measures for assessment (Chun, et al.,
1975) reveals 66 instruments pertaining to some aspect of job
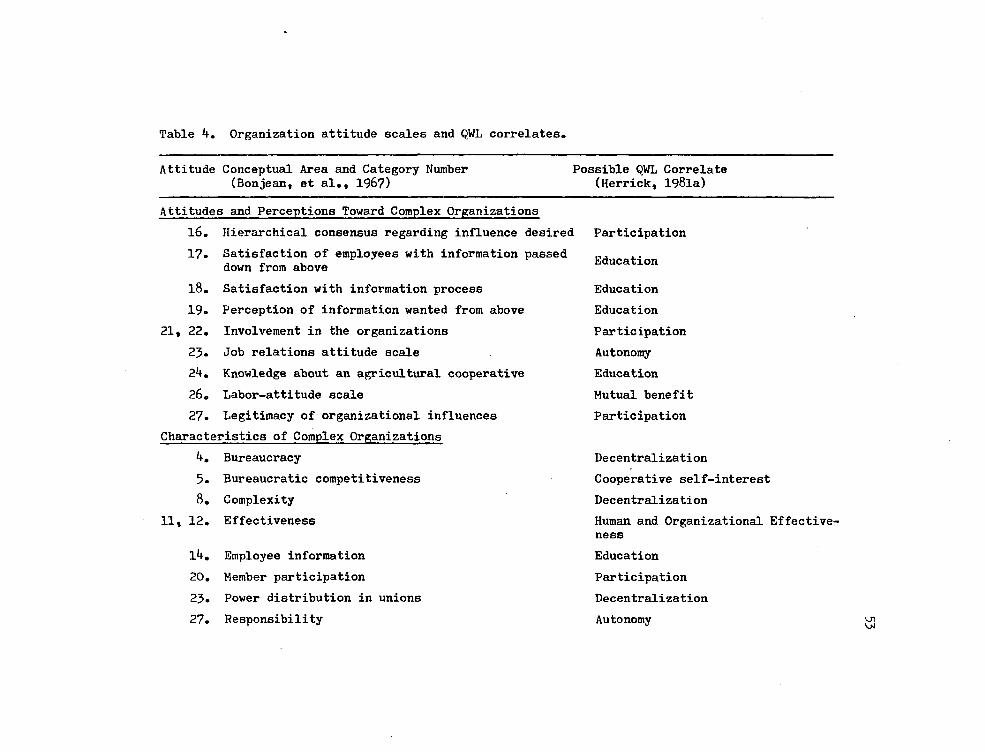
Table 4. Organization attitude scales and QWL correlates.
Attitude Conceptual Area and Category Number (Bonjean, et al., 1967)
Possible QWL Correlate (Herrick, 198la)
Attitudes and Perceptions Toward Complex Organizations
16. Hierarchical consensus regarding influence desired
17. Satisfaction of employees with information passed down from above
18. Satisfaction with information process
19. Perception of information wanted from above
21, 22. Involvement in the organizations
23. Job relations attitude scale
2 . Knowledge about an agricultural cooperative
26. Labor-attitude scale
27. Legitimacy of organizational influences
Characteristics of Complex Organizations
k. Bureaucracy
5. Bureaucratic competitiveness
8. Complexity
11, 12. Effectiveness
l'f. Employee information
20. Member participation
23. Power distribution in unions
27. Responsibility
Participation
Education
Education
Education
Participation
Autonomy
Education
Mutual benefit
Participation
Decentralization
Cooperative self-interest
Decentralization
Human and Organizational Effectiveness
Education
Participation
Decentralization
Autonomy
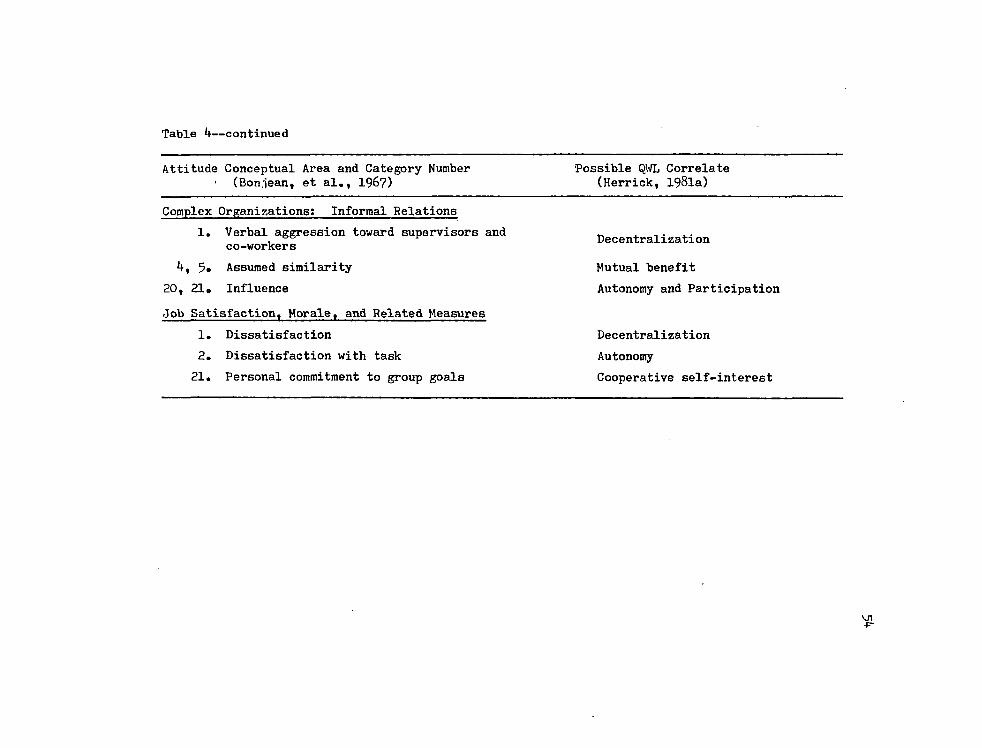
Table k—continued
Attitude Conceptual Area and Category Number (Bon.iean, et al., 196?)
Possible QWL Correlate (Herrick, 1981a)
Complex Organizations: Informal Relations
1. Verbal aggression toward supervisors and co-workers
5. Assumed similarity
20t 21. Influence
Job Satisfaction, Morale, and Related Measures
1. Dissatisfaction
2. Dissatisfaction with task
21. Personal commitment to group goals
Decentralization
Mutual benefit
Autonomy and Participation
Decentralization
Autonomy
Cooperative self-interest
ui -F-
satisfaction and 35 others which touch upon job attitudes with other
emphases, and the Goldman and Busch directory (1978) contributes less.
The scales in both volumes are either too broad in scope or too esoteric
to be of use in QWL research. A few remaining sourcebooks are not
helpful because their primary domains are defined as measurement of
mental capacities and mental health (Davis, et al., 1975; Comrey,
et al., 1973; Buros, 1970), and therefore inapplicable for this survey's
purposes.
Summary
This chapter has offered a guide to the literature on attitude
theory and measurement in hopes of rendering more manageable the bur
geoning array of material in the field. The theoretical dimension
provides a perspective on measurement endeavors, while the methodologi
cal dimension is most pertinent to the actual construction of an
attitude scale. A laborious survey of major attitude scale reference
sources has been presented, reinforcing the need for OWL-related
attitude instruments.
It is hoped that the reader benefits from coverage of both the
general field of attitude research, as well as more specific literature
on attitude assessment. The serious student or investigator of atti
tude scale development should profit from the literature as organized
and described in this chapter.
CHAPTER 3
PROCEDURES
This chapter is concerned with the methodology adopted in the
development of the Quality of Working Life Attitude Scale (QWLAS).
Procedures followed in its design, construction, and administration
are presented.
Preparation
Preliminary Literature Review
The initial stages of this study involved a review of basic
research literature (Kerlinger, 1973; Edwards, 1957; Anastasi, 1968;
Campbell and Katonah, 1953), which fostered the resolution of essential
research decisions regarding proposal-writing and planning. Early
consideration of issues such as alternative avenues for research design,
applicable data collection formats, and appropriate attitude scaling
techniques were among the parameters of the study taken into account.
Leedy (197*0 contends that such exploration and informed decision
making raises practical research from the realm of careless data collec
tion to its proper stature as a careful discipline.
Population
The population for this study was 303 employees of the Pima
County Department of Transportation and Flood Control District. The
56
Department is divided into a Division of Operations, comprised of 15k
employees, mostly blue collar, who have been involved in the OWL system
since May 1980. Five remaining divisions, predominantly white collar,
form the other half of the Department. These last divisions were
oriented to the QWL program according to the schedule presented in
Table 5»
Organization Entry
Prior to administration of the pilot form of the QWLAS, approval
of the study's procedures was obtained from the University Human Sub
jects Committee. Approval for the research was then secured from the
Department Director through an explanatory proposal. Introduction of
the project occurred through the Department's "QWL Newsletter," presen
tation at a Division Head staff meeting, and attendance of the
researcher at a Departmental QWL Committee meeting. The research
activity was conveyed by the Department Director as related to the
efforts of the principal third party consultant, Dr. Neal Q. Herrick,
and as start-up assistance in QWL acceptance and adjustment (see Appen
dix C).
Sampling
Since the subjects were already assigned to groups by nature
of their job descriptions and Divisions, and because of constraints
dictated by the study being part of "start-up assistance" consultation,
it was not possible to sample randomly or representatively. Sampling
was therefore "accidental" (Remmers, 195*0, but sampling bias was

58
Table 5. Orientation date and personnel for each division.
Division Total Employees Orientation to OWL
Operations 15 May, 1980
Traffic Engineering 35 Nov., 1980
Planning and Programming 27 Nov., 1980
Administrative Services 12 Nov., 1980
Design Engineering Zk Dec., 1980
Field Engineering 5 June, 1981
Miscellaneous 6
Population 303
minimized because all Department members received a QWL Attitude Scale
and had the opportunity to participate,
Leeds (1950) and Sabers (personal communication, 1981) have
advised scale developers in early stages of construction that no attempt
need be made to control factors such as age, sex, education or nation
ality, since the focus of attention is on scale development and field
testing, rather than interpretation of attitude data results. Remmers
(195*0 discusses the value of non-random, "accidental" sampling pro
cedures, and Kahn (1951) maintains that the extra expense and labor of
systematic random or stratified sampling is not warranted. Lawler and
his associates (Lawler, et al., 1978) have downplayed the necessity for
random assignment of subjects or control of variables in a field set
ting research effort. McNemar (Kahn, 1951) further justifies the
sacrifice of controls of a laboratory or academic setting in exchange
for the real world of the field setting, exclaiming, "The real social
psychology of attitudes is in need of research on groups of greater
generality than college students" (Kahn, 1951, p. 2). Thus, both the
field setting, and basis of this study in scale construction deem it
permissible to abandon attempts at systematic sampling.
Scale Construction
The basic methodological steps of scale development can be
generalized to other attitude measures to accomplish (1) generation of
an initial pool of attitude statements, (2) conceptual classification
of the statements, (3) selection of data collection, scaling, and item
formats, (content validity sorting by judges, (5) writing and
editing of the items for inclusion in the final instrument, and (6)
design of the questionnaire.
Generation of Initial Attitude Statements
The universe of attitudes was defined as verbal attitudes about
QWL programs, and a thorough collection was made of a large number of
statements from the following sources.
Extensive QWL Literature Review. Attitude statements were
borrowed directly or constructed from various interview-based QWL case
studies and project description literature (Herrick and Ronchi, 1982;
Herrick, 1981b; Herrick, 1977).
Interviews. The Pima County QWL project involved a separate,
ongoing research package, including interviews with ten managers, super
visors and non-supervisory employees. The researcher conducted these
one and one-half hour interviews, which uncovered the QWL issues most
salient to employees and produced potential items.
Anthropological Data. The researcher's involvement in coun- .
seling and support meetings with employees and informal discussions with
employees and colleagues surfaced many attitude statements recorded
for later use.
Attitude Inventories. An open-ended QWL Attitude Inventory was
administered to 60 employees through a series of seven "diagnostic
meetings," similar to those described by Fordyce and Weil (1978).
Separate meetings were attended by managers, supervisors and rank and
61
file employees of the Divisions of Traffic Engineering, Design Engineer
ing, Administrative Services, and Planning and Programming, respectively.
The rationale for attitude assessment was given, questions were
answered, and problems or obstacles preventing QWL acceptance were
brainstormed. Finally, respondents wrote essay answers to a general
question that asked for both favorable and unfavorable QWL opinions
(see Appendix D).
Willing employees from the Division of Operations answered a
similar general question that was distributed by supervisors at their
regular grassroots QWL meetings, for completion on the employees' own
time. Scheduling constraints on the part of the Department prohibited
special meetings for the 15 Operations employees.
Conceptual Classification of Statements
Preliminary Attitude Statement Organization. The attitude
statements from employees were tallied and compiled according to themes,
a process which facilitated data feedback to respondents in follow-up
meetings. This preliminary clustering of statements also oriented the
researcher to the range and categorization of possible QWL attitude
topics and influenced the development of initial subscales.
Development of a Rational Model for Subgrouping Items. The
clustering of items into themes was followed by the search for a con
ceptual framework that could fit the program being evaluated.
Leeds (1950) suggests using a system of item classification in
order to achieve a more adequate sampling of prospective attitudes, to
62
differentiate the ideational content of items, and to roughly identify
the possible factors of a measured attitude, which serve as subscales
to be confirmed through later factor analysis. Other scale developers
(Benson and Vincent, 1980; Perney, 1975; Stauffer, 197*0 believe that
adopting a conceptual framework contributes to better content validity
by yielding a more substantial, representative body of inventory con
tent.
This utilization of a theoretical structure to arrive at scale
components identified relevant areas for measurement which appeared
conceptually independent, and determined the logical relationships
between items before administration. Especially in research assessing
the reactions of groups toward particular aspects of an organizational
program, the "content dimension is clearly the key to proper development
of an attitude measure" (Hartke, 1979, p. 585).
Herrick's "Means and End to Work" model (198la) was modified to
provide a rational basis for item subgrouping. The components of
Herrick's schemata which were retained as categories for scale items
were his requisite policies of "decentralization," "education" and
"cooperative self-interest," the operational policy of "democratiza
tion," and the working conditions of "individuation" (autonomy) and
"participation." Herrick's "human," "organizational" and "political
effectiveness," and his "human well-being" outcomes were collapsed into
two subgroups on the QWLAS, labeled "human benefits" and "economic
benefits."
Drawing from themes which emerged in the initial gathering of
attitude statements, Herrick's model was expanded by five additional
categories: "need" (for QWL's mutual benefit bargaining); "faith" (in
QWL's intentions, potential and good will); "implementation" (of QWL by
the organization and third party); "functioning" (of the QWL system
within the organization); and "general" OWL attitude.
A final grouping designated certain items from other subgroups
to be additionally classified as a "Control" subgroup. This subgroup
was believed to reflect the respondent's need for order and predict
ability, with clear definitions of where responsibilities lie and
various roles that remain separate and distinct. This hypothesized
character trait of control need was developed for later construct
validation of the QWLAS.
Table 6 presents the I1* classification groups utilized in the
construction of the original QWLAS Pilot Form. Table 7 displays spe
cific item numbers of the groupings, with the amount of positively and
negatively worded statements. These categories made up the rationally
based "subscales" of the QWLAS, which were later investigated through a
panel of judges and through statistical tests of internal consistency
and factor analysis. (Appendix E includes the subscale groupings of
the original 8*f items administered as the QWLAS Pilot Form.)
This section has reviewed the development of a rational model
for classifying items into subscales, and given the rationale for doing
so. The conceptual framework provided content validity and a theoreti
cal structure to initially explore underlying factors of OWL attitude.
The subscales also added practical utility for managing data and
discrimination amongst specific areas of QWL attitude, whether gener
ally favorable or unfavorable.
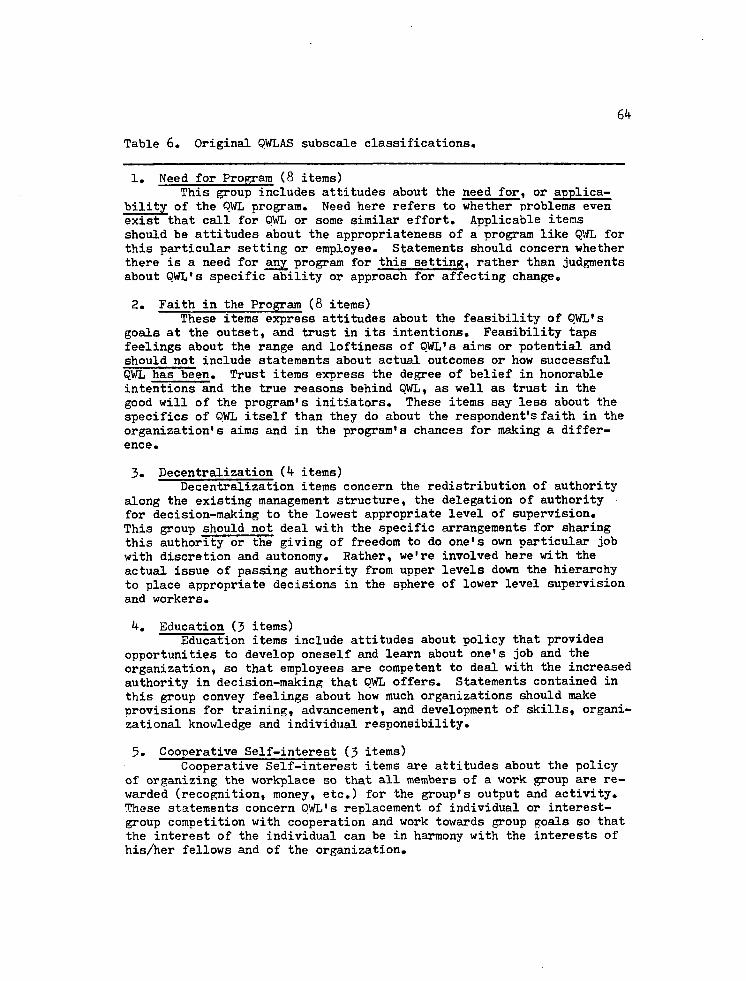
6k
Table 6. Original QWLAS subscale classifications.
1. Need for Program (8 items) This group includes attitudes about the need for, or applica
bility of the OWL program. Need here refers to whether problems even exist that call for OWL or some similar effort. Applicable items should be attitudes about the appropriateness of a program like QWL for this particular setting or employee. Statements should concern whether there is a need for any program for this setting, rather than judgments about OWL's specific ability or approach for affecting change.
2. Faith in the Program (8 items) These items express attitudes about the feasibility of OWL's
goals at the outset, and trust in its intentions. Feasibility taps feelings about the range and loftiness of OWL's ains or potential and should not include statements about actual outcomes or how successful QWL has been. Trust items express the degree of belief in honorable intentions and the true reasons behind QWL, as well as trust in the good will of the program's initiators. These items say less about the specifics of OWL itself than they do about the respondent's faith in the organization's aims and in the program's chances for making a difference.
3. Decentralization (k items) Decentralization items concern the redistribution of authority
along the existing management structure, the delegation of authority for decision-making to the lowest appropriate level of supervision. This group should not deal with the specific arrangements for sharing this authority or the giving of freedom to do one's own particular job with discretion and autonomy. Rather, we're involved here with the actual issue of passing authority from upper levels down the hierarchy to place appropriate decisions in the sphere of lower level supervision and workers.
k. Education (3 items) Education items include attitudes about policy that provides
opportunities to develop oneself and learn about one's job and the organization, so that employees are competent to deal with the increased authority in decision-making that OWL offers. Statements contained in this group convey feelings about how much organizations should make provisions for training, advancement, and development of skills, organizational knowledge and individual responsibility.
5. Cooperative Self-interest (3 items) Cooperative Self-interest items are attitudes about the policy
of organizing the workplace so that all members of a work group are rewarded (recognition, money, etc.) for the group's output and activity. These statements concern OWL's replacement of individual or interest-group competition with cooperation and work towards group goals so that the interest of the individual can be in harmony with the interests of his/her fellows and of the organization.
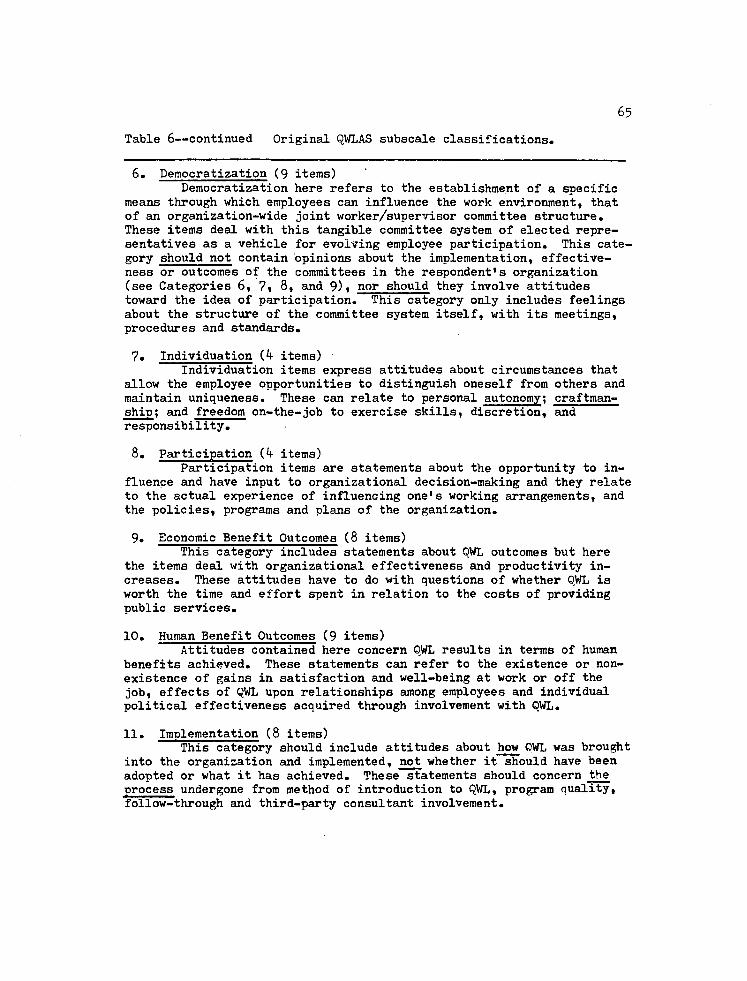
65
Table 6—continued Original QWLAS subscale classifications.
6. Democratization (9 items) Democratization here refers to the establishment of a specific
means through which employees can influence the work environment, that of an organization-wide joint worker/supervisor committee structure. These items deal with this tangible committee system of elected representatives as a vehicle for evolving employee participation. This category should not contain opinions about the implementation, effectiveness or outcomes of the committees in the respondent's organization (see Categories 6, 7, 8, and 9), nor should they involve attitudes toward the idea of participation. This category only includes feelings about the structure of the committee system itself, with its meetings, procedures and standards.
7. Individuation (4 items) Individuation items express attitudes about circumstances that
allow the employee opportunities to distinguish oneself from others and maintain uniqueness. These can relate to personal autonomy; craftman-ship; and freedom on-the-job to exercise skills, discretion, and responsibility.
8. Participation (k items) Participation items are statements about the opportunity to in
fluence and have input to organizational decision-making and they relate to the actual experience of influencing one's working arrangements, and the policies, programs and plans of the organization.
9. Economic Benefit Outcomes (8 items) This category includes statements about QWL outcomes but here
the items deal with organizational effectiveness and productivity increases. These attitudes have to do with questions of whether QWL is worth the time and effort spent in relation to the costs of providing public services.
10. Human Benefit Outcomes (9 items) Attitudes contained here concern QWL results in terms of human
benefits achieved. These statements can refer to the existence or nonexistence of gains in satisfaction and well-being at work or off the job, effects of QWL upon relationships among employees and individual political effectiveness acquired through involvement with QWL.
11. Implementation (8 items) This category should include attitudes about how OWL was brought
into the organization and implemented, not whether it should have been adopted or what it has achieved. These statements should concern the process undergone from method of introduction to QWL, program quality, follow-through and third-party consultant involvement.

Table 6—continued Original QWLAS subscale classifications.
66
12. Program Functioning (12 items) Items in this category express attitudes about how well the OWL
process is functioning and about the level of involvement assumed by the organization's members, not the merits of the QWL program itself or the results it has achieved. These opinions about the quality of OWL involvement and process in this particular setting can involve performance of QWL duties, quality of meetings and commitment of various groups to the program's success.
13- General QWL Attitude (4 items) These items are global statements of the respondent's own dis
position towards QWL as favorable or unfavorable, or his/her opinion about QWL's chances of surviving. These should not be estimates of the level of support of various groups, nor attitudes about specific aspects of OWL. Rather, these statements can refer to one's own personal commitment and intentions regarding OWL involvement.
I1** Control (7 items) Items which assess the respondent's need for order and predict
ability in the environment, with clear definitions of where responsibilities lie so that various roles are kept separate and distinct.
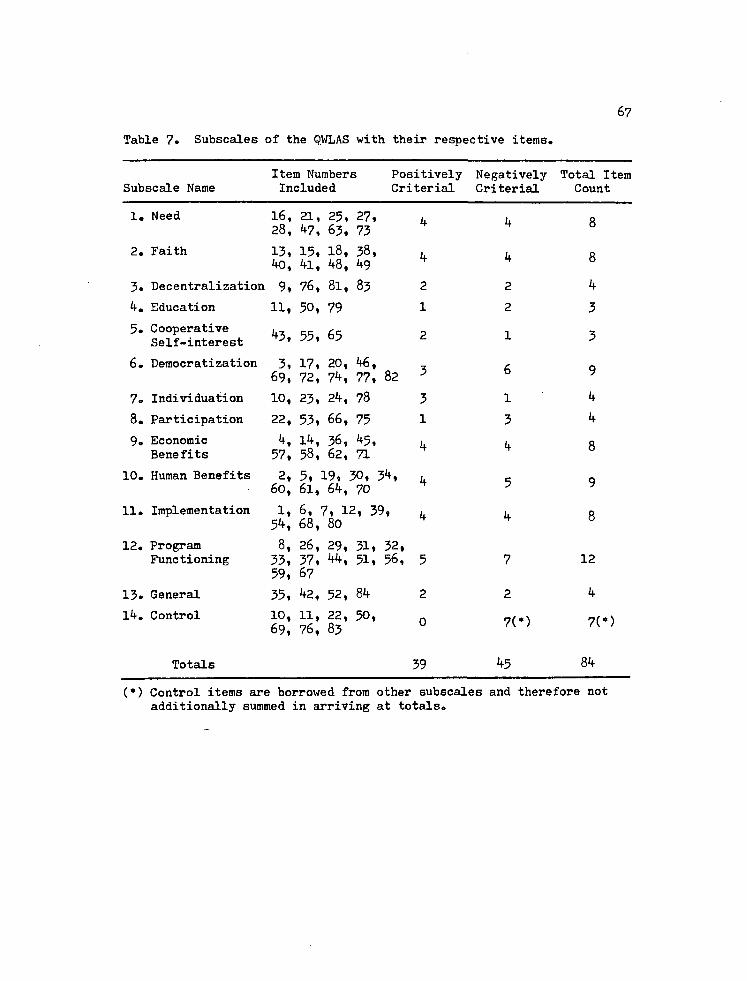
67
Table 7. Subscalee of the QWLAS with their respective items.
Item Numbers Positively Negatively Total Item Subscale Name Included Criterial Criterial Count
1. Need 16, 28,
21, 47,
25, 63,
27, 73
4 4 8
2. Faith 13, 40,
15, 41,
18, 48,
38, 49
4 4 8
3. Decentrali zation 9, 76, 81, 83 2 2 4
4. Education 11, 50, 79 1 2 3
5. Cooperative Self-interest 43, 55, 65 2 1 3
6. Democratization 3, 69,
17, 72,
20, 74, 77, 82 3 6 9
7. Individuation 10, 23, 24, 78 3 1 4
8. Participation 22, 53, 66, 75 1 3 4
9. Economic Benefits 57,
14, 58,
36, 62,
45, 71
4 4 8
10. Human Benefits 2, 60,
5, : 61,
19, : 64,
50, 34, 70
4 5 9
11. Implementation 1, 5 ,
6, ' 68,
7, 12, 39, 80
4 4 8
12. Program Functioning
8, 33, 59,
26, 37, 67
29, 44,
31, 32, 51, 56, 5 7 12
13. General 35, 42, 52, 84 2 2 4
14. Control
Totals
10, 69,
11, 76,
22, 83
50, 0
39
?(•)
45
7(*)
84
(*) Control items are borrowed from other subscales and therefore not additionally summed in arriving at totals.
Format Selection
The literature review on attitude measurement resulted in
decisions concerning the most appropriate method for collection of
attitude data, scaling technique and item formats.
Method of Data Collection. Prior to the decision to construct
an attitude scale, alternative data collection methods were considered.
The options included were: Q-methodology, which is more useful in
research on individuals (Jackson and Bidwell, 1959); card sorting,
which was deemed impractical for administration within the field setting
(Cataldo, et al., 1970); interviewing, which would not fulfill the
purposes of organization-wide assessment of attitudes; direct behavioral
observation, which would not produce a permanent, distributable instru
ment and suffers from the changes of inaccurately inferring underlying
attitudes from actions (Edwards, 1957); and the semantic differen
tial, which risks loss of interest and ambiguous interpretation of its
adjective pairs (Anderson, 1981). The attitude scale method was
selected as offering the most practical, easily-accepted and distribu
table instrument format for comparing QWL attitudes (Shaw and Wright,
1967).
Scaling Technique. The Likert method of summated ratings
(Likert, 1932) and Thurstone's (19 6) method of equal-appearing inter
vals were considered as potential scaling techniques for the study.
These have been acknowledged as the most commonly used and oldest
options (Edwards, 1957; Guilford, 195 ; Anderson, 1981). Most experts
agree that the few advances accompanying the newer, more complex

procedures offered by Guttman, Coombs, Lazarsfeld, and others do not
overshadow the elegance and effectiveness of these earlier, simpler
approaches (Remmers, 195*0.
The use of Thurstone's differentiated method, the oldest scaling
technique (Goldberg, 1955), would have demanded prior ranking of each
potential item on its degree of favorableness toward QWL by 50-100
judges drawn from the study sample. Statements with the least variance
between judgments would be retained and assigned a scale value based on
their computed median positions on an 11-point scale, indicating the
items' strength of favorability when they are endorsed (Millward, n.d.).
Final scale items would be arranged along the supposed underlying atti
tude continuum, separated from one another by equal intervals (Kerlin-
ger, 1973). The respondent would select those items with which he or
she agrees, whose scale values would then be averaged to yield the i
global attitude score.
Likert's method consists of a set of attitude statements, all
of approximately equal attitude value (either very favorable or very
unfavorable), as opposed to Thurstone's use of items all along the
agreement continuum. The respondent indicates the intensity and direc
tion of his or her attitude toward each statement by selecting from a
number of categories, typically five or seven, along a continuum from
"strongly agree" to "strongly disagree" (Kerlinger, 1973). Each cate
gory carries a weighted numerical score, which is summated with all
others or summated and averaged to produce the total scale score.
Utilizing no judges, Likert's approach involves the application
of item analysis procedures from educational test construction
70
methodology (Pidgeon and Yates, 1968) to the first set of responses.
Each item is examined for its ability to differentiate between people
with favorable attitudes and those with unfavorable attitudes. The
simplest method of item analysis is to calculate the mean value of re
sponses for each item from groups obtaining the highest and lowest total
scores, with the upper and lower ten percent, 15 percent, or 27 percent
being the common cut-offs to designate the criterion groups. State
ments which clearly discriminate between these criterion groups are
retained (Remmers, 195*0• More sensitive, complex discrimination
indices include the phi, tetrachoric and point biserial coefficients-
(Thorndike, 1978), and Cronbach's (1951) alpha coefficient of internal
consistency. Cronbach's alpha, used for this study, interrelates each
item with every other, and is based upon the notion that any item in
the scale should receive responses consistent with all other scale
statements.
Millward (n.d.) has summarized the basic steps of Likert's
techniques as including:
1. Collection of a large pool of statements reflecting an under
lying attitude toward the psychological object, which are administered
to a pilot group of at least 100 respondents;
2. Assignment of score values to each response by deciding whether
a high scale score (seven) is to reflect favorableness or unfavorable-
ness, and designation of the contingent score of seven or one, respec
tively;
3. Determination of the reliability of each item; and
k. Item selection of those which differentiate individuals with
favorable attitudes from those with unfavorable attitudes, based upon
an item analysis and internal consistence.
Thus, two features of Likert items are: (1) that they represent
either the positive or negative pole of the underlying attitude con
tinuum, and (2) that they yield responses which are consistent with the
sum total responses, as determined by significant correlation between
the statement and the total scale score (Anderson, 1981).
The Likert technique was selected over the Thurstone method
because the former is typically viewed as less laborious, easier for
developing suitable items (Anderson, 1981; Hall, 193*0, most useful and
adaptable in behavioral research (Kerlinger, 1973; Lemon, 1973), and
not necessitating the use of judges. The Likert and more burdensome
Thurstone technique correlate highly, producing similar results (Ker
linger, 1973). Each has reliabilities typically in the .80's (Thurstone,
19 6), but Likert scales generally lead to scores with a slightly higher
reliability for fewer items (Guilford, 195*0 • Finally, the Likert
approach was favored for its rapidity of scoring (Napior, 1972) and its
provision of an intensity response, which indicates the degree of
agreement or disagreement with each statement.
Item Format. The item format for statements was, as is always
the case, dictated by the scaling method. Items were formulated so as
to conform to the Likert format of expressing attitudes at either
pole of the attitude continuum, with a range of optional responses for
each item.

72
Every item initially had a "paired opposite," a counterpart that
was simply reversed in wording, requiring an opposite direction of re
sponse to express the same opinion (i.e., "I like QWL" and "I dislike
QWL"). This practice was intended to remove two types of bias in which
response selection is based upon influences other than item content.
Position bias is based upon the positioning that the selected response
category has on the page (right, left, or center) and yeasaying-
naysaying bias occurs when the statement is given automatic agreement
or disagreement (Cataldo, et al., 1967). The use of a paired opposite
for every item was abandoned because this method led to an inappropri
ately large (200) item pool. Also, there is little statistical evi
dence that paired opposites actually provide opposite meanings or
prevent response bias (Sabers, personal communication, 1981).
A simpler, more popular deterrent to response set bias was
adopted (Scott, 1968), the formulation of both favorable and unfavor
able attitude statements, without devising an exact paired opposite for
each item. A pool of items was produced with 39 positively criterial
and J+5 negatively criterial statements. The Pilot Form length was
decreased by one-half, and response bias was satisfactorily prevented.
Positively criterial items were worded so that an individual highly
favorable toward QWL would respond with the lowest weight category,
"Strongly Agree." The negatively criterial items would require the
same QWL-enthusiast to respond with the highest weight category,
"Strongly Disagree," as exemplified below.
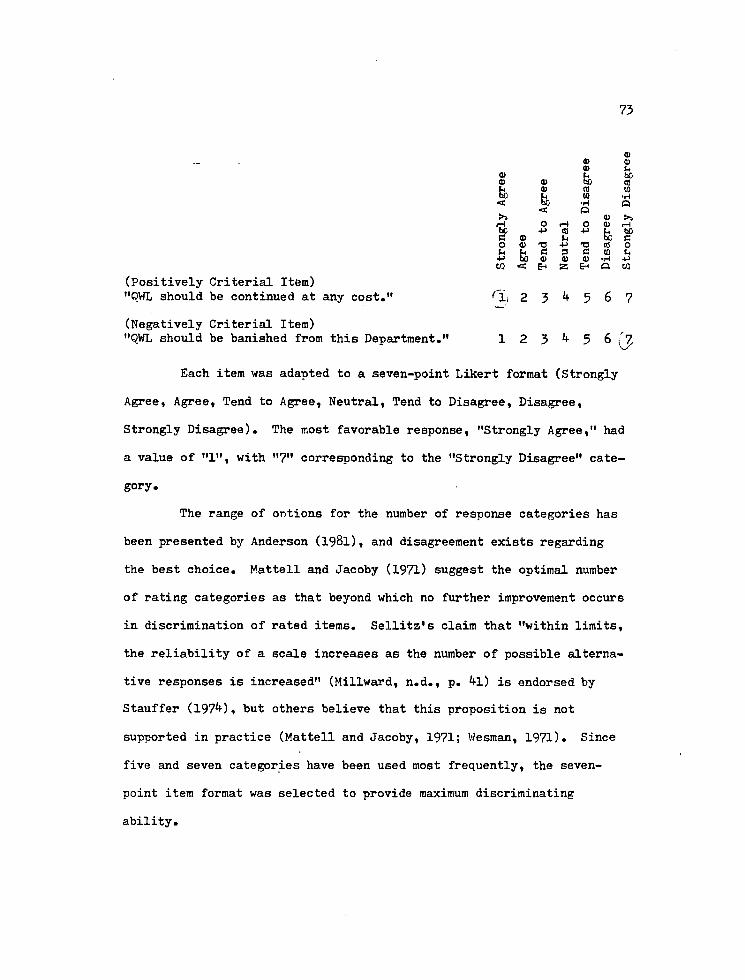
73
a> «J <D a> 0) t, 60
a) a) ho as U 0> tfl 10 S> b (0 -H < ho -H a
<c Q >5 <D f>> I—( O pH O fl> rH he -P a) -P h bO c e u E c c o a) « +> t3 (0 o U £ C 3 c 10 u *> ho 4) <a <u -H -p W < E-I Z EH O W
(Positively Criterial Item) "OWL should be continued at any cost." 2 3 k 5 6 7
(Negatively Criterial Item) "QWL should be banished from this Department." 1 2 3 4 5 6 (j,
Each item was adapted to a seven-point Likert format (Strongly
Agree, Agree, Tend to Agree, Neutral, Tend to Disagree, Disagree,
Strongly Disagree). The most favorable response, "Strongly Agree," had
a value of "1", with "7" corresponding to the "Strongly Disagree" cate
gory.
The range of options for the number of response categories has
been presented by Anderson (1981), and disagreement exists regarding
the best choice. Mattell and Jacoby (1971) suggest the optimal number
of rating categories as that beyond which no further improvement occurs
in discrimination of rated items. Sellitz's claim that "within limits,
the reliability of a scale increases as the number of possible alterna
tive responses is increased" (Millward, n.d., p. 1) is endorsed by
Stauffer (197*0, but others believe that this proposition is not
supported in practice (Mattell and Jacoby, 1971; Wesman, 1971). Since
five and seven categories have been used most frequently, the seven-
point item format was selected to provide maximum discriminating
ability.
7*+
Item Writing and Editing
Wesman (1971) reviews studies pertaining to item writing, com
menting about the role of later item analysis in deleting poor and
ambiguous items. He cautions that "item analysis in no way lessens the
skill and care requisite in the original item writing" (Wesman, 1971,
p. 8l). Writers like Ebel (1951)1 Shaw and Wright (1967) and Kerlinger
(1973) offer guidelines for proper writing of attitude statements, and
Edwards' (1957) popular summarization draws together the work of the
most prominent test developers. Items chosen to comprise the OWL AS
Pilot Form were filtered through Edwards' criteria for item-writing,
and were subsequently subjected to editing for clarity, style and
brevity.
Writing. This initial writing followed Edwards' (1957, pp. 13-
1k) requirements for each item to be non-factual, or it might be
accepted equally by respondents favorably and unfavorably inclined
toward OWL; short and to-the-point; unambiguous, so that response is
clearly a statement about one's OWL attitude; clear of any "double
barrel" phrasing about more than one issue per item; simple, clear and
direct in its language; free of universal attitudes likely to be
accepted or rejected by all; devoid of double negatives or complex sen
tences; and free of words like "no", "never", "always", and "all."
First Draft Check. Revisions were made based upon feedback
elicited from experts, regarding the items' representativeness of the
range of potential OWL attitudes and their fulfillment of criteria for
adequate wording. The panel consisted of a professor of Educational
Psychology who is expert in measurement, the principle OWL consultant
who is expert in OWL substantive areas, and an MBA student having exten
sive contact with OWL committee members. The edited items were then
categorized into their respective subscales and forwarded to a second
panel consisting of ten judges. Although their input primarily re- -
volved around the content validation sorting described below, further
input on proper wording was solicited.
Content Validity Sorting by Judges
While confirmatory factor analysis provided tests to verify the
rationally based grouping of items into subscales, a panel of judges
sorted the items by content, further assuring a substantial, represen
tative body of inventory content.
Panel Selection. Four judges, expert in QWL concepts and pro
cesses, included the principle QWL consultant, the Pima County Depart
ment of Transportation O.WL Coordinator and two graduate students
involved in the QWL project. Six "non-expert" judges consisted of two
MBA students, a Ph.D. candidate in Counseling and Guidance, a Ph.D.
candidate in Clinical Psychology, a professor of Counseling and Guidance
and the study's computer programmer.
Material Preparation. Instructions described OWL, explained
the subscale definitions and gave criteria for item classification
(see Appendix F). A shuffled deck of cards, each one displaying one of
the pilot statements, was provided with a labeled envelope for each
subscale. Judges were also asked to evaluate item ambiguity by circling
each as "favorable," "unfavorable," or "undecided," depending upon which
76
disposition it appeared to reflect toward OWL. Finally, input was
invited from judges regarding wording and clarity.
Results and Revisions. Frequencies and percentages were figured
on tally sheets and decisions were made about item inclusion and re
visions based on Kahn's (1951) 70 percent criterion of consensus of
agreement among judges. This sorting decreased ambiguity and increased
content validity. Forty-three items underwent revisions, because only
five subscales showed 70 percent consensus. Factor analysis was later
used to again explore subscale groupings.
Questionnaire Design
The 8*+ finalized items which comprised the OWLAS Pilot Form were
put in random order and printed, along with biographical data and other
items discussed below. Appendix G presents the QWLAS Pilot Form as
administered in the Pima County Department of Transportation, with the
addition of asterisks here to indicate items which were scored in
reverse.
Randomizing Item Order. The 8k Likert items, upon feedback and
final revisions, were randomly drawn from a hat to determine their
order on the Pilot Form. A cross-reference list indicated each item's
number as it appeared upon the Scale and its sequencing on a master
list of items by subscale groupings (see Appendices H and I). The
random ordering spread items of similar focus throughout the scale and
served as a check on "honesty of efforts" (Kahn, 1951), since negatively
and positively criterial items were interspersed. It was hoped that
randomization would lower "fakeability" (Scott and Rohrbach, 1977) and
"social desirability" of responses (Anderson, 1981).
Enlistment of Support Services. During instrument design, it
was necessary to contract the services of a statistician, computer pro
grammer, key puncher, and typist. They saw the Scale before it was
reproduced, in order to provide relevant input, such as optimal data
formatting for key punching and necessary statistical planning.
Additional Non-Likert Items. The non-Likert items of the Scale
were written or used from other sources. Reddin*s (1970) nine-point
continuum was utilized as a self-rating by respondents (Item 93) of
their overall attitude toward OWL, referred to as the Change Acceptance
Scale (CAS), and shown as Figure 1 below. The CAS was later used as an
index to explore the concurrent validity of the QWLAS by correlating
the two measures. Additional bio-data items (9 -102) elicited informa
tion on respondents' sex, age, education, ethnicity, job classification,
and OWL status (see Appendix G). Finally, "Gap-score" items (85-92)
were intended to determine the difference between a respondent's per
ception of desired and actual levels of autonomy and participation at
the workplace.
Attitude Scale Format and Finalization. Finalization of the
design of the QWLAS Pilot Form included writing the general instructions
and directions for specific items, choosing wording for response cate
gories, arranging the graphics of the instrument, and determining paper
color, print size, and procedures for duplication (see Appendix G).
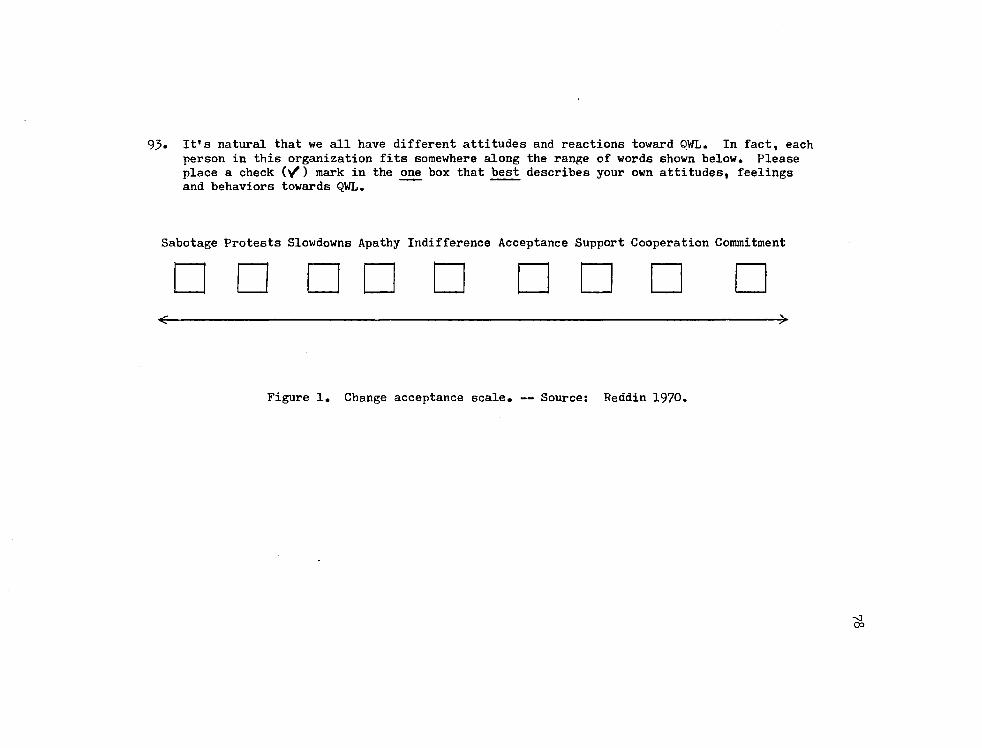
93. It's natural that we all have different attitudes and reactions toward OWL. In fact, each person in this organization fits somewhere along the range of words shown below. Please place a check {>/) mark in the one box that best describes your own attitudes, feelings and behaviors towards QWL.
Sabotage Protests Slowdowns Apathy Indifference Acceptance Support Cooperation Commitment
• • • • •
Figure 1. Change acceptance scale. — Source: Reddin 1970.
79
Scale Administration
Field testing occurred in a second wave of five meetings with
employees for half of the Department (Divisions of Administrative Ser
vices, Planning and Programming, Traffic Engineering and Design Engi
neering) and through distribution by QWL representatives and supervisors
for the other half.
Those 10 employees in the above-mentioned Divisions were briefed
on the importance of systematic QWL attitude assessment, informed of
the purposes of the research, and assured of the project's anonymity and
voluntary nature. Following questions, the instrument was distributed
and completed by willing individuals, with each respondent being thanked
for his or her cooperation. The 8l subjects returning the QWLAS Pilot
Form in these meetings were distributed by Division in the manner
reported in Chapter k.
The 15*+ employees in the Division of Operations were dissemi
nated the QWLAS through their supervisors or elected QWL representatives,
with 85 subjects returning the questionnaire. A briefing on the pur
poses and rationale of the study was presented to this division's 26
QWL participants at one of their QWL meetings, and each committee member
agreed to deliver enough QWLAS forms to his or her work unit. Finally,
the inventories were distributed to the 45 Field Engineering employees
through their supervisors, and 13 subjects completed the instrument.
Evaluation
The QWLAS was evaluated by examining the data in terms of
general scale characteristics and frequency distributions, attitude

factors which were tapped by item groupings, item analysis and internal
consistency evidence on the discriminating power and interrelation of
items, reliability evidence, and validity evidence. The statistical
treatments used to analyze the observations will be presented and dis
cussed in the next chapter.
Summary
This chapter has presented the methods used in conducting the
study through the data collection stage, detailing the procedural steps
taken in the development of the QWLAS up to the point of Pilot testing.
CHAPTER k
RESULTS AND DISCUSSION
The purpose of this study was to construct and field test a
standardized instrument for assessing the attitudes of employees toward
a public sector Quality of Working Life program. This chapter reports
the results of statistical procedures performed upon the inventory data
and evaluates the Quality of Working Life Attitude Scale (QWLAS).
Results from field testing of the QWLAS are addressed from the perspec
tives of the Scale's general characteristics, the factor structure of
the instrument, item analysis and selection of a final QWLAS Long Form
and Short Form, and appropriate reliability and validity evidence.
Statistical treatments utilized the Statistical Package for the Social
Sciences (SPSS), edited by Nie and Hull (1975).
General Results
Sample
A total of 179 people, 59 percent of the Department of Trans
portation, returned the S -item QWLAS Pilot Form. The 35-minute average
administration time is based upon the 8l respondents completing the
inventory during meetings, and is assumed to be similar for the 98 sub
jects from the Divisions of Operations and Field Engineering, who
completed the Scale on an individual basis.
81
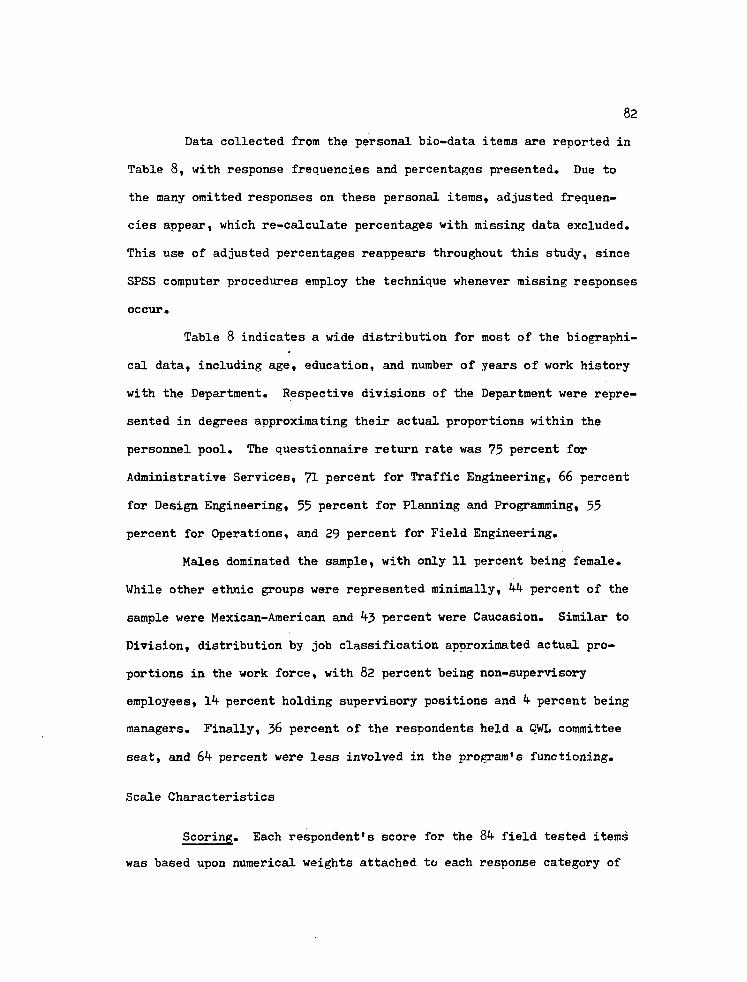
Data collected from the personal bio-data items are reported in
Table 8, with response frequencies and percentages presented. Due to
the many omitted responses on these personal items, adjusted frequen
cies appear, which re-calculate percentages with missing data excluded.
This use of adjusted percentages reappears throughout this study, since
SPSS computer procedures employ the technique whenever missing responses
occur.
Table 8 indicates a wide distribution for most of the biographi
cal data, including age, education, and number of years of work history
with the Department. Respective divisions of the Department were repre
sented in degrees approximating their actual proportions within the
personnel pool. The questionnaire return rate was 75 percent for
Administrative Services, 71 percent for Traffic Engineering, 66 percent
for Design Engineering, 55 percent for Planning and Programming, 55
percent for Operations, and 29 percent for Field Engineering.
Males dominated the sample, with only 11 percent being female.
While other ethnic groups were represented minimally, Mf percent of the
sample were Mexican-American and 43 percent were Caucasion. Similar to
Division, distribution by job classification approximated actual pro
portions in the work force, with 82 percent being non-supervisory
employees, 14 percent holding supervisory positions and k percent being
managers. Finally, 36 percent of the respondents held a OWL committee
seat, and 64 percent were less involved in the program's functioning.
Scale Characteristics
Scoring. Each respondent's score for the 84 field tested items
was based upon numerical weights attached to each response category of
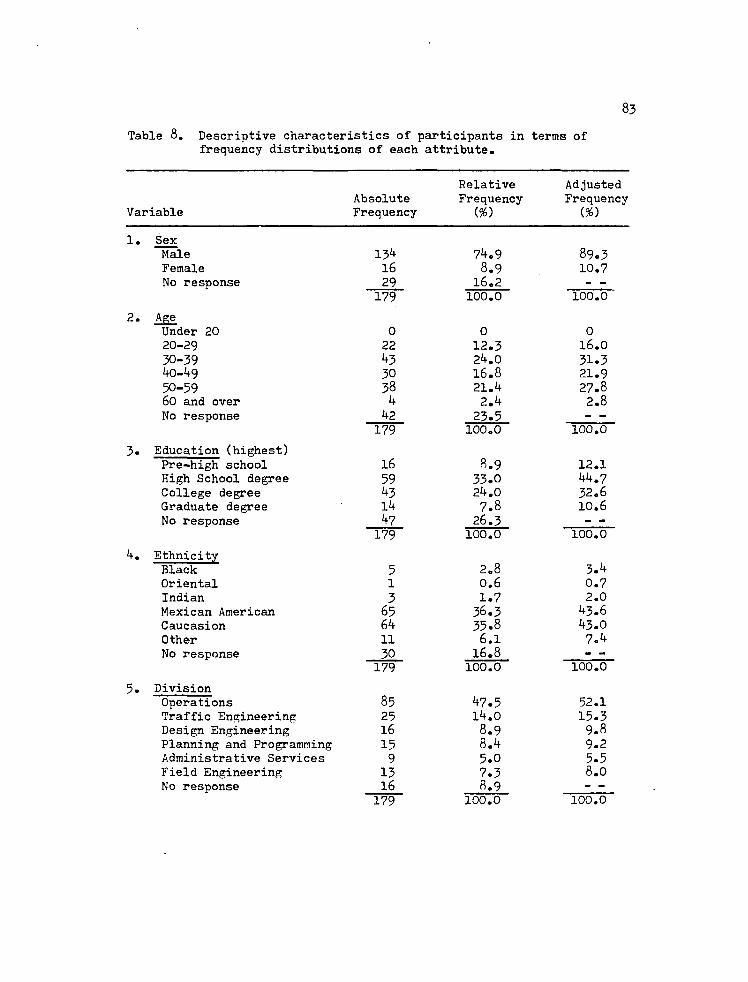
83
Table 8. Descriptive characteristics of participants in terms of frequency distributions of each attribute.
Relative Adjusted Absolute Frequency Frequency
Variable Frequency (#> (#)
1. Sex Male 134 74.9 89.3 Female 16 8.9 10.7 No response 29 16.2 - -
179 100.0 100.0
2. Age Under 20 0 0 0 20-29 22 12.3 16.0 30-39 43 24.0 31.3 40-49 30 16.8 21.9 50-59 38 21.4 27.8 60 and over 4 2.b 2.8 No response 42 23.5
179 100.0 100.0
3. Education (highest) Pre-high school 16 8.9 12.1 High School degree 59 33.0 bb.7 College degree 43 24.0 32.6 Graduate degree lb 7.8 10.6 No response b? 26.3
179 100.0 100.0
4. Ethnicity Black 5 2.8 3.4 Oriental 1 0.6 0.7 Indian 3 1.7 2.0 Mexican American 65 36.3 43.6 Caucasion 64 35.8 43.0 Other 11 6.1 7.4 No response 30 16.8
179 100.0 100.0
5. Division Operations 85 47.5 52.1 Traffic Engineering 25 lb.0 15.3 Design Engineering 16 8.9 9.8 Planning and Programming 15 8.4 9.2 Administrative Services 9 5.0 5.5 Field Engineering 13 7.3 8.0 No response 16 8.9 - -
179 100.0 100.0
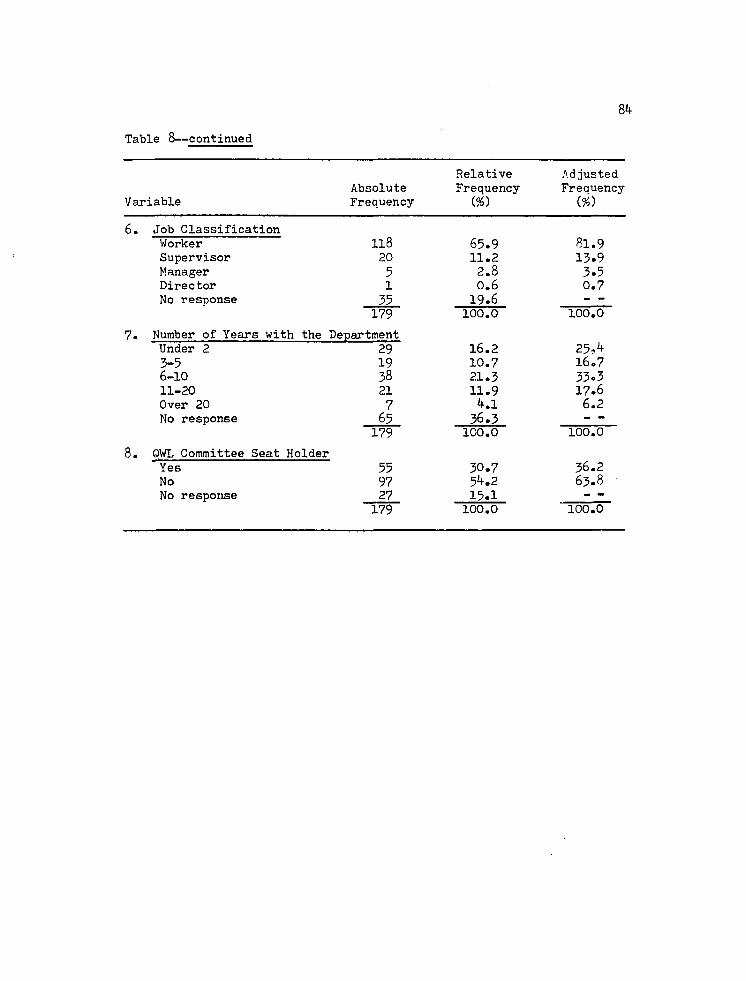
84
Table 8—continued
Variable Absolute Frequency
Relative Frequency
(9S)
Adjusted Frequency {%)
6. Job Classification Worker ll8 Supervisor 20 Manager 5 Director 1 No response 35
179
7. Number of Years with the Department Under 2 29 3-5 19 6-10 38 11-20 21 Over 20 7 No response 65
179
8. OWL Committee Seat Holder Yes 55 No 97 No response 27
179
65.9 11.2 2.8 0.6
19.6 100.0
16.2 10.7 21.3 11.9 4.1 36.3 100.0
30.7 54.2 15.1 100.0
81.9 13.9 3.5 0.7
100.0
25-4 16.7 33.3 17.6
6.2
100.0
36.2 63.8
100.0
Strongly Agree, Agree, Tend to Agree, Neutral, Tend to Disagree, Dis
agree, and Strongly Disagree, where a low weight of 1 indicated the most
favorable attitude expressed toward a particular QWL statement. After
reversing the numerical weights ranging from 7 to 1 for those 45 items
which were negatively criterial, a subject's item score was equal to
the value of the response category selected. Subscale and Global scores
were obtained by adding all item response values together and dividing
by the number of valid items. Rather than merely using a pooled score,
this averaging of summated ratings to yield a 1 to 7 metric for sub-
scale and Global scale scores resulted in greater consistency with the
score report format for individual items, and a clearer relationship to
the underlying attitude continuum.
Range of Scores. The range of possible pooled scores for a re
spondent was between 84 (if the subject chose the most favorable
response to every item) and 588 (if the subject chose the most unfavor
able response to each item). The sample yielded total scores ranging
between 152 and 588, covering 86 percent of the potential score range.
Averaging each pooled score to yield the 1-7 continuum, corresponding to
the item categories, resulted in Global scores from 1.82 to 7»00.
Table 9 reveals that 23 percent of these composite averaged
scores fell between 1.0 and 3®46, 59 percent between 3.51 and 4.49, and
l8 percent between 4.51 and 7.00. The responses were therefore dis
tributed with a slight skew toward the favorable end, while approaching
a normal curve and demonstrating adequate range. Appendix J presents
the mean and standard deviation for each of the 84 items, as well as
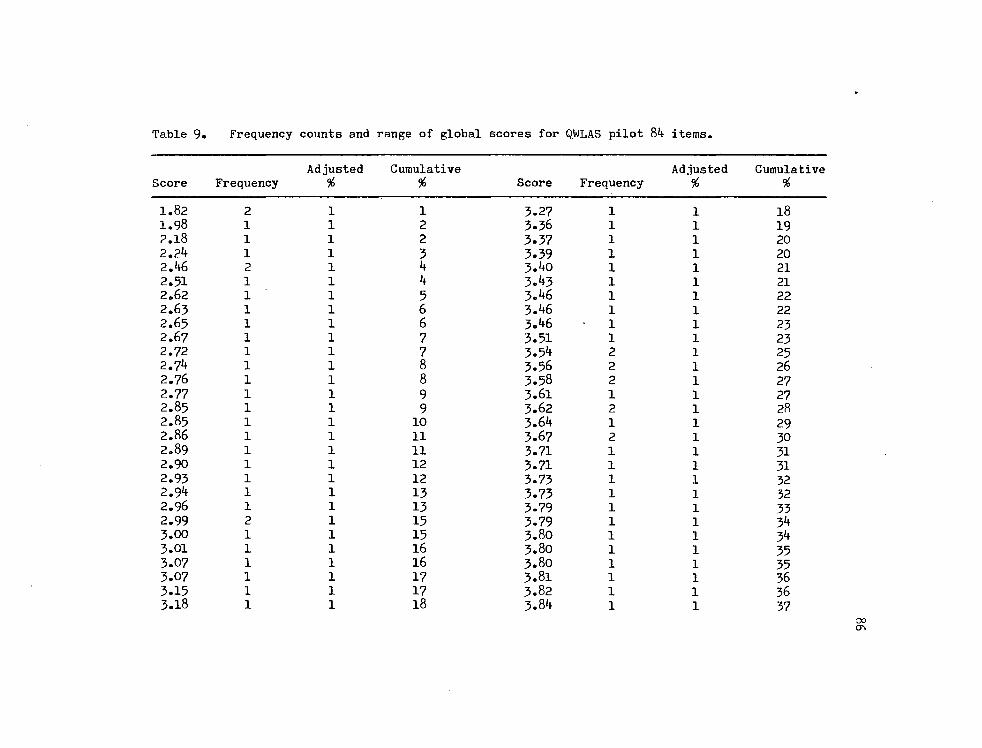
Table 9. Frequency counts and range of globeil scores for QWLAS pilot 84 items.
Adjusted Cumulative Adjusted Cumulative Score Frequency % % Score Frequency 0/ 70 %
1.82 2 1 1 3.27 1 1 18 1.98 1 1 2 3.36 1 1 19 ?.l8 1 1 2 3.37 1 1 20 2.24 1 1 3 3.39 1 1 20 2.46 1 4 3.40 1 1 21 2.51 1 1 4 3. 3 1 1 21 2.62 1 1 5 3. 6 1 1 22 2.63 1 1 6 3.46 1 1 22 2.65 1 1 6 3.46 1 23 2.6? 1 1 7 3.51 1 1 23 2.72 1 1 7 3.54 2 1 25 2.7 1 1 8 3.56 2 1 26 2.76 1 1 8 3.58 2 1 27 2.77 1 1 9 3.61 1 1 27 2.85 1 1 9 3.62 2 1 28 2.85 1 1 10 3.64 1 1 29 2.86 1 1 11 3.67 2 1 30 2.89 1 1 11 3.71 1 1 31 2.90 1 1 12 3.71 1 1 31 2.93 1 1 12 3.73 1 1 32 2.94 1 1 13 3.73 1 1 32 2.96 1 1 13 3.79 1 1 33 2.99 1 15 3.79 1 1 34 3.00 1 1 15 3.80 1 1 34 3.01 1 1 16 3.80 1 1 35 3.07 1 1 16 3.80 1 1 35 3.07 1 1 17 3.81 1 1 36 3.15 1 1 17 3.82 1 1 36 3.18 1 1 18 3.84 1 1 37
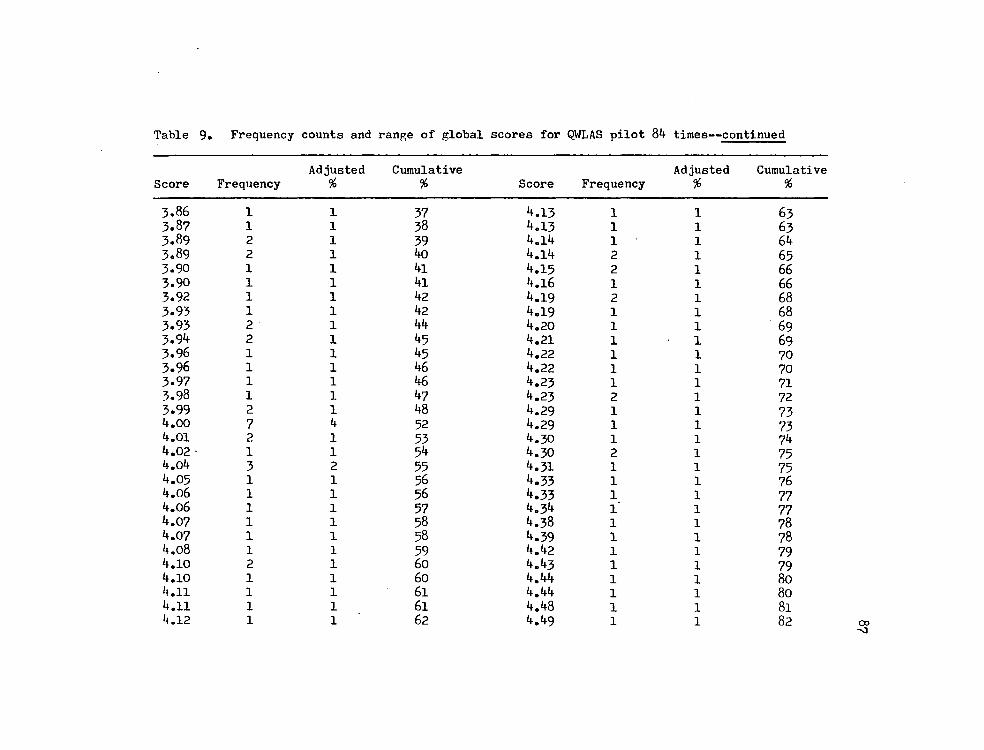
Table 9. Frequency counts and range of global scores for QWLAS pilot 8'f times—continued
Score Frequency Adjusted %
Cumulative % Score Frequency
Adjusted %
Cumulative %
3.86 1 1 37 4.13 1 1 63 3.87 1 1 38 4.13 1 1 63 3.89 2 1 39 4.14 1 1 64 3.89 2 1 40 4.14 2 1 65 3.90 1 1 41 4.15 2 1 66 3.90 1 1 41 4.16 1 1 66 3.92 1 1 42 4.19 2 1 68 3.93 1 1 42 4.19 1 1 68 3.93 2 1 44 4.20 1 1 69 3.9*+ 2 1 45 4.21 1 1 69 3.96 1 1 45 4.22 1 1 70 3.96 1 1 46 4.22 1 1 70 3.97 1 1 46 4.23 1 1 71 3.98 1 1 47 4.23 2 1 72 3.99 2 1 48 4.29 1 1 73 4.00 7 4 52 4.29 1 1 73 01 2 1 53 4.30 1 1 74
4.02 • 1 1 54 4.30 2 1 75 4.o4 3 55 4.31 1 1 75 4.05 1 1 56 4.33 1 1 76 4.06 1 1 56 4.33 1 1 77 4.06 1 1 57 4.34 1 1 77 4.07 1 1 58 4.38 1 1 78 4.07 1 1 58 4.39 1 1 78 4.08 1 1 59 4.42 1 1 79 4.10 2 1 60 4.43 1 1 79 4.10 1 1 60 4.44 1 1 80 4.11 1 1 61 4.44 1 1 80 4.11 1 1 61 4.48 1 1 81 4.12 1 1 62 4.49 1 1 82
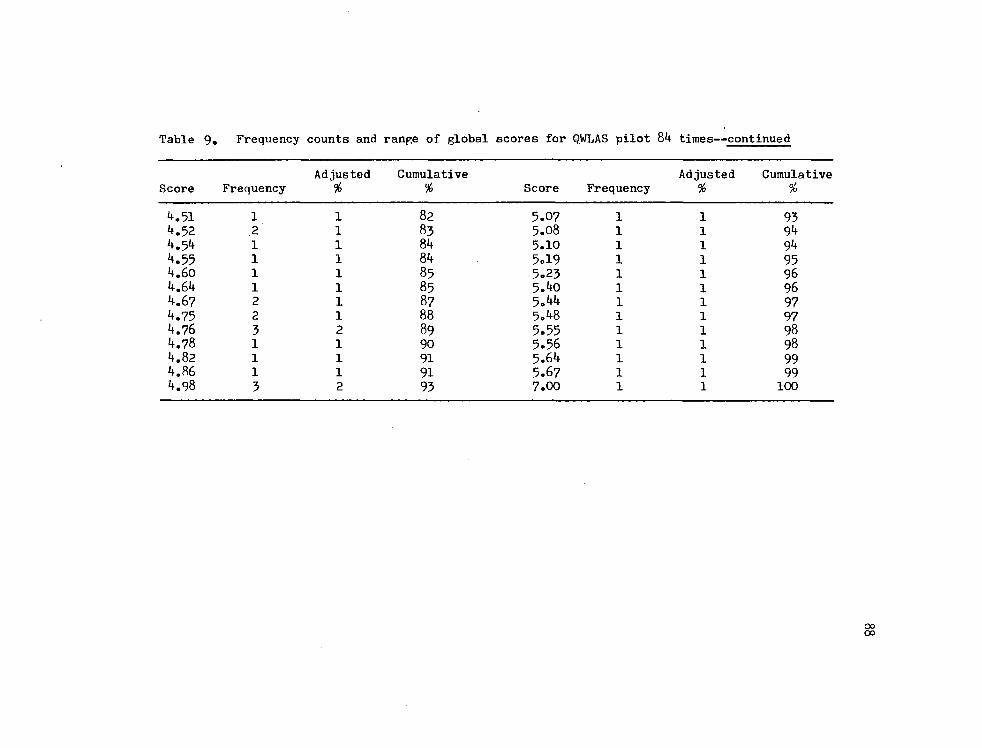
Table 9. Frequency counts and range of global scores for QWLAS pilot 84 times—continued
Score Frequency Adjusted %
Cumulative % Score Frequency
Adjusted %
Cumulative %
4.51 1 1 82 5.07 1 1 93 4.52 z 1 83 5.08 1 1 94 4.54 1 1 84 5.10 1 1 94 4.55 1 1 84 5.19 1 1 95 4.60 1 1 85 5.23 1 1 96 4.64 1 1 85 5.40 1 1 96 4.67 2 1 87 5.44 1 1 97 4.75 2 1 88 5.48 1 1 97 4.76 3 89 5.55 1 1 98 4.78 1 1 90 5.56 1 1 98 4.82 1 1 91 5.64 1 1 99 4.86 1 1 91 5.6? 1 1 99 4.98 3 2 93 7.00 1 1 100
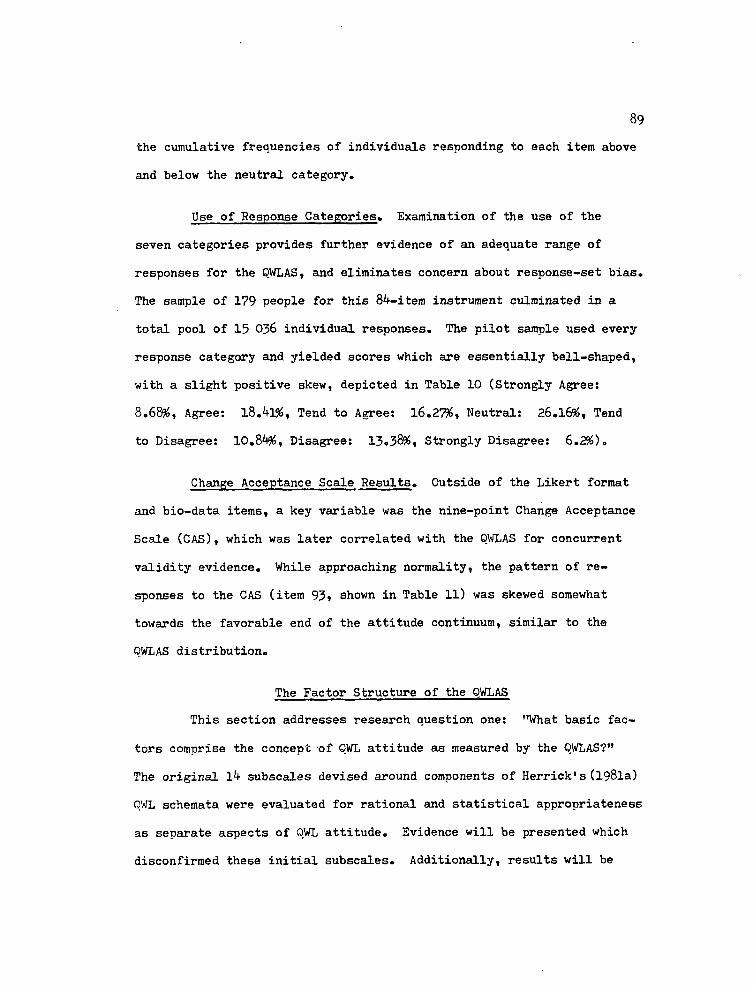
89
the cumulative frequencies of individuals responding to each item above
and below the neutral category.
Use of Response Categories. Examination of the use of the
seven categories provides further evidence of an adequate range of
responses for the QWLAS, and eliminates concern about response-set bias.
The sample of 179 people for this 84-item instrument culminated in a
total pool of 15 036 individual responses. The pilot sample used every
response category and yielded scores which are essentially bell-shaped,
with a slight positive skew, depicted in Table 10 (Strongly Agree:
8.68$, Agree: 18.41$, Tend to Agree: 16.27$, Neutral: 26.1 6$, Tend
to Disagree: 10.84$, Disagree: 13.38$, Strongly Disagree: 6.296),
Change Acceptance Scale Results. Outside of the Likert format
and bio-data items, a key variable was the nine-point Change Acceptance
Scale (CAS), which was later correlated with the QWLAS for concurrent
validity evidence. While approaching normality, the pattern of re
sponses to the CAS (item 93» shown in Table 11) was skewed somewhat
towards the favorable end of the attitude continuum, similar to the
QWLAS distribution.
The Factor Structure of the QWLAS
This section addresses research question one: "What basic fac
tors comprise the concept of OWL attitude as measured by the QWLAS?"
The original 14 subscales devised around components of Herrick's (198la)
OWL schemata were evaluated for rational and statistical appropriateness
as separate aspects of OWL attitude. Evidence will be presented which
disconfirmed these initial subscales. Additionally, results will be
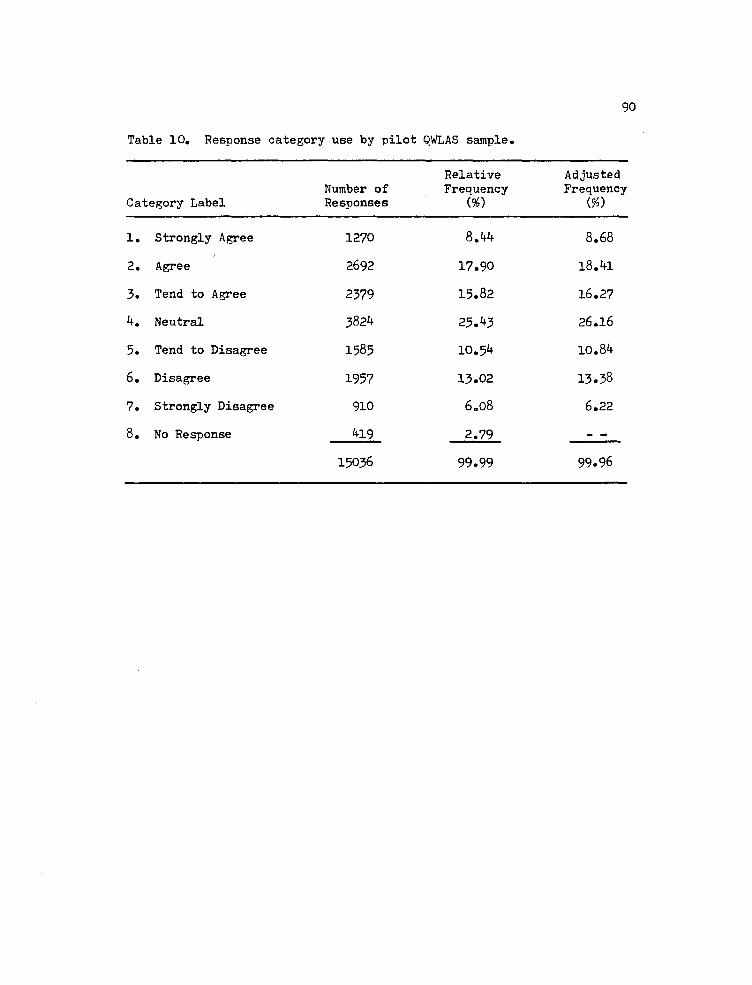
Table 10. Response category use by pilot QWLAS sample.
90
Relative Adjusted Number of Frequency Frequency
Category Label Responses (.%) (90
1. Strongly Agree 1270 8.M+ 8.68
2. Agree 2692 17.90 18.i+l
3. Tend to Agree 2379 15.82 16.27
b. Neutral 3824 25. 3 26.16
5. Tend to Disagree 1585 10.51+ 10.81*
6. Disagree 1957 13.02 13.38
7. Strongly Disagree 910 6.08 6.22
8. No Response 19 2.79 - -
15036 99.99 99.96
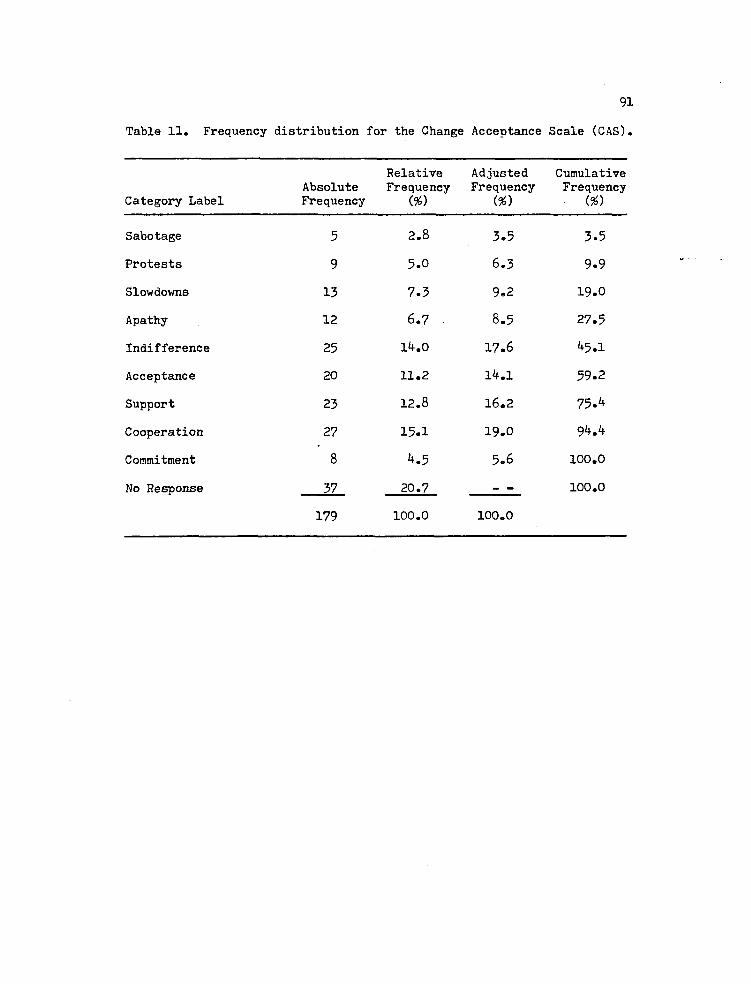
Table 11. Frequency distribution for the Change Acceptance Scale (CAS).
Relative Adjusted Cumulative Absolute Frequency Frequency Frequency
Category Label Frequency (%) {%) {%)
Sabotage 5 2.8 3.5 3.5
Protests 9 5.0 6.3 9.9
Slowdowns 13 7.3 9.2 19.0
Apathy 12 6.7 8.5 27.5
Indifference 25 14.0 17.6 45.1
Acceptance 20 11.2 14.1 59.2
Support 23 12.8 16.2 75.4
Cooperation 27 15.1 19.0 94.4
Commitment 8 4.5 5.6 100.0
No Response 37 20.7 — 100.0
179 100.0 100.0
92
reported from the exploratory factor analysis which revealed two other
factors determining most of the variance in individuals' responses to
the QWLAS.
Initial Investigation of Original Subscales
Criteria used in evaluating the original subscales included
requirements that they: (1) possess a logical and utilitarian basis;
(2) show considerable internal consistency; and (3) demonstrate reason
able separateness from one another as statistically independent
entities. Whereas development of the QWLAS was made more systematic
through the use of these initial subscales for item classification and
their use led to a more representative sampling of the content domain,
subsequent data treatment did not support their being retained in the
final instrument.
Logical and Utilitarian Base. The 1 subscales offered a theo
retical structure and increased the content validity of the QWLAS. It
was believed that separate score reports for each cluster of
conceptually-related items would be more meaningful and manageable than
one Global score or, at the other extreme, 81* separate item scores.
Subscales designed to be relevant to distinct components of a
OWL program would hopefully prove utilitarian to program consultants
wishing to assess reactions to a specific aspect of the change effort.
Orientation emphasis might be influenced by subscales targeting "need"
for QWL or "faith" in its intentions and goals, modifications in the
system might be suggested by employees' attitudes toward the
93
"democratization" committee structures, and follow-up training might be
shaped by data from "implementation" and "functioning" subscales.
These desirable features of the subscales could be realized only
if the item groupings fit together rationally, so that interpretation
could be meaningful. While there was a rationalization for assigning
each of the 8k items into its respective subscale, interjudge consensus
of agreement in sorting items was only moderate. The percentage of
agreement for each of the subscale groupings of items from sorting by
ten judges appears in Table 12. Agreement ranged from ko to 85 percent
with five of the 13 subscales (the "control" subscale was omitted)
surpassing Kahn's (1951) 70 percent criterion, and the average consensus
being 6l percent.
Based upon the questionable performance of the subscale clus
ters, item revisions and subscale reassignments were made for k$ of the
8k field-tested items. The rationally determined subscales were re
tained for further examination through confirmatory factor analysis and
the additional procedures outlined below.
Homogeneity and Reliability of Original Subscales. The utili
zation of separate subscales requires homogeneity of each group of
items, illustrating the degree to which items in a particular subscale
"hang together" and seem to be measuring the same thing (Shaw and
Wright, 1967). Accordingly, internal consistency estimates of the
reliabilities for each subscale attested to its level of homogeneity.
Cronbach's (1951) coefficient alpha was used for determining internal
consistency.
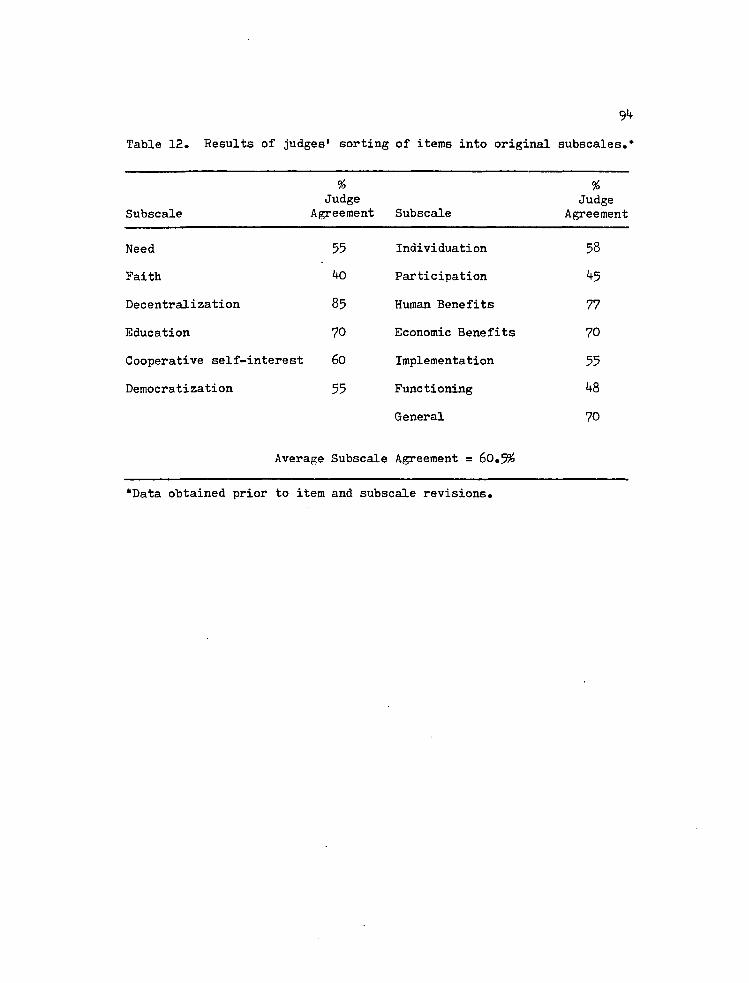
Table 12. Results of judges' sorting of items into original subscales.*
% % Judge Judge
Subscale Agreement Subscale Agreement
Need 55 Individuation 58
Faith ko Participation k5
Decentralization 85 Human Benefits 77
Education 70 Economic Benefits 70
Cooperative self-interest 60 Implementation 55
Democratization 55 Functioning 48
General 70
Average Subscale Agreement = 60.5#
*Data obtained prior to item and subscale revisions.
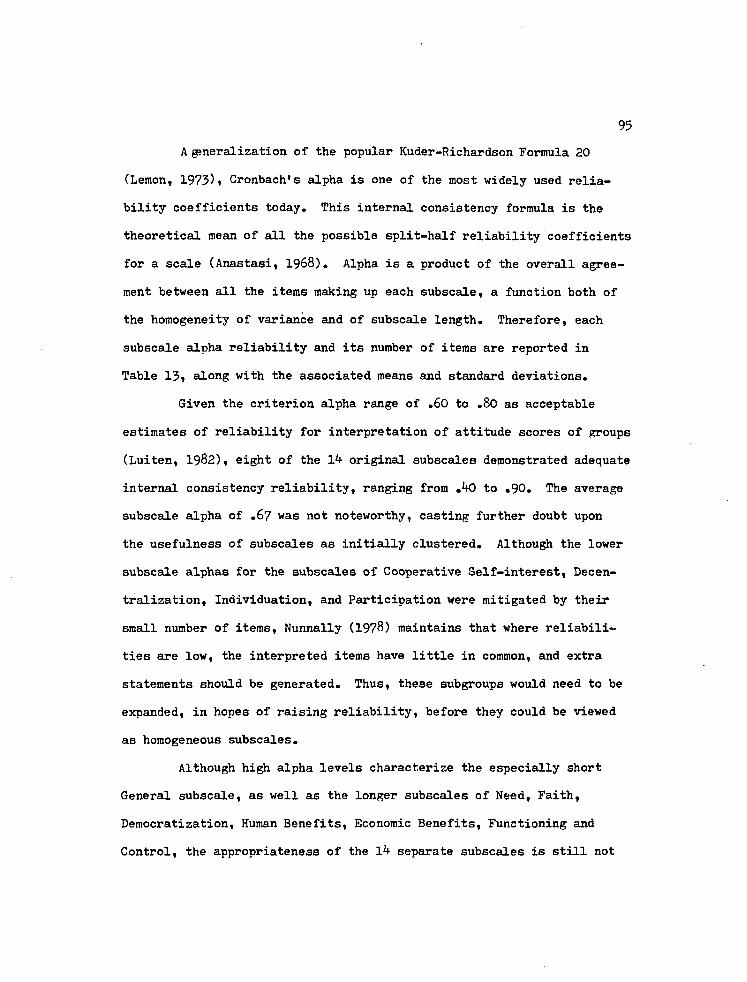
A(eneralization of the popular Kuder-Richardson Formula 20
(Lemon, 1973)t Cronbach's alpha is one of the most widely used relia
bility coefficients today. This internal consistency formula is the
theoretical mean of all the possible split-half reliability coefficients
for a scale (Anastasi, 1968). Alpha is a product of the overall agree
ment between all the items making up each subscale, a function both of
the homogeneity of variance and of subscale length. Therefore, each
subscale alpha reliability and its number of items are reported in
Table 13» along with the associated means and standard deviations.
Given the criterion alpha range of .60 to .80 as acceptable
estimates of reliability for interpretation of attitude scores of groups
(Luiten, 1982), eight of the 14 original subscales demonstrated adequate
internal consistency reliability, ranging from ,bO to .90. The average
subscale alpha of .67 was not noteworthy, casting further doubt upon
the usefulness of subscales as initially clustered. Although the lower
subscale alphas for the subscales of Cooperative Self-interest, Decen
tralization, Individuation, and Participation were mitigated by their
small number of items, Nunnally (1978) maintains that where reliabili
ties are low, the interpreted items have little in common, and extra
statements should be generated. Thus, these subgroups would need to be
expanded, in hopes of raising reliability, before they could be viewed
as homogeneous subscales.
Although high alpha levels characterize the especially short
General subscale, as well as the longer subscales of Need, Faith,
Democratization, Human Benefits, Economic Benefits, Functioning and
Control, the appropriateness of the 14 separate subscales is still not
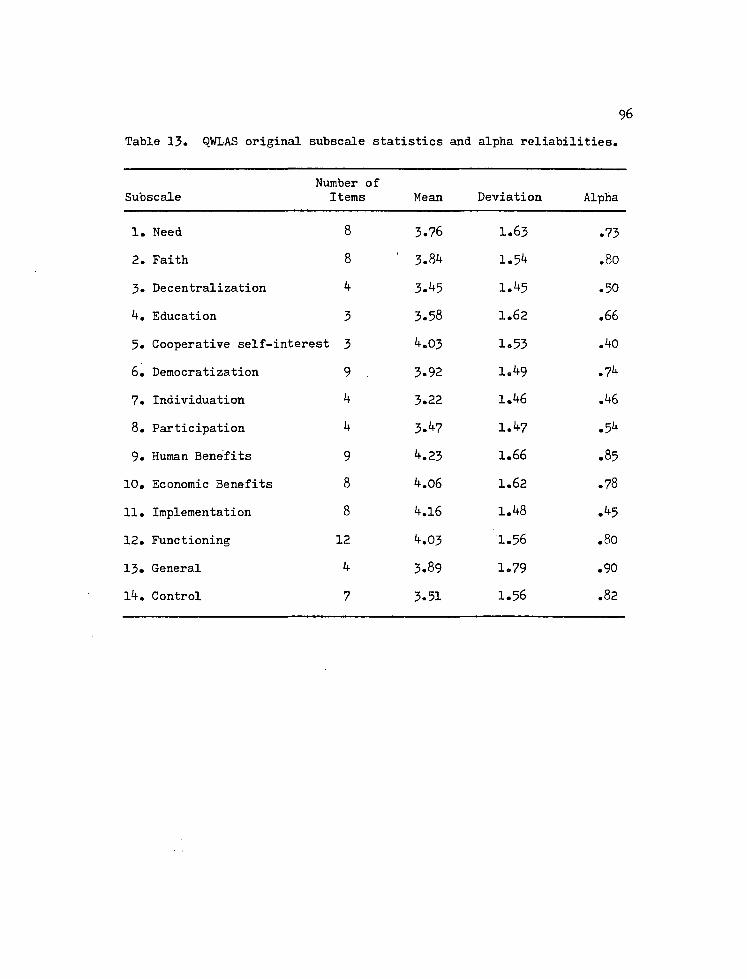
96
Table 13. QWLAS original subscale statistics and alpha reliabilities.
Subscale Number of Items Mean Deviation Alpha
1. Need 8 3.76 1.63 .73
2. Faith 8 ' 3.84 1.54 .80
3. Decentralization 4 3.45 1.45 .50
4. Education 3 3.58 1.62 .66
5. Cooperative self-interest 3 4.03 1.53 .40
6. Democratization 9 3.92 1.49 .74
7. Individuation 4 3.22 1.46 .46
8. Participation 4 3.47 1.47 .54
9. Human Benefits 9 4.23 1.66 .85
10. Economic Benefits 8 4.06 1.62 .78
11. Implementation 8 4.16 1.48 .45
12. Functioning 12 4.03 1.56
o
CO
0
13. General 4 3.89 1.79 .90
14. Control 7 3.51 1.56
OJ CO
•
established. High internal consistencies for these subscales was
hypothesized as attributable to their all measuring a common underlying
variable, in which case it would be difficult to justify breaking the
unidimensional inventory into subscales.
Replicability of High Subscale Internal Consistency Reliabili
ties. This suspicion of the various subscales' high homogeneity co
efficients being due to their all tapping the same general QWL variable
was tested. A table of random numbers (Kerlinger, 1973, PP« 714-717)
was used to assign the 84 pilot items to 14 new subscales and new co
efficient alphas were computed. These randomly composed subscales,
presented in Table 14, possessed the same number of items as their
original counterparts and yielded comparable reliabilities, ranging from
>33 to .82, with a similar average alpha of .64.
Selecting a small criterion of .05 as indicative of a meaningful
difference in alphas between the two sets of subscales, the researcher
found that only 43 percent of the random subscales were lower in re
liability than the original ones (Faith, Cooperative Self-interest,
Democratization, Economic Benefits, General and Control), 28.5 percent
higher than their original versions (Decentralization, Individuation,
Participation, and Implementation), and 28.5 percent equal in internal
consistency (Need, Education, Human Benefits, and Functioning). There
fore, the reliabilities of the original subscales were not impressive
enough to warrant treating them as worthwhile subscales.
Statistical Independence of Original Subscales. Beyond their
negligible performance in terms of logical fit and homogeneity, the
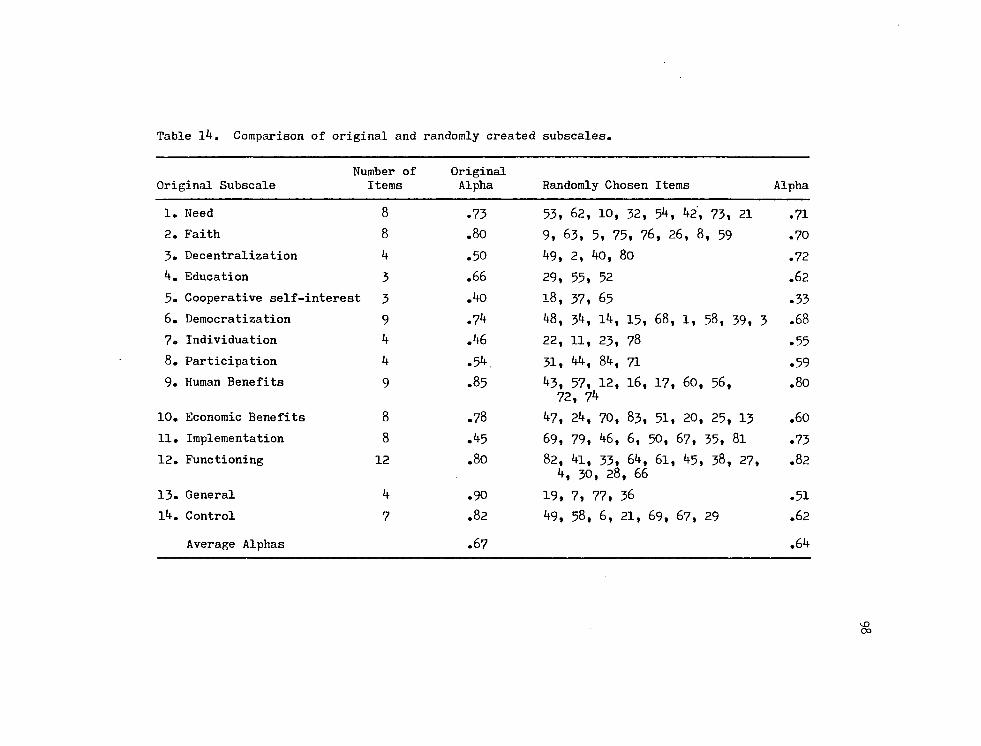
Table lk . Comparison of original and randomly created subscales.
Original Subscale Number of Items
Original Alpha Randomly Chosen Items Alpha
1. Need 8 .73 53, 62, 10, 32, 5k, k2, 73, 21 .71
2. Faith 8 .80 9, 63, 5, 75, 76, 26, 8, 59 .70
3. Decentralization k .50 k9, 2, kO, 80 .72
Education 3 .66 29, 55, 52 .62
5. Cooperative self-interest 3 .to 18, 37, 65 .33
6. Democratization 9 .7 i*8, 3k, Ik , 15, 68, 1, 58, 39, 3 .68
7» Individuation .k6 22, 11, 23, 78 .55
8. Participation k .5k. 31, kk, 8k, 71 .59
9. Human Benefits 9 .85 k3, 57, 12, 16, 17, 60, 56, 72, 7k
.80
10. Economic Benefits 8 .78 k7, 2k , 70, 83, 51, 20, 25, 13 .60
11. Implementation 8 . 5 69, 79, k6, 6, 50, 67, 35, 8l .73
12. Functioning 12 .80 82, kl , 33, 6»», 61, k5, 38, 27, it, 30, 28, 66
.82
13. General if .90 19, 7, 77, 36 .51
l'f. Control 7 .82 k9, 58, 6, 21, 69, 67, 29 .62
Average Alphas .67 ,6k
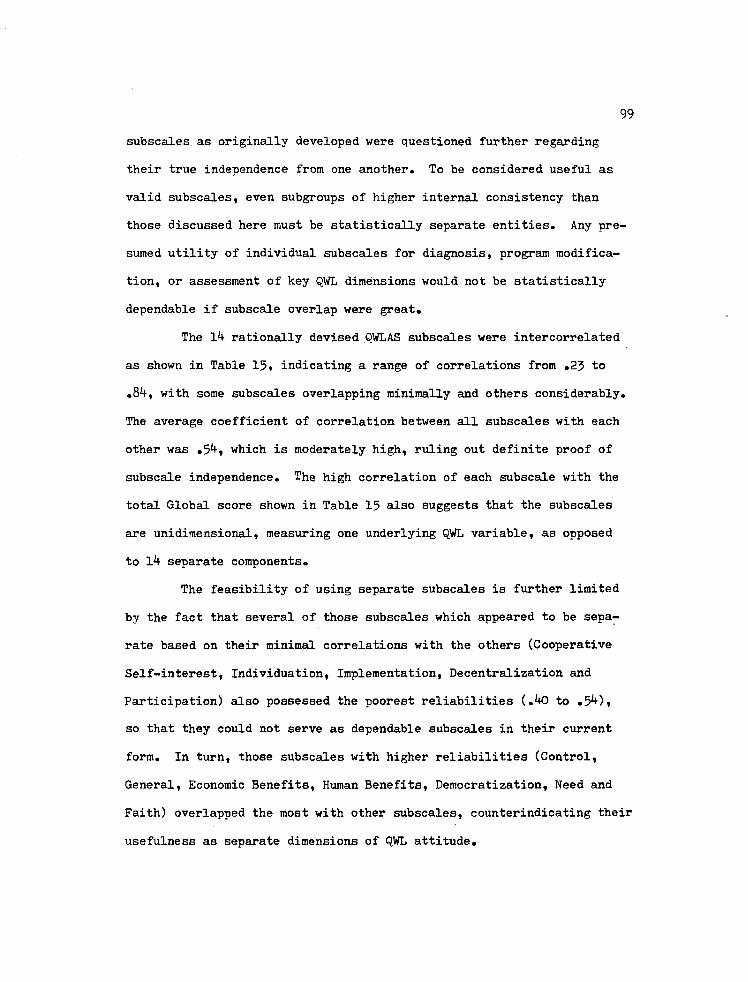
subscales. as originally developed were questioned further regarding
their true independence from one another. To be considered useful as
valid subscales, even subgroups of higher internal consistency than
those discussed here must be statistically separate entities. Any pre
sumed utility of individual subscales for diagnosis, program modifica
tion, or assessment of key QWL dimensions would not be statistically
dependable if subscale overlap were great.
The 14 rationally devised QWLAS subscales were intercorrelated
as shown in Table 15, indicating a range of correlations from .23 to
.8*+, with some subscales overlapping minimally and others considerably.
The average coefficient of correlation between all subscales with each
other was .5 , which is moderately high, ruling out definite proof of
subscale independence. The high correlation of each subscale with the
total Global score shown in Table 15 also suggests that the subscales
are unidimensional, measuring one underlying QWL variable, as opposed
to 14 separate components.
The feasibility of using separate subscales is further limited
by the fact that several of those subscales which appeared to be sepa
rate based on their minimal correlations with the others (Cooperative
Self-interest, Individuation, Implementation, Decentralization and
Participation) also possessed the poorest reliabilities (. O to .5*0,
so that they could not serve as dependable subscales in their current
form. In turn, those subscales with higher reliabilities (Control,
General, Economic Benefits, Human Benefits, Democratization, Need and
Faith) overlapped the most with other subscales, counterindicating their
usefulness as separate dimensions of QWL attitude.
Table 15. Intercorrelations of 14 QWLAS subscales and total scale.
QWLAS Subscales 1 2 3 4 5 6 7 8 9 10 11 12 13 14
1. Need 1.00
2. Faith .67 1.00
3. Decentralization .51 .52 1.00
4. Education .37 .48 .56 1.00
5. Cooperative self-interest .43 .45 .24 .23 1.00
6. Democratization .67 .72 .55 .43 .44 1.00
7. Individuation .50 .45 .58 .55 .35 .45 1.00
8. Participation .55 .63 .58 .51 .32 .65 .48 1.00
9. Human Benefits .72 .75 .55 .34 .43 .72 .48 .56 1.00
10. Economic Benefits .72 .74 .49 .29 .41 .75 •
OO
.58
CO
• 1.00
11. Implementation .43 .52 .39 .26 .31 .57 .34 .45 .59 .51 1.00
12. Functioning .58 .66 .48 .36 .30 .68 .36 .61 .74 .62 .65 1.00
13. General .72 .76 .57 .41 .46 .72 .46 .62 .78 .78 .51 .66 1.00
14. Control .67 .72 .48 .38 .27 .69 .39 .60 .71 .73 .57 .70 .70 1.00
15. Total Scale .78 .83 .66 .52 .46 .82 .59 .73 .83 .80 .61 .75 .84 .77
Average Intercorrelation with Other Subscales .58 .62 .50 .40 .36 .62 .44 .55 .63 .60 .47 .57 .63 .64
H 8
101
Summary. This section has shown that, while the 1 original
subscales were conceptually designed to measure different aspects of
OWL attitude, the evidence did not justify breaking the QWLAS into the
initial subscales. Logic-based sorting of judges, subscale homogeneity
as determined by coefficient alpha reliability estimates, and inter-
correlation evidence revealed little basis for maintaining the inde
pendent subscales. The next sections will discuss confirmatory factor
analysis, which supported the decision to discard the original subscales,
and exploratory factor analysis, which determined the actual underlying
factor structure of the QWLAS as piloted in the Department of Transpor
tation.
Confirmatory Factor Analysis
Nature of Factor Analysis. Factor analysis encompasses a broad
scope of procedures, ranging from confirming the expected number of com
ponents that account for observed interrelations in data, to exploring
new constructs in order to meaningfully reduce the data through its
rearrangement. This analysis of patterns of relationships among the
items is more thorough than traditional item analysis and permits
determination of the underlying factors accounting for the most.variance
among the responses to an attitude scale's items.
Factor analysis reveals underlying factors by grouping those
items in common with each other and not related to any other group.
This is achieved by following the accepted steps: "(1) preparing a
correlation matrix; (2) the extraction of the initial factors — the
exploration of possible data reduction; and (3) the rotation to a
102
terminal solution — the search for simple and interpretable factors"
(Kim, 1978, p. 469).
The correlation matrix interrelates scale items and presents a
set of factors that groups the items in a way which accounts for the
greatest possible variance in the data over other combinations of the
variables. This initial extraction of factors suggests that each group
ing possesses some underlying factor structure which is common to its
included items, with the first factor representing the single best
summary of the linear relationships exhibited in the data, and the
second factor the second best, and so on. Next, the rotation to a ter
minal solution maneuvers the axes of the initial factors until their
position accounts for as much variance as possible. This fields the
clearest, purest factor groupings and simplifies interpretation of the
observed relationships among data. The art of factor analysis enters
at this point, since the researcher must postulate what associated
traits characterize the derived factors (Thorndike, 1971).
Choice of Factor Analytic Methods. The widely used method of
principal factors analysis was performed on the results of the QWLAS
Pilot Form and a varimax rotation was conducted. All initial factors
having an eigenvalue over 1.00 were extracted for consideration,
following the generally accepted criterion used in determining the
optimal number of "real" factors.
Unless there was a content-based justification for retaining a
particular item, only those loading at .50 or greater were retained.
This procedure concurs with Nunnally's requirements for "a strong fac
tor structure" to have five or more items loading at .50 or higher on a
103
factor with an eigenvalue above 1.00 (Nunnally, 1978, p. *+l8). Any item
which loaded significantly on two factors was generally discarded as an
impure indicator of the construct, because it would be impossible to
know if a person's response was based upon the influence of one factor
or the other.
For the purposes of factor analysis, the initial sample of 179
was reduced by 35 percent since the SPSS computer program drops a
respondent's scores if even one value is missing. Justification for
decreasing the number of subjects was established by comparing the com
posite scores of the deleted 62 respondents with the scores of the 117
remaining individuals used in the factor analysis. A t-test yielded
the means, standard deviations, and t-value indicated in Table 16. No
significant difference was revealed between the means of the 117-member
and 62-member groups, supporting the entry of the 117 subject group into
the factor analysis.
Results of Confirmatory Factor Analysis. Factor analysis was
used to determine whether the original 1 subscales were factorally
valid components of QWL attitude. If the data conformed to expecta
tions suggested by the investigator's a priori categorizations, then 1
factors would emerge with strong factor structures having eigenvalue
over 1.00. Also, there would be substantial loadings of .50 or more on
the same factor by items which were hypothesized as belonging together.
The logically-structured subscales were disconfirmed through
(1) examination of the number of factors accounting for significant
variance in OWLAS responses, (2) loadings of the composite scores of
the original subscales on only two strong factors, casting doubt upon
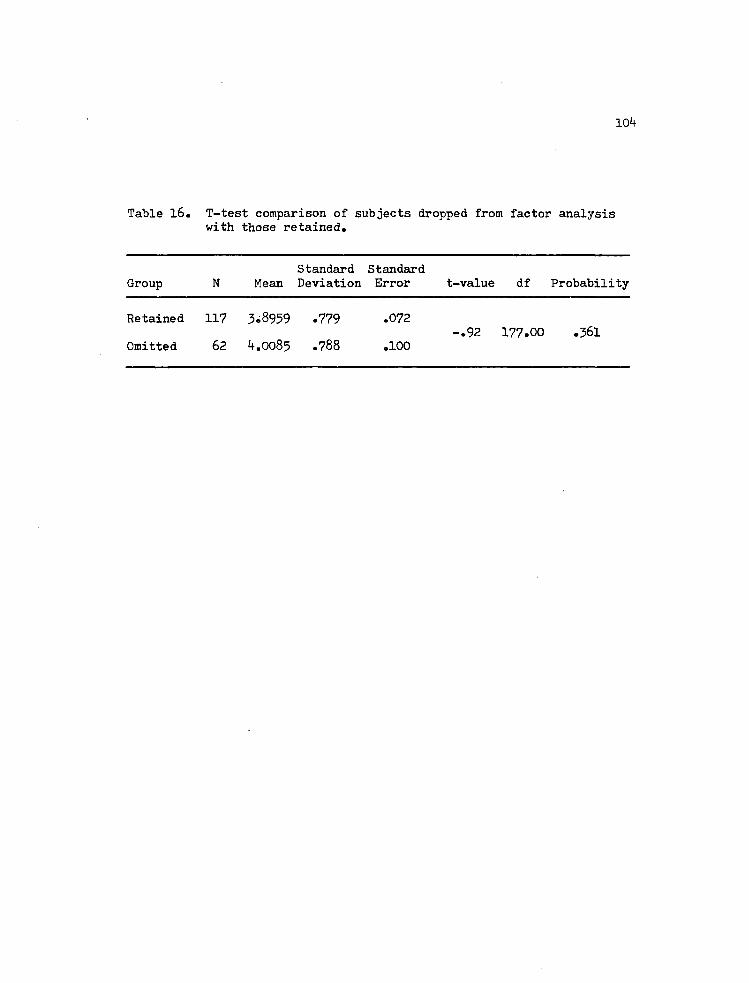
10
Table 16. T-test comparison of subjects dropped from factor analysis with those retained.
Standard Standard Group N Mean Deviation Error t-value df Probability
Retained 117 3.8959 .779 .072 -.92 177.00 .361
Omitted 62 if.0085 .788 .100

105
the meaningful use of 14 independent subscales, and (3) the 84 indi
vidual item loadings which support the presence of only three factors.
Table 17 reports factor analysis results on the 84 items. Prin
cipal factors eigenvalues exceeded 1.00 for 21 factors, with the first
factor accounting for 27.7 percent of the variance extracted. The re
maining 20 factors each accounted for decreasing degrees of variance
with all 21 representing 77.2 percent of the total scale variance. The
original subscale components would have indicated the presence of 14
rather than 21 factors with eigenvalues of 1.00 or greater.
Evidence for retaining' the subscales also appeared scant from
the loadings of the composite subscale scores presented in Table 18,
using these 14 subscale scores as items in a factor analysis. Only two
factors were adequate to describe the ways individuals differed in the
traits measured by all 14 subtests, so that two dimensions explained as
much as 14. The only substantial eigenvalues were 8.184 for the first
factor, determining 58.5 percent of respondents' variance, and 1.228
for the second factor, accounting for an additional 8.8 percent of vari
ance, Decentralization, Education, and Autonomy loaded heavily on the
second factor, Participation moderately on both factors, and the
remaining subscales grouped on the first factor.
Similar to this finding of two general tendencies characteris
tic to the original 14 subscales, individual item loadings on the factor
matrix also revealed far less than 14 constructs affecting variance in
OWL attitudes. Table 19 reveals that when the pilot itemB were analyzed
only three strong factors emerged. Grouping the 84 items by their
original content areas disconfirmed the a priori subscales, because
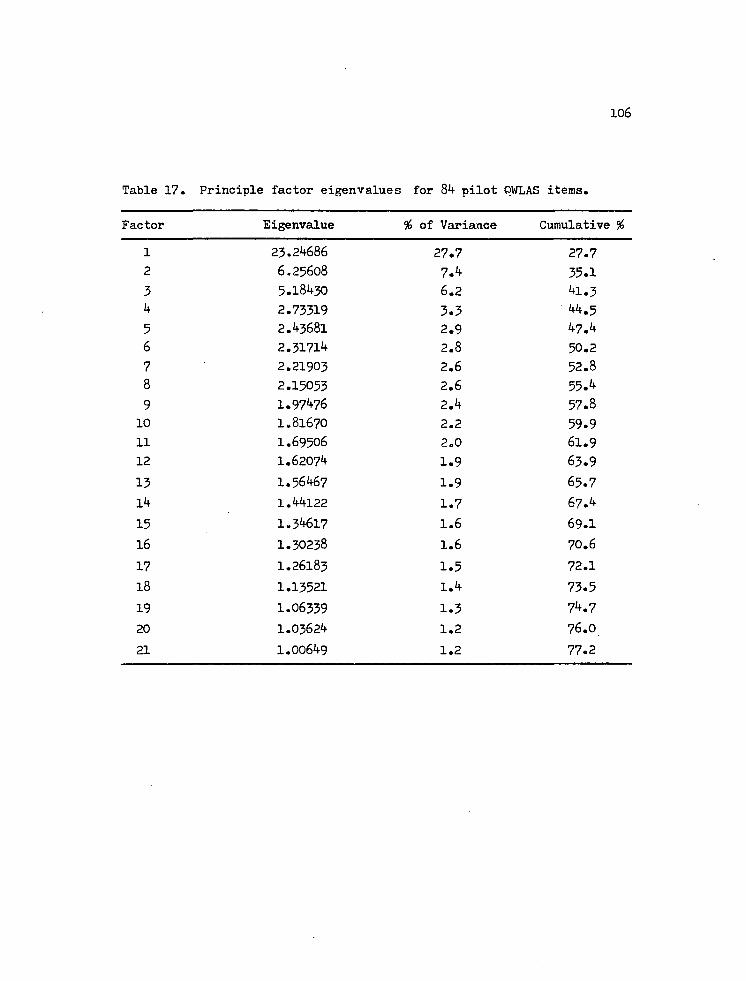
106
Table 17. Principle factor eigenvalues for 84 pilot OWLAS items.
Factor Eigenvalue % of Variaace Cumulative %
1 23.24686 27.7 27.7
2 6.25608 7.4 35.1
3 5.18430 6.2 41.3
4 2.73319 3.3 44.5
5 2.43681 2.9 47.4
6 2.31714 2.8 50.2
7 2.21903 2.6 52.8
8 2.15053 2.6 55.4
9 1.97476 2.4 57.8
10 1.81670 2.2 59.9
11 1.69506 2.0 61.9
12 1.62074 1.9 63.9
13 1.56467 1.9 65.7
14 1.44122 1.7 67.4
15 1.34617 1.6 69.1
16 1.30238 1.6 70.6
17 1.26183 1.5 72.1
18 1.13521 1.4 73.5
19 1.06339 1.3 74.7
20 1.03624 1.2 76.0
21 1.00649 1.2 77.2
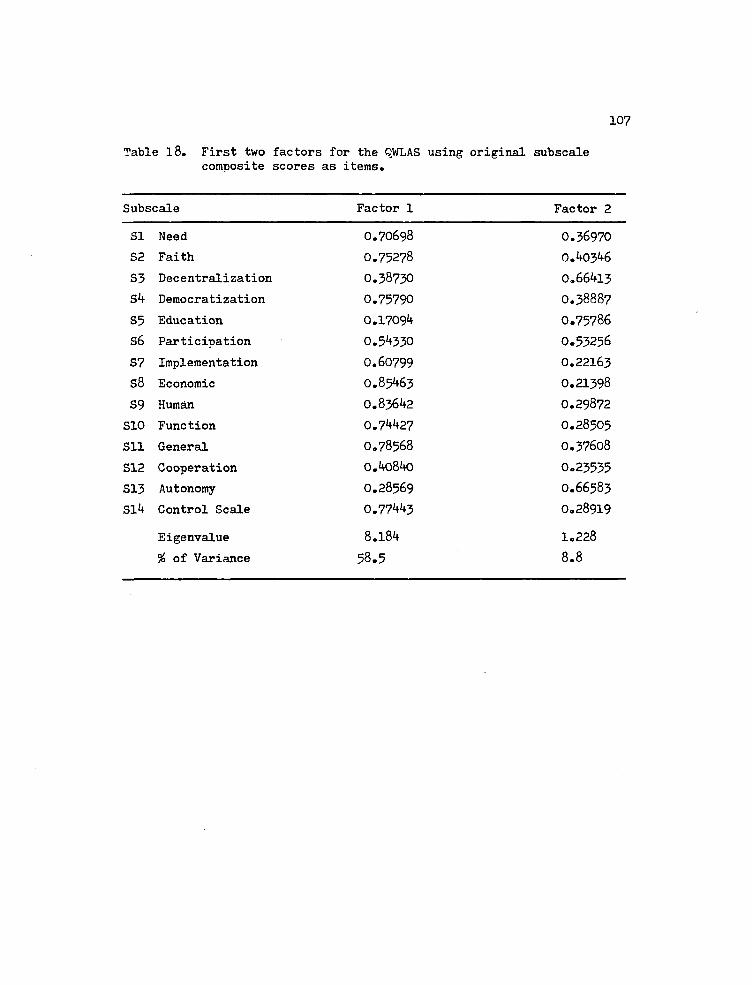
107
Table 18. First two factors for the QWLAS using original subscale composite scores as items.
Subscale Factor 1 Factor 2
SI Need 0.70698 0.36970
S2 Faith 0.75278 0.40346
S3 Decentralization 0.38730 0.66413
S4 Democratization 0.75790 0.38887
S5 Education 0.1709'+ 0.75786
S6 Participation 0.54330 0.53256
S7 Implementation 0.60799 0.22163
S8 Economic 0.85463 0.21398
S9 Human 0.83642 0.29872
S10 Function 0.74427 0.28505
Sll General 0.78568 0.37608
S12 Cooperation 0.40840 0.23535
S13 Autonomy 0.28569 O.66583
Sl4 Control Scale 0.77443 0.28919
Eigenvalue 8.18k 1.228
% of Variance 58.5 8.8
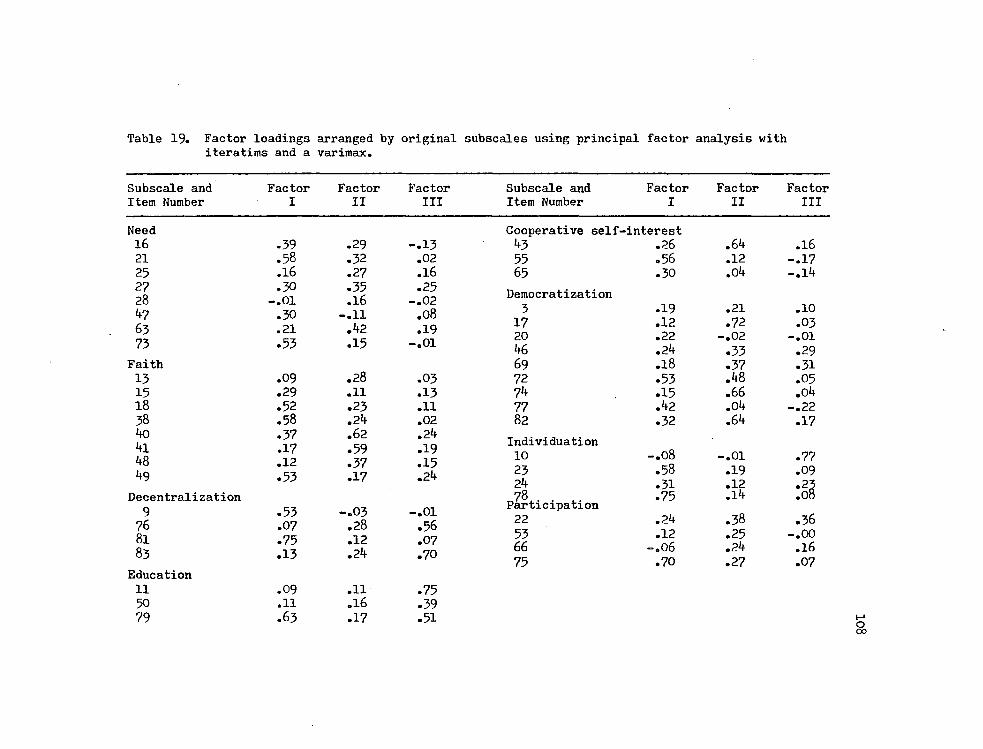
Table 19. Factor loadings arranged by original subscales using principal factor analysis with iteratims and a varimax.
Subscale and Factor Factor Factor Subscale and Factor Factor Factor Item Number I II III Item Number I II III
Need 16 .39 .29 -.13 21 .58 .32 .02 25 .16 .27 .16 2? .30 .35 .25 28 -.01 .16 -.02 47 .30 -.11 .08 63 .21 .42 .19 73 .53 .15 -.01
Faith 13 .09 .28 .03 15 .29 .11 .13 18 .52 .23 .11 38 .58 .24 .02 to .37 .62 .24 1 .17 .59 .19 48 .12 .37 .15 49 .53 .17 .24
Decentralization 9 .53 -.03 -.01 76 .07 .28 .56 81 .75 .12 .07 83 .13 .24 .70
Education 11 .09 .11 .75 50 .11 .16 .39 79 .63 .17 .51
Cooperative self-interest 43 .26 .64 .16 55 .56 .12 -.17 65 .30 .04 -.14
Democratization 3 .19 .21 .10 17 .12 .72 .03 20 .22 -.02 -.01 46 .24 .33 .29 69 .18 .37 .31 72 .53 .48 .05 74 .15 .66 .04 77 .42 .04 -.22 82 .32 .64 .17
Individuation 10 -.08 -.01 .77 23 .58 .19 .09 24 .31 .12 •22 78 .75 .14 .08 Participation
.75
22 .24 .38 .36 53 .12 .25 -.00 66 -.06 .24 .16 75 .70 .27 .07
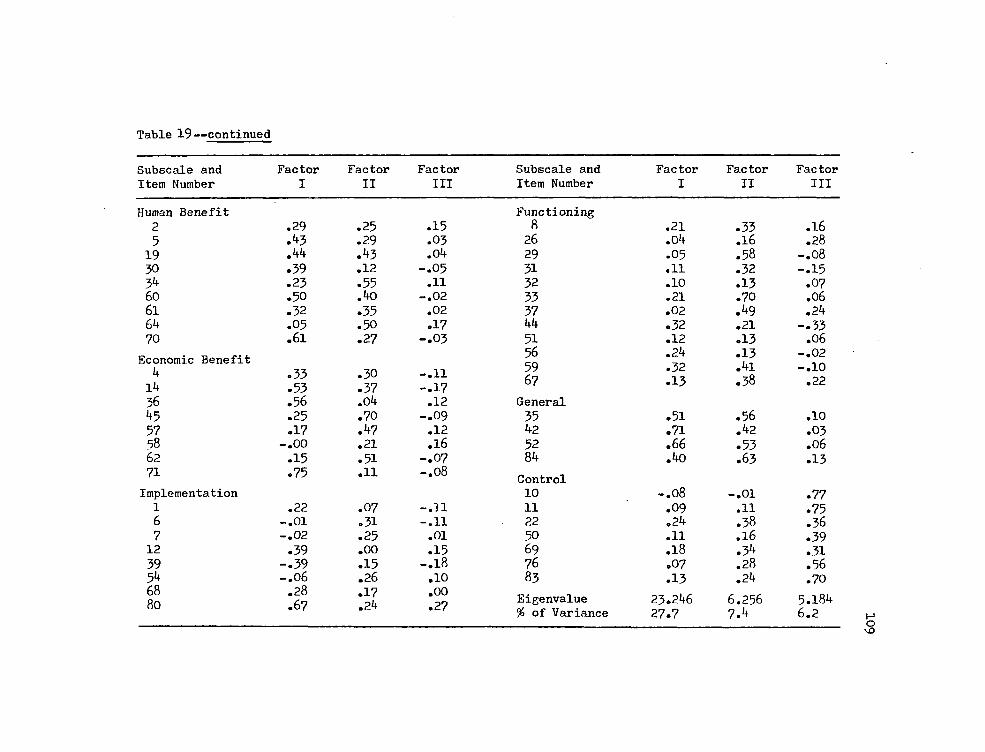
Table 19— continued
Subscale and Factor Factor Factor Subscale and Factor Factor Fac tor Item Number I II III Item Number I II III
Human Benefit Functioning 2 .29 .25 .15 8 .21 .33 .16 5 .43 .29 .03 26 .04 .16 .28 19 .44 . 3 .04 29 .05 .58 -.08 30 .39 .12 -.05 31 .11 .32 -.15 34 .23 .55 .11 32 .10 .13 .07 60 .50 .40 -.02 33 .21 .70 .06 6l .32 .35 .02 37 .02 .49 .24 64 .05 .50 .17 44 .32 .21 -.33 70 .61 .27 -.03 51 .12 .13 .06
Economic Benefit 56 .24 .13 -.02
4 14
.33
.53 .30 .37
-.11 -.17
59 67
.32
.13 .41 .38
-.10 .22
36 .56 .04 .12 General 45 .25 .70 -.09 35 .51 .56 .10 57 .17 .47 .12 42 .71 .42 .03 58 -.00 .21 .16 52 .66 .53 .06 62 .15 .51 -.07 84 .40 .63 .13 71 .75 .11 -.08
Control Implementation 10 -.08 -.01 .77 1 .22 .07 -.11 11 .09 .11 .75 6 -.01 .31 -.11 22 .24 .38 .36 7 -.02 .25 .01 50 .11 .16 .39 12 .39 .00 .15 69 .18 .34 .31 39 -.39 .15 -.18 76 .07 .28 .56 54 -.06 .26 .10 83 .13 .24 .70 68 80
.28
.67 .17 .24
.00
.27 Eigenvalue 23.246 6.256 5.184
68 80
.28
.67 .17 .24
.00
.27 % of Variance 27.7 7.4 6.2
110
only three factors emerged with at least five loadings of .50, many
items did not load even minimally on these factors, and the items within
most subscales loaded inconsistently on more than one construct. Ten
of the subscales had some items loading substantially on two factors,
with only five of the subscales having two or more items loading only
on one factor. The Implementation subscale items did not load substan
tially on any factor. Thus, confirmatory factor analysis rejected the
notion of retaining the subscales as originally devised.
Exploratory Factor Analysis
Once the original subscales were not born out statistically,
exploratory factor analysis waB a relatively small next step, since the
search for underlying factors common to the 8 items had already identi
fied two strong factors with associated eigenvalues of 23.2'+6 and 6.256,
respectively. As shown in Table 20, the first factor consisted of 21
items from 12 of the l'f original subscales, and the second factor in
cluded 15 items from seven of the subscales, reinforcing the scattered
nature of the initial subgroupings.
Appendix K contains Factor One's 17 items and Factor Two's 12
items retained as the QWLAS Long Form, after deleting double-loading
statements (35, 79) and items which did not correlate significantly
with the Change Acceptance Scale (9, 55)» rendering their validity
questionable. Item 52 was retained despite its impure loading on two
factors, because it fit conceptually with Factor One's general nature,
showed high item validity using the CAS criterion and possessed a high
item-total correlation (.85) with the other 83 items in the pilot pool.
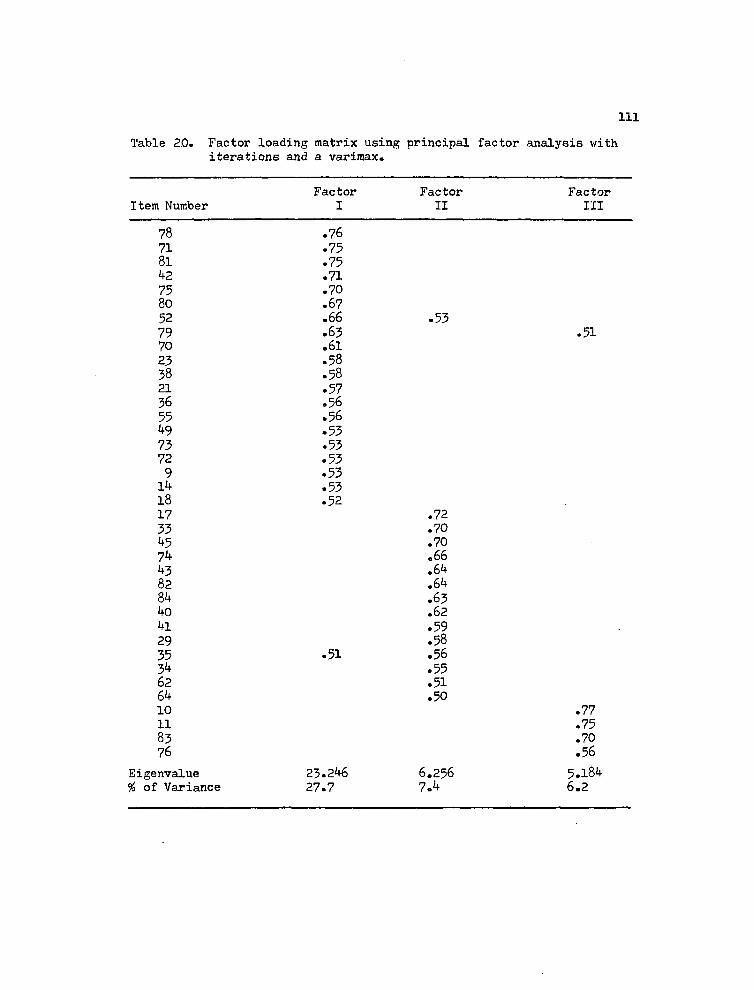
Table 20. Factor loading matrix using principal factor analysis with iterations and a varimax.
Factor Factor Factor Item Number I II III
78 .76 71 .75 81 •75 42 .71 75 .70 80 •67 52 .66 .53 79 .63 .51 70 .61 23 • 58 38 .58 21 .57 36 .56 55 .56 49 .53 73 .53 72 .53 9 .53 14 .53 18 • 52 17 .72 33 .70 5 .70 74 .66 43 .64 82 .64 84 .63 40 .62 41 .59 29 .58 35 .51 .56 34 .55 62 .51 64 .50 10 .77 11 .75 83 .70 76 .56
Eigenvalue 23.246 6.256 5.184 # of Variance 27.7 7.4 6.2
112
Item 29 was discarded since its specific reference to "Division Heads"
might diminish its applicability, should the QWLAS be used by organi
zations employing different terminology.
Subscale Interpretation. Perusal of Factor One and Factor Two
items revealed the former to be worded in a positively criterial
fashion and the latter to be negatively criterial. This pattern per
sisted even when the criterion of acceptable loadings was lowered to
.'tO (if double-loading items were not considered), with the tendency
tapering off as item loadings approached .30. Interpretation of the
constructs in common to the items in each factor involved judgment
beyond statistical observation. The consistently positive wording on
Factor One and Factor Two's negatively worded items might mean that
some aspect other than item content accounted for the response variance,
such as direction of the statements' wording. However, this was not
believed to be the case, since other writers have given evidence for
negatively criterial items' impacting upon construct validity of an
instrument, so that it made sense for negatively worded statements to
load together and appear as a separate construct (Schreischeim, 1981).
A further interpretation of the constructs measured by the QWLAS
was made. Most first factor items reflected a general theme related
to the whole idea of OWL. They had a more theoretical perspective,
addressing the program from a conceptual vantage-point. Factor Two
items, on the other hand, appeared to deal with more specific concerns
about the program, possessing a more operational nature. These items
mostly targeted the realities of the system and involved the practical
113
impact of OWL on one's workplace. Such a split between a general, theo
retical cluster composed of positively worded, "favorable" items and a
more operational, specific concern cluster comprised of negatively
worded, "unfavorable" items, seemed reasonable. The existence of these
attitude areas as separate factors was consistent with the sentiment
heard in the frequently-expressed cliche, "the idea is great, but it'll
never work in practice."
Thus, the QWLAS Long Form consisted of one general factor
tapping reactions to positive attitude statements about the program in
theory and a second, more specific factor involving practical concerns
and reservations using negatively-expressed attitude statements. Such
a clean breakdown among positively and negatively criterial statements
fostered a well-balanced QWLAS. The Factor One grouping of 17 items
was labeled "General" and the Factor Two cluster of 12 items was labeled
"Specific Concerns." The correlation between these two new subscales
was .49, rendering them reasonably separate components of OWL attitude.
Control Scale. A third factor was uncovered having an eigen
value of 5.184 and five items loading above .50, including four state
ments from the initial Control subscale. A fifth item, also loading on
Factor One, was from the Education subscale and was rationalized as
compatible with a control-oriented theme. Interpretation of this group
appeared valid, especially since lowering the loading criterion to .50
and eliminating all items loading on other factors surfaced only three
more items, all from the Control subscale. Ultimately, this factor was
comprised exclusively of the original control subscale in its entirety
(see Appendix E for exact item wording).
n't
The weakness of this third factor and its considerably lower
correlation with the Change Acceptance Scale (see discussion of validity
below) led to its being separated from the QWLAS. However, this Control
scale is recommended for further research and use as a valid, reliable
measure of a different construct. The Control scale uses the term
"OWL" in each item, but seems more appropriately conceived of as assess
ing a personality trait comparable to Authoritarianism, exemplified by
the Fromm and Maccoby (1970) construct. The Control factor appears
related to OWL acceptance, rather than being an actual indicator of
QWL attitude.
Item Analysis and Development of the QWLAS Short Form
This section will first detail results of a general item analy
sis upon the initial 84 items to assure that no important items were
deleted in moving from the QWLAS Pilot Form to the 29-item OWLAS Long
Form. Secondly, results of a more indepth item analysis will be
reviewed in order to answer research question two: "What items can
comprise the final QWLAS Long Form and Short Form without significantly
lowering scale reliability?"
General Item Analysis
Traditional item analysis stems from achievement test construc
tion and calculates each item's difficulty level and ability to dis
criminate between poor and good students (Blood and Budd, 1972). The
non-dichotomous nature of attitude scales led to the inapplicability of
difficulty indices. Instead, emphasis was placed upon determining how
115
well each attitude statement differentiated between people holding
favorable and unfavorable OWL attitudes.
While item deletions from a test are sometimes based upon how
well they discriminate among respondents on an external criterion
.(Anastasi, 1968), the lack of independent measures can necessitate use
of data from the test administration itself. Discrimination indices
like the biserial, point biserial, tetrachoric and phi coefficients
typically split the subjects into high global score and low global
score groups and compare an item's ability to differentiate between
these criterion groups (Wood, I960; Engelhart, 1967). "The justifica
tion for using the total score is that ambiguities and other weaknesses
of individual items are likely to be outweighed by a majority of good
valid items and that the total test score is thus a fair overall measure
of what the individual items are designed to measure" (Thorndike, 1971»
p. 13*0.
Using a total score index emphasizes the reliability and homo
geneity of a test as a method to discard items, as do the widely used
internal consistency measures that interrelate each item with all other
items. One such formula is Cronbach's (1951) coefficient alpha, which
reports each item's correlation with all other items. Poorer items are
identified by their lower item-lotal correlations. Since each item is
part of the total test with which it is being correlated and produces
spuriously high correlations, the SPSS alpha program includes a correc
tion formula.
The item-total data in Table 21 show that 69 percent of the
pilot scale items (58) had correlations above .*K), 46 percent (39)
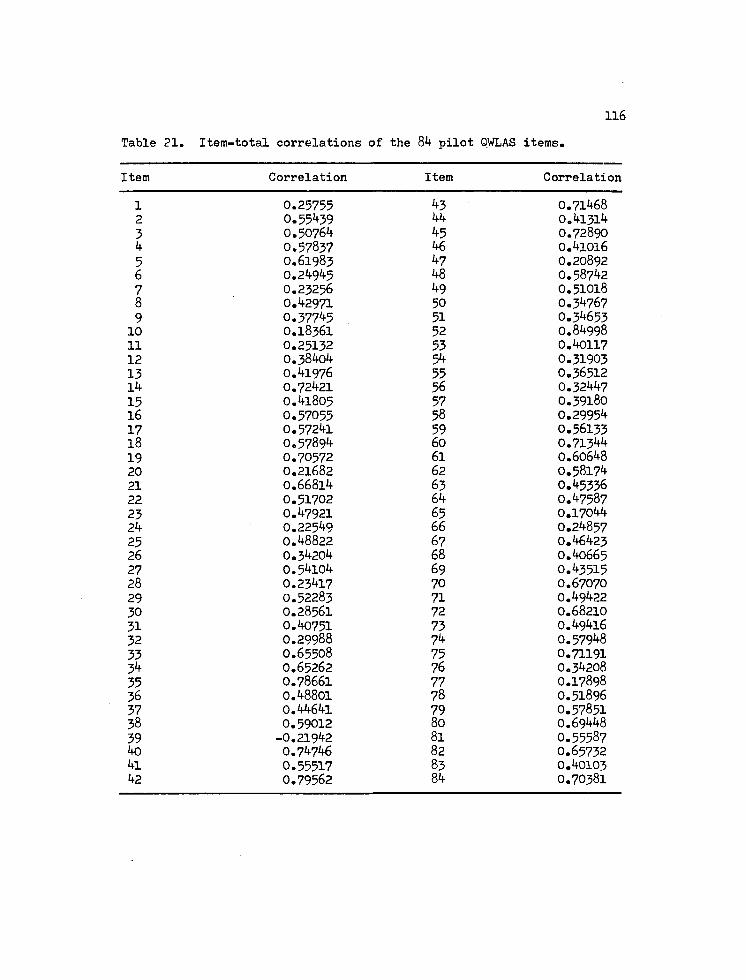
116
Table 21. Item-total correlations of the 84 pilot OWLAS items.
Item Correlation Item Correlation
1 0.25755 43 0.71468 2 0.55439 44 0.41314 3 0.50764 45 0.72890 4 0.57837 46 0.41016 5 0.61983 47 0.20892 6 0.24945 48 0.58742 7 0.23256 49 0.51018 8 0.42971 50 0.34767 9 0.37745 51 0.34653 10 O.1836I 52 0.84998 11 0.25132 53 0.40117 12 0.38404 54 0.31903 13 0.41976 55 0.36512 14 0.72421 56 0.32447 15 0.41805 57 0.39180 16 0.57055 58 0.29954 17 0.57241 59 0.56133 18 0.57894 60 0.71344 19 0.70572 61 0.60648 20 0.21682 62 0.58174 21 0.66814 63 0.45336 22 0.51702 64 0.47587 23 0.47921 65 0.17044 24 0.22549 66 0.24857 25 0.48822 67 0.46423 26 0.34204 68 0.40665 27 0.54104 69 0.43515 28 0.23417 70 0.67070 29 0.52283 71 0.49422 30 0.28561 72 0.68210 31 0.40751 73 0.49416 32 0.29988 74 0.57948 33 0.65508 75 0.71191 3k 0.65262 76 0.34208 35 0.78661 77 0.17898 36 0.48801 78 0.51896 37 0.44641 79 0.57851 38 0.59012 80 0.69448 39 -0.21942 81 0.55587 40 0.74746 82 0.65732 4l 0.55517 83 0.40103 k2 0.79562 84 0.70381
117
above .50, 23 percent (20) above .60 and 13 percent (11) above .70.
Ahmann and Glock (1967) designate item-total correlations between .00
and .20 as poor, .20 and .40 as satisfactory, and .kO or better as very
good. Thus, 97 percent of the Pilot Form items were satisfactory to
very good, 69 percent very good, 27 percent satisfactory, and only 3
percent poor. Data from Table 21 insured that no highly-correlating
item was dropped, and no poorly-correlating item was kept in the 29-
item QWLAS Long Form.
Many statements with low item-total correlations revealed some
anomoly. Item 28's correlation of .23 could have stemmed from its
double-barrelled phrasing, a violation of good item-writing: "I resent
that QWL wrongly assumes I'm turned off to this organization." Item 7,
"QWL should involve the vote of everyone on whether it's wanted, or
else it's being forced like Big Brother," had a low correlation of .23,
possibly because it could be endorsed both by people unfavorably and
favorably inclined toward the program. Such merging of statistical
examination and consideration of specific wording helped to verify the
items retained for the OWLAS Long Form,
Selection of the QWLAS Short Form
A 29-item QWLAS Long Form seemed appropriate for organizations
seeking to explore attitudes of employees at the outset of a QWL pro
gram. A shorter version appeared desirable for incorporation into
ongoing research packages evaluating other dimensions of QWL's outcomes,
exemplified by the Pima County Questionnaire (see Appendix B). There
was no need to represent 14 separate dimensions since two basic factors
had been found to account for QWL attitude. While Thorndike suggests
118
"that each group of items be large enough to yield a reliable and valid
total score" (Thorndike, 1971, p. 13 )i the two-factor nature of the
QWLAS inventory seemed quite manageable. Therefore, a more involved
item analysis determined seven items from each of the Long Form's strong
factors, culminating in a l -item QWLAS Short Form.
Whereas factor loadings primarily determined the items for the
QWLAS Long Form, the QWLAS Short Form items were chosen through more
rigorous screening. The product of each item's item-total correlation
and item variance was computed to yield its reliability index. The
item-total used was its correlation with the rest of the items in the
factor to which an item belonged (General or Specific Concerns), not
the entire 8k-item pilot QWLAS. Secondly, each item's validity index
was computed as its variance multiplied by its correlation with the
concurrent external criterion, the Change Acceptance Scale.
Thorndike (1971» P» 153) suggests examining both an item's
reliability index and its item validity index, because selecting items
based only upon item reliability can result in too narrow a test in
content, decreasing scale validity. Anastasi (1968), in turn, notes
that items chosen by external item validity can be poor on the basis
of internal consistency. Therefore, the QWLAS Short Form was finalized
based on data from Table 22, taking into account each item's reliability
index and validity index. An effort was also made to retain 1*4- items
which were drawn from as many of the original subscales as possible,
resulting in the broadest possible content sampling. Asterisked items
in Table 22 indicate Short Form items, and their specific wording is
available in Appendix K.
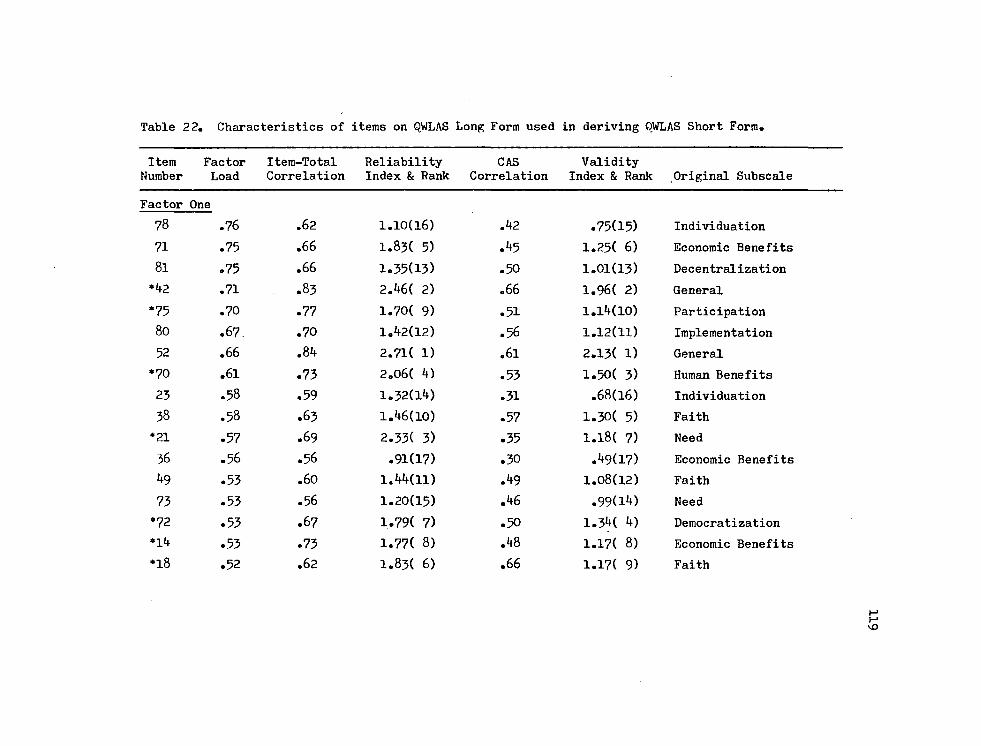
Table 22. Characteristics of items on QWLAS Long Form used in deriving QWLAS Short Form.
Item Factor Item-Total Reliability CAS Validity Number Load Correlation Index & Rank Correlation Index & Rank Original Subscale
Factor One
78 .76 .62 1.10(16) .42 .75(15) Individuation
71 .75 .66 1.83( 5) .45 1.25( 6) Economic Benefits
81 .75 .66 1.35(13) .50 1.01(13) Decentralization
•
ru
.71 .83 2.46( 2) .66 1.96( 2) General
*75 .70 .77 1.70( 9) .51 1.14(10) Participation
80 .67. .70 1.42(12) .56 1.12(11) Implementation
52 .66 .84 2.71( 1) .61 2.13( 1) General
•70 .61 .73 2.06( 4) .53 1.50( 3) Human Benefits
23 .58 .59 1.32(14) .31 .68(16) Individuation
38 .58 .63 1.46(10) .57 1.30( 5) Faith
•21 .57 .69 2.33( 3) .35 l.l8( 7) Need
36 .56 .56 .91(17) .30 .49(17) Economic Benefits
49 .53 .60 1.44(11) .49 1.08(12) Faith
73 .53 .56 1.20(15) .46 .99(14) Need
•72 .53 .67 1.79( 7) .50 1.34( 4) Democratization
•1*+ .53 .73 1.77( 8) .48 1.17( 8) Economic Benefits
*18 .52 .62 1.83( 6) .66 1.17( 9) Faith
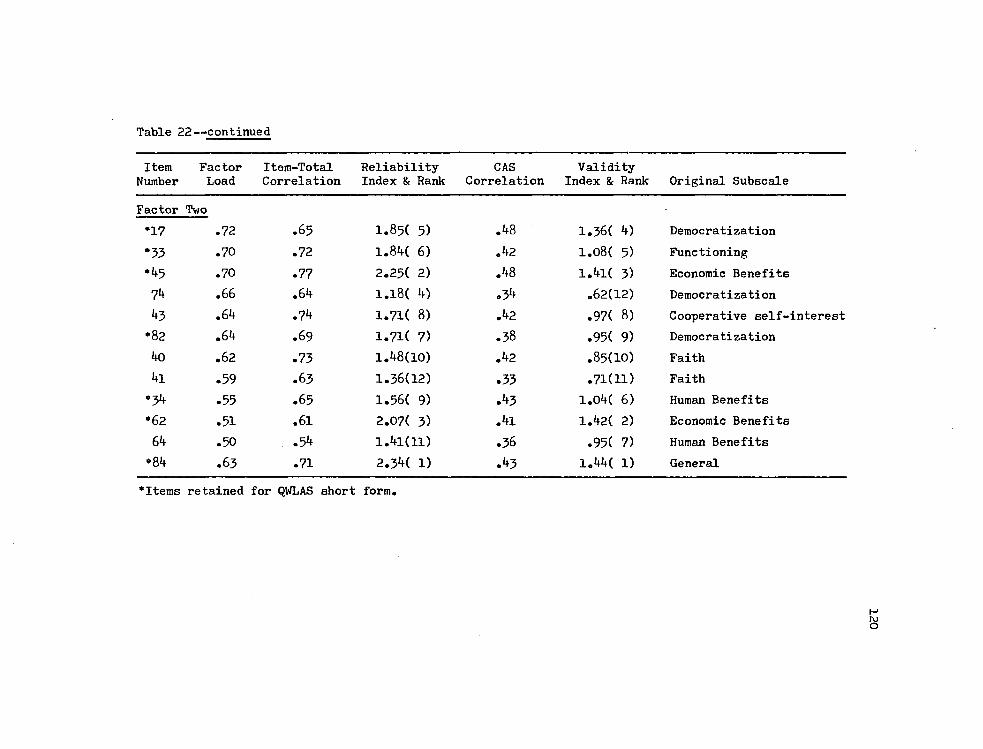
Table 22—continued
Item Factor Item-Total Reliability CAS Validity Number Load Correlation Index & Rank Correlation Index & Rank Original Subscale
Factor Two
*17 .72 .65 1.85( 5) .48 1.36( 4) Democratization
*33 .70 .72 1.84( 6) .42 1.08( 5) Functioning
*45 .70 .77 2.25( 2) .48 1.4l( 3) Economic Benefits
74 .66 .6»f I.l8( 4) .34 .62(12) Democratization
*+3 .64 .74 1.71( 8) .42 .97( 8) Cooperative self-interest
*82 .6k .69 1.71( 7) .38 .95( 9) Democrati zation
40 .62 .73 1.48(10) .42 .85(10) Faith
4i .59 .63 1.36(12) .33 .71(11) Faith
*34 .55 .65 1.56( 9) .43 1«04( 6) Human Benefits
*62 .51 .61 2.07( 3) .41 1.42( 2) Economic Benefits
64 .50 .5k 1. 1(11) .36 .95( 7) Human Benefits
*84 .63 .71 2.3M 1) .43 1.44( 1) General
'Items retained for QWLAS short form.
121
Benson and Vincent (1980) advocate cutting items if any response
category has a frequency of more than 50 percent, if the neutral cate
gory's frequency exceeds 30 percent, or if more than three categories
are responded to by less than 10 percent of the sample. While 37 per
cent of the QWLAS Pilot Form items were plagued by violations of
Benson's criteria, the OWLAS Long Form reduced the infractions to 2k
percent of its 29 items, with the final QWLAS Short Form exhibiting a
problem in only one item of its 14 statements. However, Benson's cri
teria were viewed as less important than reliability and validity
indices, especially since category frequencies were influenced by the
particular attitudes prevalent within the sample.
Reliability of the OWLAS
While item analysis examined the separate statements of the
QWLAS, it was also necessary to investigate the functioning of the
instrument as a whole. Research question 3 asked: "Is the QWLAS a
reliable psychological instrument?" Reliability data allow users of
the instrument to determine the proportion of the variability in scores
reflecting "true" variance in the trait measured, as opposed to error
variance (Brown, 1971). This use earns reliability its common
description as the single best index of a measure's accuracy, the degree
to which it is an estimate of the true score in a population. It
follows that if a scale does not measure consistently, one cannot know
what it does measure (Blood and Budd, 1972).
Various writers (Thorndike and Hagen, 1955; Green, 1981) review
basic forms of reliability measures, such as stability (test-retest),
equivalence (alternate forms correlation) and internal consistency
122
(correlations of the scores of the test from a single administration).
Test-retest approaches are often impractical because of scheduling con
straints and because correlations can be affected by extraneous factors
and actual attitude changes (Millward, n.d.). The use of alternate
forms is troublesome due to problems in scheduling two independent
administrations for comparison, the questionable equivalence of paral
lel attitude scales (Oppenheim, 1966), and the rare need to go through
the extra labor and constructing alternate forms (Blood and Budd, 1972).
The most practical approach is to draw different observations
from the same measure to determine internal consistency reliability,
such as split half methods that produce two scores analogous to scores
on equivalent forms (Anastasi, 1968). Split-half reliability is lower
than the true level because the item pool is only half as large, so a
correction formula is employed, such as the Spearman-Brown formula
(Pidgeon and Yates, 1968). While all three types of reliability yield
similar results, the most common, problem-free estimate of reliability
is internal consistency (Shaw and Wright, 196?), which was discussed
earlier in the context of the degree to which subscale items were
measuring the same thing.
Split-half procedures have been superceded by methods of in
ternal consistency that do not necessitate dividing the measure in half,
such as the Kuder-Richardson Formula 20 and Cronbach's alpha, which
interrelate every item, and are based on the average intercorrelation
between test items (Cronbach, 1951)*
The alpha estimates of reliability for the QWLAS Long Form and
Short Form are compared with those for the QWLAS Pilot Form in Table 23.

Table 23. Reliability of the QWLAS Long Form and Short Form.
Form Number of Item
Items Included Alpha (a)
1. QWLAS Pilot Form
Total
2. QWLAS Long Form
8k Original Pool .96329
Factor I (General) 17 Ik , 70,
18, 71,
21, 72,
23, 73,
36, 75,
38, 78,
k2, 80,
9, 81
52, .9 281
Factor II (Specific Concerns) 12 17, 7k,
33, 82,
3k, 8*f
ko. k l , k3. k5, 62, 6lf, .92206
Total 29 .95 08
tfLAS Short Form
Factor I (General) 7 1^, 18, 21, k2, 70, 71, 75 .90550
Factor II (Specific Concerns) 7 17, 33, 3k, k5, 62, 82, 8k .88361
Total l*t .928 7

12k
Because alpha reliability estimates are a function of both test homo
geneity and length, the substantial drop in scale length while maintain
ing coefficients comparable to the .96 level of the Pilot QWLAS
rendered the QWLAS Long Form (alpha = .95) and Short Form (alpha = .93)
highly reliable and homogeneous. Additionally, the reliabilities for
each factor taken as a subscale were noteworthy, considering their
reduced scale lengths. The QWLAS was thus judged as highly accurate,
especially given Nunnally's criterion of acceptable reliability for an
experimental scale as .70 (Nunnally, 1978, p. 2*+5)«
Validity of the QWLAS
Research question four ("Is the QWLAS a valid psychological
instrument?") covered one of the most difficult characteristics to
establish, and the greatest deficiency of attitude scales (Shaw and
Wright, 1967). Validity is the "consistency with which an instrument
measures the variable or variables it was designed to measure" (Blood
and Budd, 1972, p. 9), with reliability addressing the consistency re
quirement, and what is typically called validity encompassing the
relevancy dimension.
Though over 0 types of validity exist (Brown, 1971), the four
major types distinguished by the APA Committee on Psychological Tests
are the criterion-oriented predictive and concurrent validities, con
tent validity, and construct validity (Cronbach and Meehl, 1955, p.
2kk), The QWLAS was reviewed against these basic types of validity,
as well as face validity, to establish its overall validity.
125
Face Validity
Mosier (1967) analyzes several meanings of the term "face
validity," generally regarded as the degree to which an instrument
appears to observers to measure the attitude in question (Lemon, 1973)•
Often confused with the more thorough, rationally derived content
validity, this quality is determined more casually through a perusal
of the scale by respondents. Face validity indicates the acceptability
of the instrument, the level to which its consumers are convinced of
its adequacy.
The OWLAS was judged to have face validity to measure positive
and negative attitudes toward public sector QWL programs. A panel of
judges provided input regarding items and, in fact, that items were
drawn fron the OWL attitude domain was apparent from subjects' involve
ment in item generation. All but two of the 84 items (6, k7) actually
contained the term "QWL" in its wording. In contrast to face validity's
basis upon presuming respondents' perceptions, content validity is
harder to establish, and depends more upon the rigorous involvement of
the test developer.
Content Validity
The most common validity evidence in attitude.scale literature
(Shaw and Wright, 1967), content validity, is the examination of the
scale content to determine whether it covers a representative ssunple of
the attitude domain measured. Assuring that all major aspects of the
attitude area are sampled requires the judgment and precise definition
of the attitude domain.
126
QWLAS content validity was built in from the outset through the
use of Herrick's (1981a) QWL schemata and by the careful choice of
items. Categorization and screening of items by the investigator and
a panel of judges assured that each statement was drawn from QWL's
content universe and contributed to the instrument's sampling of the
total range of the attitude dimension.
Assurance of content validity was. achieved by involving par
ticipants from the population for which the Scale was being used, and
by consulting appropriate literature. Finally, Reynolds and Greco
(1980) make a case for content validity being measured by the average
value of the item-total correlation, which was .48 for the QWLAS Pilot
Form, .63 for the QWLAS Long Form, and .67 for the QWLAS Short Form.
The various indicators above established the adequate content validity
of the QWLAS.
Criterion Validity
Criterion-related validity refers to the effectiveness of a
test in indicating an individual's behavior in particular situations.
Test performance is measured against some criterion, a direct and inde
pendent index of whatever the attitude scale is designed to assess
(Thorndike, 1971). When the criterion measure is long-term, like
sampling of individuals' later behavior, criterion validity is more
specifically termed "predictive validity." Since predictive validity
can be impractical, an independent criterion measure may be adminis
tered at the same time as the attitude measure, whereupon the evidence
obtained contributes to "concurrent validity." Only 15.3 percent of a
classic collection of attitude scales (Shaw and Wright, 1967) report
127
predictive validity data. The OWLAS was therefore explored for con
current validity, which is second only to content validity in frequency
of use, and still has diagnostic value.
Internal Consistency Concurrent Validity. It is difficult to
find an appropriate independent measure to administer concurrently with
the attitude scale, since many criterion measures cover a broader or
different area than desired. Therefore, the experimental instrument
itself is often the most relevant measure available, resulting in in
ternal consistency validity. This determination of whether a scale
measures in a consistent pattern when an external criterion is lacking
is called "makeshift" validity by Anastasi (1968, p. *+82), but many
researchers fall back on such item analysis procedures for validation
purposes (Leeds, 1950; Helfant, 1952). The OWLAS internal consistency
validity evidence using Cronbach's alpha has already been presented as
strong in Table 23.
Concurrent Validity with an External Criterion. Concurrent
validity was further investigated by correlating the OWLAS with the
independent Change Acceptance Scale (CAS). Respondents were asked to
estimate their QWL attitude by indicating their level of OWL acceptance
on Reddin's (1970) nine-point linear continuum (Sabotage, Protests,
Slowdowns, Apathy, Indifference, Acceptance, Support, Cooperation,
Commitment). While individual item validity coefficients varied, 70
percent of the 8 pilot items reached a significance level of p<.001,
and both the Long Form and Short Form Global scores were significantly
correlated with the CAS (p c.001).
128
Table 22 includes the CAS correlations with each Long Form item
and Table 2k lists concurrent validity evidence for each form as a
whole (Pilot, Long and Short Forms). Both the Long and Short Forms
compared favorably with the Pilot Form, especially given their reduction
in length, with CAS correlations for the Pilot, Long and Short Forms of
.71, .73, and .69, respectively. The weak Factor III, comprised of
Control subscale items, only achieved a .33 correlation. Thus, it
tapped a different construct than the OWLAS, which further justified
its being separated from the final instrument. Its use as a person
ality construct related to QWL acceptance is strongly recommended.
Construct Validity
The construct validity of a test is the extent to which it may
be said to be measuring its intended theoretical construct or psycho
logical trait. While some writers rationalize the use of internal
consistency measures as evidence of construct validity (Bertrand and
Cebula, 1980), most rely upon the traditional methods of factor analysis
and correlational approaches.
Factoral Construct Validity. Since factor analysis statisti
cally classifies responses into constructs or concepts, the method is
accepted as contributing evidence as to what the test really measures
(Hepburn and Napier, 1980; Klein, 1981; Iwanicki and Schwab, 1981).
This clustering of the items into constructs determining the variance
of scores builds construct validity by clarifying what appears to be
assessed.
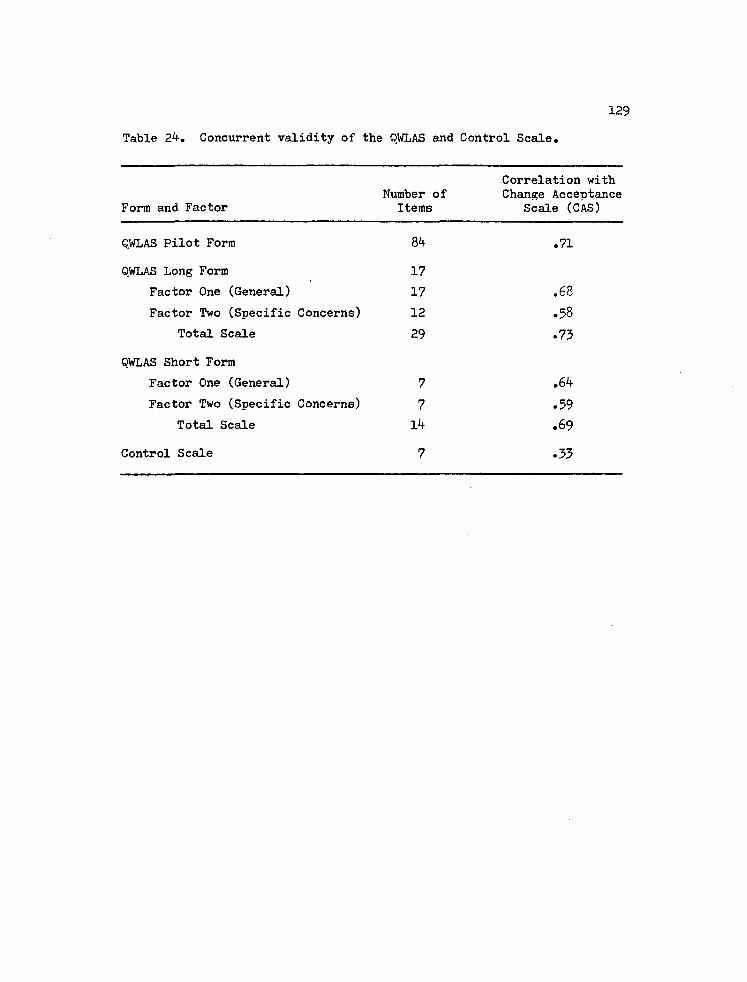
129
Table 24. Concurrent validity of the OWLAS and Control Scale.
Correlation with Number of Change Acceptance
Form and Factor Items Scale (CAS)
QWLAS Pilot Form 84 .71
OWLAS Long Form 17
Factor One (General) 17 .68
Factor Two (Specific Concerns) 12 .58
Total Scale 29 .73
QWLAS Short Form
Factor One (General) 7 .64
Factor Two (Specific Concerns) 7 .59
Total Scale 14 .69
Control Scale 7 .33
130
Most of the variance of the OWLAS was identified as determined
by a positively criterial factor, labeled "General," and to a lesser
extent by a negatively criterial factor, labeled "Specific Concerns."
These components clarified constructs measured by the Scale and thereby
added to construct validity. The correlations of .^9 between Factor
One and Factor Two on the Long Form and .5^ on the Short Form demon
strated sufficient independence between these two new subscales to
warrant their separate use on the QWLAS.
Correlational Construct Validity. Correlational methods for
establishing construct validity evidence determine whether people high
or low on the Scale differ in everyday life or in the laboratory on
other indicators of the same construct. The procedures are analogous
to the scientific method in which the researcher must hypothesize how
people with certain traits should score on the attitude scale, or how
the attitude measure scores should correlate to other related or unre
lated measures.
A popular method is to select a personality measure assumed to
assess the same quality, looking for convergent validity through a high
correlation, or to choose measures of different constructs, which should
yield low- or non-correlated scores, known as discriminant construct
validity (Campbell and Fiske, 1967). Finally, the investigator may
administer a controlled treatment expected to alter test performance
and, then note whether, in fact, score differences result (Thorndike,
1971).
While the indepth investigation of attitude differences was not
the intended focus of the present study. Analysis of Variance tests were
131
performed on all the biographical items as they related to composite
scores on Factor One (General), Factor Two (Specific Concerns), and the
total QWLAS Long Form. The purpose was to seek construct validity
evidence, since such correlational approaches might demonstrate ex
pected empirical differences between certain groups of people.
The researcher hypothesized possible score differences for
education (since literature cites rising education as creating an
atmosphere conducive to the QWL movement), job clasB (since supervisors
have been described as being more negative toward QWL, due to their
reticence about a perceived "loss of authority"), and committee seat
(since it is logical that a OWL committee-seat holder could be expected
to be more favorable toward the program than employees with less
exposure). If these or other explainable differences in QWLAS scores
were surfaced, the instrument could reasonably be interpreted as assess
ing the trait it was designed to measure.
ANOVA tests were conducted on the data, with no significant
differences on composite scores emerging among respondents along the
variables of age, job class, number of years with the Department, or
sex. A four-way ANOVA comparing QWLAS scores for the variables com
mittee seat, ethnicity, education and Division revealed significant
main effects for committee seat and ethnicity. On Factor One (General),
committee seat significant effects (p <.05) were shown (F = 9.90, df =
1), as well as ethnicity significant effects (p< .05, F = 3.8 , df = 3).
On Factor Two (Specific Concerns), only committee seat effects were
significant (p<.05, F = 5.85, df = 1). On the total Long Form scores,
132
ethnicity effects were again significant at the p<r.05 level (F = 3.52,
df = 3)» as well as committee seat effects (p <.01, F = 10.63, df = 1).
Tables 25, 26, and 27 report one-way Analysis of Variance
results for Committee Seat and show that significant differences did
exist on the General, Specific Concerns and Total Long Form scores.
On Factor One, the group holding a committee seat had a mean of 3.17,
more favorable in QWL attitude than those not holding a committee seat
(M = 3«77). The Factor Two respective means were 3.89 and k.k6. Total
Scale means revealed the same directions, with groups achieving corre
sponding means of 3.56 and 4.17.
The significant difference in means between committee seat
holders and non-committee seat holders (p< .002, p<.00if, p <.0005) for
the two subscales and total scores for OWLAS Long Form contributed to
the instrument's construct validity. It was sensible to expect
employees elected to a QWL committee seat to demonstrate more favorable
attitudes toward the program and higher QWLAS scores if the Scale is
measuring the construct it claims to. Greater exposure to a program
improves attitudes, as opposed to its remaining an enigma to distrust
ful employees. Furthermore, Festinger's (1957) principles of cognitive
dissonance provide a theoretical rationale for committee seat members
expressing more favorable attitudes toward QWL. Dissonance theory
would maintain that QWL-involved employees, even those elected against
their initial wishes, would become more favorable in order to reduce
the psychological tension of what would otherwise be a discrepancy
between their attitudes and their public behavior. Thus, construct
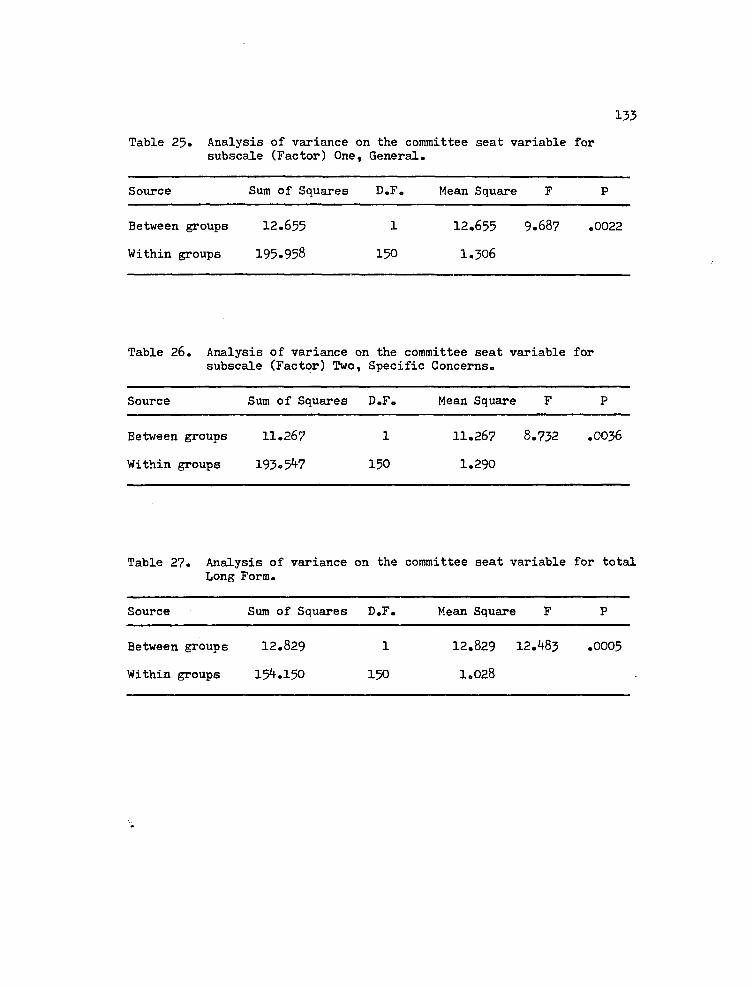
133
Table 25. Analysis of variance on the committee seat variable for subscale (Factor) One, General.
Source Sum of Squares D.F. , Mean Square F P
Between groups 12.655 1 12.655 9.687 .0022
Within groups 195-958 150 1.306
Table 26. Analysis of variance on the committee seat variable subscale (Factor) Two, Specific Concerns.
for
Source Sum of Squares D.F. Mean Square F P
Between groups 11.267 1 11.267 8.732 .0036
Within groups 193•5 7 150 1.290
Table 27. Analysis of variance on the committee seat variable for total Long Form.
Source Sum of Squares D.F. Mean Square F P
Between groups 12.829
Within groups 15 150
1
150
12.829 12.1+83 .0005
1.028
13
validity evidence stemmed from committee seat variable differences in
QWLAS scores.
Since overall main effects for ethnicity were significant be
tween groups, LSD multiple range procedures from the SPSS package were
used to test which pairs of ethnicity groups achieved differences.
Blacks (N = 5) were significantly more favorable (p<.05) than Whites
(N = 6*0 and Indians (N = 3) on Factor One, and significantly more
favorable (p<.05) than Whites, Mexican-Americans (N = 6*0 and Indians
on the total scale. On Factor One, Mexican-Americans scored signifi
cantly more favorably (p<.05) than Indians, but no other significant
findings occurred (note: Oriental ethnicity was omitted since its
sample of one did not comprise a true group).
No differences between ethnic groups were specifically expected
during construct validation, as were hoped for with the straightforward
variable of committee seat. However, Blacks demonstrated more favor
able attitudes toward the OWL, a program that attempts to equalize
decision-making power in the workplace and increases the participatory
rights and respect shown each grass roots worker.
This more positive disposition of Blacks toward the program is
explainable as due to the group's historical roots in equality-based
civil rights efforts. The greater appeal of QWL to Blacks can be
accounted for by an assumed awareness of, and affinity for, such social
movements seeking to humanize and improve the conditions of life for
minority groups. Further research could prove helpful in such theo
retical explorations, but the key focus of this study was the empirical
field testing of the QWLAS.
135
Summary
The QWLAS Long Form and QWLAS Short Form appeared to be excel
lent measures of attitude towards QWL programs. While principal factors
analysis yielded 21 factors rotated to a varimax solution, one strong
General and a second strong Specific Concerns factor existed, with no
evidence for utility of the original Ik subscales. Although the
General factor accounted for the most variance and was most related to
the total scale, the Specific Concerns factor warranted inclusion in
the final test, especially given its moderate correlation with Factor
One and its negatively criterial nature, useful in reducing response
bias.
Cronbach's alpha estimates of internal consistency produced
Long and Short Form coefficients of .95 and .93» respectively, as com
pared to the .96 value for the QWLAS Pilot Form. Reliability estimates
for the two factors were high enough in each form to warrant their use
as separate subscales. A third factor, labeled Control Scale, emerged
as a separate personality construct, different from QWL attitude (alpha=
.89). Evidence for face, content, concurrent, and construct validity,
of the QWLAS Long and Short Forms appeared strong.
The final QWLAS Long Form and Short Form are summarized in
Table 28, with their respective alpha coefficients, validity coeffi
cients, and Pearson Product Moment correlations with the 8*4—item Pilot
Form. The Long Form was found to actually raise the validity of the
QWLAS as compared with the Pilot version. Organizations employing the
QWLAS Long or Short form have cause for trusting the instrument's
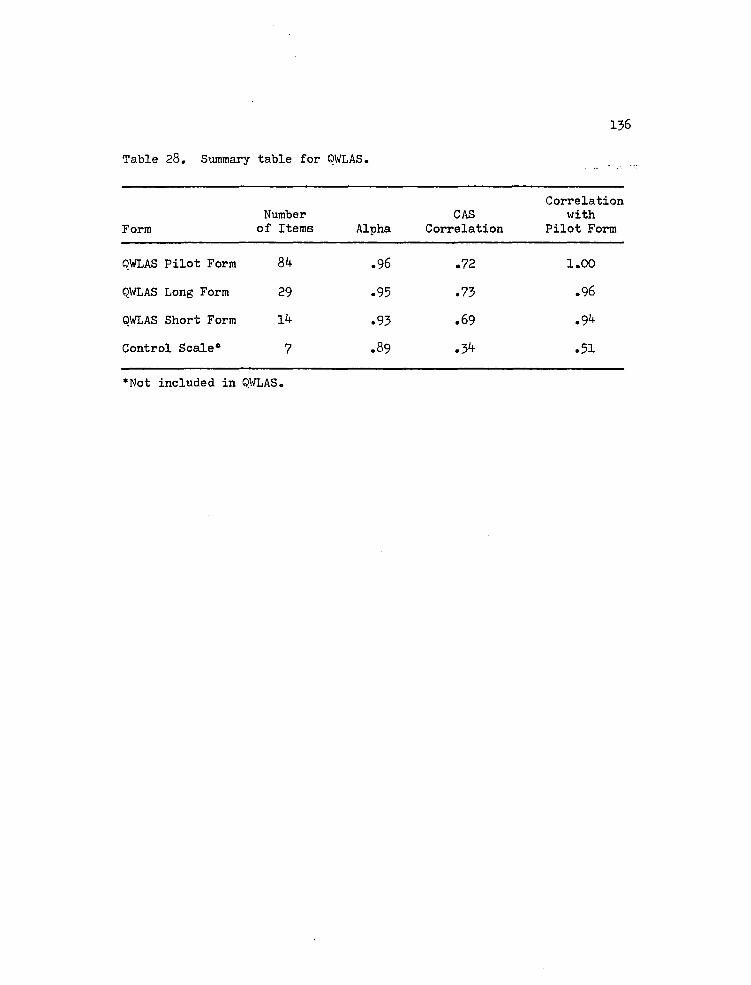
136
Table 28. Summary table for OWLAS.
Form Number
of Items Alpha CAS
Correlation
Correlation with
Pilot Form
OWLAS Pilot Form 84 .96 .72 1.00
QWLAS Long Form 29 .95 .73 .96
QWLAS Short Form l b .93 .69 .94
Control Scale* 7 .89 •3/+ .51
•Not included in QWLAS.
137
reliability and validity. Appendices L and M present each version in
its final form, with randomly-determined item order and identical
instructions as those employed in the Pilot Form.

CHAPTER 5
SUMMARY, CONCLUSIONS AND RECOMMENDATIONS
Summary
The emergence and growth of the Quality of Working Life (QWL)
movement in this country is the culmination of a variety of social,
economic, political, and technological developments which cultivate
fertile ground for this workplace reform that institutionalizes employee
participation and democratization. This study focused upon the con
struct of worker attitudes toward this new concept of organizational
change.
The study's main purpose was to develop and field test the
Quality of Working Life Attitude Scale (QWLAS), because existing litera
ture showed a gap in QWL evaluation and research of instruments tapping
the important variable of employees' attitudes toward the change pro
gram itself. Four major research questions were formulated, and their
resolution served as objectives to be reached through construction and
pilot-testing of an 84-item, Likert-type inventory: (1) What basic
factors comprise the concept of QWL attitude as measured by the QWLAS?;
(2) What items can comprise the final QWLAS Long Form and Short Form
without significantly lowering scale reliability?; (3) Is the QWLAS a
reliable psychological instrument?; and (4) Is the QWLAS a valid
psychological instrument?
138
139
A broad-based perspective was gained through a review of general
research on attitude theory, attitude change, and psychometric measure
ment. The more esoteric attitude assessment literature provided
specific methodological guidance toward the selection of instrument and
item formats, construction of the actual Scale, and statistical obser
vations required for field testing and validation.
Originally, fourteen rationally-determined subscales formed a
conceptual framework for the inventory and provided content validity,
based upon a theoretical OWL schemata postulated by Herrick (198la), a
pioneer in these joint labor-management workplace democratization ex
periments. An initial pool of attitude statements around this classi
fication system was generated from a variety of sources, including the
involvement of the research subjects and literature consultation.
Through extensive filtering of the OWL statements through attitude scale
writing criteria, screening, and editing, as well as a content-based
sorting by a panel of judges, the 84-item QWLAS Pilot Form was final
ized, consisting of 39 positively worded and negatively worded items.
The Pilot QWLAS was distributed to 303 employees in the Depart
ment of Transportation and Flood Control District of Pima County of
Tucson, Arizona, following approval of proposed procedures by the
University Human Subjects Committee. The completed attitude scales of
179 respondents indicated the sample's mixture of demographic variables,
including subjects of varying ethnic origins, years of experience within
the County, degrees of current involvement in the OWL program, levels
of education and job classifications. Psychometric data were statisti
cally treated using the Statistical Package for the Social Sciences

I<t0
(Nie and Hull, 1975) in order to answer the research queries about
underlying QWLAS factor structure, appropriate Long and Short Forms,
Scale reliability and Scale validity.
Confirmatory factor analysis employed a principal factors analy
sis with a varimax rotation, as well as coefficient alpha tests of
internal consistency and subscale intercorrelations, and revealed that
the initial rationally devised subscales did not possess sufficient
factoral validity, homogeneity, or statistical independence to warrant
their being kept intact for the final forms.
Exploratory factor analysis surfaced 21 factors with eigen
values over 1.00, but only two of these emerged as strong factors with
five or more items loading at the .50 level or greater. The first of
these two interpretable factors was established as involving a more
general attitude about the theory of the OWL program, appropriately
labeled the General Subscale, consisting of 17 positively criterial
items. The second subscale, entitled Specific Concerns, consisted of
12 negatively criterial items tapping attitudes toward more specific
realities of the program's existence. This basic structure is congruent
with the notion that individuals tend to have one set of reactions
toward a program in theory, which are usually mitigated by a second set
of sentiments which take into account the more practical, everyday im
pacts of the change effort.
A third weaker factor, the Control Scale, emerged as an inter
nally consistent personality construct believed to be separate from OWL
attitude and potentially useful for assessing an emotional dimension
related to QWL acceptance. Several extensive item analysis procedures
lk l
applied to the 29 items in the Long Form led to a 14-item Short Form
which yielded scores on the same two factorally-determined subscales,
as well as a Total Score. While appearing as separate constructs in
the factor analysis, the researcher does not recommend the use of the
Scale's two components as separate subscales for diagnostic purposes;
rather, the balance of the QWLAS is believed to be maintained through
the intact use of the entire instrument.
Cronbach's alpha estimate of reliability yielded high coeffi
cients of .96, .95, and .93 for the Pilot Form, Long Form, and Short
Form, respectively. Furthermore, the General and Specific Concerns
Subscales each demonstrated high alpha coefficients of .9 and .92 for
the Long Form, and .91 and .88 for the Short Form.
All forms were reviewed favorably against face, content, con
current and construct validity. Subjects from the Department of Trans
portation participated in decisions involving selection of Scale state
ments, contributing to content and face validity. Statistically
significant correlations were found between QWLAS means and respondents'
self-ratings of their QWL attitudes on Reddin's (1970) Change Accep
tance Scale applied to QWL, showing a high degree of concurrent
criterion validity. Construct validation was evidenced by Analysis of
Variance tests, which revealed that the QWLAS discriminated markedly
among subjects by OWL committee seat status and ethnicity.
Limitations
The restrictions of the study influenced the conclusions, and
assisted in formulating recommendations for further research.
142
1. The Likert summated rating format of the Quality of Working Life
Attitude Scale means that there is no absolute value of a score on any
psychological continuum underlying the Scale. That is, there is no
"real meaning" of the attitude score independent of the scores' distri
bution for this group of subjects, because the items were not scaled
according to how favorable they were toward OWL. Thus, the neutral
point is unknown and interpretation is limited to group attitude pat
terns.
2. No control for representative sampling was achieved on any of
the biographical, independent variables because sample procurement was
based solely upon personnel pool characteristics that prevailed in the
field setting. Some sampling bias occurred, as in any questionnaire-
based study, since results were based only upon members of the popula
tion who were willing to complete and return the Scale.
3. A major limitation of this study lies in its minimal sample size
for the factor analysis portions of treatment of the data. Kerlinger
(1973) suggests ten items for every subject, and an even less stringent
criterion for a subject pool of 2-1/2 times the number of items was not
realized (Powers, 1982).
k. No measure was employed to tap the extent to which respondents
answered in ways they thought socially desirable. Reynolds and Greco
(1980) have noted that in the measurement of attitudes toward socially
potent stimuli, this response bias of social desirability can confound
results. This drawback may be even more prevalent in a field setting
as opposed to academic environments.
3A3
5. Completion rate was undoubtedly decreased because of the length
of the QWLAS Pilot Form demanded in the field-testing stage; presumed
resentment by some workers of anything connected with QWL, thereby in
troducing sampling bias into the results; and the mailing-type distri
bution for the Divisions of Operations and Field Engineering, which also
may have produced less concentration on the task than is assumed for
respondents administered the Scale in meetings with the researcher.
Additionally, some.subjects complained of frustration with the small
print chosen for paper conservation and the overly-sophisticated wording
of some items, hindering comprehension. The expressed distrust of
management most likely influenced the high omission rate for the personal
bio-data sections, due to fear of being identified by the organization.
6. The content-based sorting by judges of the pilot items into
their original subscales occurred only once, before revisions. A
second sorting and reported percentages of categorization agreement
would have been desirable, even though the Subscales were disconfirmed
for many reasons beyond this inter-judge sorting.
7. The Change Acceptance Scale (CAS) used for concurrent valida
tion should have been administered before the 8 Likert-styled items,
so that it could have been independently responded to before respon
dents' thoughts were stimulated by the content of the other attitude
statements. Also, it would have been helpful to use judges to sort the
order of the CAS verbal cue words ("Protests," "Apathy," "Support,"
etc.), so as to anchor the continuum's ordering on an empirical, rather
than intuitive basis.
Ikk
8. Weighting of the response categories with higher numerical
weights corresponding to more favorable OWL attitudes ("Strongly Agree")*
rather than this study's higher weight on "Strongly Disagree," would
have facilitated score discussions associating higher scores with a
more positive disposition toward QWL.
9. The Gap Scores (Items 85-92) were omitted from statistical
treatments due to their impracticability. These items were to have been
calculated by subtracting a subject's response weight on Part A of the
item from Part B, but the variety of response patterns that could lead
to the same resultant Gap Score rendered interpretation unwieldy and
ambiguous. Other more easily manipulatable indices should be substi
tuted for concurrent validity, such as the CAS.
Recommendations for Scale Development
The above limitations have implications for the development of
the QWLAS which are outlined below, along with additional suggestions
for strengthening the psychometric properties of the instrument.
The validity evidence described in this study can be even
further improved through continued validation, recommended for any
experimental scale. Factor analysis replication studies are required
to verify the two-factor results of this study. Larger and different
samples are suggested for cross-validation of the QWLAS.
Future research designs need to explore the factor results of
this study to determine whether the true source of variance is due to
the factors' labeled General and Specific Concern nature or, in fact,
due to their positively criterial versus negatively criterial wording.
The first factor's theoretical focus and second factor's more
3>5
operational focus may influence the direction of wording characterizing
the items loading on each respective factor, but any such relationship
is not explained by this study's findings.
Greater construct and criterion-related validation are necessary,
both of the predictive and concurrent variety, and the multi-trait-
multi-method matrix ideal of Campbell and Fiske (1967) can be a "north
star" in QWL attitude research. Concurrent validation is needed using
overt behavioral measures such as supervisor ratings of worker involve
ment in QWL, comparisons among groups for number of regular QWL meetings,
proposal generation and similar criteria.
Within the framework of this initial validation study, experi
mental studies are further warranted to ascertain the sensitivity of
the QWLAS to QWL attitude change during longitudinal studies. Addi
tional exploration of construct validity is encouraged, through other
personality measures, such as authoritarianism, previously related to
QWL acceptance (Herrick, 1975). The Control Scale, which emerged in
this field testing as a separate factor with high reliability (.89),
needs to be related to authoritarianism (F-scales) and investigated for
its use in further research, since it may represent an underlying
personality trait, as well as being QWL-specific.
Future research could benefit from concurrent administration of
the Crowne-Marlowe Social Desirability Scale (Crowne and Marlowe, i960)
in order to rule out social approval as a variable in subjects' re
sponses. Similarly, research is needed to isolate attitudes toward
change in general as discriminated from attitudes specific to a QWL
change effort; therefore, some sort of "rigidity" or related measure
146
needs to be administered as part of the validation battery. Naturally,
such extended test administration may not be feasible in field settings
due to the time involved. Nevertheless, research should be conducted
in academic settings, as well as those organizations willing to partici
pate in the interest of advancing research in the OWL movement.
More rigorous sampling controls are recommended, possibly
through coding respondents' inventories, since such procedures would
facilitate test-retest and longitudinal assessment of OWL attitudes.
Additionally, while the original subscales were disconfirmed in this
initial QWLAS field testing and validation, some of these clusters, if
more items are written, may demonstrate better reliability and a sepa
rate factor structure, as did the Control Scale in this sample.
Recommendations for Scale Use
Prospective users of the QWLAS need to take heed of Anastasi's
(1968) regard of most attitudes scales as experimental in their status
(Anastasi, 1968, p. 487) and, as such, the QWLAS should not be used for
predictive purposes, at least until after future validation. QWLAS use
for investigation of pre-post organizational attitudes and ongoing
assessment of OWL acceptance does seem warranted, particularly on a
group basis, since concurrent validity has been established. Further
research questions have been provoked by the ethnicity findings and lack
of expected differences along job classification lines. Additional
theoretical explorations are suggested by demographic variable results,
such as blue collar-white collar differences, impact of education on
OWL attitudes and supervisor versus grass-roots worker reactions.
1^7
Program practitioners are urged to consider attitude scale
administration as a tool in facilitating QWL acceptance, since the OWLAS
can assist in targeting particular components of the system needing
attention in orientation, follow-up training and system maintenance.
Of course, the substantive nature of specific questions will temper the
utility of the OWLAS for this purpose, and program evaluators deviating
from the suggested items in the QWLAS Long Form and Short Form, in
order to discover reactions to a particular aspect of interest, should
attend to the item analysis data for each item they employ. Beyond the
addressing of content-specific dimensions, the opportunity for ventila
tion of attitudes and data feedback to employees may be healthy for
adjustment to any organizational change.
Determining the effects of the measurement process itself upon
subsequent data collected is difficult, as discussed by Salancik and
Pfeffer (1978). They warn that "measuring attitudes calls attention
to problems that otherwise may have had only minor salience or may not
have existed at all" (Salancik and Pfeffer, 1978, p. 2 2). This danger
of actually creating attitudes, especially negative ones, is mitigated
by the Scale's including one-half positively criterial and one-half
negatively criterial items.
Conclusions
The intent behind this study was to advance the "state of the
art" of research in the Quality of Working Life (QWL) movement taking
place on the American work scene, through the construction and field
testing of an instrument for assessing the OWL-related attitudes of
organization members. The psychometric data observed through pilot
148
testing of an 84-item, Likert-style attitude scale suggest that one such
tool, the OWLAS, does reliably and validly discriminate among individ
uals holding favorable versus unfavorable OWL dispositions.
QWL, as a joint union-management venture electing mutual benefit
problem-solving committees on which both labor and management sit in
equal representation, has shown promise through various experiments
across this country since its 1972 inception. The importance of OWL as
a type of workplace reform is increased in these times of economic
stagnation, crisis in worker alienation, and ineffectiveness of adver
sarial union-management relations in improving productivity and human
izing working conditions. The breakneck pace of change worsens the
situation, increasing environmental turbulence and complexity. This
need for tapping the wellspring of worker resources in solving work
place problems is accompanied by a timely evolution toward less auto
matic subservience and greater equality and participative influence by
persons of different status in all spheres of society.
It would be folly to automatically assume QWL enthusiasm on the
part of all employees of an organization contemplating the initiation
of such a cooperative democratization project. The installation of QWL
committee structures is accompanied by its social-emotional climate,
which has great impact on the prognosis of the program. Availability
of a reliable, valid indicator of QWL attitudes, such as the OWLAS, is
important for forwarding the growth of such projects, especially given
the thread of participation-based involvement running through OWL's
philosophy, procedures and structures.
1^9
QWL's democratic directions and broader, macro-organizational
ramifications render it no less than a true social movement, beyond
interpersonally-focused organizational change efforts which are typi
cally micro-organizational in their scope. Comprising such a social
movement, QWL's extension of democracy, evolution of social responsi
bility, and cultivation of a participatory democratic consciousness
require the kind of attitude measurement Remmers (195*0 deems critical
for any "science of society" (Remmers, 195*S P» 16). It is therefore
hoped that organizations and academia will experiment with the QWLAS
or similar instruments to further establish the research sophistication
of investigating individual and group attitudes toward Quality of Work
ing Life endeavors. Attitude scales tapping the intensity of one's
attitude are desirable for research purposes.
Practitioners of organizational development have typically been
tunnel-visioned in their "bottom-line" focus on economic outcomes of a
program, ignoring the dynamics of change, as could be explored through
the QWLAS's focus on attitudes toward an intervention. Organizations
may additionally benefit from the adoption of the QWLAS: at program
outset to assess the climate for change; throughout the program to
"take the pulse" of workers on an ongoing basis; over the course of a
project, monitoring the longitudinal appeal of the experiment; and
possibly as a diagnostic and predictive tool.
APPENDIX A
MEANS-END RELATIONSHIPS IN THE WORKPLACE
Courtesy of N. Q. Herrick
150
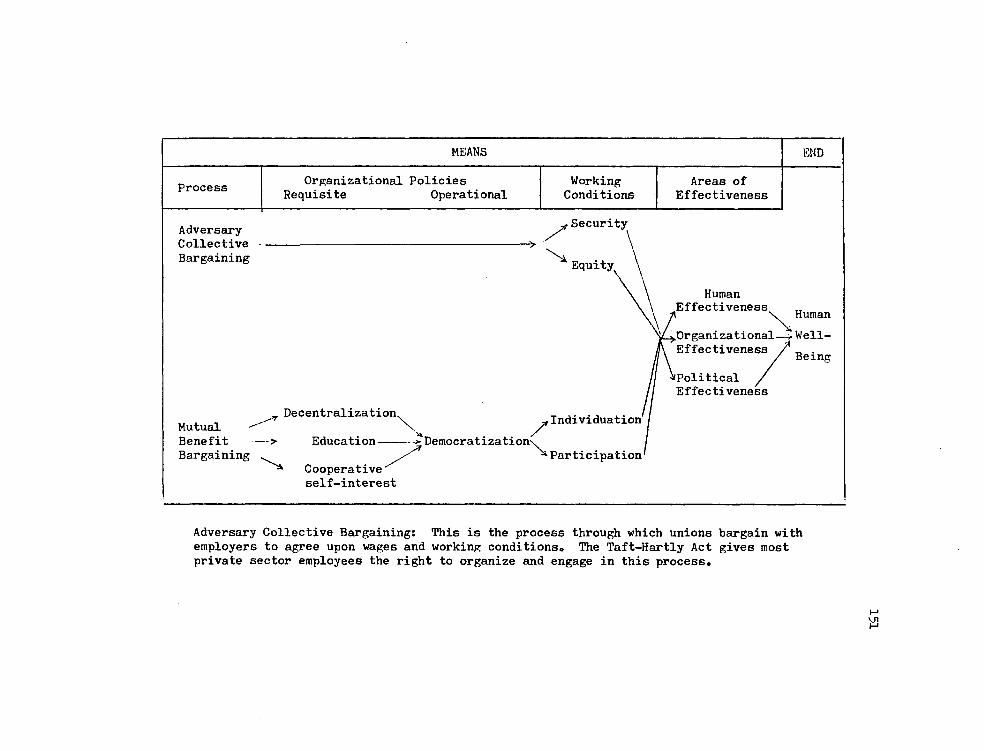
MEANS END
Process Organizational Policies
Requisite Operational Working Conditions
Areas of Effectiveness
Adversary Collective Bargaining
Security
Equity
Mutual Benefit Bargaining
Decentralization.
X y Education —> Democratization-
k Cooperative self-interest
Individuation
Participation
Human Effectiveness
Organizational -Effectiveness
Political Effectiveness
Human
IWell-
Being
Adversary Collective Bargaining: This is the process through which unions bargain with employers to agree upon wages and working conditions. The Taft-Hartly Act gives most private sector employees the right to organize and engage in this process.
Mutual Benefit Bargaining: This is a proposed process through which unions and employers could reach contractual agreement on matters which are in the best interests of both. Already, some unions and employers engaged in joint quality of working life experiments are developing non-enforceable memoranda of understanding dealing with such matters.
Education: An education policy assures that every employee is provided with opportunities for mastering his own job, preparing himself for higher-level jobs, and obtaining the knowledge and skills which he needs in order to participate, directly and indirectly, in the management of the enterprise.
Cooperative Self-interest: To pursue a policy of cooperative self-interest is to develop and install systems which reward all members of a group for the quantity and quality of the group's activity. For larger groups of up to 1500 persons, the most appropriate rewards are economic (i.e., productivity sharing). For smaller subgroups of from 10-50 persons, the rewards are generally non-economic (e.g., feedback, recognition, competence development). For maximum effectiveness, cooperative self-interest should function at both levels.
Decentralization: Decentralization is the delegation of authority to make decisions to the lowest appropriate organizational level. When authority is delegated below the lowest formal organizational level to individual workers or to groups of workers, the working conditions thereby presented are termed respectively individuation and participation.
Democratization: A democratization policy provides the worker with a structure through which he can influence his working environment. In this essay the term refers specifically to the recent U.S. practices of establishing (a) worker-supervisor committees for each organization and at each organizational level and (b) problem-solving teams crossing organizational boundaries. It refers only to situations where the worker members of such committees and teams represent and are elected by constituencies of their fellow workers.
Security: Security is present in the workplace to the extent the worker is free from anxiety concerning his health, safety, income adequacy and job security.
Equity: Equity exists to the extent a work system is fair in terms of promotions, assignments, compensation, work standards and the absence of discriminatory practices.
Individuation: Individuation is present in the form of opportunities. The worker has opportunities for increasing his autonomy, knowledge, skills, the portion of a product or service which he produces, and the extent to which his job satisfies his desire for craftmanship.
Participation: Participation is an activity enabled and promoted by a democratization policy. It is of two sorts: direct and indirect. Direct participation is present in the work group when the first-level supervisor has delegated authority to the group to make operational decisions. It is also present for worker representatives, since they present their own as well as their fellows' views in committee and team meetings. Indirect participation exists where rank and file workers exert influence through their elected representatives.
Organizational Effectiveness: An organization is effective when it is able to survive over an extended period of time, provide useful goods and/or services to the public, produce these goods and services in an efficient manner, and provide economically, physically and psychologically enriching employment to its members.
Human Effectiveness: This is a person* s ability to control his immediate environment through direct action. Conditions such as individuation and direct participation make it possible for him to exercise this competence at work. They also tend to strengthen this competence so that it can be exercised in a person's non-work life.
Political Effectiveness: A person is politically effective when he is able to influence his environment through exercising control over the political system. Experience gained in controlling one's representatives at work can contribute to one's effectiveness in local and national politics.
Human Well-being: The end of work and, indeed, of all human activity, is intellectual, physical and emotional pleasure which is induced by one's own activity and which harms no-one else. This pleasure is assisted by favorable external (i.e., economic and

environmental) circumstances and arises, in part, from contributions made to the pleasure of others through one's cooperative activity (Herrick, 198la).
APPENDIX B
PIMA QUESTIONNAIRE*
•Permission granted by the author, Neal 0. Herrick.
155
PIMA COUNTY QWL QUESTIONNAIRE
Introduction
As part of your QWL program, the University of Arizona QWL staff is collecting information on working condi
tions, satisfaction, services to the public, and the quality of supervision. In this way we will be able to tell
whether the QWL committee system is on track. We may also be able to provide the QWL committees with
some information which will help them recognize problems to be addressed, and to provide other organizations
with information which may help them in deciding whether or not to have a QWL program. This information,
however, will be aggregated to include large groups of answers. The reason we are asking some "off-the-job"
questions is to see if there is any connection between what happens at work and things like health and
life satisfaction.
Your individual questionnaire will be kept confidential. To assure this confidentiality, we will develop identi
fication numbers for information that does not appear in your employment records. The purpose of these
identification numbers is to enable us to make comparisons of an individual's responses on this questionnaire
with responses to questionnaires he or she may take in the future. Only you will be able to match your name
with a questionnaire identification number. Individual responses to the questions in this booklet will be pro
cessed by computers and will be reported only in summary form. All individual questionnaires will be returned
to the University of Arizona QWL Service Center and will remain there under the confidentiality safeguards of
the Center. It is up to you whether or not you wish to complete this questionnaire. We do, of course, hope that
you participate. However, we want to make sure that everyone who completes a questionnaire does so willingly -
and we will assume that this is so.
Thank you for your cooperation.
The University of Arizona QWL Staff
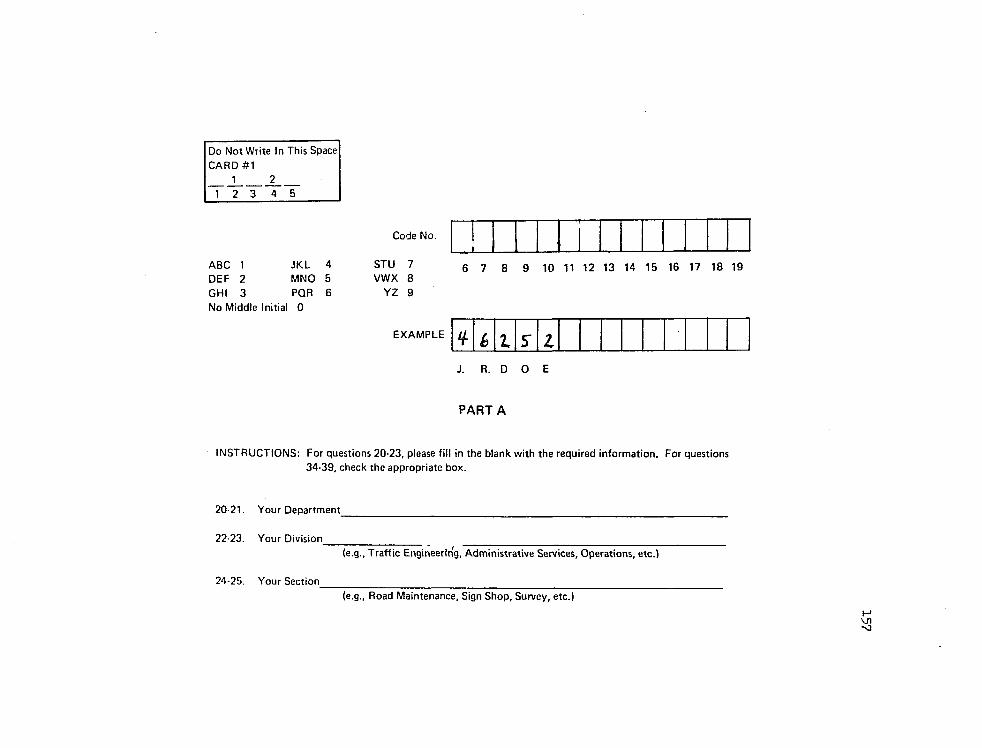
Do Not Write In This Space
CARD #1
1 2 12 3 4 5
Code No.
ABC 1 JKL 4 STU 7 6 7 8 9 10 11 12 13 14 15 16 17 18 19 DEF 2 MNO 5 VWX 8
GHI 3 PQR 6 YZ 9
No Middle Initial 0
EXAMPLE
J. R. D O E
PART A
INSTRUCTIONS: For questions 20-23, please fill in the blank with the required information. For questions
34-39, check the appropriate box.
20-21. Your Department
22-23. Your Division
(e.g., Traffic Engineering, Administrative Services, Operations, etc.)
24-25. Your Section
(e.g.. Road Maintenance, Sign Shop, Survey, etc.)
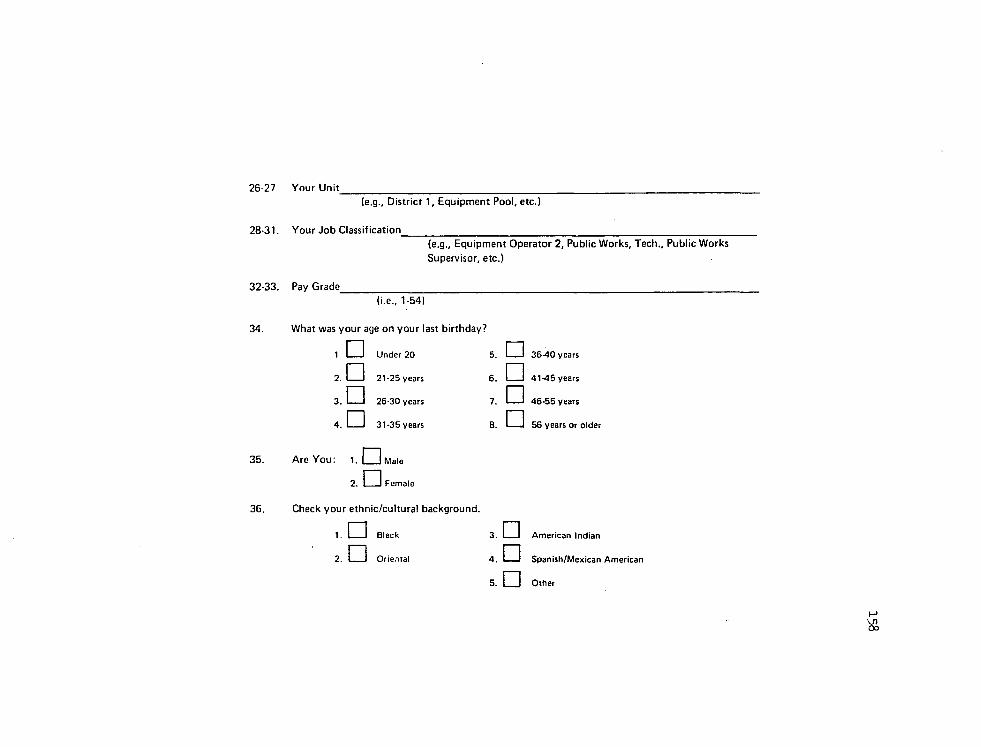
26-27 Your Unit
(e.g., District 1, Equipment Pool, etc.)
28-31. Your Job Classification
(e.g., Equipment Operator 2, Public Works, Tech., Public Works
Supervisor, etc.)
32-33. Pay Grade_
34.
35.
36.
(i.e., 1-54)
What was your age on your last birthday?
Under 20
21-25 years
.• 26-30 years
.• 31-35 years
• • • •
36-40 years
41-45 years
46-55 years
56 years or older
Are You: !.• Mala
Female
Check your ethnic/cultural background.
1. 1 1 Black 3.
Oriental 4.
5.
• • •
American Indian
Spanish/Mexican American
Other
h-1
00
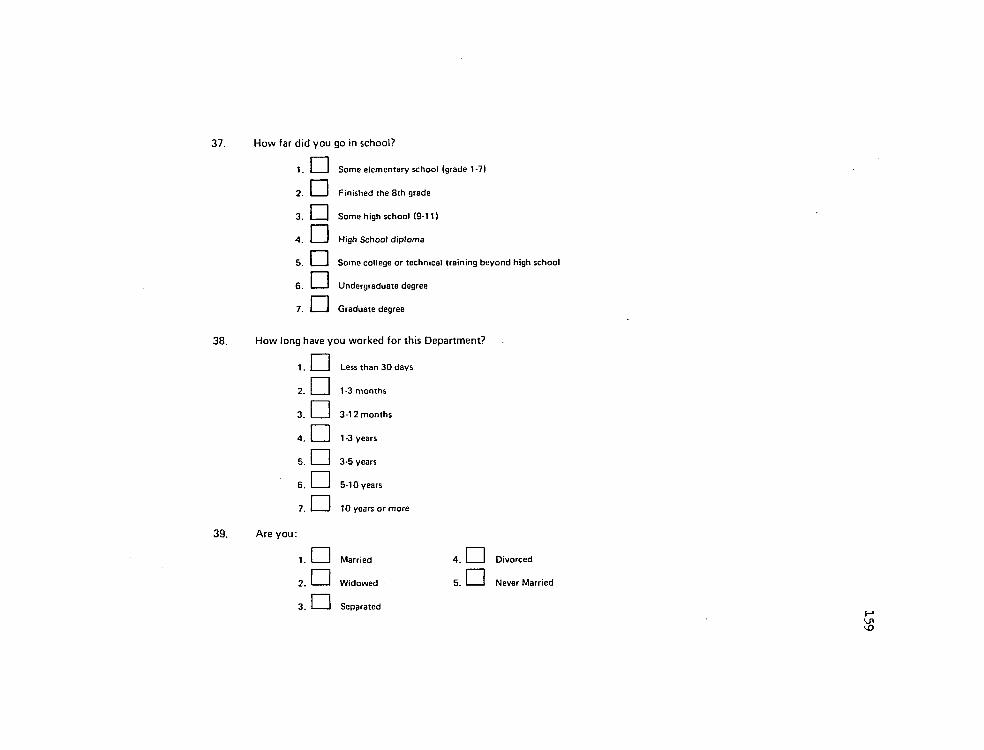
37. How far did you go in school?
Some elementary school (grade 1-7)
Finished the 8th grade
Some high school <9-11J
4. 1 1 High School diploma
Some college or technical training beyond high school
Undergraduate degree
Graduate degree
38. How long have you worked for this Department?
39. Are you:
• • • • • • •
• • •
Less than 30 days
1-3 months
3-12 months
1 -3 years
3-5 years
5-10 years
10 years or more
Married
Widowed
Separated
* . • D i v o r c e d
Never Married
Ul vO

PART B For Non-Supervisory Employees Only
INSTRUCTIONS: For each statement, please indicate how true you feel it is by circling the answer of your
choice.
40. It helps me personally if I make my
co-workers look good.
41. If I ever need a helping hand, my
co-workers are eager to pitch in.
42. My co-workers go out of their way
to make me look good because when I
do well it helps them.
.a <# / /
£
PART C For Everyone
INSTRUCTIONS: Please indicate how true you feel each statement is by circling the answer of your choice.
/ j J
f / i ,/ ' A." £ /
-/ / / / 43. I have to ask my boss before I do almost anything. 12 3 4
v
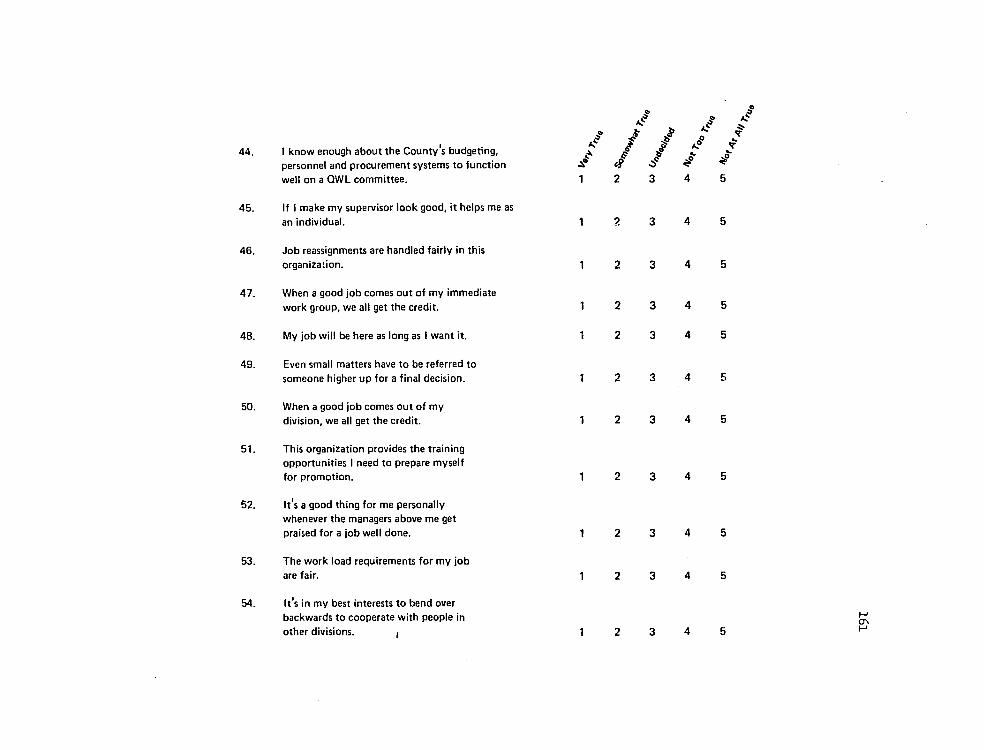
44. I know enough about the County's budgeting,
personnel and procurement systems to function
well on a QWL committee.
45. If I make my supervisor look good, it helps me as
an individual.
46. Job reassignments are handled fairly in this
organization.
47. When a good job comes out of my immediate
work group, we all get the credit.
48. My job will be here as long as I want it.
49. Even small matters have to be referred to
someone higher up for a final decision.
50. When a good job comes out of my
division, we all get the credit.
51. This organization provides the training
opportunities I need to prepare myself
for promotion.
52. It's a good thing for me personally
whenever the managers above me get
praised for a job well done.
53. The work load requirements for my job
are fair.
54. It's in my best interests to bend over
backwards to cooperate with people in
other divisions. , 1 2 3 cr\
4 5 ^

55. My job security is good.
56. If upper-level management would delegate
more authority down the line, we could
do a better job.
57. If I ever need a helping hand, my supervisor
is glad to pitch in.
58. I know what is required in the way of
courses at the University of Arizona or
Pima Community College to prepare
myself for the specific jobs I would like
to hold in the future.
59. Promotions are handled fairly in this organization.
60. There is little chance that I will be laid off
during the next year.
61. The education I need in order to reach my
goals is available to me.
62 My Supervisor has to ask his/her boss before
doing almost anything.
63. Merit raises are handled fairly in this
organization.
1 2 3 4 5
1 2 3 4 5
1 2 3 4 5
1 2 3 4 5
1 2 3 4 5
1 2 3 4 5
1 2 3 4 5
1 2 3 4 5
1 2 3 4 5
H CT\ ru
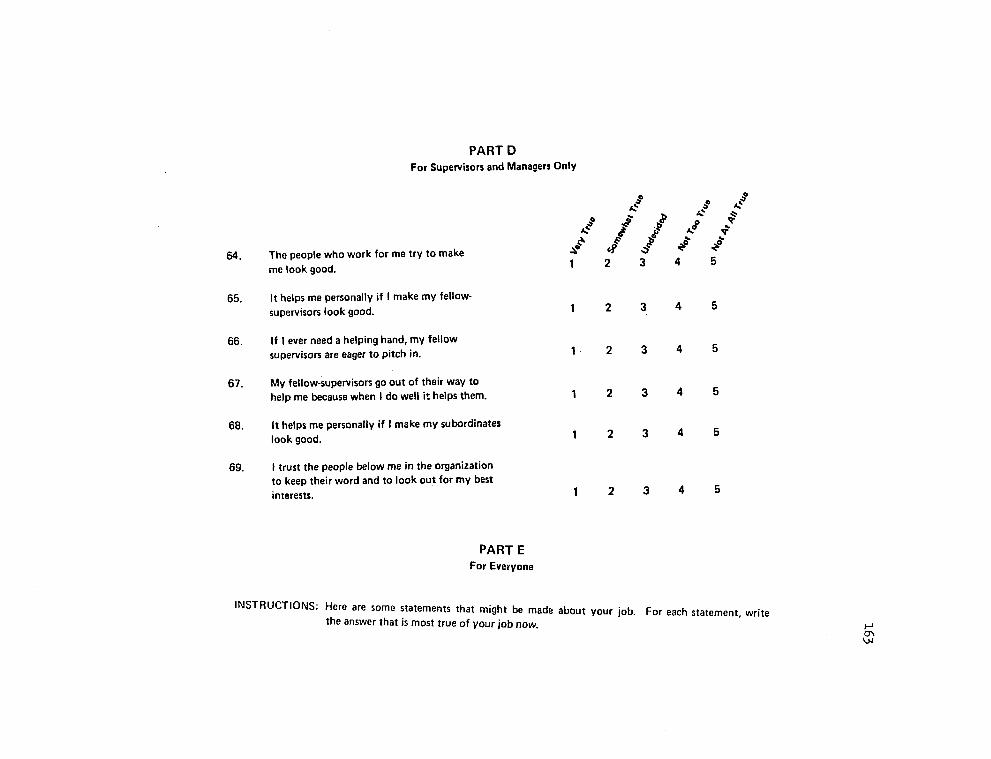
PART D For Supervisors and Managers Only
jC* .O *»
^ P £ $ ^ *
/ / / / / 1 2 3 4 5
64. The people who work for me try to make
me look good.
65. It helps me personally if I make my fellow-
supervisors look good.
66. If I ever need a helping hand, my fellow
supervisors are eager to pitch in.
67. My fellow-supervisors go out of their way to
help me because when I do well it helps them.
68. It helps me personally if I make my subordinates
look good.
69. I trust the people below me in the organization
to keep their word and to look out for my best
interests.
1 2 3 4 5
1 2 3 4 5
1 2 3 4 5
1 2 3 4 5
1 2 3 4 5
PART E For Everyone
INSTRUCTIONS: Here are some statements that might be made about your job. For each statement, write the answer that is most true of your job now.
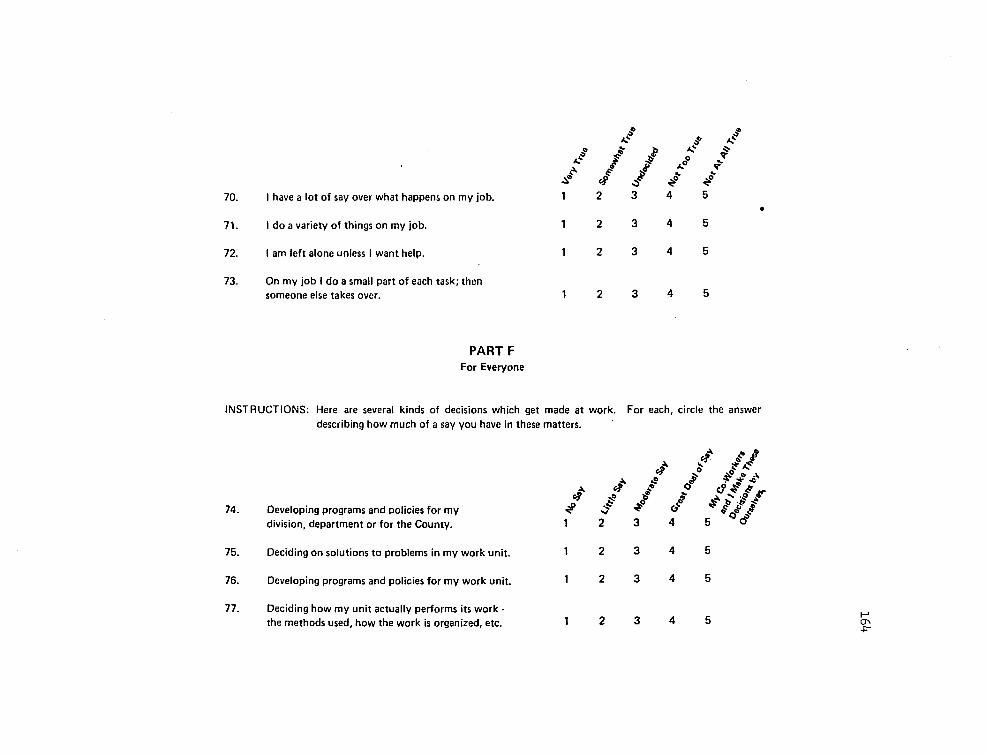
70. I have a lot of say over what happens on my job.
71. I do a variety of things on my job.
72. I am left alone unless I want help.
73. On my job I do a small part of each task; then
someone else takes over.
/C
A" 1
1
1
<9 2
* $ * $
' /
2 3
2 3
c> a:" o* ^ & *
4
4
4
PART F For Everyone
INSTRUCTIONS: Here are several kinds of decisions which get made at work. For each, circle the answer
describing how much of a say you have in these matters.
74. Developing programs and oolicies for my
division, department or for the County.
75. Deciding on solutions to problems in my work unit.
76. Developing programs and policies for my work unit.
* 1
1
1
4"
>/ ^ 2 3
/ / *
*V// & 4
77. Deciding how my unit actually performs its work -
the methods used, how the work is organized, etc. 1 2 3 4 5 & -p-
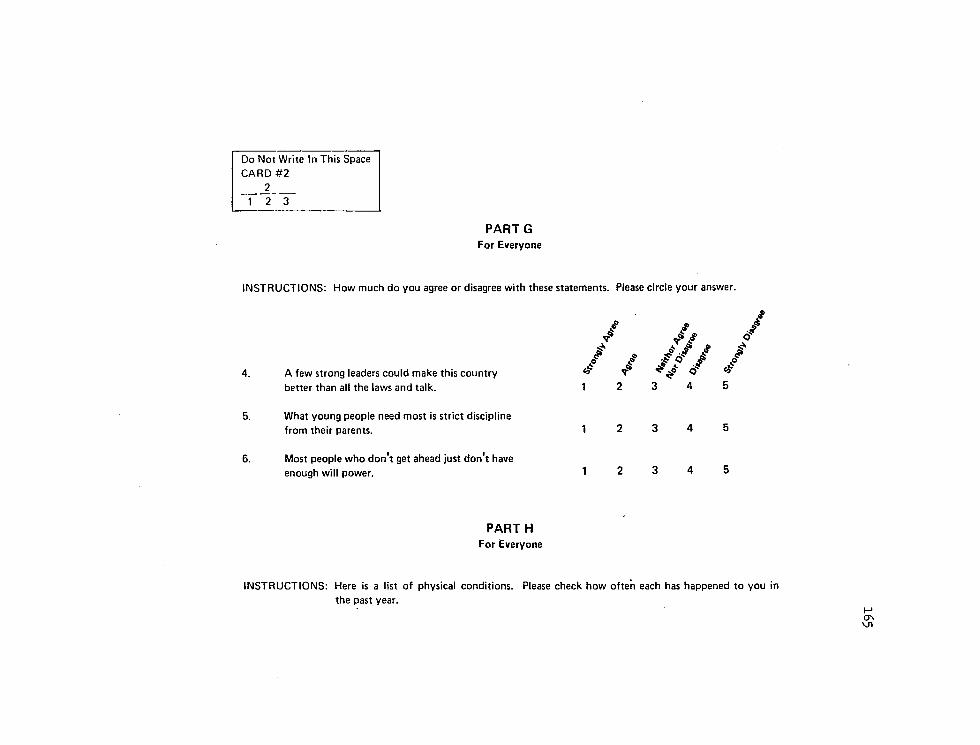
Do Not Write In This Space
CARD #2
2 1 2 3
PART G For Everyone
INSTRUCTIONS: How much do you agree or disagree with these statements. Please circle your answer.
A few strong leaders could make this country
better than all the laws and talk.
* /
// //./
3 4
4?
5. What young people need most is strict discipline
from their parents.
6. Most people who don't get ahead just don't have
enough will power.
PART H For Everyone
INSTRUCTIONS: Here is a list of physical conditions. Please check how often each has happened to you in
the past year.
CT\ VJl
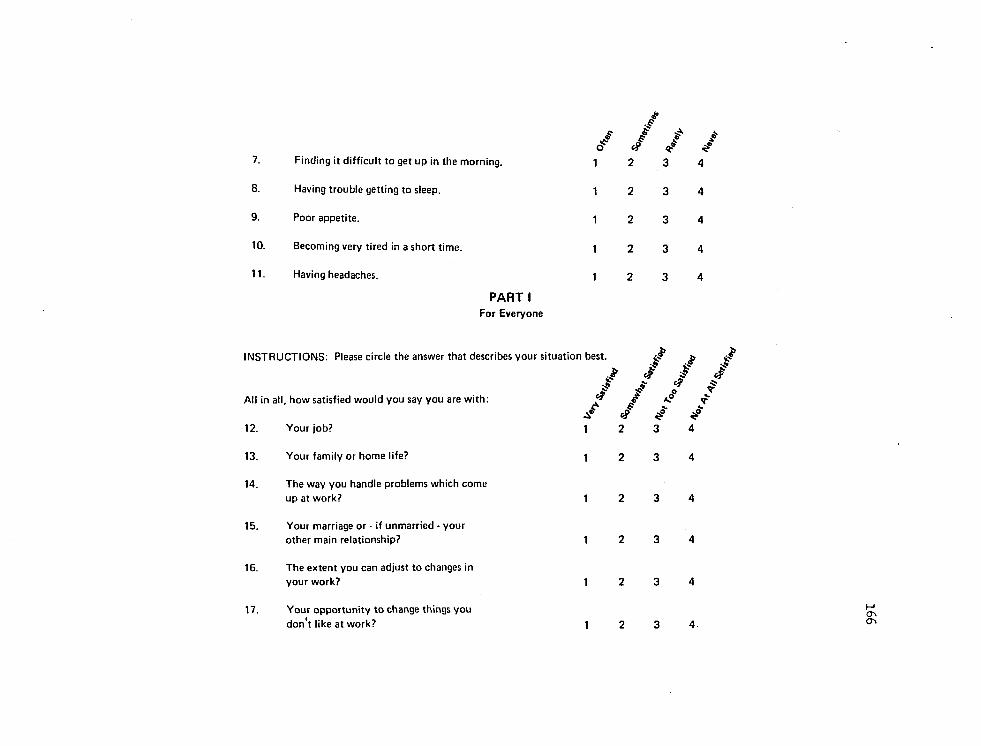
a 7. Finding it difficult to get up in the morning. 1
8. Having trouble getting to sleep. 1
9. Poor appetite. 1
10. Becoming very tired in a short time. 1
11. Having headaches. 1
PART I For Everyone
INSTRUCTIONS: Please circle the answer that describes your situation best.
/ All in all, how satisfied would you say you are with:
/ 12. Your job? 1
13. Your family or home life? 1
14. The way you handle problems which come
up at work? 1
15. Your marriage or - if unmarried - your
other main relationship? 1
16. The extent you can adjust to changes in
your work? 1
17. Your opportunity to change things you
don't like at work? 1
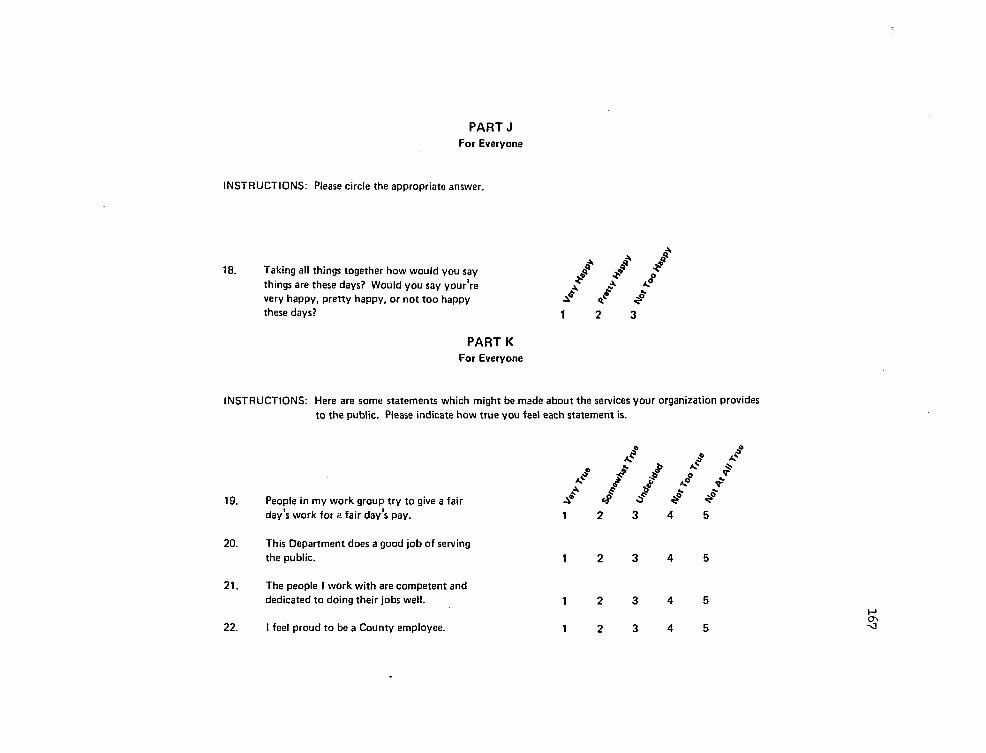
PART J For Everyone
INSTRUCTIONS: Please circle the appropriate answer.
A * 18. Taking all things together how would you say ^
things are these days? Would you say your're ^ ^
very happy, pretty happy, or not too happy -2? ^
these days? 12 3
PART K For Everyone
INSTRUCTIONS: Here are some statements which might be made about the services your organization provides
to the public. Please indicate how true you feel each statement is.
19. People in my work group try to give a fair
day's work for a fair day's pay.
<•
1 c?
/ ^ / / a*
20. This Department does a good job of serving
the public.
21. The people I work with are competent and
dedicated to doing their jobs well.
22. I feel proud to be a County employee. cr\ -o
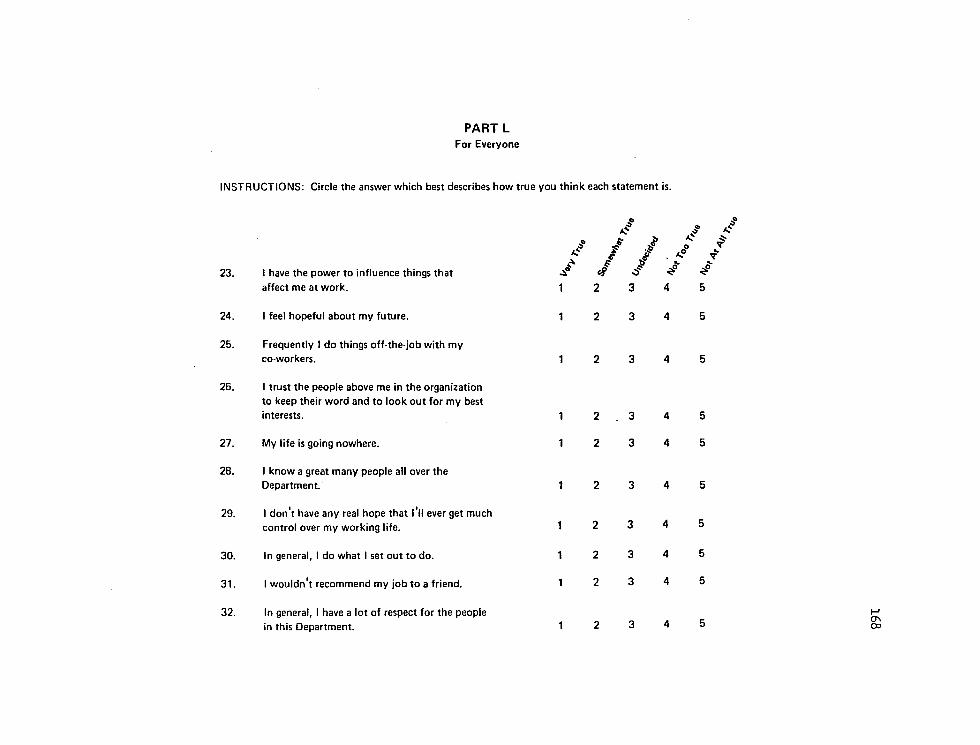
PART L For Everyone
INSTRUCTIONS: Circle the answer which best describes how true you think each statement is.
23. I have the power to influence things that
affect me at work.
24. I feel hopeful about my future.
25. Frequently I do things off-the-job with my
co-workers.
26. I trust the people above me in the organization
to keep their word and to look out for my best
interests.
27. My life is going nowhere.
28. I know a great many people all over the
Department.
29. I don't have any real hope that I'll ever get much
control over my working life.
30. In general, I do what I set out to do.
31. I wouldn't recommend my job to a friend.
32. In general, I have a lot of respect for the people
in this Department.
2 3 4
2 3 4
2 3 4
2 . 3 4
2 3 4
2 3 4
2 3 4
2 3 4
2 3 4
2 3 4
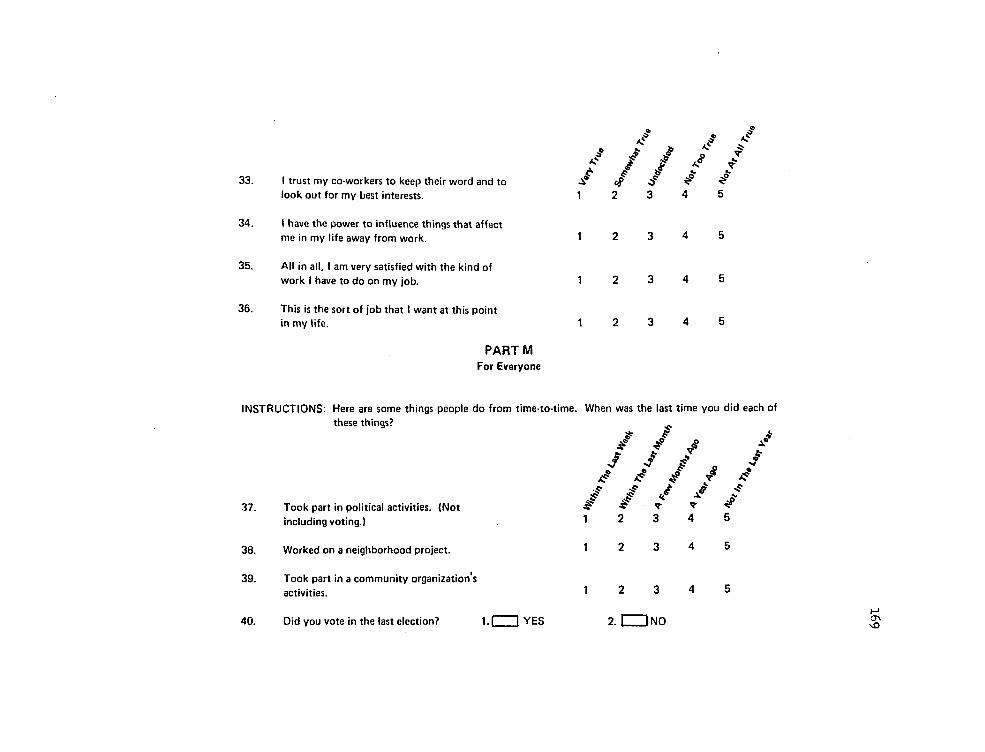
/ s® A*?
/ / ./ J / 33. I trust my co-workers to keep their word and to J? cj* cf ^ ^
look out for my best interests. 1 2 3 4 5
34. t have the power to influence things that affect
me in my life away from work. 1 2 3 4 5
35. All in all, I am very satisfied with the kind of
work I have to do on my job. 1 2 3 4 5
36. This is the sort of job that I want at this point in my life. 1 2 3 4 5
PART M For Everyone
INSTRUCTIONS: Here are some things people do from time-to-time. When was the last time you did each of
these things? ^
/ *° J / / / / -* g if 4? f x? f J
••P £ i if x- £ 37. Took part in political activities. (Not v v ^
including voting.) 1 2 3 4 5
38. Worked on a neighborhood project. 1 2
39. Took part in a community organization s
activities. 2 3
M 40. Did you vote in the last election? 1.1 I YES 2. I I NO ^
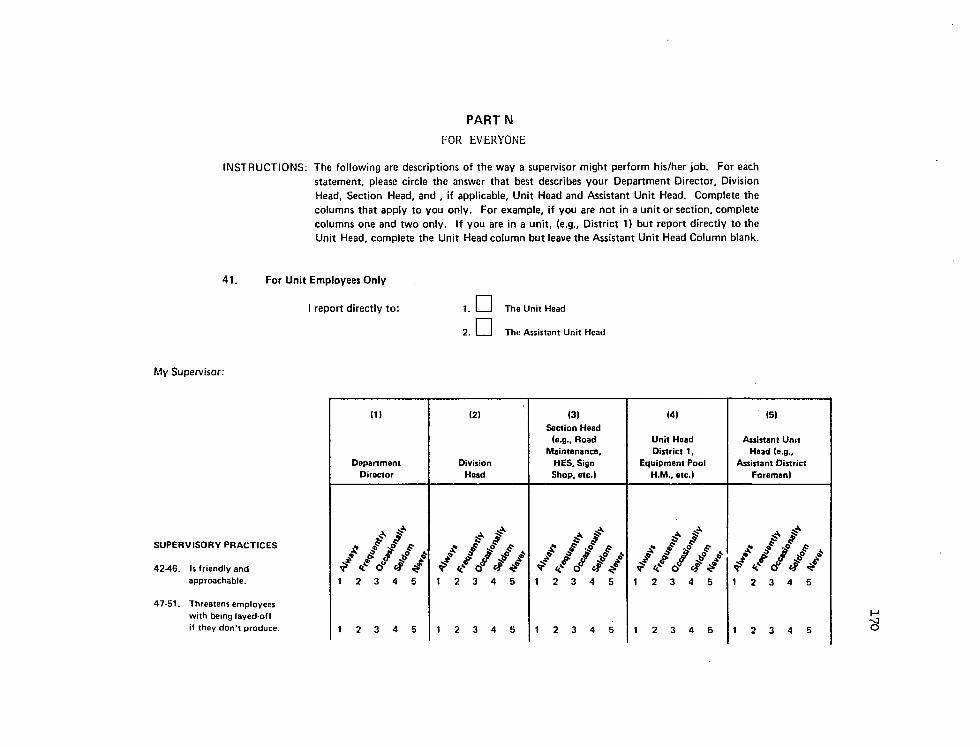
PART N
FOR EVERYONE
INSTRUCTIONS: The following are descriptions of the way a supervisor might perform his/her job. For each
statement, please circle the answer that best describes your Department Director, Division
Head, Section Head, and , if applicable. Unit Head and Assistant Unit Head. Complete the
columns that apply to you only. For example, if you are not in a unit or section, complete
columns one and two only. If you are in a unit, (e.g.. District 1) but report directly to the
Unit Head, complete the Unit Head column but leave the Assistant Unit Head Column blank.
41. For Unit Employees Only
I report directly to
• The Unit Head
2. I I The Assistant Unit Head
My Supervisor:
SUPERVISORY PRACTICES
42-46. Is friendly and
approachable.
47-51. Threatens employees
with being layed off
if they don't produce.
(1)
Department
Director
12)
Division
Head
(3) Section Head
(e.g.. Road
Maintenance,
HES, Sign
Shop, etc.)
(4)
Unit Head
District 1,
Equipment Pool
H.M., etc.)
15)
Assistant Unit Head (e.g..
Assistant District
Foreman)
/ //// / o° 4 / 1 2 3 4 5
// //** / cf 1 2 3 4 5
/////
1 2 3 4 5
/ / / // / <f <f £ 1 2 3 4 5
/////
1 2 3 4 5
1 2 3 4 5 1 2 3 4 5 1 2 3 4 5 1 2 3 4 5 1 2 3 4 5
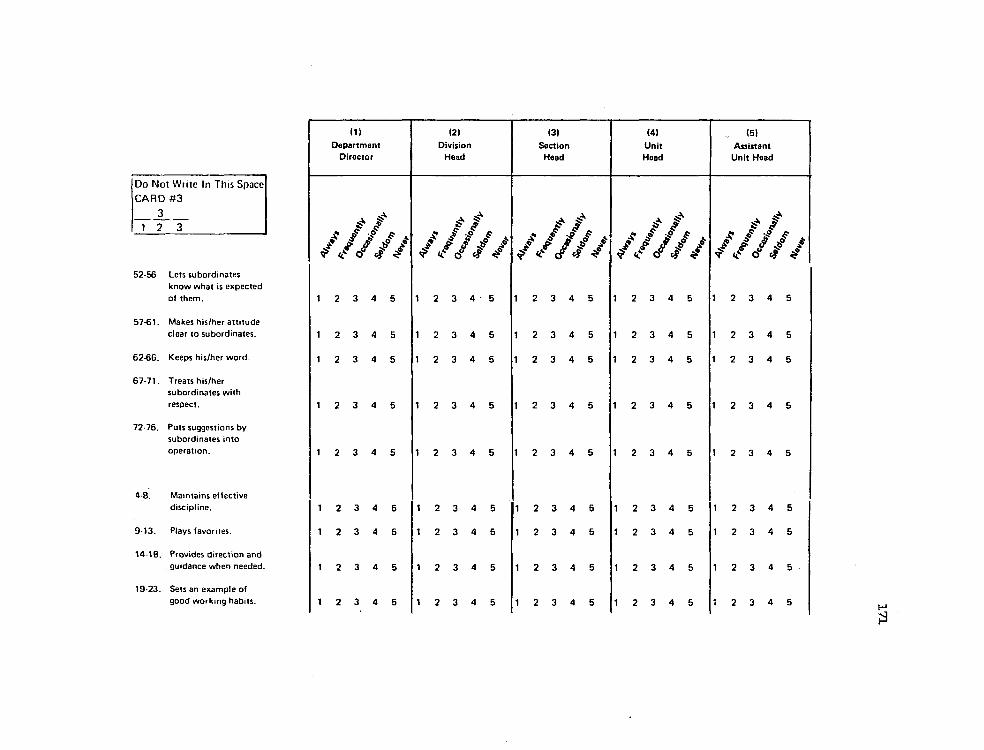
Do Not Write In This Space
CARD #3
3
1 2 3
52-56 Lets subordinates
know what is expected
of them.
57-61. Makes his/her attitude
clear to subordinates.
62-66. Keeps his/her word.
67-71. Treats his/her
subordinates with respect.
72-76. Puts suggestions by
subordinates into
operation.
4-8. Maintains effective discipline.
9-13. Plays favorites.
14-18. Provides direction and
guidance when needed.
19-23. Sets an example of
good working habits.
(1)
Department
Director
(2)
Division
Head
(3)
Section
Head
(4)
Unit
Head
(51
Assistant
Unit Head
/ / ////? ///// / «" J
/* '//
j /
/ / J 7? /. T <^ 7
12 3 4 5 1 2 3 4 5 1 2 3 4 5 1 2 3 4 5 1 2 3 4 5
12 3 4 5 1 2 3 4 5 1 2 3 4 5 1 2 3 4 5 1 2 3 4 5
12 3 4 5 1 2 3 4 5 1 2 3 4 5 1 2 3 4 5 1 2 3 4 5
12 3 4 5 1 2 3 4 5 1 2 3 4 5 1 2 3 4 5 1 2 3 4 5
12 3 4 5 1 2 3 4 5 1 2 3 4 5 1 2 3 4 5 1 2 3 4 5
12 3 4 5 1 2 3 4 5 1 2 3 4 5 1 2 3 4 5 1 2 3 4 5
12 3 4 5 1 2 3 4 5 1 2 3 4 5 1 2 3 4 5 1 2 3 4 5
12 3 4 5 1 2 3 4 5 1 2 3 4 5 1 2 3 4 5 1 2 3 4 5
12 3 4 5 1 2 3 4 5 1 2 3 4 5 1 2 3 4 5 1 2 3 4 5
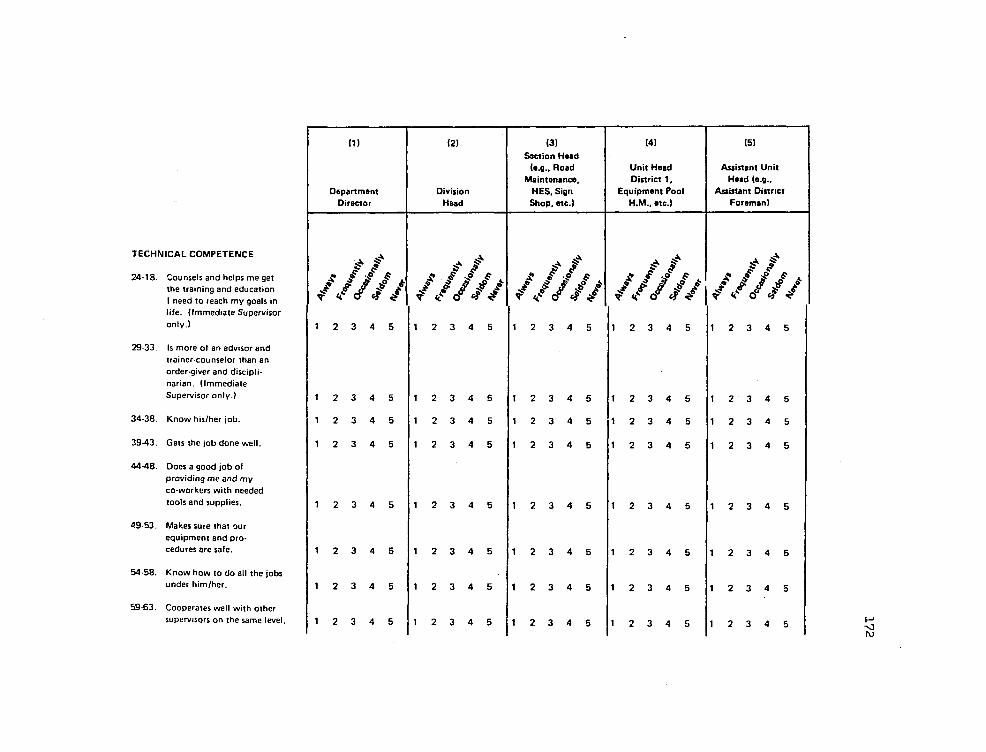
(1)
Department
Director
(2)
Division
Head
(3)
Section Head (e.g.. Road
Maintenance,
HES. Sign
Shop, etc.)
(4)
Unit Head
District 1,
Equipment Pool
H.M.. etc.)
(5)
Assistant Unit
Head (e.g..
Assistant District Foreman)
TECHNICAL COMPETENCE
24-18. Counsels and helps me get
the training and education 1 need to reach my goals in
life. (Immediate Supervisor only.)
/ / j 1 2 3
A 7/
4 5
* /A / / ///
1 2 3 4 5
/. 1 2
/) 3
A 7/
4 5 1
/ /
2 3
A 7/
4 5
t t ////• 1 2 3 4 5
29-33. Is more of an advisor and
trainer-counselor than an
order-giver and discipli
narian. (Immediate
Supervisor only.) 1 2 3 4 5 1 2 3 4 5 1 2 3 4 5 1 2 3 4 5 1 2 3 4 5
34-38. Know his/her job. 1 2 3 4 5 1 2 3 4 5 1 2 3 4 5 1 2 3 4 5 1 2 3 4 5
39-43. Gets the job done well. 1 2 3 4 5 1 2 3 4 5 1 2 3 4 5 1 2 3 4 5 1 2 3 4 5
44-48. Does a good job of
providing me and my
co-workers with needed
tools and supplies. 1 2 3 4 5 1 2 3 4 5 1 2 3 4 5 1 2 3 4 5 1 2 3 4 5
49-53. Makes sure that our
equipment and pro
cedures are safe. 1 2 3 4 5 1 2 3 4 5 1 2 3 4 5 1 2 3 4 5 1 2 3 4 5
54-58. Know how to do all the jobs under him/her. 1 2 3 4 5 1 2 3 4 5 1 2 3 4 5 1 2 3 4 5 1 2 3 4 5
59-63. Cooperates well with other
supervisors on the same level. 1 2 3 4 5 1 2 3 4 5 1 2 3 4 5 1 2 3 4 5 1 2 3 4 5

(1) (2) (3)
Section Hood (e.g.. Road
Maintenance.
(4)
Unit Head
District 1.
15)
Auiitant Unit
Head (e.g.. Department Division HES. Sign Equipment Pool Assistant District
Director Head Shop, ate.) H.M., etc.) Foreman)
54-68. Argues with his/her superiors when he/she
disagrees with something.
but - if he/she can't get it ^ / changed - supports his
superiors wholeheartedly
and never lets his subor ///// 4 & C? / ////V ^ J? V / / / / * £ $ /
* <? / f
/ / / // «CV <f $ ^ /Z f / z
dinates Know he disapproved
in the first place. 1 2 3 4 5 1 2 3 4 5 1 2 3 4 5 1 2 3 4 5 1 2 3 4 5
69-73. Avoids Responsibility by
blaming his/her superiors
for orders he/she disagrees
with or for things that go
wrong. 1 2 3 4 5 1 2 3 4 5 1 2 3 4 5 1 2 3 4 5 1 2 3 4 5
74-78. Allows my work group
enough freedom so that we
know what to do next after
finishing a job. (e.g., so that
we aren't left standing around
with the public thinking that
we're loafing.) 1 2 3 4 5 1 2 3 4 5 1 2 3 4 5 1 2 3 4 5 1 2 3 4 5
Do Not Write In This Space
CARD #4 A
T1 3~
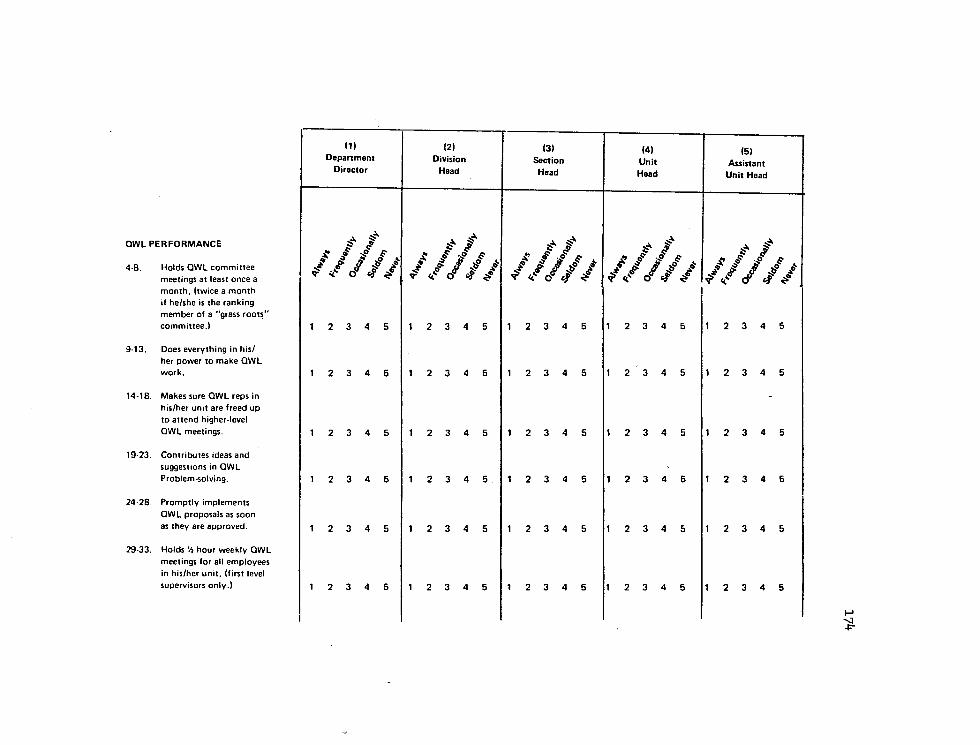
(1)
Department
Director
(2)
Division
Head
(3)
Section
Head
(4)
Unit
Head
(5)
Assistant
Unit Head
QWL PERFORMANCE
4-8. Holds QWL committee
meetings at least once a / / / / / T O (f / / / /% /
* ^
/ / / / /
* /•
// # / •V/ * /
/ <f J / / month, (twice a month
if he/she is the ranking
member of a "grass roots"
committee.) 1 2 3 4 5 12 3 4 5 1 2 3 4 5 1 2 3 4 5 1 2 3 4 5
9-13. Does everything in his/
her power to make QWL work. 1 2 3 4 5 12 3 4 5 1 2 3 4 5 1 2 3 4 5 1 2 3 4 5
14-18. Makes sure QWL reps in
his/her unit are freed up
to attend higher-level
-
QWL meetings. 1 2 3 4 5 12 3 4 5 1 2 3 4 5 1 2 3 4 5 1 2 3 4 5
19-23. Contributes ideas and
suggestions in QWL
Problem-solving. 1 2 3 4 5 12 3 4 5 1 2 3 4 5 1 2 3 4 5 1 2 3 4 5
24-28. Promptly implements
QWL proposals as soon as they are approved. 1 2 3 4 5 12 3 4 5 1 2 3 4 5 1 2 3 4 5 1 2 3 4 5
29-33. Holds % hour weekly QWL
meetings for alt employees
in his/her unit, (first level
supervisors only.) 1 2 3 4 5 12 3 4 5 1 2 3 4 5 1 2 3 4 5 1 2 3 4 5
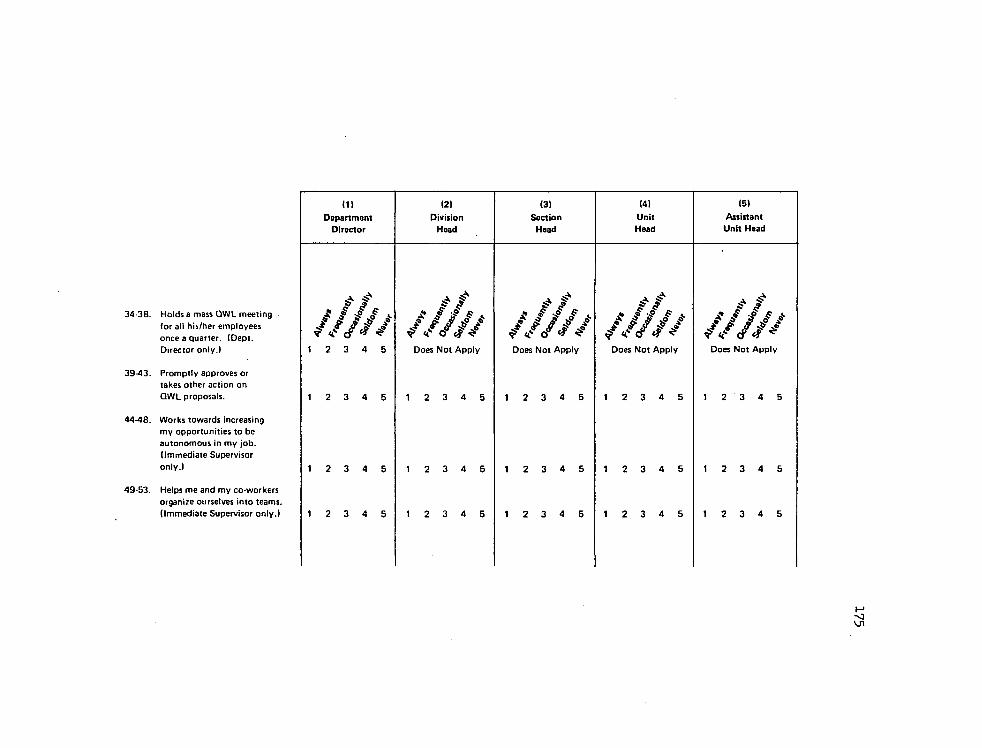
(1)
Department
Director
(2)
Division
Head
(3)
Section
Head
(4)
Unit
Head
(5)
Assistant
Unit Head
34-38. Holds a mass OWL meeting
for all his/her employees
once a quarter. (Oept.
Director only.)
///// 1 2 3 4 5
// / / / / / y <f o ^
Does Not Apply
^ / // *
^ If O « ^
Does Not Apply
J ? / / / /
/ / • / /
Does Not Apply Does Not Apply
39-43. Promptly approves or
takes other action on
QWL proposals. 1 2 3 4 5 1 2 3 4 5 1 2 3 4 5 1 2 3 4 5 1 2 3 4 5
44-48. Works towards increasing
my opportunities to be
autonomous in my job.
(immediate Supervisor
only.) 1 2 3 4 5 1 2 3 4 5 1 2 3 4 5 1 2 3 4 5 1 2 3 4 5
49-53. Helps me and my co-workers
organize ourselves into teams.
(Immediate Supervisor only.) 1 2 3 4 5 1 2 3 4 5 1 2 3 4 5 1 2 3 4 5 1 2 3 4 5

PARTO For Everyone
INSTRUCTIONS: Check or circle the answer which describes your situation.
54. Does your organization have a QWL
committee structure?
If "no" skip to question 63.
55. Do you sit on a QWL committee?
56. If "yes" to question 55, what
level (s) ?
i. CZ1 YES
1. cm YES
1. E=• Grass Roots
2. CZ3 Action
2. IZZI NO
2.1 I NO
3.r=n Division
4.CZ3 Department
INSTRUCTIONS: If no to question 55, (if you do not sit on a QWL committe), please circle the answers
which best describe your situation.
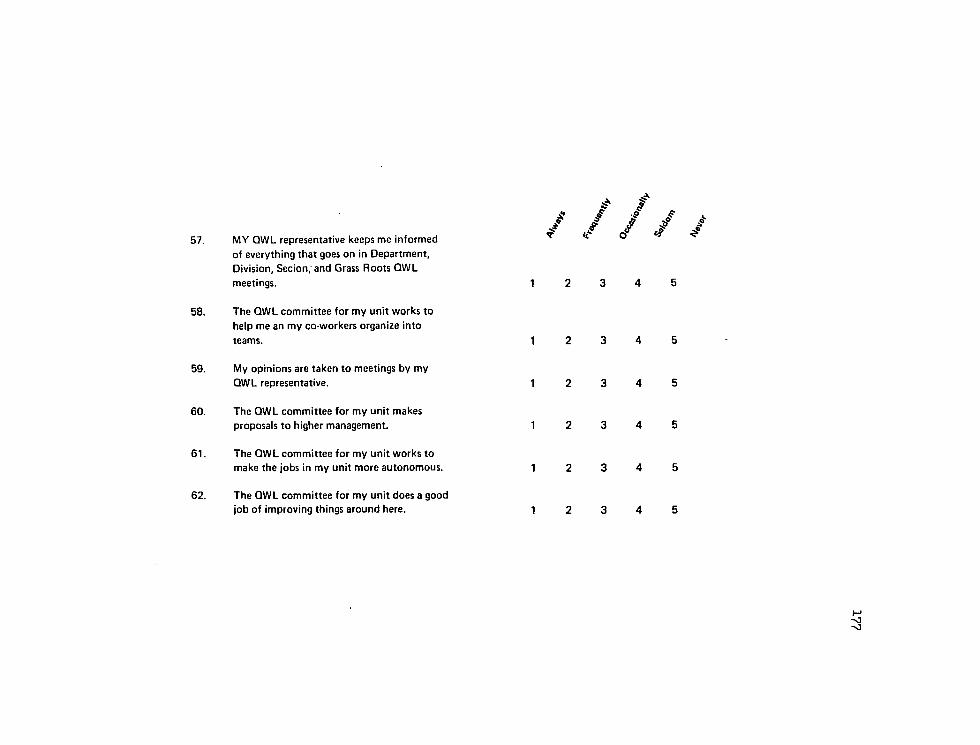
57. MY QWL representative keeps me informed
of everything that goes on in Department,
Division, Secion, and Grass Roots QWL
meetings.
58. The QWL committee for my unit works to
help me an my co-workers organize into
teams.
59. My opinions are taken to meetings by my
QWL representative.
60. The QWL committee for my unit makes
proposals to higher management.
61. The QWL committee for my unit works to
make the jobs in my unit more autonomous.
62. The QWL committee for my unit does a good
job of improving things around here.
1 2 3 4 5
1 2 3 4 5
1 2 3 4 5
1 2 3 4 5
1 2 3 4 5
1 2 3 4 5
M ^3
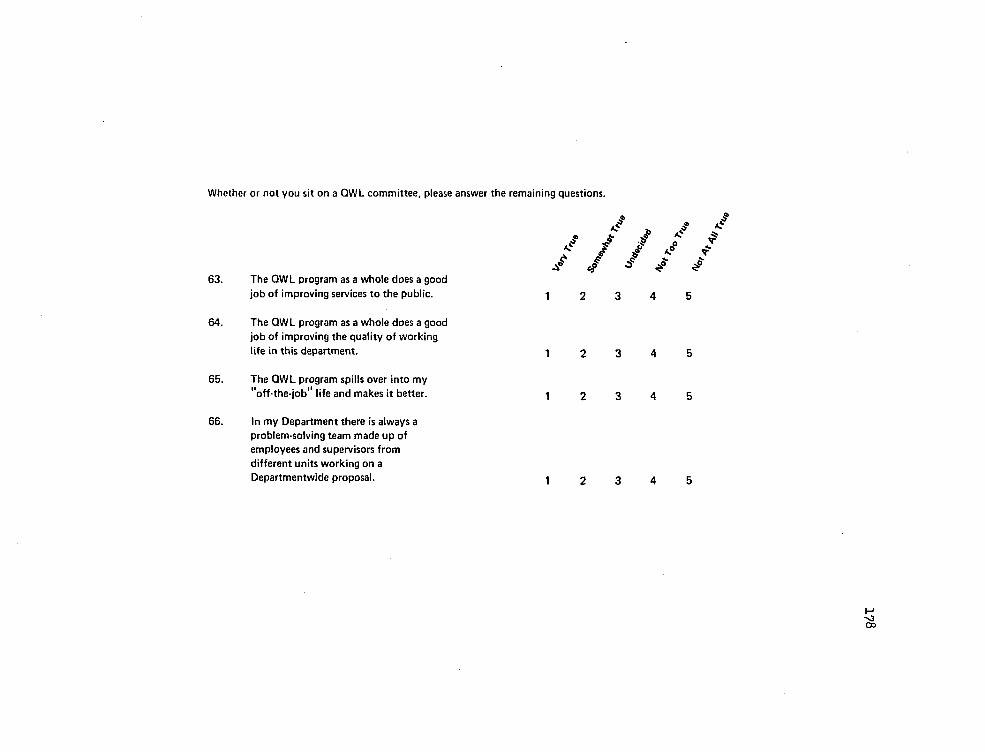
Whether or not you sit on a QWL committee, please answer the remaining questions.
63. The QWL program as a whole does a good
job of improving services to the public.
64. The QWL program as a whole does a good
job of improving the quality of working
life in this department. 1 2 3 4 5
65. The QWL program spills over into my
"off-the-job" life and makes it better. 1 2 3 4 5
66. In my Department there is always a
problem-solving team made up of
employees and supervisors from
different units working on a
Departmentwide proposal. 1 2 3 4 5
•>3 CD

APPENDIX C
DEPARTMENT HEAD MEMO
179
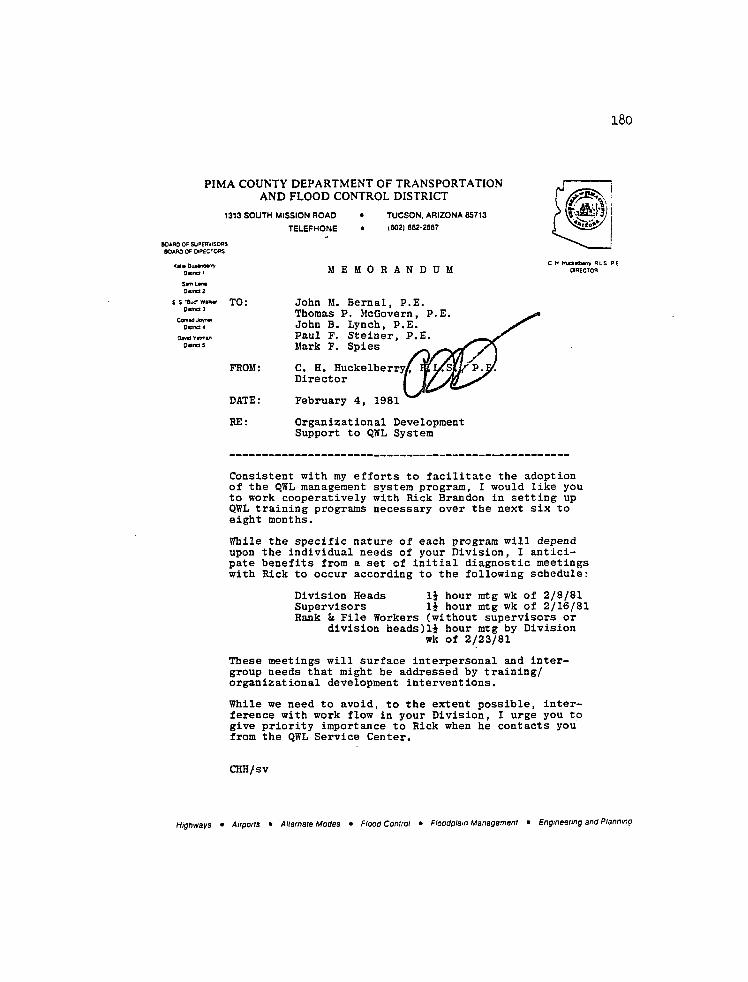
l8o
PIMA COUNTY DEPARTMENT OF TRANSPORTATION AND FLOOD CONTROL DISTRICT
1313 SOUTH MISSION ROAD
TELEFHONE
BOARO OP SUPERVISORS BOAPO OP OiRECTOftS
Kate Ouaanotrry 0«"d i S*n Lfna •Hind 2
£ & 'Bwr 0«nei 3
Cento i&frm Dana«
0«mI Yctffltn Oawet S
TUCSON. ARIZONA 85713
(602) 0B2-2S67
M E M O R A N D U M
TO: John M. Bernal, P.E. Thomas P. MoGovern, P.E. John B. Lynch, P.E. Paul F. Steiner, P.E. Mark F. Spies
FROM: C. H. Huckelberry/ Director
DATE: February 4, 1981
RE: Organizational Development Support to QWL System
C M PLS Pg ORECTOfl
Consistent with my efforts to facilitate the adoption of the QWL management system program, I would like you to work cooperatively with Rick Brandon in setting up QWL training programs necessary over the next six to eight months.
While the specific nature of each program will depend upon the individual needs of your Division, I anticipate benefits from a set of initial diagnostic meetings with Rick to occur according to the following schedule:
Division Heads 1J hour mtg wk of 2/8/81 Supervisors 1J hour mtg wk of 2/16/81 Rank St File Workers (without supervisors or
division heads)1$ hour mtg by Division wk of 2/23/81
These meetings will surface interpersonal and inter-group needs that might be addressed by training/ organizational development interventions.
While we need to avoid, to the extent possible, interference with work flow in your Division, X urge you to give priority importance to Rick when he contacts you from the QWL Service Center.
CHH/sv
Highways • Airports • Alternate Modes • Flood Control • Floodplam Management • Engineering and Planning
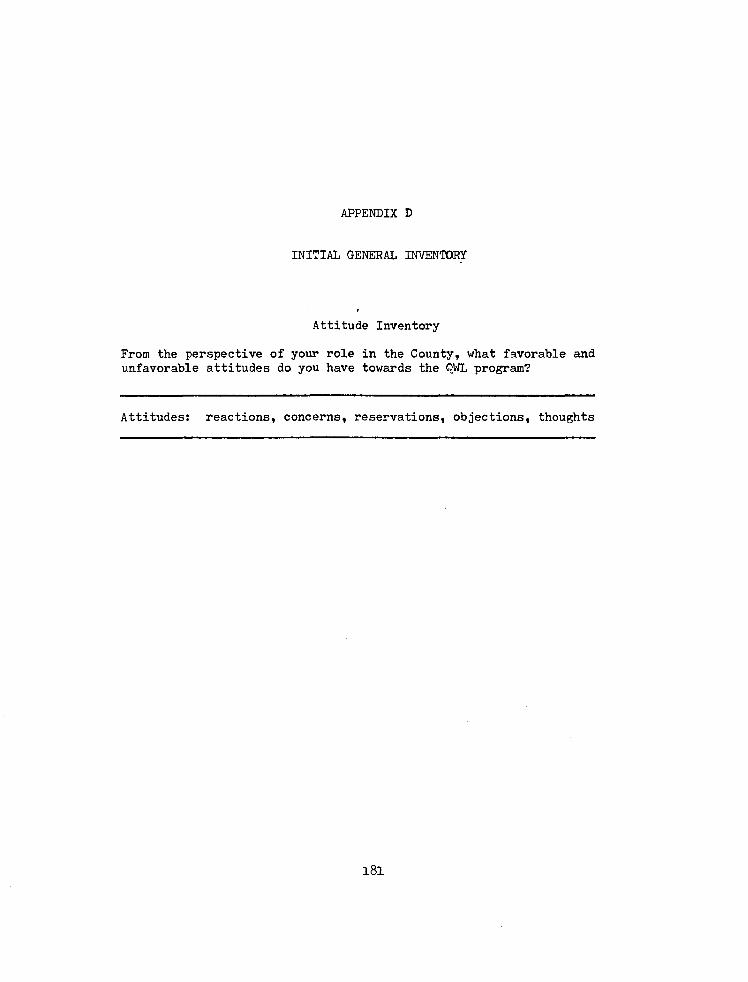
APPENDIX D
INITIAL GENERAL INVENTORY
Attitude Inventory
From the perspective of your role in the County, what favorable and unfavorable attitudes do you have towards the OWL program?
Attitudes: reactions, concerns, reservations, objections, thoughts
181
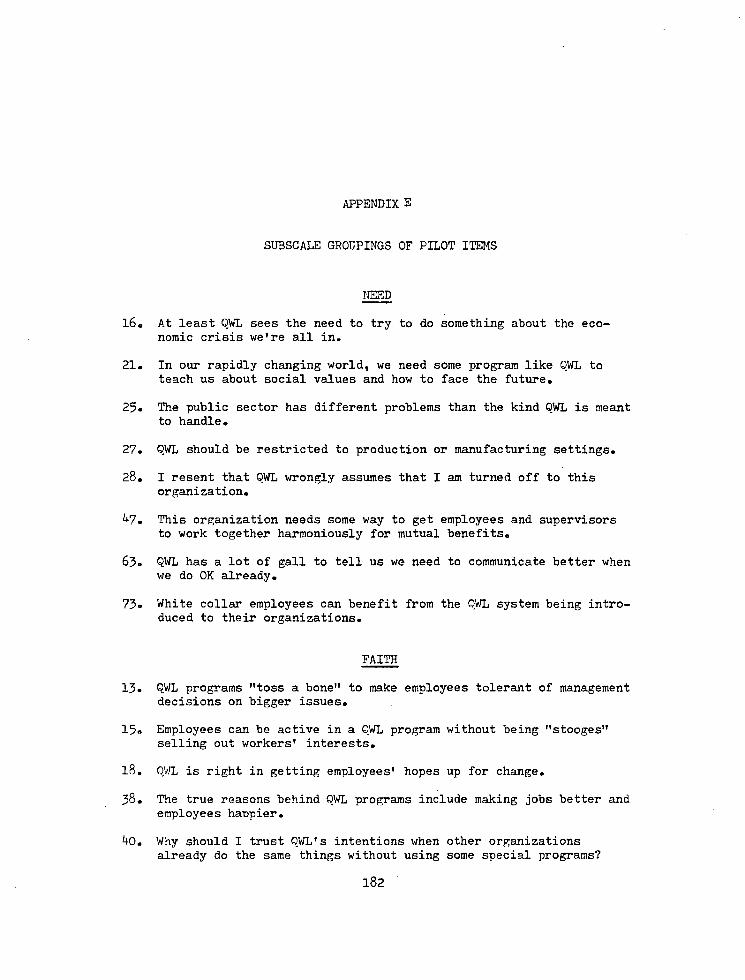
APPENDIX E
SUBSCALE GROUPINGS OF PILOT ITEMS
16. At least QWL sees the need to try to do something about the economic crisis we're all in.
21. In our rapidly changing world, we need some program like QWL to teach us about social values and how to face the future.
25. The public sector has different problems than the kind QWL is meant to handle.
27. QWL should be restricted to production or manufacturing settings.
28. I resent that QWL wrongly assumes that I am turned off to this organization.
^7. This organization needs some way to get employees and supervisors to work together harmoniously for mutual benefits.
63. QWL has a lot of gall to tell us we need to communicate better when we do OK already.
73. White collar employees can benefit from the OWL system being introduced to their organizations.
FAITH
13. QWL programs "toss a bone" to make employees tolerant of management decisions on bigger issues.
15. Employees can be active in a QWL program without being "stooges" selling out workers' interests.
18. QWL is right in getting employees' hopes up for change.
38. The true reasons behind QWL programs include making jobs better and employees happier.
ko. Why should I trust QWL's intentions when other organizations already do the same things without using some special programs?
182

183
4l. OWL is overly optimistic and "cure-all" in its hopes to make a difference.
48. OWL programs are management "cons" to get employees to work harder without more pay.
49. QWL seems realistic in its basic goals of trying to break down barriers between labor and management.
DECENTRALIZATION
9. I like how OWL's delegation of more authority to lower level supervisors makes them better able to share decisions with employees.
76. Delegating authority to lower levels of supervision through QWL would result in chaos and disorder.
8l. OWL's delegation of more authority downwards provides managers and supervisors the opportunity to develop new, more constructive roles.
83. If top management does what QWL suggests and gives lower level supervisors more authority to make decisions, we won't know if things are getting done anymore.
EDUCATION
11. OWL should leave education about budget, personnel and organizational decisions in the hands of management who are trained and paid to deal with these matters.
50. OWL's emphasis on workers learning about their jobs and the organization is asking for trouble since management policies will end up being attacked by know-it-all employees.
79» I appreciate QWL's ideals of educating employees in budget, personnel and organizational matters so that they become valuable resources to the organization.
COOPERATIVE SELF-INTEREST
4-3. OWL increases unnecessary competition between units and divisions by allowing one group to pass a proposal at the expense of another.
55« I like the part of QWL that tries to reward everyone in the group when the work group does well.
65. I support OWL's rewarding everyone in the group even if someone is not pulling his full load.
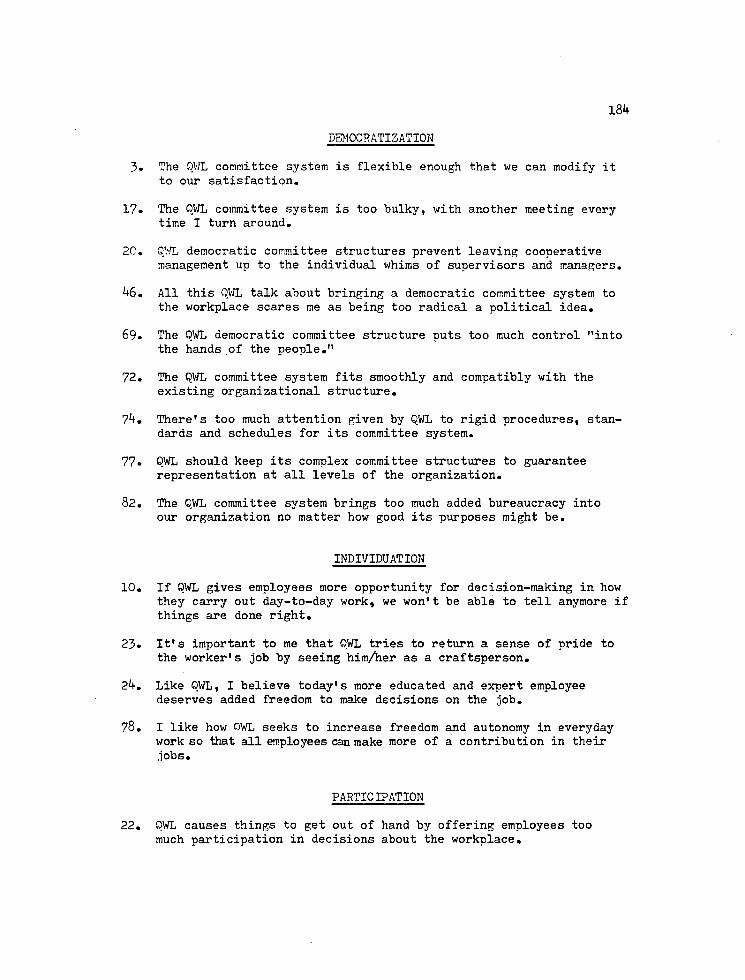
18k
DEMOCRATIZATION
3. The OWL committee system is flexible enough that we can modify it to our satisfaction.
17. The OWL committee system is too bulky, with another meeting every time I turn around.
20. OWL democratic committee structures prevent leaving cooperative management up to the individual whims of supervisors and managers.
46. All this OWL talk about bringing a democratic committee system to the workplace scares me as being too radical a political idea.
69. The OWL democratic committee structure puts too much control "into the hands of the people."
72. The QWL committee system fits smoothly and compatibly with the existing organizational structure.
7*U There's too much attention given by QWL to rigid procedures, standards and schedules for its committee system.
77. QWL should keep its complex committee structures to guarantee representation at all levels of the organization.
82. The QWL committee system brings too much added bureaucracy into our organization no matter how good its purposes might be.
INDIVIDUATION
10. If OWL gives employees more opportunity for decision-making in how they carry out day-to-day work, we won't be able to tell anymore if things are done right.
23. It's important to me that OWL tries to return a sense of pride to the worker's job by seeing him/her as a craftsperson.
2k. Like QWL, I believe today's more educated and expert employee deserves added freedom to make decisions on the job.
78. I like how OWL seeks to increase freedom and autonomy in everyday work so that all employees can make more of a contribution in their jobs.
PARTICIPATION
22. QWL causes things to get out of hand by offering employees too much participation in decisions about the workplace.
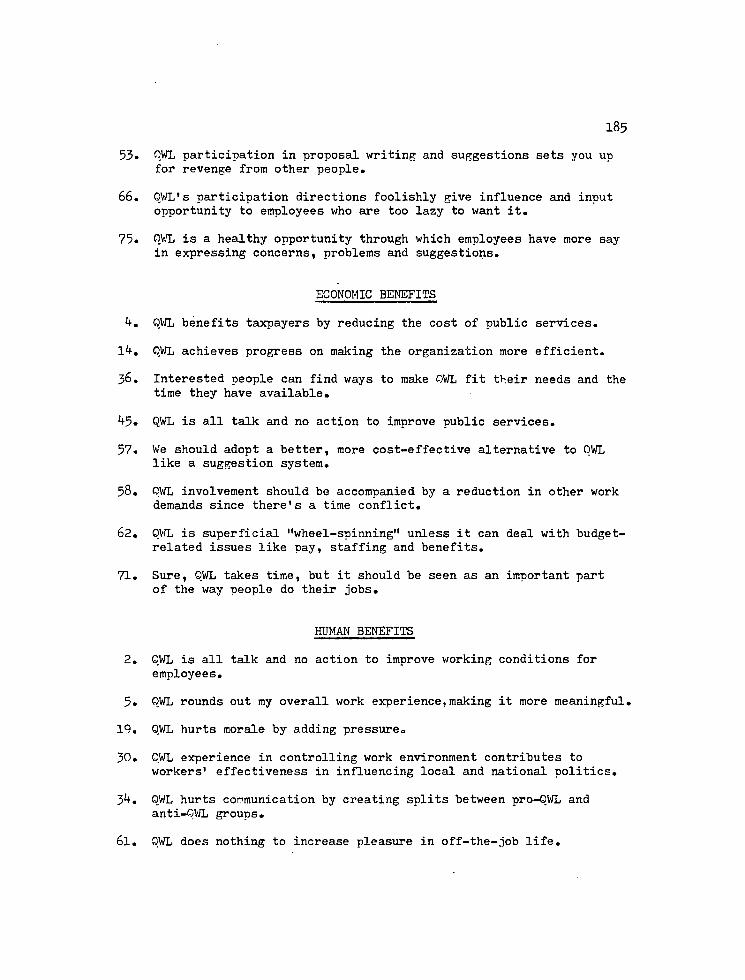
185
53. QWL participation in proposal writing and suggestions sets you up for revenge from other people.
66. QWL's participation directions foolishly give influence and input opportunity to employees who are too lazy to want it.
75. QWL is a healthy opportunity through which employees have more say in expressing concerns, problems and suggestions.
ECONOMIC BENEFITS
k. QWL benefits taxpayers by reducing the cost of public services.
1 . OWL achieves progress on making the organization more efficient.
36. Interested people can find ways to make OWL fit their needs and the time they have available,
*+5. QWL is all talk and no action to improve public services.
57. We should adopt a better, more cost-effective alternative to OWL like a suggestion system.
58. OWL involvement should be accompanied by a reduction in other work demands since there's a time conflict.
62. OWL is superficial "wheel-spinning" unless it can deal with budget-related issues like pay, staffing and benefits.
71. Sure, QWL takes time, but it should be seen as an important part of the way people do their jobs.
HUMAN BENEFITS
2. OWL is all talk and no action to improve working conditions for employees.
5. QWL rounds out my overall work experience, making it more meaningful.
19. QWL hurts morale by adding pressure<>
30. QWL experience in controlling work environment contributes to workers' effectiveness in influencing local and national politics.
J>k. OWL hurts copmunication by creating splits between pro-OWL and anti-OWL groups.
6l. QWL does nothing to increase pleasure in off-the-job life.
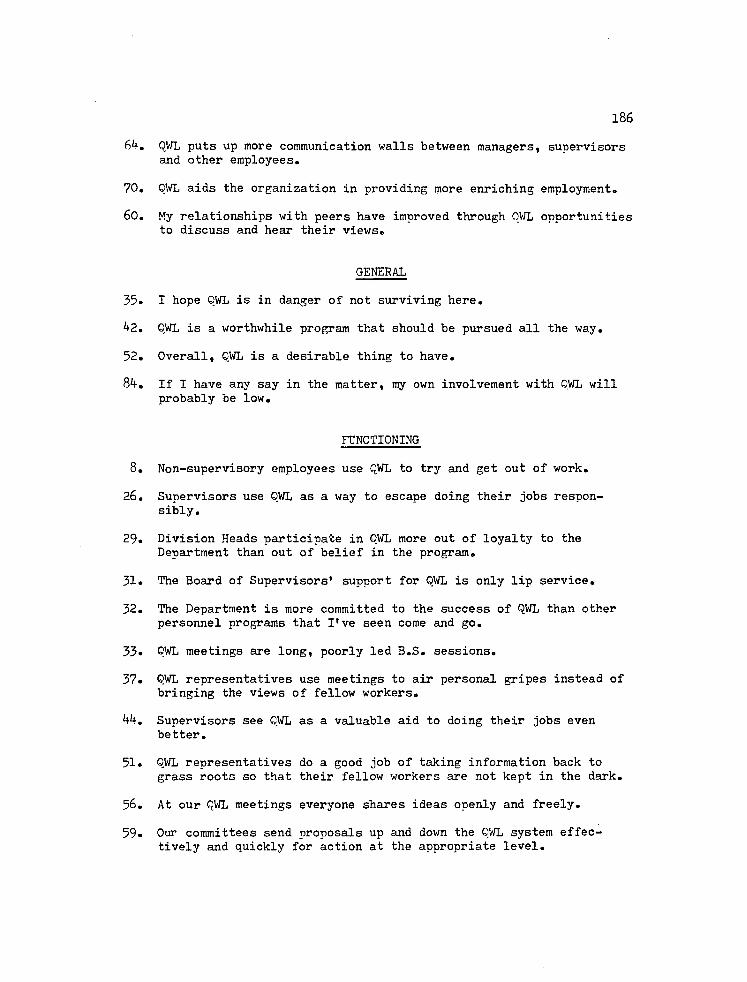
186
6k. OWL puts up more communication walls between managers, supervisors and other employees.
70. OWL aids the organization in providing more enriching employment.
60. My relationships with peers have improved through OWL opportunities to discuss and hear their views.
GENERAL
35. I hope ©WL is in danger of not surviving here.
42. OWL is a worthwhile program that should be pursued all the way.
52. Overall, QWL is a desirable thing to have.
8k. If I have any say in the matter, my own involvement with QWL will probably be low.
FUNCTIONING
8. Non-supervisory employees use QWL to try and get out of work.
26. Supervisors use OWL as a way to escape doing their jobs responsibly.
29. Division Heads participate in QWL more out of loyalty to the Department than out of belief in the program.
31. The Board of Supervisors' support for OWL is only lip service.
32. The Department is more committed to the success of QWL than other personnel programs that I've seen come and go.
33. QWL meetings are long, poorly led B.S. sessions.
37. QWL representatives use meetings to air personal gripes instead of bringing the views of fellow workers.
Supervisors see QWL as a valuable aid to doing their jobs even better.
51. QWL representatives do a good job of taking information back to grass roots so that their fellow workers are not kept in the dark.
56. At our QWL meetings everyone shares ideas openly and freely.
59. Our committees send proposals up and down the QWL system effectively and quickly for action at the appropriate level.
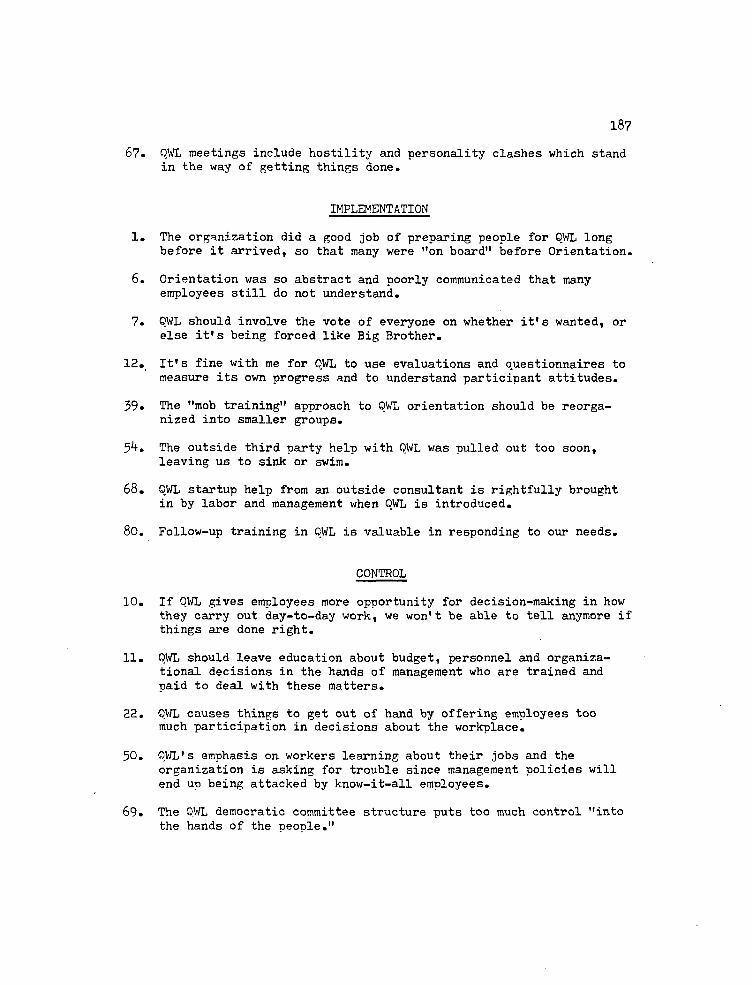
187
67. OWL meetings include hostility and personality clashes which stand in the way of getting things done.
IMPLEMENT ATION
1. The organization did a good job of preparing people for QWL long before it arrived, so that many were "on board" before Orientation.
6. Orientation was so abstract and poorly communicated that many employees still do not understand.
7. QWL should involve the vote of everyone on whether it's wanted, or else it's being forced like Big Brother.
12. It's fine with me for QWL to use evaluations and questionnaires to measure its own progress and to understand participant attitudes.
39. The "mob training" approach to QWL orientation should be reorganized into smaller groups.
5 . The outside third party help with QWL was pulled out too soon, leaving us to sink or swim.
68. QWL startup help from an outside consultant is rightfully brought in by labor and management when QWL is introduced.
80. Follow-up training in QWL is valuable in responding to our needs.
CONTROL
10. If QWL gives employees more opportunity for decision-making in how they carry out day-to-day work, we won't be able to tell anymore if things are done right.
11. QWL should leave education about budget, personnel and organizational decisions in the hands of management who are trained and paid to deal with these matters.
22. QWL causes things to get out of hand by offering employees too much participation in decisions about the workplace.
50. OWL's emphasis on workers learning about their jobs and the organization is asking for trouble since management policies will end up being attacked by know-it-all employees.
69. The OWL democratic committee structure puts too much control "into the hands of the people."
Delegating authority to lower levels of supervision through OWL would result in chaos and disorder.
If top management does what OWL suggests and gives lower level supervisors more authority to make decisions, we won't know if things are getting done anymore.
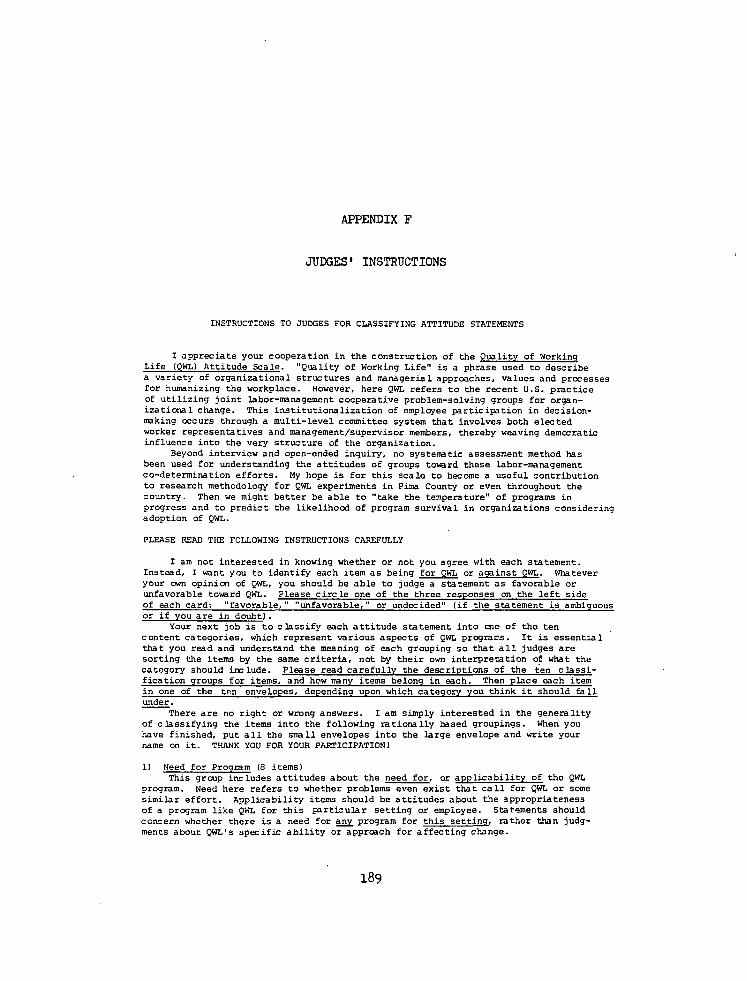
APPENDIX F
JUDGES1 INSTRUCTIONS
INSTRUCTIONS TO JUDGES FOR CLASSIFYING ATTITUDE STATEMENTS
I appreciate your cooperation in the construction of the Quality of Working
Life (QWL) Attitude Scale. "Quality of Working Life" is a phrase used to describe
a variety of organizational structures and managerial approaches, values and processes
for humanizing the workplace. However, here QWL refers to the recent U.S. practice
of utilizing joint labor-management cooperative problem-solving groups for organ
izational change. This institutionalization of employee participation in decision
making occurs through a multi-level committee system that involves both elected
worker representatives and management/supervisor members, thereby weaving democratic
influence into the very structure of the organization. Beyond interview and open-ended inquiry, no systematic assessment method has
been used for understanding the attitudes of groups toward these labor-management
co-determination efforts. My hope is for this scale to become a useful contribution
to research methodology for QWL experiments in Pima County or even throughout the
country. Then we might better be able to "take the temperature" of programs in
progress and to predict the likelihood of program survival in organizations considering
adoption of QWL.
PLEASE READ THE FOLLOWING INSTRUCTIONS CAREFULLY
I am not interested in knowing whether or not you agree with each statement.
Instead, I want you to identify each item as being for QWL or against QWL. Whatever
your own opinion of QWL, you should be able to judge a statement as favorable or
unfavorable toward QWL. Please circle one of the three responses on the left side
of each card: "favorable," "unfavorable," or undecided" (if the statement is ambiguous
or if you are in doubt).
Your next job is to classify each attitude statement into ane of the ten content categories, which represent various aspects of QWL programs. It is essential
that you read and understand the meaning of each grouping so that all judges are
sorting the items by the same criteria, not by their own interpretation of what the
category should include. Please read carefully the descriptions of the ten classi
fication groups for items, and how nany items belong in each. Then place each item
in one of the ten envelopes, depending upon which category you think it should fall
under.
There are no right or wrong answers. I am simply interested in the generality
of classifying the items into the following rationally based groupings. When you
have finished, put all the snail envelopes into the large envelope and write your
name on it. THANK YOU FOR YOUR PARTICIPATION!
1) Need for Program {8 items)
This group includes attitudes about the need for, or applicability of the QWL
program. Need here refers to whether problems even exist that call for QWL or some
similar effort. Applicability items should be attitudes about the appropriateness
of a program like QWL for this particular setting or employee. Statements should
concern whether there is a need for any program for this setting, rather than judg
ments about QWL's specific ability or approach for affecting change.
189
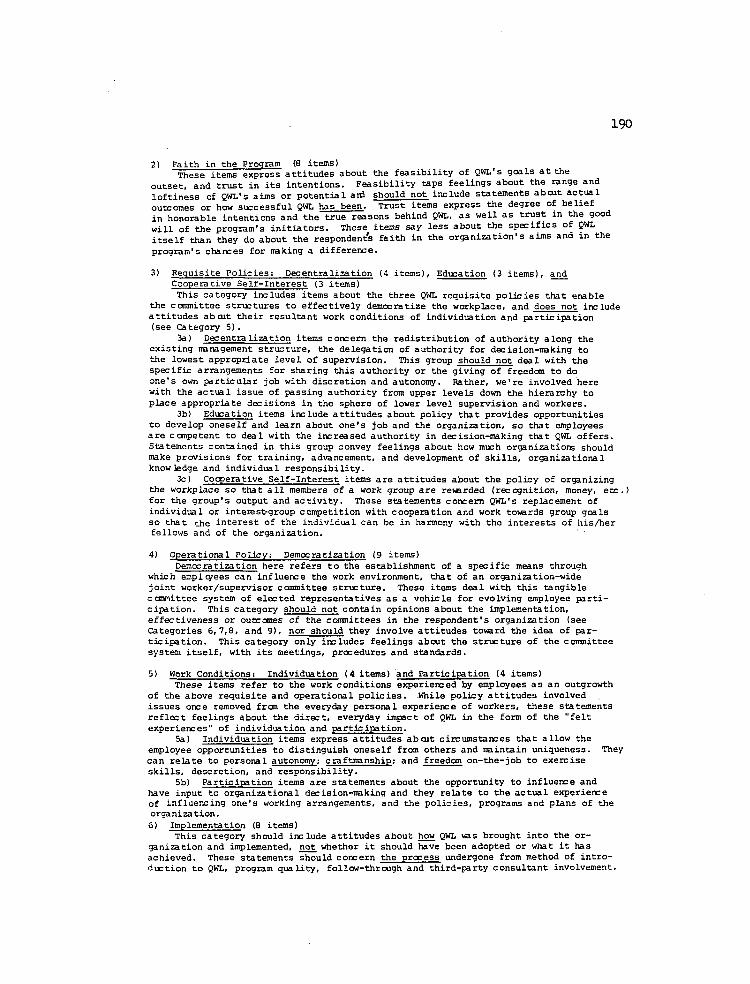
190
2) Faith in the Program (8 items) These items express attitudes about the feasibility of QWL's goals at the
outset, and trust in its intentions. Feasibility taps feelings about the range and
loftiness of QWL's aims or potential aid should not include statements abait actual
outcomes or how siKcessful QWL has been. Trust items express the degree of belief
in honorable intentions and the true reasons behind QWL, as well as trust in the good
will of the program's initiators. These items say less about the specifics of QWL
itself than they do about the respondent's faith in the organization's aims and in the
program's chances for naking a difference.
3) Requisite Policies; Decentralization (4 items), Education (3 items), and
Cooperative Self-interest (3 items)
This category includes items about the three QWL requisite policies that enable
the committee structures to effectively democratize the workplace, and does not include
attitudes abcut their resultant work conditions of individuation and participation (see Category 5).
3a) Decentralization items concern the redistribution of authority along the
existing management structure, the delegation of authority for decision-making to
the lowest appropriate level of supervision. This group should not deal with the
specific arrangements for sharing this authority or the giving of freedom to do
one's own particular job with discretion and autonomy. Rather, we're involved here
with the actual issue of passing authority from upper levels down the hierarchy to
place appropriate decisions in the sphere of lower level supervision and workers.
3b) Education items include attitudes about policy that provides opportunities
to develop oneself and learn about one's job and the organization, so that employees
are ccmpetent to deal with the increased authority in decision-making that QWL offers.
Statements contained in this group convey feelings about how much organizations should
make provisions for training, advancement, and development of skills, organizational
knowledge and individual responsibility.
3c) Co<^erative Self-interest items are attitudes about the policy of organizing
the workplace so that all members of a work group are regarded (recognition, money, etc.)
for the group's output and activity. These statements concern QWL's replacement of
individual or interest-group competition with cooperation and work towards group goals
so that the interest of the individual can be in harmony with the interests of his/her fellows and of the organization.
4) Operational Policy: Democratization (9 items)
Democratization here refers to the establishment of a specific means through
which emplcyees can influence the work environment, that of an organization-wide
joint worker/supervisor committee structure. These items d^l with this tangible
committee system of elected representatives as a vehicle for evolving employee parti
cipation. This category should not contain opinions about the implementation,
effectiveness or outcomes of the committees in the respondent's organization (see
Categories 6,7,8, and 9), nor should they involve attitudes toward the idea of par
ticipation. This category only includes feelings about the structure of the committee
system itself, with its meetings, procedures and standards.
5) Work Conditions: Individuation (4 items) and Participation (4 items)
These items refer to the work conditions experienced by employees as an outgrowth
of the above requisite and operational policies. -While policy attitudes involved
issues once removed fran the everyday personal experience of workers, these statements
reflect feelings about the direct, everyday impact of QWL in the form of the "felt
experiences" of individ\ation and participation.
5a) Individuation items express attitudes aboit circumstances that allow the
employee opportunities to distinguish oneself from others and maintain uniqueness. They
can relate to personal autonomy; craftmanship; and freedom on-the-job to exercise
skills, descretion, and responsibility.
5b) Participation items are statements about the opportunity to influence and
have input to organizational decision-making and they relate to the actual experience of influencing one's working arrangements, and the policies, programs and plans of the
organization.
6) Implementation (8 items)
This category should include attitudes about how QWL was brought into the or
ganization and implemented, not whether it should have been adopted or what it has
achieved. These statements should concern the process undergone from method of intro
duction to QWL, program quality, follew-through and third-party consultant involvement.
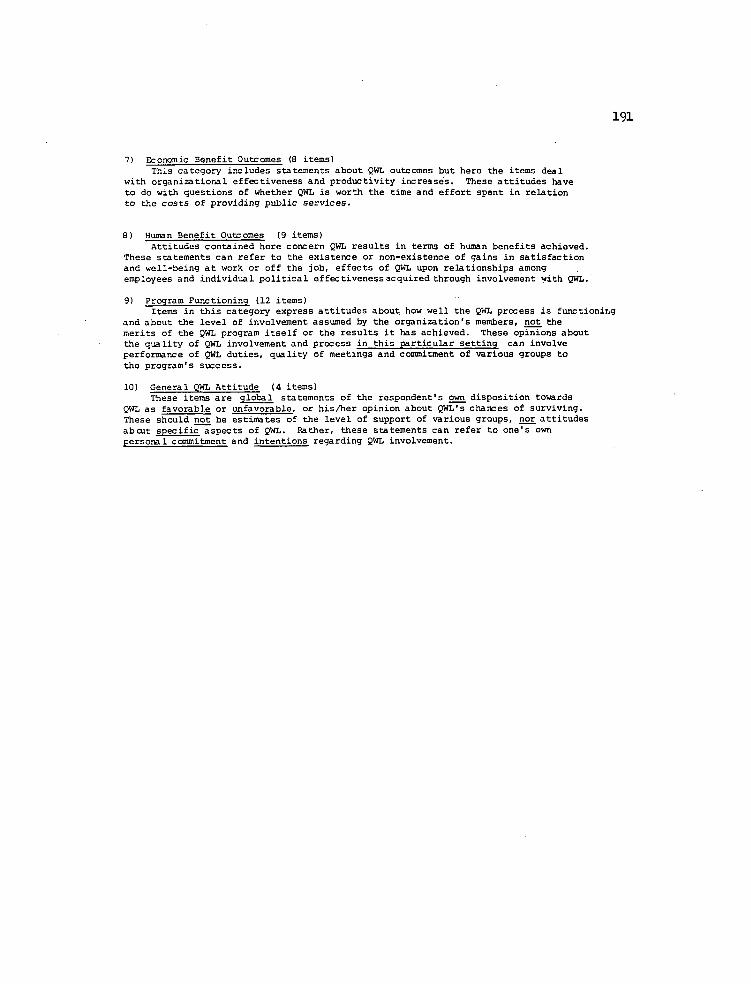
191
7) Economic Benefit Outcomes (8 items)
This category includes statements about QWL outcomes but here the items deal
with organizational effectiveness and productivity increases. These attitudes have
to do with questions of whether QWL is worth the time and effort spent in relation
to the costs of providing public services.
8) Human Benefit Outcomes (9 items)
Attitudes contained here concern QWL results in terms of human benefits achieved.
These statements can refer to the existence or non-existence of gains in satisfaction
and well-being at work or off the job, effects of QWL upon relationships among
employees and individual political effectivenessacquired through involvement with QWL.
9) Program Functioning (12 items)
Items in this category express attitudes about how well the QWL process is functioning
and about the level of involvement assumed by the organization's members, not the
merits of the QWL program itself or the results it has achieved. These opinions about
the quality of QWL involvement and process in this particular setting can involve
perforrance of QWL duties, quality of meetings and commitment of various groups to
the program's success.
10) General QWL Attitude (4 items)
These items are global statements of the respondent's own disposition towards
QWL as favorable or unfavorable, or his/her opinion about QWL's chances of surviving.
These should not be estimates of the level of support of various groups, nor attitudes
abcut specific aspects of QWL. Father, these statements can refer to one's own
personal commitment and intentions regarding QWL involvement.
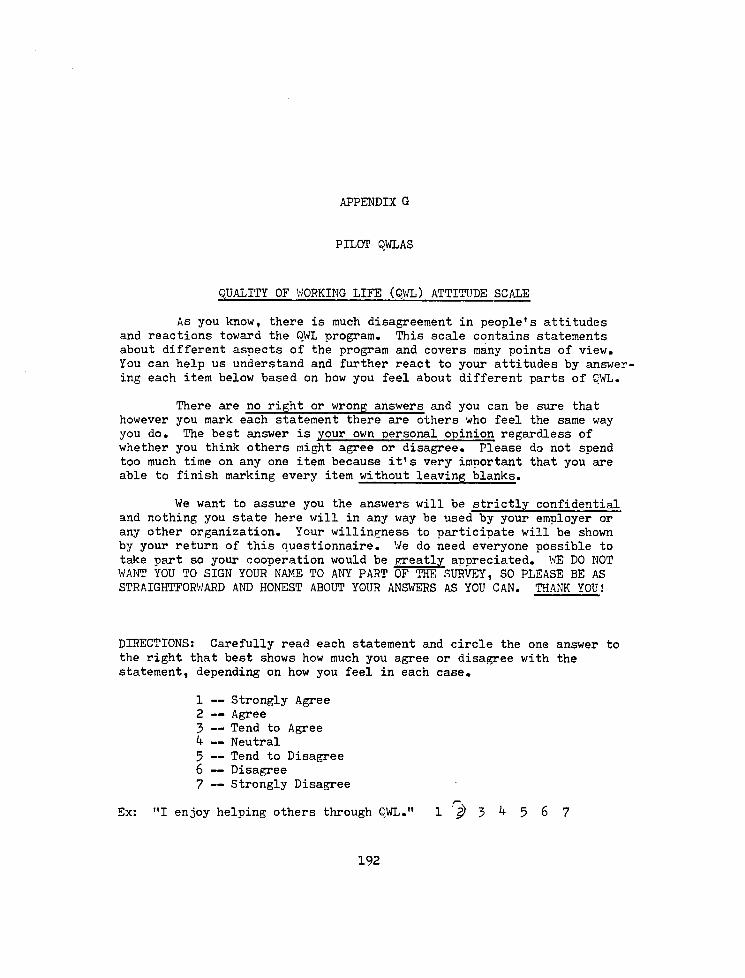
APPENDIX G
PILOT QWLAS
QUALITY OF WORKING LIFE (OWL) ATTITUDE SCALE
As you know, there is much disagreement in people's attitudes and reactions toward the OWL program. This scale contains statements about different aspects of the program and covers many points of view. You can help us understand and further react to your attitudes by answering each item below based on how you feel about different parts of OWL.
There are no right or wrong answers and you can be sure that however you mark each statement there are others who feel the same way you do. The best answer is your own personal opinion regardless of whether you think others might agree or disagree. Please do not spend too much time on any one item because it's very important that you are able to finish marking every item without leaving blanks.
We want to assure you the answers will be strictly confidential and nothing you state here will in any way be used by your employer or any other organization. Your willingness to participate will be shown by your return of this questionnaire. We do need everyone possible to take part so your cooperation would be greatly appreciated. V® DO NOT WANT YOU TO SIGN YOUR NAME TO ANY PART OF THE SURVEY, SO PLEASE BE AS STRAIGHTFORWARD AND HONEST ABOUT YOUR ANSWERS AS YOU CAN. THANK YOU!
DIRECTIONS: Carefully read each statement and circle the one answer to the right that best shows how much you agree or disagree with the statement, depending on how you feel in each case.
1 — Strongly Agree 2 — Agree 3 — Tend to Agree k — Neutral 5 — Tend to Disagree 6 — Disagree 7 — Strongly Disagree
Ex: "I enjoy helping others through OWL." 1 ji* 3 5 6 7
192
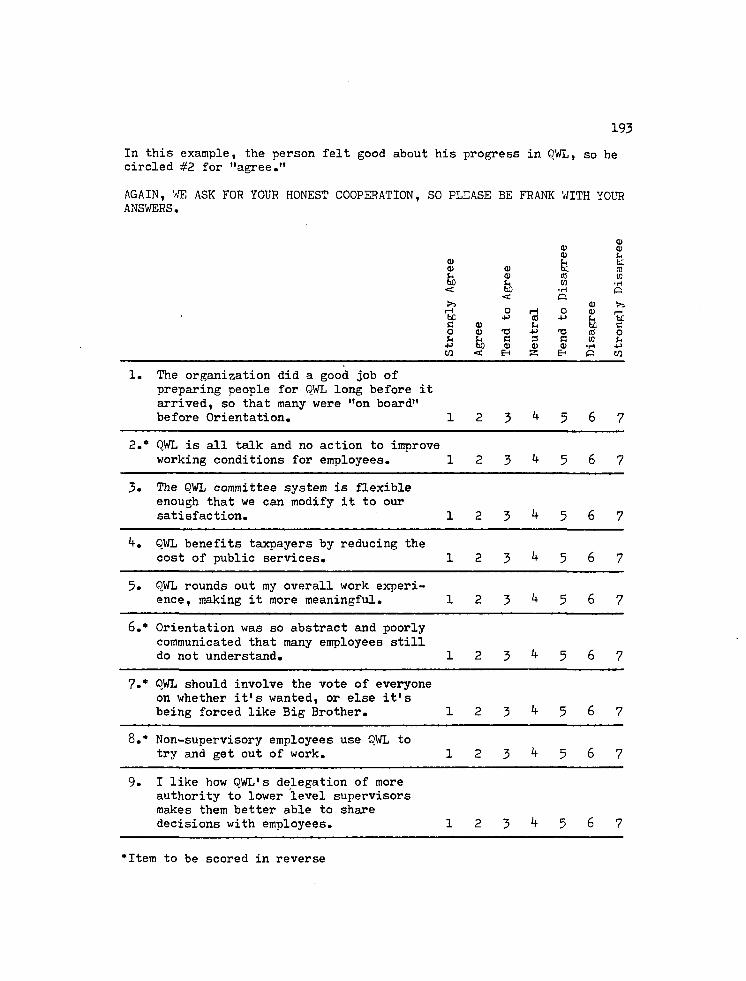
193
In this example, the person felt good about his progress in OWL, so he circled #2 for "agree."
AGAIN, WE ASK FOR YOUR HONEST COOPERATION, SO PLEASE BE FRANK WITH YOUR ANSWERS.
0) 0) 0) o a; fe 0) <1) fee 03 6b
Q) CO (/2 6b <
•H <
< •H o 0) r-H O H o 0) r- bC (0 4->
fe fee C 0) u fe c o <D TJ •p T3 CC o u
fco c C W u •p fco a) 0) CD •H •P
CO c EH z E-" w
1. The organization did a good job of preparing people for OWL long before it arrived, so that many were "on board" before Orientation. 12 3 567
2.* QWL is all talk and no action to improve working conditions for employees. 1 2 3 5 6 7
3. The OWL committee system is flexible enough that we can modify it to our satisfaction. 1 2 3 k 5 6 7
OWL benefits taxpayers by reducing the cost of public services. 1 2 3 k 5 6 7
5. QWL rounds out my overall work experience, making it more meaningful. 1 2 3 k 5 6 7
6.* Orientation was so abstract and poorly communicated that many employees still do not understand. 1 2 3 k 5 6 7
7.* QWL should involve the vote of everyone on whether it's wanted, or else it's being forced like Big Brother. 1 2 3 k 5 6 7
8.* Non-supervisory employees use QWL to try and get out of work. 1 2 3 k 5 6 7
9. I like how OWL's delegation of more authority to lower level supervisors makes them better able to share decisions with employees. 1 2 3 k 5 6 7
Item to be scored in reverse
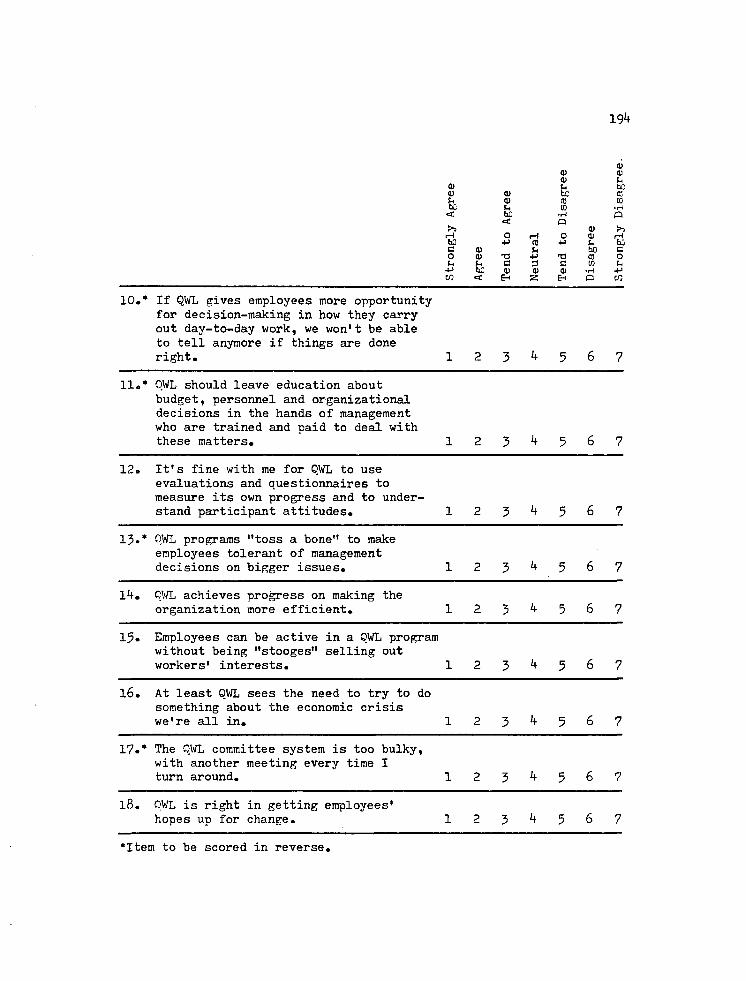
19*+
0 o> <13 0) SH <D hC <D a> tc CC 0) CO CO
fe w • H < fe •H
o o
>> 0) >> rH o rH 0 0) H faO CO 4J S* hO C 0) U bO C O 0) T3 4j T3 TO o u fe c s C W tn fe <D 0) 0) •H 4-> to < E-" 2 E-t Q CO
10.* If QWL gives employees more opportunity for decision-making in how they carry out day-to-day work, we won't be able to tell anymore if things are done right. 1 2 3 if 5 6 7
11.* OWL should leave education about budget, personnel and organizational decisions in the hands of management who are trained and paid to deal with these matters. 1 2 3 k 5 6 7
12. It's fine with me for QWL to use evaluations and questionnaires to measure its own progress and to understand participant attitudes. 1 2 3 k 5 6 7
13.* QWL programs "toss a bone" to make employees tolerant of management decisions on bigger issues. 1 2 3 k 5 6 7
1 . QWL achieves progress on making the organization more efficient. 1 2 3 k 5 6 7
15. Employees can be active in a OWL program without being "stooges" selling out workers' interests. 1 2 3 k 5 6 7
16. At least OWL sees the need to try to do something about the economic crisis we're all in. 1 2 3 k 5 6 7
17.* The QWL committee system is too bulky, with another meeting every time I turn around. 1 2 3 k 5 6 7
18. OWL is right in getting employees' hopes up for change. 1 2 3 k 5 6 7
•Item to be scored in reverse.
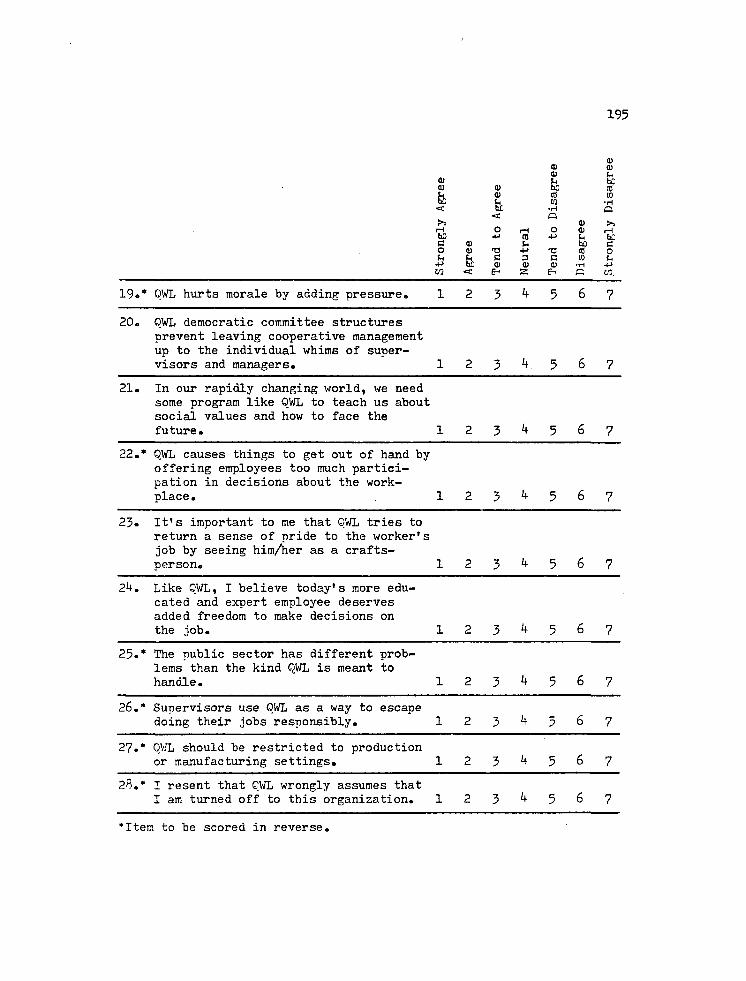
195
0) 0) <D
to to J* to u bC to to to u
Ec d to
ctf W
*rl < bC
< •H Q
Q
(D >» H O
3 O 0) rH
hO 4-) 3 -P U hC G to Sm faD G O to T3 4-» 13 O u G G to fc,
4-3 hb 0) 0) QJ •H -P w c E- 2 e-< - c w.
19•* QWL hurts morale by adding pressure. 12 3 567
20. OWL democratic committee structures prevent leaving cooperative management up to the individual whims of supervisors and managers. 1 2 3 k 5 6 7
21. In our rapidly changing world, we need some program like OWL to teach us about social values and how to face the future. 1 2 3 k 5 6 7
22.* QWL causes things to get out of hand by offering employees too much participation in decisions about the workplace. 1 2 3 k 5 6 7
23. It's important to me that OWL tries to return a sense of pride to the worker's job by seeing him/her as a crafts-person. 1 2 3 k 5 6 7
2*+. Like OWL, I believe today's more educated and expert employee deserves added freedom to make decisions on the job. 1 2 3 k 5 6 7
25.* The public sector has different problems than the kind QWL is meant to handle. 1 2 3 k 5 6 7
26.* Supervisors use OWL as a way to escape doing their jobs responsibly. 1 2 3 if 5 6 7
27.* OWL should be restricted to production or manufacturing settings. 1 2 3 k 5 6 7
28.* I resent that OWL wrongly assumes that I am turned off to this organization. 1 2 3 k 5 6 7
'Item to be scored in reverse.
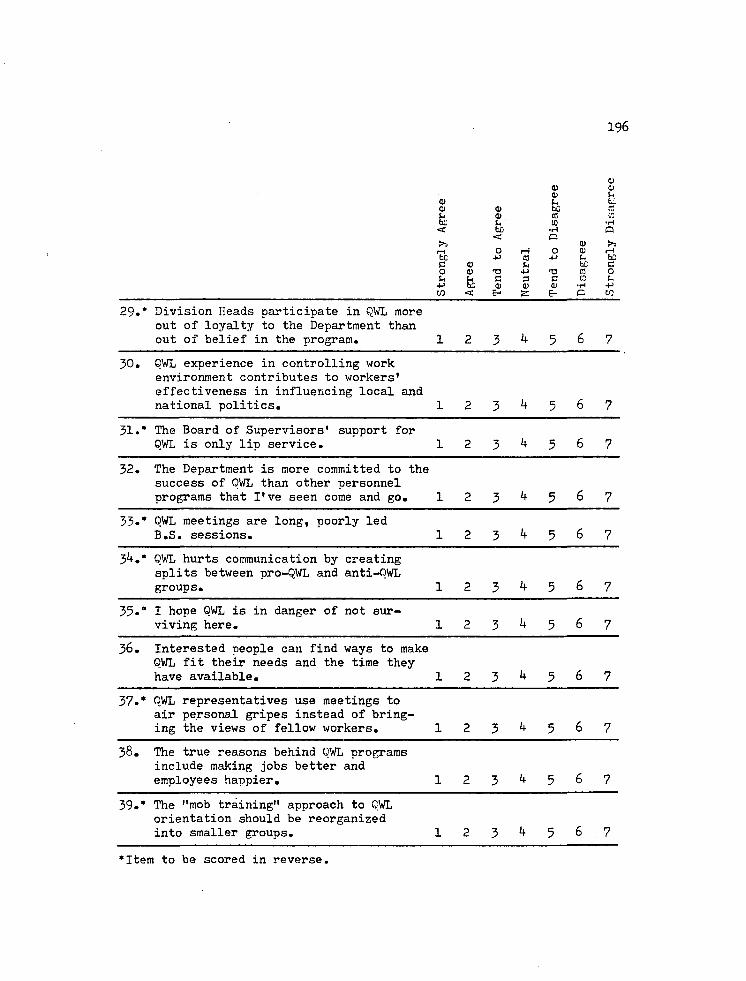
196
0) 0) O (D
0) tn bC <1> o bC & h* a> CO K bC u ' CO »H <C bu •H P
< P 0) r—( O r—1 O OJ r-H bC -P 05 -P U bC c o k bC C o 0) T3 -P T3 0 u u C 3 C M J-•M bO 0) a> <D •H •P
< E-1 2: E- P CO
29.* Division Heads participate in QWL more out of loyalty to the Department than out of belief in the program. 12 3 567
30. OWL experience in controlling work environment contributes to workers' effectiveness in influencing local and national politics. 1 2 3 5 6 7
31.* The Board of Supervisors' support for QWL is only lip service. 1 2 3 k 5 6 7
32. The Department is more committed to the success of OWL than other personnel programs that I've seen come and go. 1 2 3 if 5 6 7
33.* OWL meetings are long, poorly led B.S. sessions. 1 2 3 if 5 6 7
3 .* QWL hurts communication by creating splits between pro-QWL and anti-OWL groups. 1 2 3 if 5 6 7
35.* I hope QWL is in danger of not surviving here. 1 2 3 if 5 6 7
36. Interested people can find ways to make QWL fit their needs and the time they have available. 1 2 3 if 5 6 7
37.* OWL representatives use meetings to air personal gripes instead of bringing the views of fellow workers. 1 2 3 if 5 6 7
•
OO
The true reasons behind QWL programs include making jobs better and employees happier. 1 2 3 if 5 6 7
39.* The "mob training" approach to QWL orientation should be reorganized into smaller groups. 1 2 3 it 5 6 7
*Item to be scored in reverse.
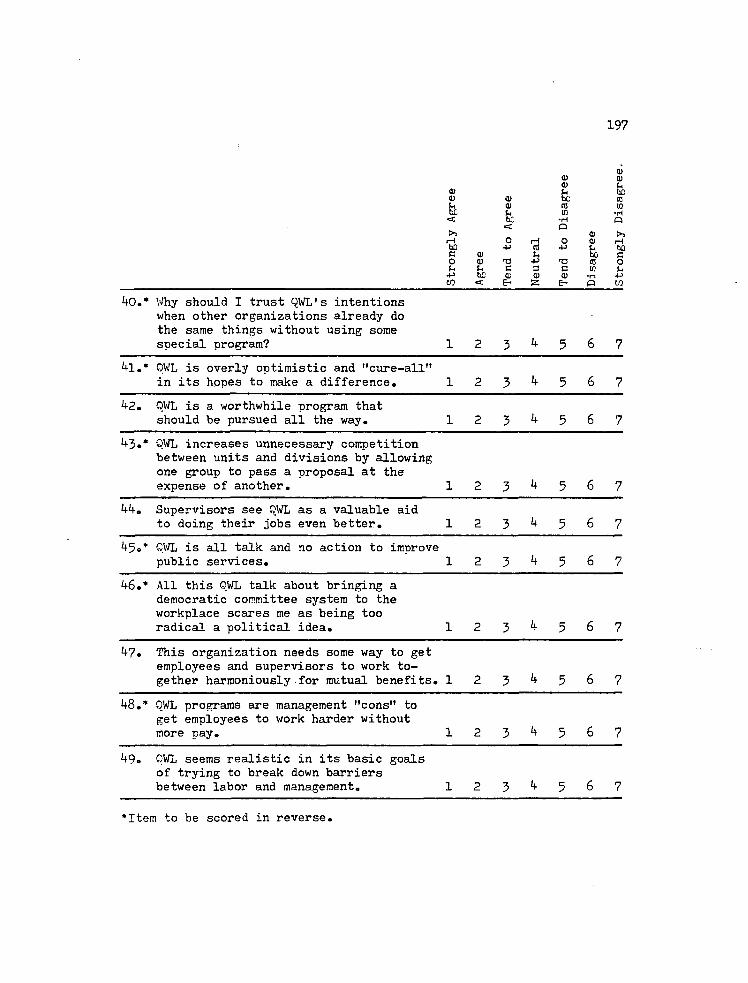
197
<0 0) 01 a> a> H he <D <1) he n3 0) rt 10 hC ID •H <E be <
*H Q Q >5 <u >> rH o rH o 4) rH he -p (0 4J P bO G 0) U hO c 0 <U T3 4-> T3 to o
U C 3 c in h£ d> <D a> •H +J
to «s EH 2 E- o w
bO." \ hy should I trust QWL's intentions when other organizations already do the same things without using some special program? 1 2 3 4 5 6 7
41. * OWL is overly optimistic and "cure-all" in its hopes to make a difference. 1 2 3 4 5 6 7
42. OWL is a worthwhile program that should be pursued all the way. 1 2 3 4 5 6 7
45.* OWL increases unnecessary competition between units and divisions by allowing one group to pass a proposal at the expense of another. 1 2 3 4 5 6 7
44. Supervisors see OWL as a valuable aid to doing their jobs even better. 1 2 3 4 5 6 7
45.* CWL is all talk and no action to improve public services. 1 2 3 4 5 6 7
46.• All this OWL talk about bringing a democratic committee system to the workplace scares me as being too radical a political idea. 1 2 3 4 5 6 7
47. This organization needs some way to get employees and supervisors to work together harmoniously for mutual benefits. 1 2 3 4 5 6 7
48.* OWL programs are management "cons" to get employees to work harder without more pay. 1 2 3 4 5 6 7
49. OWL seems realistic in its basic goals of trying to break down barriers between labor and management. 1 2 3 4 5 6 7
•Item to be scored in reverse.
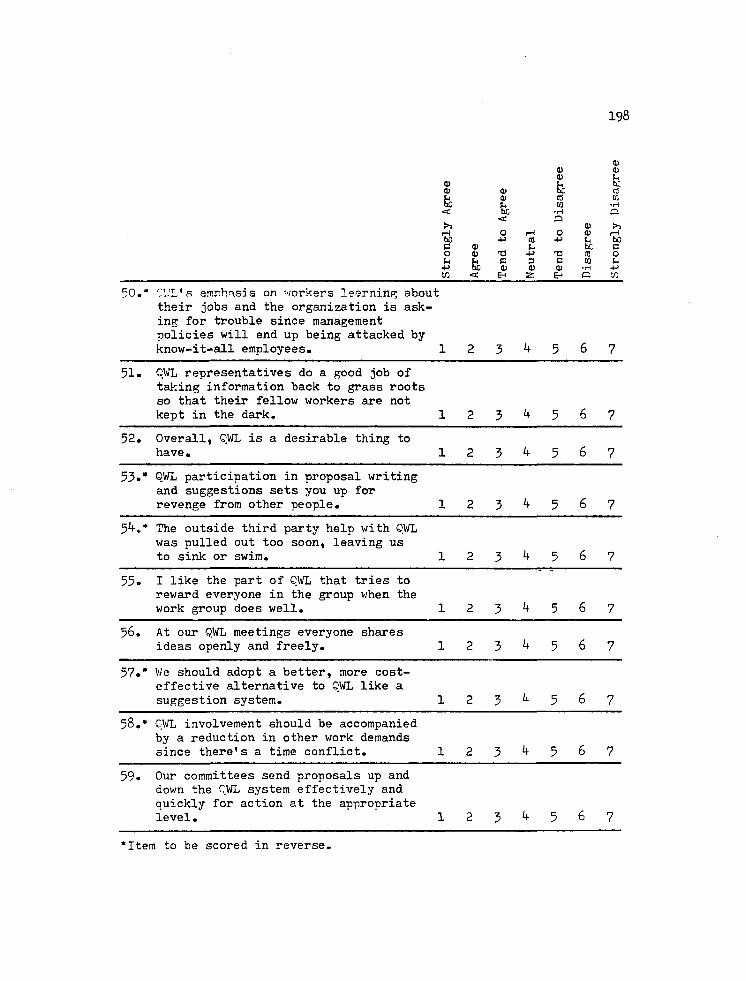
198
0) 0) d) a) SH
a> Q) 0) fe hC
C3
lb 0) (0 K
lb u (0 •H < bC
< •H Q
o >» 0) >> pH o rH O Q) rH to 4-> m 4-> U bO C 0) Sh be C o a> TJ •p T3 ro o u fe C 3 C 10 u 4J fe 0) 0) <D •H 4-> CO < EH 52 E-« c w
50.* CV.'L'k emnhasis on workers learning about their jobs and the organization is asking for trouble since management policies will end up being attacked by know-it-all employees. 1 2 3 if 5 6 7
51. CWL representatives do a good job of taking information back to grass roots so that their fellow workers are not kept in the dark. 1 2 3 k 5 6 7
52. Overall, OWL is a desirable thing to have. 1 2 3 k 5 6 7
53-* OWL participation in proposal writing and suggestions sets you up for revenge from other people. 1 2 3 k 5 6 7
5^.* The outside third party help with OWL was pulled out too soon, leaving us to sink or swim. 1 2 3 k 5 6 7
55. I like the part of OWL that tries to reward everyone in the group when the work group does well. 1 2 3 k 5 6 7
56. At our QWL meetings everyone shares ideas openly and freely. 1 2 3 k 5 6 7
57.* We should adopt a better, more cost-effective alternative to OWL like a suggestion system. 1 2 3 k 5 6 7
58.* CWL involvement should be accompanied by a reduction in other work demands since there's a time conflict. 1 2 3 k 5 6 7
59. Our committees send proposals up and down the OWL system effectively and quickly for action at the appropriate level. 1 2 3 k 5 6 7
'Item to be scored in reverse.
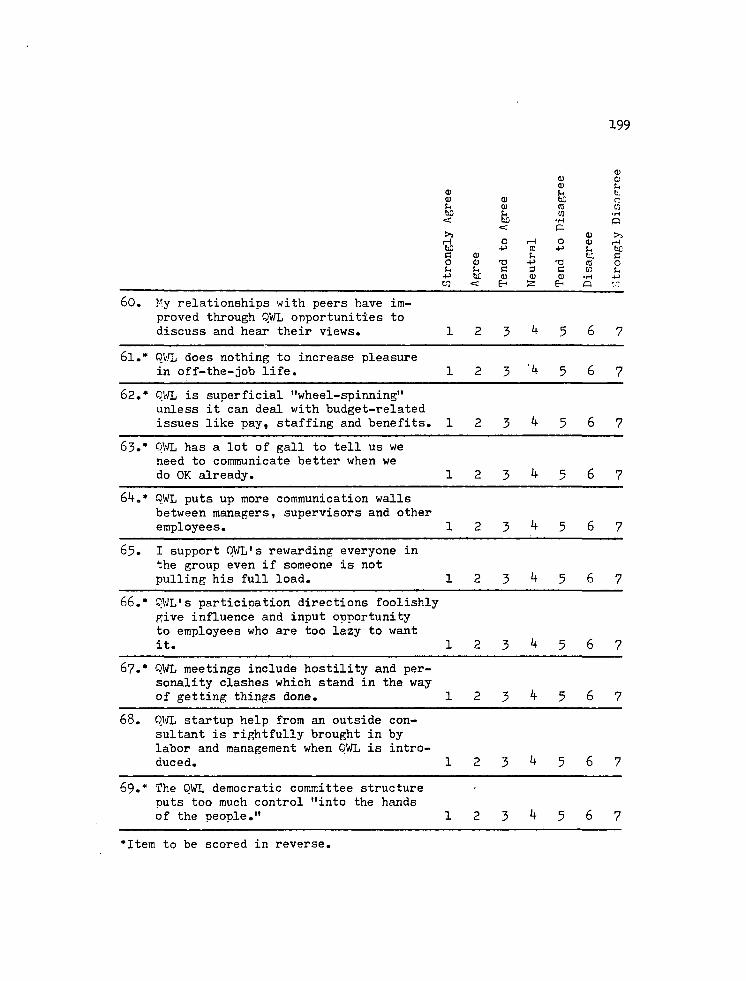
199
a) 0) aj a; t-
a) u b. <u ai bC r: u 01 CD to bo u M •H < Eb
<r •H <= o
>3 0 >1 rH o rH O 0) r*H bO +J ra 4J t- bC C <1) tc e o CD T3 +> T3 <B o u C 3 E in u
+> bC CD <D 01 •H 4-> w <c E- 2 E- Q
60. My relationships with peers have improved through OWL opportunities to discuss and hear their views. 1 2 3 4 5 6 7
61.* OWL does nothing to increase pleasure in off-the-job life. 1 2 3 '4 5 6 7
62.* OWL is superficial "wheel-spinning" unless it can deal with budget-related issues like pay, staffing and benefits. 1 2 3 4 5 6 7
63.* OWL has a lot of gall to tell us we need to communicate better when we do OK already. 1 2 3 4 5 6 7
64.* OWL puts up more communication walls between managers, supervisors and other employees. 1 2 3 4 5 6 7
65. I support QWL's rewarding everyone in the group even if someone is not pulling his full load. 1 2 3 4 5 6 7
66.* QWL's participation directions foolishly give influence and input opportunity to employees who are too lazy to want it. 1 2 3 4 5 6 7
67.* OWL meetings include hostility and personality clashes which stand in the way of getting things done. 1 2 3 4 5 6 7
68. OWL startup help from ail outside consultant is rightfully brought in by labor and management when OWL is introduced. 1 2 3 4 5 6 7
69.* The OWL democratic committee structure puts too much control "into the hands of the people." 1 2 3 4 5 6 7
•Item to be scored in reverse.
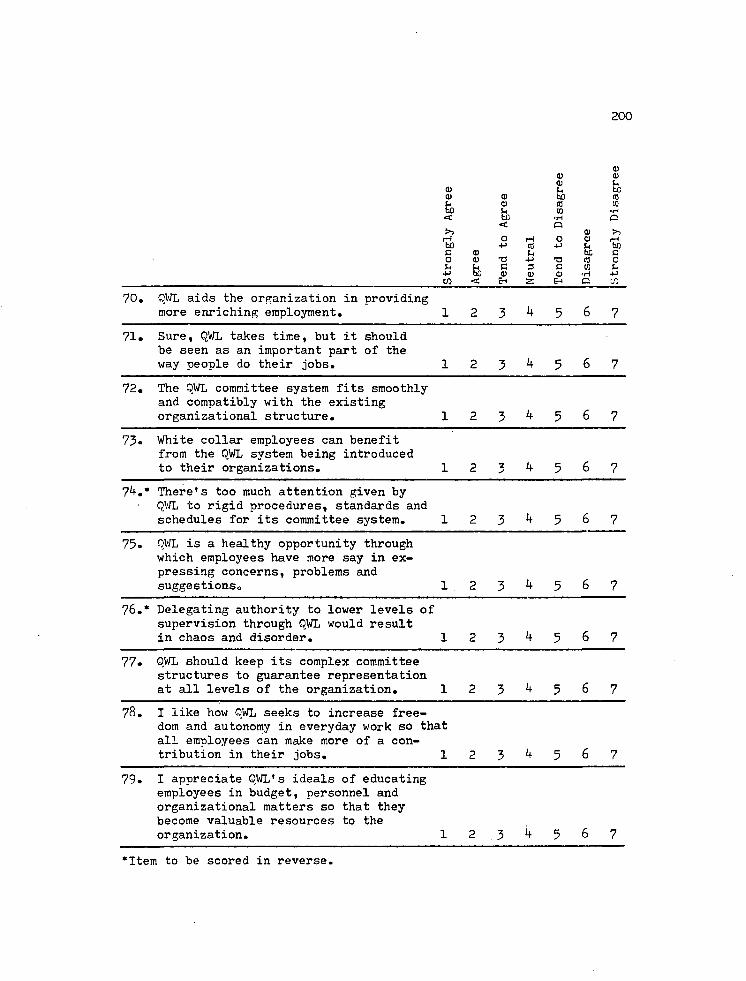
70. OWL aids the organization in providing more enriching employment. 12 3 567
71. Sure, QWL takes time, but it should be seen as an important part of the way people do their jobs. 12 3 567
72. The OWL committee system fits smoothly and compatibly with the existing organizational structure. 1 2 3 k 5 6 7
73. White collar employees can benefit from the QWL system being introduced to their organizations. 1 2 3 k 5 6 7
7 There's too much attention given by QWL to rigid procedures, standards and schedules for its committee system. 1 2 3 k 5 6 7
75. OWL is a healthy opportunity through which employees have more say in expressing concerns, problems and suggestions. 1 2 3 4 5 6 7
76.* Delegating authority to lower levels of supervision through QWL would result in chaos and disorder. 1 2 3 5 6 7
77. OWL should keep its complex committee structures to guarantee representation at all levels of the organization. 1 2 3 if 5 6 7
t
CO
I like how OWL seeks to increase freedom and autonomy in everyday work so that all employees can make more of a contribution in their jobs. 1 2 3 k 5 6 7
79. I appreciate QWL's ideals of educating employees in budget, personnel and organizational matters so that they become valuable resources to the organization. 1 2 .3 4 5 6 7
*Item to be scored in reverse.
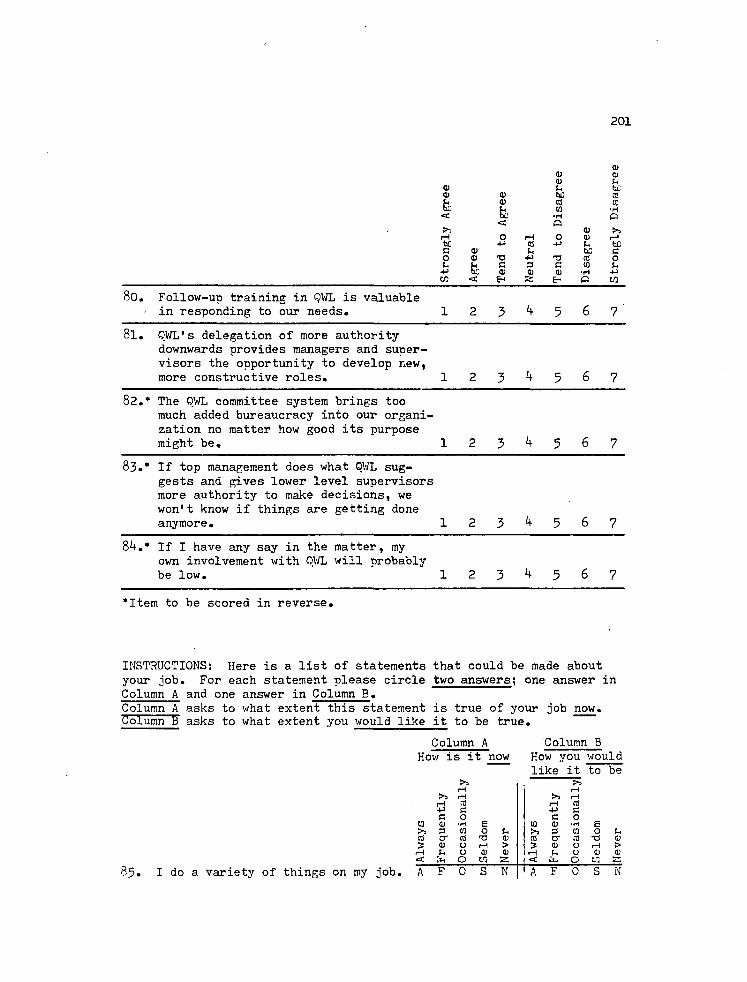
201
<D 0) O a> 5-
0) <L> 0) hO £0 b 0) cd W ho < fee
(0 •H
•H O
< O O)
rH 0 rH O 0) rH hC •p CO •P k hC C <D hC £ O <D TJ •P T3 O u h C X C to -p hC Q) <0 0) •H •P
< EH 55 E- O CO
80. Follow-up training in QWL is valuable - in responding to our needs. 12 3 567
00
• OWL's delegation of more authority downwards provides managers and supervisors the opportunity to develop new, more constructive roles. 1 2 3 k 5 6 7
82.* The OWL committee system brings too much added bureaucracy into our organization no matter how good its purpose might be. 1 2 3 k 5 6 7
* •
CO
If top management does what QWL suggests and gives lower level supervisors more authority to make decisions, we won't know if things are getting done anymore. 1 2 3 k 5 6 7
84.* If I have any say in the matter, my own involvement with OWL will probably be low. 1 2 3 h 5 6 7
"Item to be scored in reverse.
INSTRUCTIONS: Here is a list of statements that could be made about your job. For each statement please circle two answers; one answer in Column A and one answer in Column B. Column A asks to what extent this statement is true of your job now. Column ff asks to what extent you would like it to be true.
Column A How is it now
85. I do a variety of things on my job.
Column 3 How you would like it to be
rH rH rH rH
rH <0 rH CO -P G -P G C O C O to <D •H E (0 a> •rH E 3 CO O u 3 w O u to C7 £0 T3 Q) CO a* cc T3 <D
s Q) O rH > 5 0) 0 rH > pH U O (1) O rH k 0 <D a; < O CO a < 0 A F 0 S N A F 0 S N
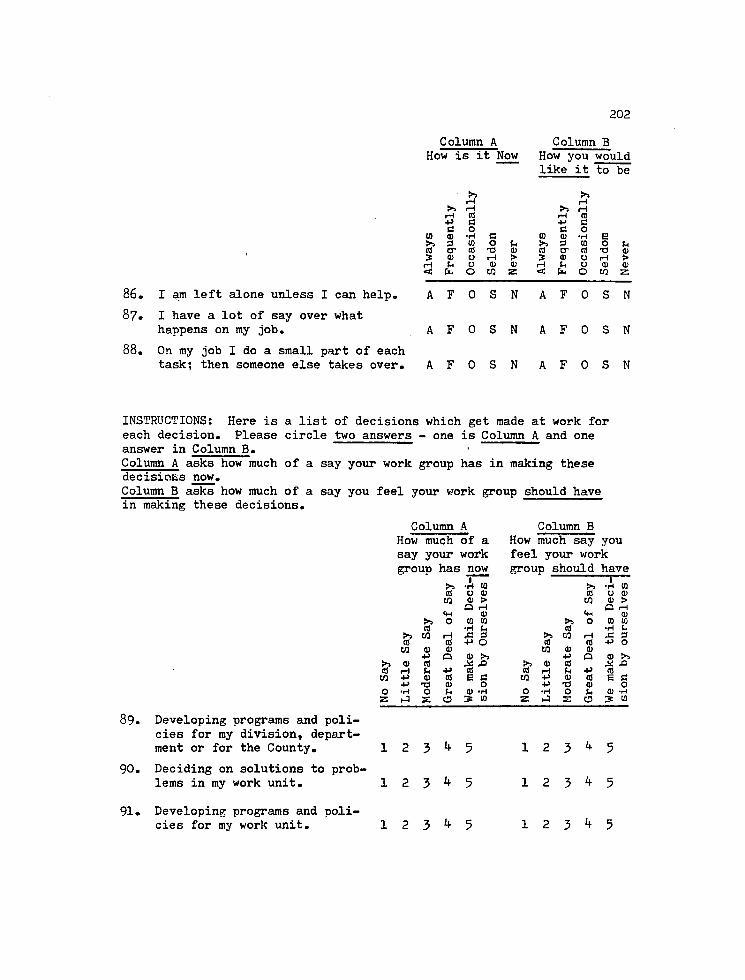
202
Column A How is it Now
Column B How you would like it to be
86. I am left alone unless I can help.
87. I have a lot of say over what happens on my job.
88. On my job I do a small part of each task; then someone else takes over.
>> >> rH rH
>> rH rH rH cd rH cd •P c -P c C 0 G 0
(0 <D •H S3 10 <L> •H E >> 3 (0 O u >5 3 CO O u cd cr cd TJ <D cd <T cd T3 0) 5 0) 0 r—1 > 5 0 0 rH > rH u 0 0) 0) rH u 0 0) 0) < En O w < £*4 O co 2
A F 0 S N A F 0 S N
A F O S N A F O S N
A F O S N A F O S N
INSTRUCTIONS: Here is a list of decisions which get made at work for each decision. Please circle two answers - one is Column A and one answer in Column B. Column A asks how much of a say your work group has in making these decisions now. Column B asks how much of a say you feel your v/ork group should have in making these decisions.
Column A How much of a say your work group has now
•A
Column B How much say you feel your work group should have
j •H
cd 0 a> cd 0 aj CO GJ > CO 0) >
O r—( CM
Q rH 0) CM 0)
>> 0 (0 (0 >s O CO W cd •H cd •H U CO rH & >? CO rH 3
cd cd •P O cd cd -P O CO a> O CO 0) 0 CO -p a <D >3 •p P 0) >>
>> a> cd ,0 >? 0) cd X3 cd rH JH •p cd cd rH u -p cd CO •P a> cd B a to -P 0) cd E a CO 4-> a) 0 •P 13 a> 0 0 •H 0 p a> •H 0 •H O 0) •H z 5: O 3 CO z X e> (Q
89. Developing programs and policies for my division, department or for the County.
Deciding on solutions to probl e m s i n m y w o r k u n i t . 1 2 3 ^ 5
1 2 3 ^ 5
90.
1 2 3 ^ 5
1 2 3 ^ 5
91. Developing programs and polic i e s f o r m y w o r k u n i t . 1 2 3 ^ 5 1 2 3 ^ 5
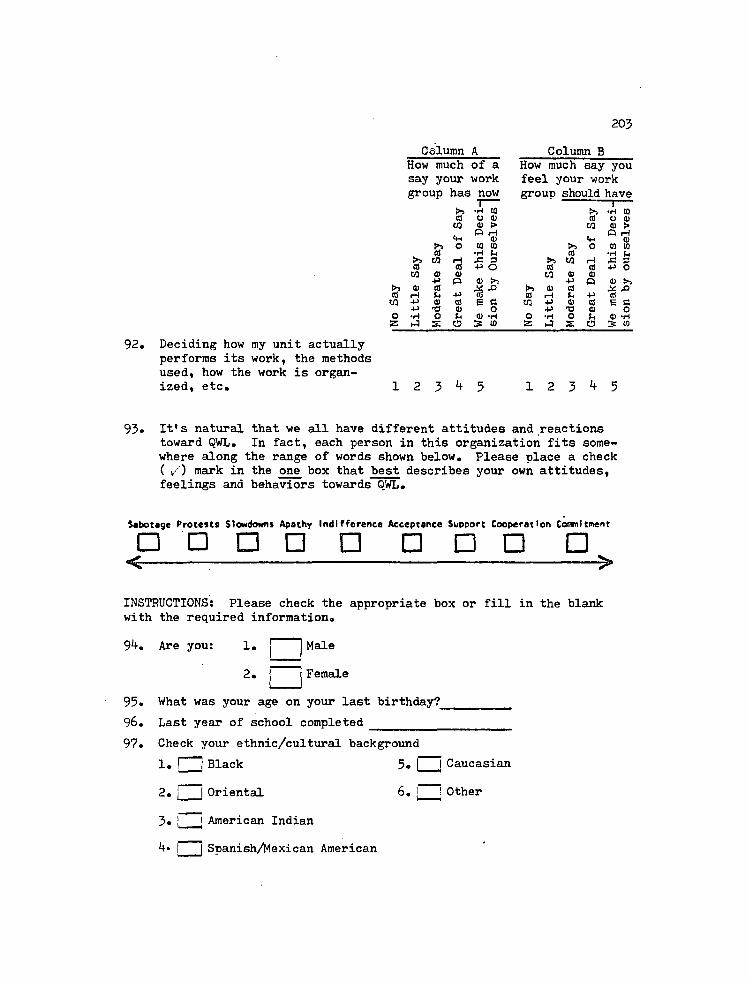
203
Calumn A Column B How much of a How much say you say your work feel your work group has now group should have
•H (0 •H CQ CO O 0) CO 0 a>
CO <D > CO 0) > P H O rH *M Q> <D
O (0 to >5 0 to (0 cO •H U CO •H U
& CO rH j: 3 >> CO rH & 2 CO (0 •p 0 CO CO «P O
CO 0 0) CO V O •p O 0) CO -p O 4) >5
0) (0 >> a> CO cfl rH u •P ro CO H fn •p CO co -P 4> E C CO V CO E C 4-> TJ d) 0 •P TJ a 0 0 •H O u 0) «rt 0 •H O O *H as s 0 3 to •-5 s: 0 S W
92. Deciding how my unit actually performs its work, the methods used, how the work is organized, etc. 1 2 3 * + 5 1 2 3 ^ 5
93. It* s natural that we all have different attitudes and reactions toward OWL. In fact, each person in this organization fits somewhere along the range of words shown below. Please place a check ( /) mark in the one box that best describes your own attitudes, feelings and behaviors towards OWL.
Sabotage Protests Slowdowns Apathy Indifference Acceptance Support Cooperation Conmitment
• ' • • • • • • • • ^
INSTRUCTIONS: Please check the appropriate box or fill in the blank with the required information.
9*+. Are you: 1. j jMale
2. j j Female
95. What was your age on your last birthday?_
96. Last year of school completed
97. Check your ethnic/cultural background
1. I | Black 5. I [ Caucasian
2. j [ Oriental 6. j jOther
3« 1 [ American Indian
k- | | Spanish/Mexican American
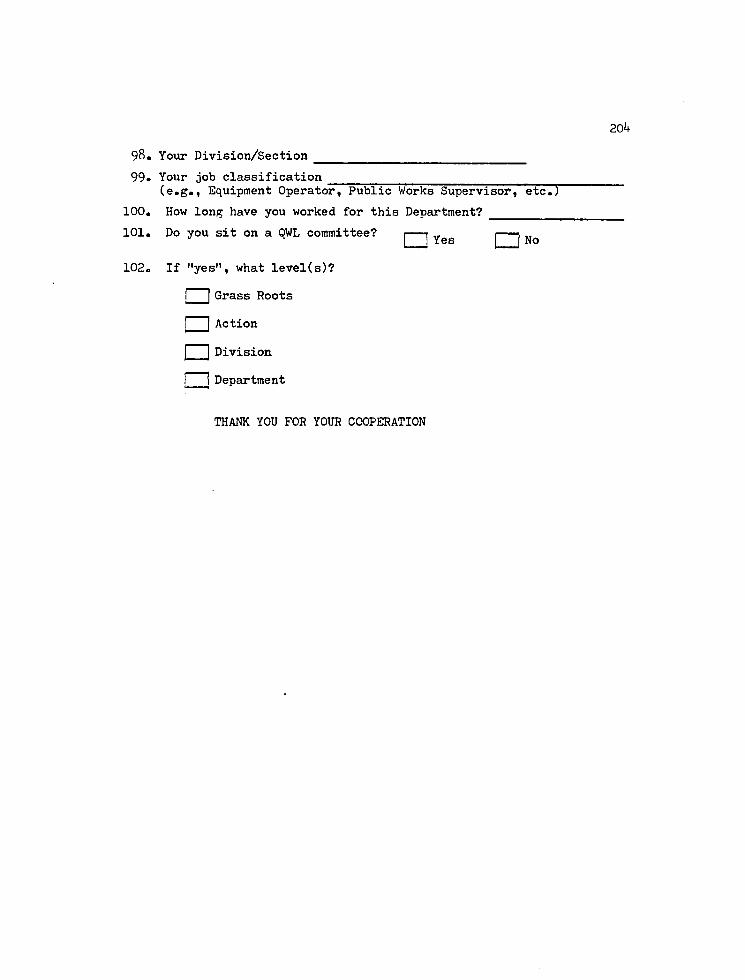
20k
98. Your Division/Section
99. Your job classification (e.g., Equipment Operator, Public Works Supervisor, etc.)
100. How long have you worked for this Department?
101. Do you sit on a QWL committee? j—j yeg | j Nq
102. If "yes", what level(s)?
[ | Grass Roots
a Action
• Division
1 | Department
THANK YOU FOR YOUR COOPERATION
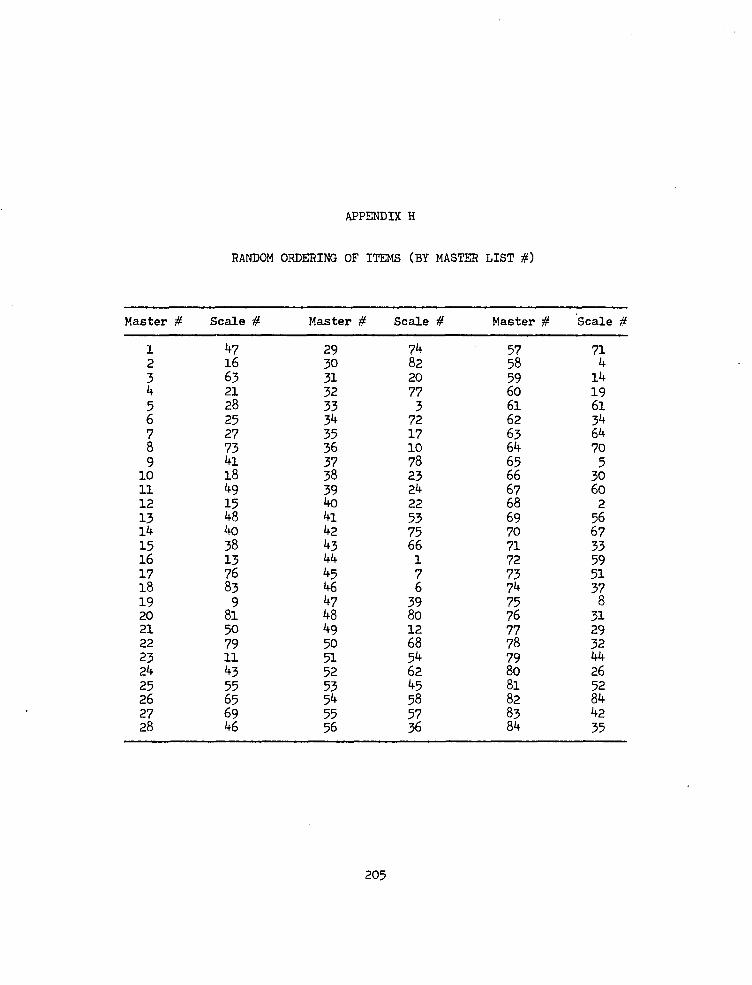
APPENDIX H
RANDOM ORDERING OF ITEMS (BY MASTER LIST #)
Master # Scale # Master # Scale # Master # Scale #
1 47 29 74 57 71 2 16 30 82 58 4 3 63 31 20 59 14 4 21 32 77 60 19 5 28 33 3 61 61 6 25 34 72 62 34 7 27 35 17 63 64 8 73 36 10 64 70 9 41 37 78 65 5 10 18 38 23 66 30 11 49 39 24 67 60 12 15 40 22 68 2 13 48 41 53 69 56 14 40 42 75 70 67 15 38 43 66 71 33 16 13 44 1 72 59 17 76 45 7 73 51 18 83 46 6 74 37 19 9 47 39 75 8 20 81 48 80 76 31 21 50 49 12 77 29 22 79 50 68 78 32 23 11 51 54 79 44 24 43 52 62 80 26 25 55 53 45 81 52 26 65 54 58 82 84 27 69 55 57 83 42 28 46 56 36 84 35
205
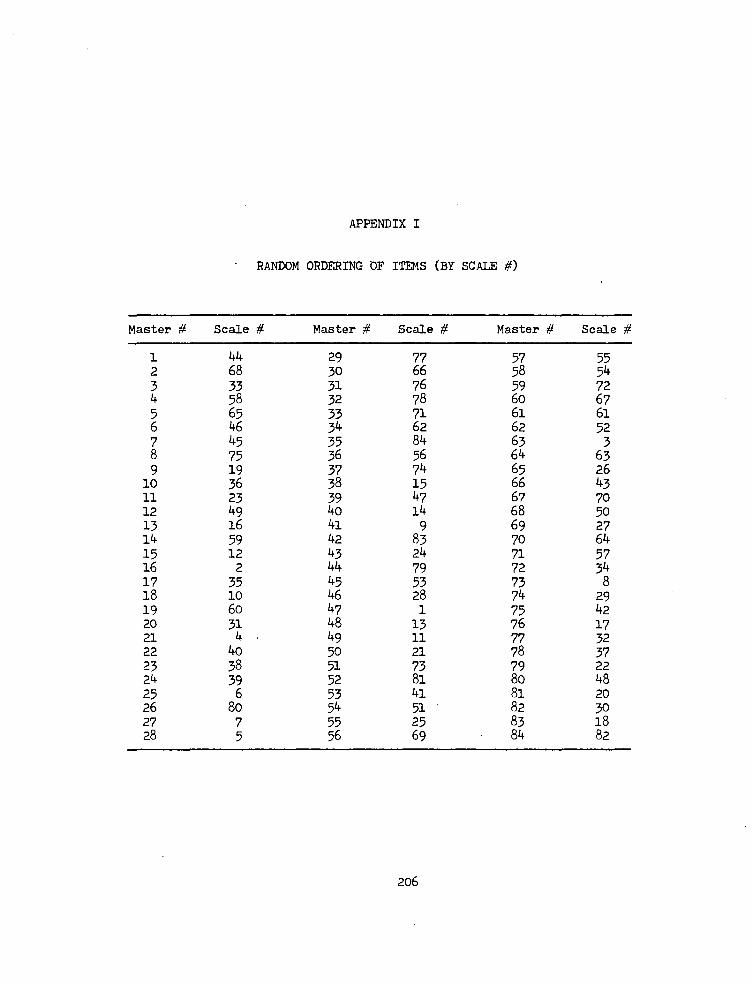
APPENDIX I
RANDOM ORDERING OF ITEMS (BY SCALE #)
Master # Scale # Master # Scale # Master # Scale #
1 44 29 77 57 55 2 68 30 66 58 54 3 33 31 76 59 72 4 58 32 78 60 67 5 65 33 71 61 61 6 46 3 62 62 52 7 45 35 84 63 3 8 75 36 56 64 63 9 19 37 74 65 26 10 36 38 15 66 43 11 23 39 47 67 70 12 49 40 14 68 50 13 16 4l 9 69 27 14 59 42 83 70 64 15 12 43 24 71 57 16 2 44 79 72 34 17 35 45 53 73 8 18 10 46 28 74 29 19 60 47 1 75 42 20 31 48 13 76 17 21 4 • 49 11 77 32 22 4o 50 21 78 37 23 38 51 73 79 22 24 39 52 81 80 48 25 6 53 4i 81 20 26 80 54 51 82 30 27 7 55 25 83 18 28 5 56 69 84 82
206
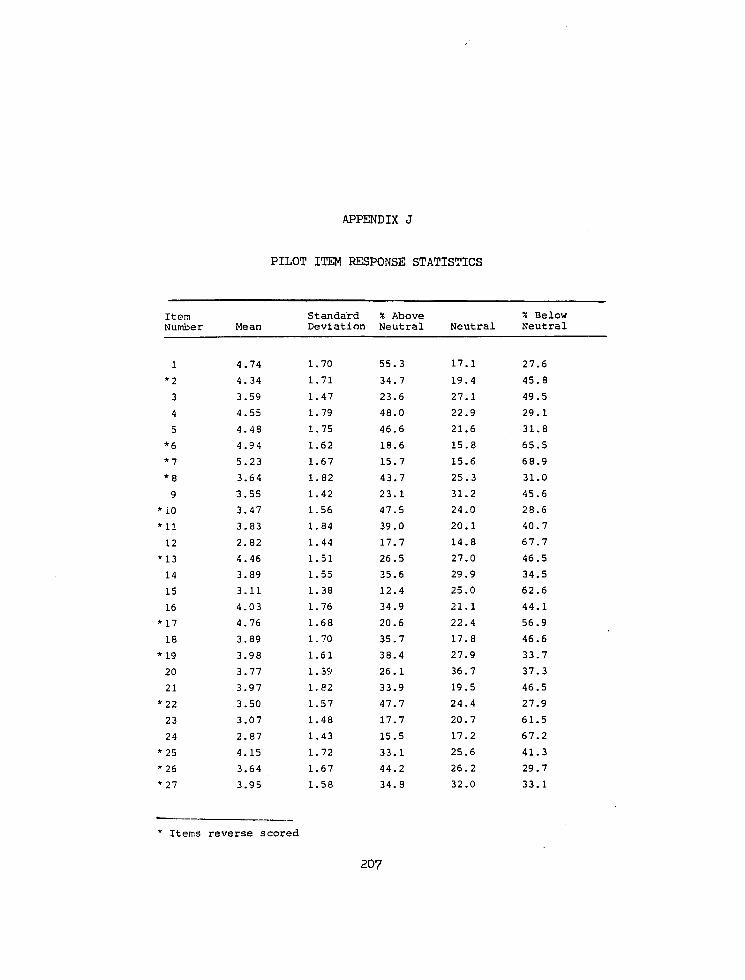
APPENDIX J
PILOT ITEM RESPONSE STATISTICS
I t e m S t a n d a r d % A b o v e % B e l o w N u m b e r M e a n D e v i a t i o n N e u t r a l N e u t r a l N e u t r a l
1 4 . . 7 4 1 . 7 0 5 5 . 3 1 7 . 1 2 7 . 6
* 2 4 . . 3 4 1 . 7 1 3 4 . 7 1 9 . 4 4 5 . 8
3 3 . . 5 9 1 . 4 7 2 3 . 6 2 7 . 1 4 9 . 5
4 4 . . 5 5 1 . 7 9 4 8 . 0 2 2 . 9 2 9 . 1
5 4 . . 4 8 1 . 7 5 4 6 . 6 2 1 . 6 3 1 . 8
* 6 4 . . 9 4 1 . 6 2 1 8 . . 6 1 5 . 8 6 5 . 5
* 7 5 . . 2 3 1 . 6 7 1 5 . 7 1 5 . 6 6 8 . 9
* 8 3 . . 6 4 1 . 8 2 4 3 . , 7 2 5 . 3 3 1 . 0
9 3 . . 5 5 1 . 4 2 2 3 . 1 3 1 . 2 4 5 . 6
i O 3 . . 4 7 1 . 5 6 4 7 . 5 2 4 . 0 2 8 . 6
1 1 3 . . 8 3 1 . 8 4 3 9 . 0 2 0 . 1 4 0 . 7
1 2 2 . , 8 2 1 . 4 4 1 7 . 7 1 4 . 8 6 7 . 7
1 3 4 . . 4 6 1 . 5 1 2 6 . 5 2 7 . 0 4 6 . 5
1 4 3 . . 8 9 1 . 5 5 3 5 . 6 2 9 . 9 3 4 . 5
1 5 3 . . 1 1 1 . 3 8 1 2 . 4 2 5 . 0 6 2 . 6
1 6 4 . . 0 3 1 . 7 6 3 4 . 9 2 1 . 1 4 4 . 1
1 7 4 . . 7 6 1 . 6 8 2 0 . 6 2 2 . 4 5 6 . 9
1 8 3 . . 8 9 1 . 7 0 3 5 . 7 1 7 . 8 4 6 . 6
1 9 3 . . 9 8 1 . 6 1 3 8 . 4 2 7 . 9 3 3 . 7
2 0 3 . . 7 7 1 . 3 9 2 6 . 1 3 6 . 7 3 7 . 3
2 1 3 . . 9 7 1 , 8 2 3 3 . 9 1 9 . 5 4 6 . 5
2 2 3 . . 5 0 1 . 5 7 4 7 . 7 2 4 . 4 2 7 . 9
2 3 3 . . 0 7 1 . 4 8 1 7 . 7 2 0 . 7 6 1 . 5
2 4 2 . . 8 7 1 . 4 3 1 5 . 5 1 7 . 2 6 7 . 2
2 5 4 . . 1 5 1 . 7 2 3 3 . 1 2 5 . 6 4 1 . 3
2 6 3 . , 6 4 1 . 6 7 4 4 . 2 2 6 . 2 2 9 . 7
2 7 3 . . 9 5 1 . 5 8 3 4 . 8 3 2 . 0 3 3 . 1
I t e m s r e v e r s e s c o r e d
207

208
I t e m S t a n d a r d % A b o v e £ B e l o w N u m b e r M e a n D e v i a t i o n N e u t r a l N e u t r a l N e u t r a l
* 2 8 4 . 1 1
* 2 9 4 . 9 5
3 0 4 . 5 7
* 3 1 5 . 1 7
3 2 3 . 2 3
* 3 3 4 . 3 6
* 3 4 4 . 0 5
* 3 5 3 . 9 3
3 6 2 . 9 6
* 3 7 4 . 0 4
3 8 3 . 1 8
* 3 9 4 . 5 6
* 4 0 4 . 1 3
* 4 1 4 . 3 6
4 2 3 . 6 4
* 4 3 3 . 9 0
4 4 4 . 1 7
* 4 5 4 . 3 2
* 4 6 3 . 5 1
4 7 2 . 6 6
* 4 8 4 . 1 8
4 9 3 . 3 5
* 5 0 3 . 6 6
5 1 3 . 6 7
5 2 3 . 7 0
* 5 3 3 . 1 5
* 5 4 3 . 9 8
5 5 3 . 7 3
1 . 6 5 3 1 . 5
1 . 5 7 1 7 . 0
1 . 5 7 3 9 . 0
1 . 4 3 9 . 7
1 . 4 6 1 7 . 6
1 . 5 8 2 7 . 3
1 . 5 4 3 2 . 7
1 . 8 1 3 6 . 8
1 . 2 7 1 2 . 5
1 . 5 7 2 8 . 9
1 . 5 1 1 8 . 1
1 . 3 2 2 2 . 6
1 . 4 1 2 5 . 1
1 . 4 6 2 5 . 8
1 . 7 1 2 6 . 4
1 . 5 1 3 7 . 0
1 . 5 2 3 6 . 4
1 . 7 1 3 2 . 4
1 . 5 6 3 0 . 7
1 . 3 8 1 1 . 9
1 . 7 1 3 5 . 8
1 . 5 4 2 3 . 9
1 . 5 5 4 1 . 9
1 . 5 6 2 4 . 5
1 . 7 9 2 5 . 9
1 . 3 6 5 2 . 1
1 . 2 4 2 9 . 1
1 . 5 1 2 2 . 5
2 6 . 9 4 1 . 5
2 2 . 8 6 0 . 2
3 2 . 8 2 8 . 2
2 4 . 4 6 5 . 9
2 7 . 3 5 5 . 1
2 5 . 6 4 7 . 2
2 9 . 3 3 8 . 0
3 1 . 6 3 1 . 7
1 9 . 9 6 7 . 7
2 9 . 9 4 1 . 2
1 8 . 6 6 3 . 3
3 5 . 3 4 2 . 2
3 6 . 0 3 8 . 9
2 7 . 0 4 7 . 2
2 5 . 9 4 7 . 7
3 1 . 3 3 1 . 8
3 1 . 3 3 2 . 4
2 3 . 3 4 4 . 3
3 3 . 9 2 5 . 4
1 5 . 3 7 2 . 9
2 3 . 3 4 0 . 9
1 5 . 9 6 0 . 3
2 5 . 3 3 2 . 8
2 6 . 9 4 8 . 6
2 5 . 9 4 8 . 3
2 7 . 4 2 0 . 6
3 8 . 9 3 2 . 0
3 0 . 6 4 6 . 8
* Items reverse scored
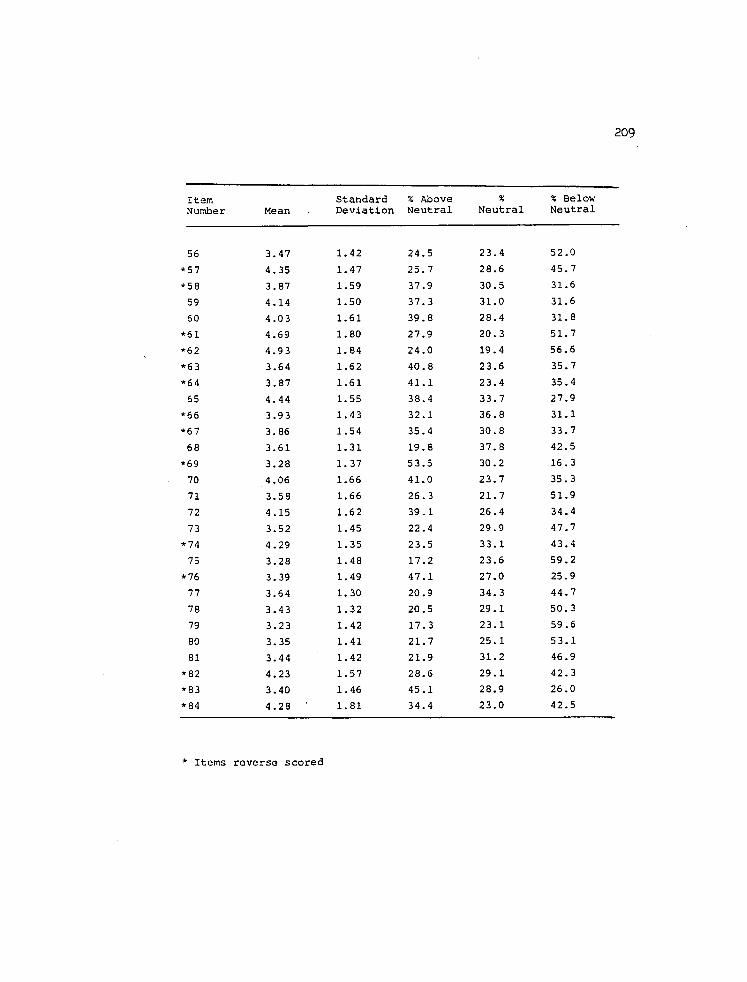
I t e m S t a n d a r d X A b o v e % % B e l o w N u m b e r M e a n D e v i a t i o n N e u t r a l N e u t r a l N e u t r a l
5 6 3 , . 4 7 1. 4 2 2 4 . 5 2 3 . 4 5 2 . 0
* 5 7 4 . . 3 5 1. 4 7 2 5 . 7 2 8 . 6 4 5 . 7
* 5 8 3 . 8 7 1. 5 9 3 7 . 9 3 0 . 5 3 1 . 6
5 9 4 , . 1 4 1. 5 0 3 7 . 3 3 1 . 0 3 1 . 6
6 0 4 , . 0 3 1. 6 1 3 9 . 8 2 8 . 4 3 1 . 8
* 6 1 4 . . 6 9 1. 8 0 2 7 . 9 2 0 . 3 5 1 . 7
* 6 2 4 . . 9 3 1. 8 4 2 4 . 0 1 9 . 4 5 6 . 6
* 6 3 3 . 6 4 1. 6 2 4 0 . 8 2 3 . , 6 3 5 . 7
* 6 4 3 . 8 7 1. 6 1 4 1 . 1 2 3 . 4 3 5 . 4
6 5 4 . . 4 4 1. 5 5 3 8 . 4 3 3 . 7 2 7 . 9
* 6 6 3 . . 9 3 1. 4 3 3 2 . 1 3 6 . 8 3 1 . 1
* 6 7 3 . . 8 6 1. 5 4 3 5 . 4 3 0 . 8 3 3 . 7
6 8 3 , . 6 1 1. 3 1 1 9 . 8 3 7 . 8 4 2 . 5
* 6 9 3 , . 2 8 1. 3 7 5 3 . 5 3 0 . 2 1 6 . 3
7 0 4 . . 0 6 1. 6 6 4 1 . 0 2 3 . 7 3 5 . 3
7 1 3 , . 5 8 1. 6 6 2 6 . 3 2 1 . . 7 5 1 . 9
7 2 4 . 1 5 1. 6 2 3 9 . 1 2 6 . 4 3 4 . 4
7 3 3 . 5 2 1. 4 5 2 2 . 4 2 9 . 9 4 7 . 7
* 7 4 4 . 2 9 1. 3 5 2 3 . 5 3 3 . 1 4 3 . 4
7 5 3 . 2 8 1. 4 8 1 7 . 2 2 3 . 6 5 9 . 2
* 7 6 3 . 3 9 1. 4 9 4 7 . 1 2 7 . 0 2 5 . 9
7 7 3 . . 6 4 1. 3 0 2 0 . 9 3 4 . 3 4 4 . 7
7 8 3 . 4 3 1. 3 2 2 0 . 5 2 9 . 1 5 0 . 3
7 9 3 . 2 3 1. 4 2 1 7 . 3 2 3 . , 1 5 9 . 6
8 0 3 . 3 5 1. . 4 1 2 1 . 7 2 5 . 1 5 3 . 1
8 1 3 . 4 4 1. 4 2 2 1 . 9 3 1 . , 2 4 6 . 9
* 8 2 4 . 2 3 1. 5 7 2 8 . 6 2 9 . 1 4 2 . 3
* 8 3 3 . 4 0 1. 4 6 4 5 . 1 2 8 . 9 2 6 . 0
* 8 4 4 . 2 8 1. 8 1 3 4 . 4 2 3 . 0 4 2 . 5
* Items reverse scored
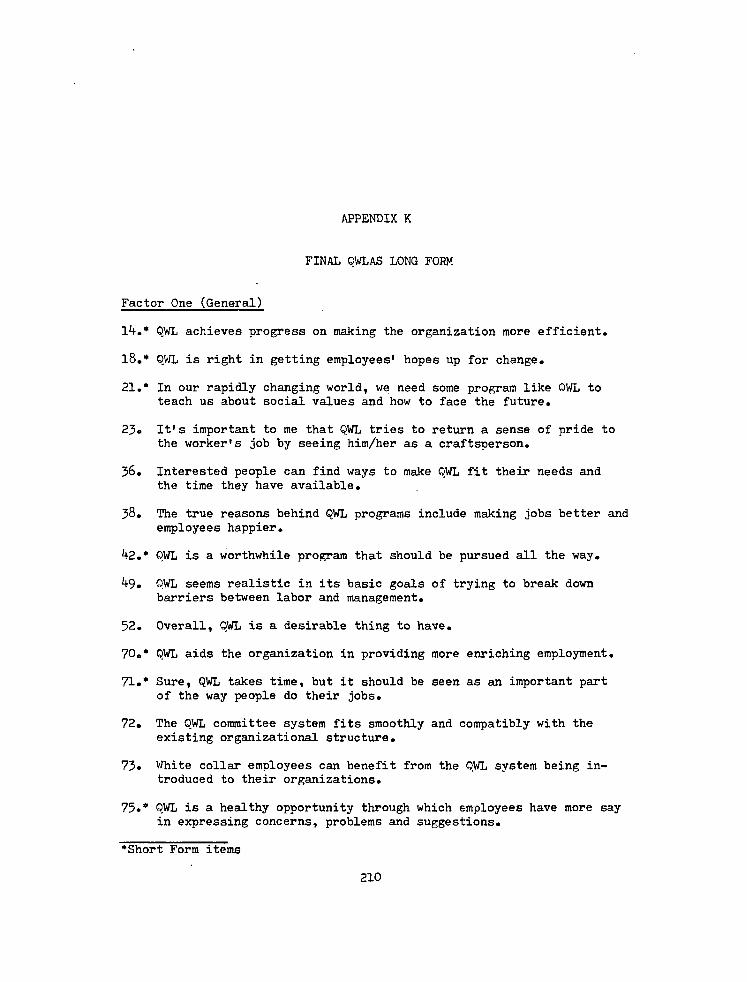
APPENDIX K
FINAL OWLAS LONG FORM
Factor One (General)
1*+.* QWL achieves progress on making the organization more efficient.
18.* OWL is right in getting employees* hopes up for change.
21.* In our rapidly changing world, we need some program like OWL to teach us about social values and how to face the future.
23. It1s important to me that QWL tries to return a sense of pride to the worker's job by seeing him/her as a craftsperson.
36. Interested people can find ways to make OWL fit their needs and the time they have available.
38. The true reasons behind OWL programs include making jobs better and employees happier.
kZ.* QWL is a worthwhile program that should be pursued all the way.
9. QWL seems realistic in its basic goals of trying to break down barriers between labor and management.
52. Overall, OWL is a desirable thing to have.
70.* QWL aids the organization in providing more enriching employment.
71.* Sure, QWL takes time, but it should be seen as an important part of the way people do their jobs.
72. The QWL committee system fits smoothly and compatibly with the existing organizational structure.
73. White collar employees can benefit from the OWL system being introduced to their organizations.
75.* QWL is a healthy opportunity through which employees have more say in expressing concerns, problems and suggestions.
•Short Form items
210

211
78. I like how QWL seeks to increase freedom and autonomy in everyday work so that all employees can make more of a contribution in their jobs.
80. Follow-up training in QWL is valuable in responding to our needs.
81. OWL's delegation of more authority downwards provides managers and supervisors the opportunity to develop new, more constructive roles.
Factor Two (Specific Concerns)
17.* The QWL committee system is too bulky, with another meeting every time I turn around.
33.* QWL meetings are long, poorly led B.S. sessions.
34.* QWL hurts communication by creating splits between pro-QWL and anti-QWL groups.
40. Why should I trust QWL's intentions when other organizations already do the same things without using some special program?
41. QWL is overly optimistic and "cure-all" in its hopes to make a difference.
43. QWL increases unnecessary competition between units and divisions by allowing one group to pass a proposal at the expense of another.
44. Supervisors see QWL as a valuable aid to doing their jobs even better.
45.* QWL is all talk and no action to improve public services.
62.* QWL is superficial "wheel-spinning" unless it can deal with budget-related issues like pay, staffing and benefits.
64. QWL puts up more communication walls between managers, supervisors and other employees.
82.* The QWL committee system brings too much added bureaucracy into our organization no matter how good its purposes might be.
84." If I have any say in the matter, my own involvement with QWL will probably be low.
•Short Form items
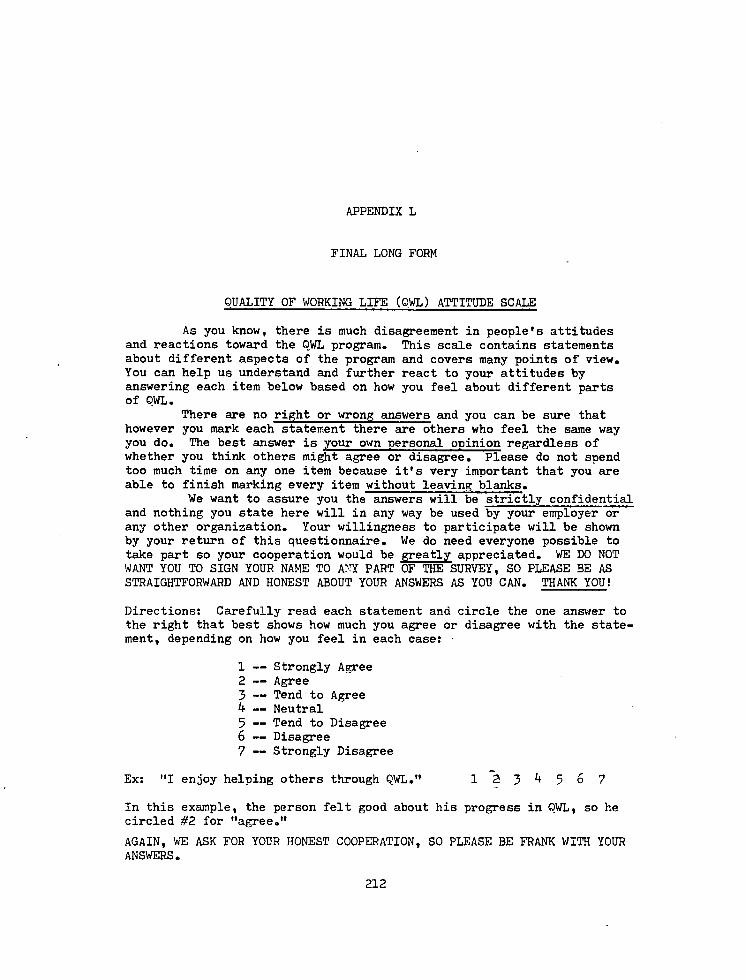
APPENDIX L
FINAL LONG FORM
QUALITY OF WORKING LIFE (QWL) ATTITUDE SCALE
As you know, there is much disagreement in people's attitudes and reactions toward the QWL program. This scale contains statements about different aspects of the program and covers many points of view. You can help us understand and further react to your attitudes by answering each item below based on how you feel about different parts of QWL.
There are no right or wrong answers and you can be sure that however you mark each statement there are others who feel the same way you do. The best answer is your own personal opinion regardless of whether you think others might agree or disagree. Please do not spend too much time on any one item because it's very important that you are able to finish marking every item without leaving blanks.
We want to assure you the answers will be strictly confidential and nothing you state here will in any way be used by your employer or any other organization. Your willingness to participate will be shown by your return of this questionnaire. We do need everyone possible to take part so your cooperation would be greatly appreciated. WE DO NOT WANT YOU TO SIGN YOUR NAME TO ACT PART OF THE SURVEY, SO PLEASE BE AS STRAIGHTFORWARD AND HONEST ABOUT YOUR ANSWERS AS YOU CAN. THANK YOU!
Directions: Carefully read each statement and circle the one answer to the right that best shows how much you agree or disagree with the statement, depending on how you feel in each case:
1 — Strongly Agree 2 — Agree 3 — Tend to Agree k __ Neutral 5 — Tend to Disagree 6 — Disagree 7 — Strongly Disagree
Ex: "I enjoy helping others through QWL." 12 3 567
In this example, the person felt good about his progress in QWL, so he circled #2 for "agree."
AGAIN, WE ASK FOR YOUR HONEST COOPERATION, SO PLEASE BE FRANK WITH YOUR ANSWERS.
212

213
d> <u
<
bO c a> o 01 u 6) w <
<D O <D O u
<D fe QL nJ 0) d CO
u w •H to •H C < O 0) 0 »H O 0 r—1 -p (0
u -P 6c bC
C T3 •p T3 CO O C p C 10 U <D 0 O •H •P 2 EH P 03
3 k 5 6 7
3 k 5 6 7
1. The true reasons behind OWL programs include making jobs better and employees happier. 1 2
2. Overall, QWL is a desirable thing to have. 1 2
3. The OWL committee system is too bulky, with another meeting every time I turn around. 12 3 567
4. QWL increases unnecessary competition between units and divisions by allowing one group to pass a proposal at the expense of another. 12 3 567
5. OWL is all talk and no action to improve public services. 12 3 567
6. QWL is right in getting employees' hopes up for change. 12 3 567
7. QWL achieves progress on making the organization more efficient. 12 3 567
8. Interested people can find ways to make QWL fit their needs and the time they have available. 12 3 567
9. I like how QWL seeks to increase freedom and autonomy in everyday work so that all employees can make more of a contribution to their job. 12 3 567
10. QWL is superficial "wheel-spinning" unless it can deal with budget-related issues like pay, staffing and benefits. 12 3 +567
11. QWL puts up more communication walls between managers, supervisors and other employees. 12 3 567
12. The QWL committee system brings too much added bureaucracy into our organization no matter how good its purposes might be. 12 3 567
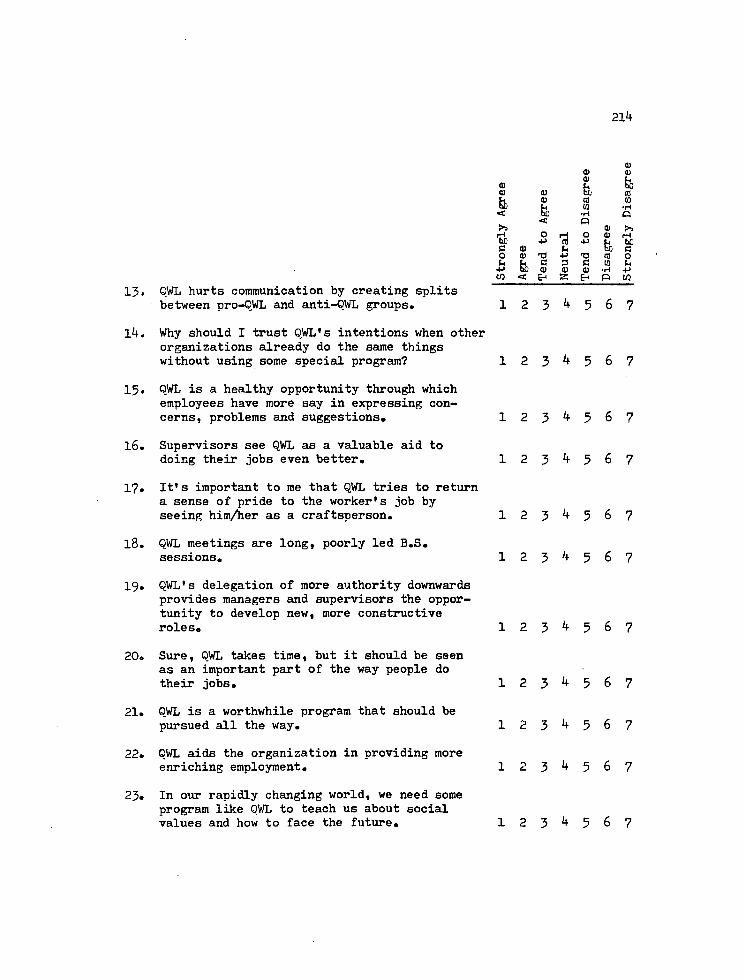
21k
a> 4) 0)
«) U fe Q) U Si (0 (h D d (0 O0 U 10 -H < bo -H o
< O 0) >3
O H O 0) H be +> to 4J U bC cm t* Eo a o a) t3 -u -a to o h t, C 3 G CO (h •P hi) V a) 4) -H +> 03 < E-I jg E-1 Q M
13. OWL hurts communication by creating splits between pro-QWL and anti-QWL groups. 12 3 567
lk. Why should I trust QWL's intentions when other organizations already do the same things without using some special program? 12 3 567
15. QWL is a healthy opportunity through which employees have more say in expressing concerns, problems and suggestions. 1 2 3 5 6 7
16. Supervisors see QWL as a valuable aid to doing their jobs even better. 12 3 567
17. It's important to me that QWL tries to return a sense of pride to the worker's job by seeing him/her as a craftsperson. 1 2 3 ** 5 6 7
18. QWL meetings are long, poorly led B.S. sessions. 1 2 3 '+ 5 6 7
19. QWL's delegation of more authority downwards provides managers and supervisors the opportunity to develop new, more constructive roles. 12 3 567
20. Sure, QWL takes time, but it should be seen as an important part of the way people do their jobs. 12 3 567
21. QWL is a worthwhile program that should be pursued all the way. 12 3 567
22. QWL aids the organization in providing more enriching employment. 12 3 567
23. In our rapidly changing world, we need some program like QWL to teach us about social values and how to face the future. 12 3 567
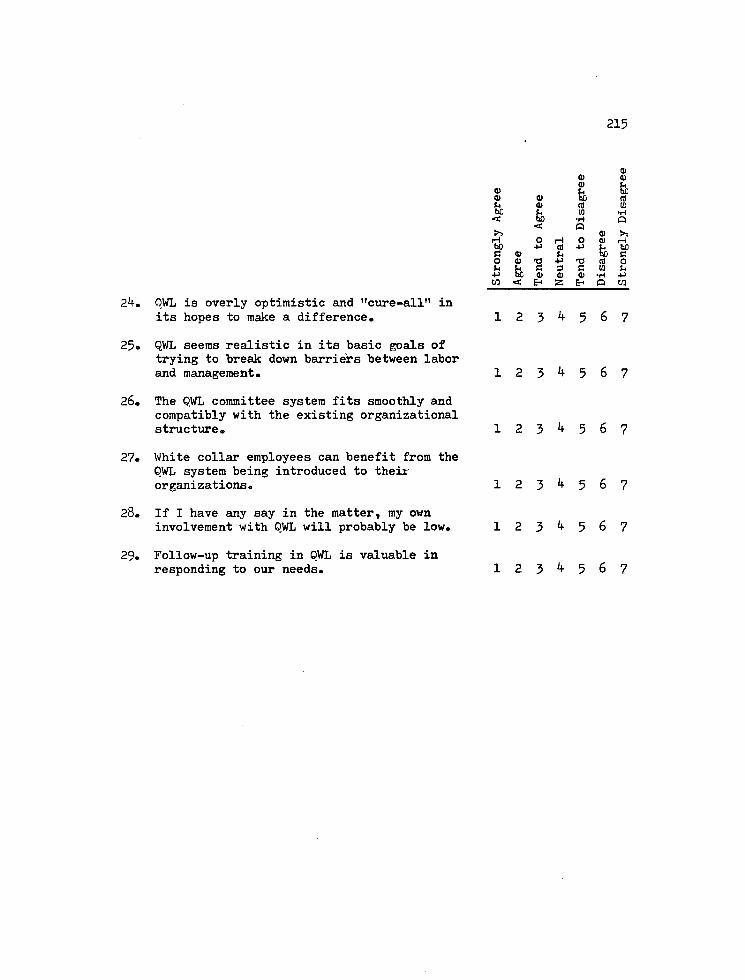
215
0) a> a> 0> 0) Q)
<D fe u a> CO (0 he
& <
(0 •H < &
< •H o
Q a>
H o H o 0) rH to Q> •p cfl
U •p
fc to C o 0) 'O •P TJ CO 0 u e 3 c CO b
+> <D 0) 0) •H .p CO < 2: E-* w
24. OWL is overly optimistic and "cure-all" in its hopes to make a difference. 1 2 3 4 5 6 7
25. QWL seems realistic in its basic goals of trying to break down barriers between labor and management. 12 3 4 5 6 7
26. The QWL committee system fits smoothly and compatibly with the existing organizational structure. 12 3 4 5 6 7
27. White collar employees can benefit from the QWL system being introduced to their organizations. 1 2 3 4 5 6 7
28. If I have any say in the matter, my own involvement with QWL will probably be low. 12 3 4 5 6 7
29. Follow-up training in QWL is valuable in responding to our needs. 12 3 4 5 6 7
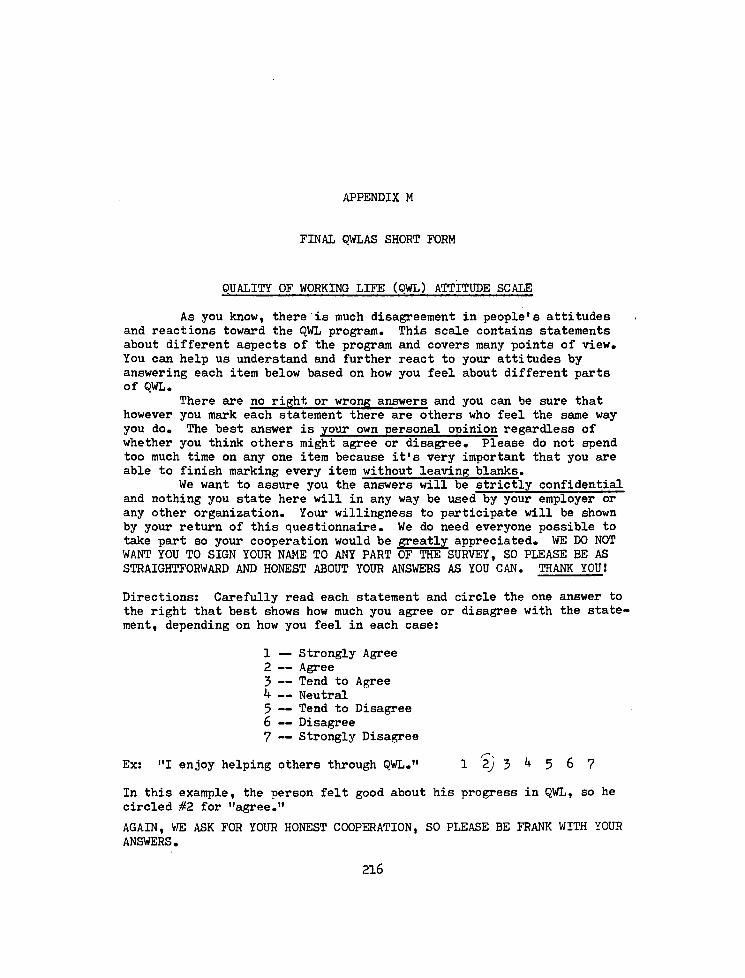
APPENDIX M
FINAL QWL AS SHORT FORM
QUALITY OF WORKING LIFE (OWL) ATTITUDE SCALE
As you know, there is much disagreement in people's attitudes and reactions toward the OWL program. This scale contains statements about different aspects of the program and covers many points of view. You can help us understand and further react to your attitudes by answering each item below based on how you feel about different parts of QWL.
There are no right or wrong answers and you can be sure that however you mark each statement there are others who feel the same way you do. The best answer is your own personal opinion regardless of whether you think others might agree or disagree. Please do not spend too much time on any one item because it's very important that you are able to finish marking every item without leaving blanks.
We want to assure you the answers will be strictly confidential and nothing you state here will in any way be used by your employer or any other organization. Your willingness to participate will be shown by your return of this questionnaire. We do need everyone possible to take part so your cooperation would be greatly appreciated. WE DO NOT WANT YOU TO SIGN YOUR NAME TO ANY PART OF THE SURVEY, SO PLEASE BE AS STRAIGHTFORWARD AND HONEST ABOUT YOUR ANSWERS AS YOU CAN. THANK YOU!
Directions: Carefully read each statement and circle the one answer to the right that best shows how much you agree or disagree with the statement, depending on how you feel in each case:
1 — Strongly Agree 2 — Agree 3 — Tend to Agree 1+ — Neutral 5 — Tend to Disagree 6 — Disagree 7 — Strongly Disagree
Ex: "I enjoy helping others through QWL." 1 2j 3 5 6 7
In this example, the person felt good about his progress in QWL, so he circled #2 for "agree."
AGAIN, WE ASK FOR YOUR HONEST COOPERATION, SO PLEASE BE FRANK WITH YOUR ANSWERS.
216
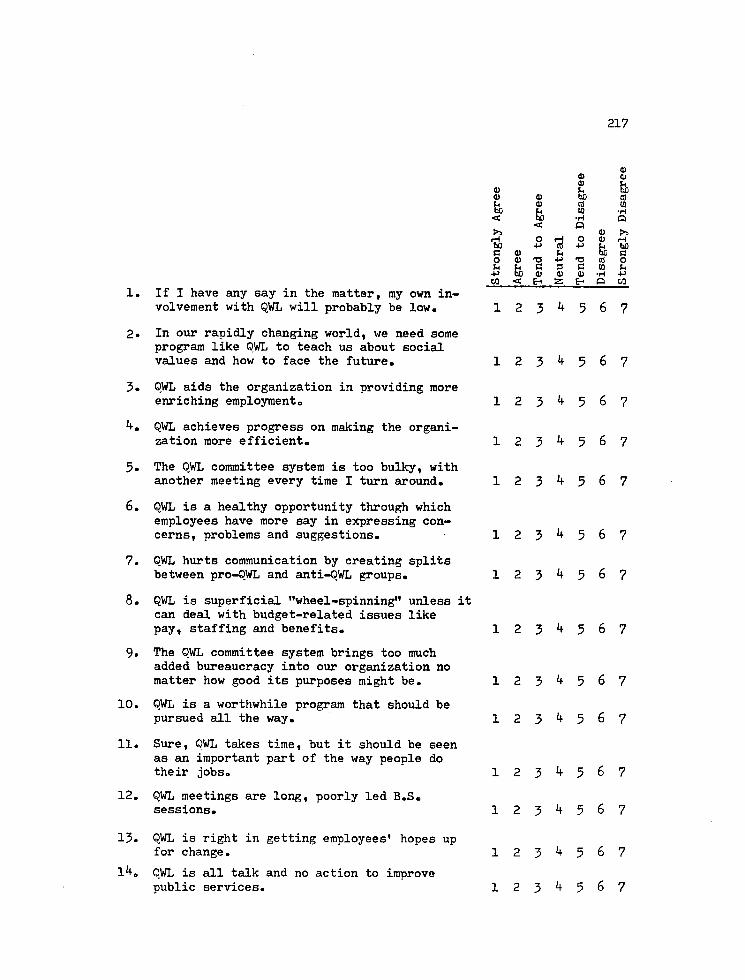
217
1. If I have any say in the matter, my own involvement with QWL will probably be low.
2. In our rapidly changing world, we need some program like OWL to teach us about social values and how to face the future.
3. OWL aids the organization in providing more enriching employment0
QWL achieves progress on making the organization more efficient.
5. The OWL committee system is too bulky, with another meeting every time I turn around.
6. OWL is a healthy opportunity through which employees have more say in expressing concerns, problems and suggestions.
7- QWL hurts communication by creating splits between pro-QWL and anti-QWL groups.
8. QWL is superficial "wheel-spinning" unless it can deal with budget-related issues like pay, staffing and benefits.
9. The OWL committee system brings too much added bureaucracy into our organization no matter how good its purposes might be.
10. OWL is a worthwhile program that should be pursued all the way.
11. Sure, OWL takes time, but it should be seen as an important part of the way people do their jobs.
12. OWL meetings are long, poorly led B.S. sessions.
13. QWL is right in getting employees' hopes up for change.
l'+o OWL is all talk and no action to improve public services.
O 0) O
0) 03 U fe
0 0) hO 03 u 0) CO to bC
<c (0 •rt
< <c •rt Q
Q
>> 0 >> 0 r—! O o> rrt
b0 •p (0 -P u hO C 0) u bC C O 0 T3 -p 13 (0 O U C 3 C (0 U bo 0) O <D •rt -P to < 2 E- O CO
1 2 3 k 5 6 7
1 2 3 ^ 5 6 7
1 2 3 ^ 5 6 7
1 2 3 ^ 5 6 7
1 2 3 ^ 5 6 7
1 2 3 ^ 5 6 7
1 2 3 ^ 5 6 7
1 2 3 ^ 5 6 7
1 2 3 ^ 5 6 7
1 2 3 ^ 5 6 7
1 2 3 ^ 5 6 7
1 2 3 ^ 5 6 7
1 2 3 ^ 5 6 7
1 2 3 ^ 5 6 7
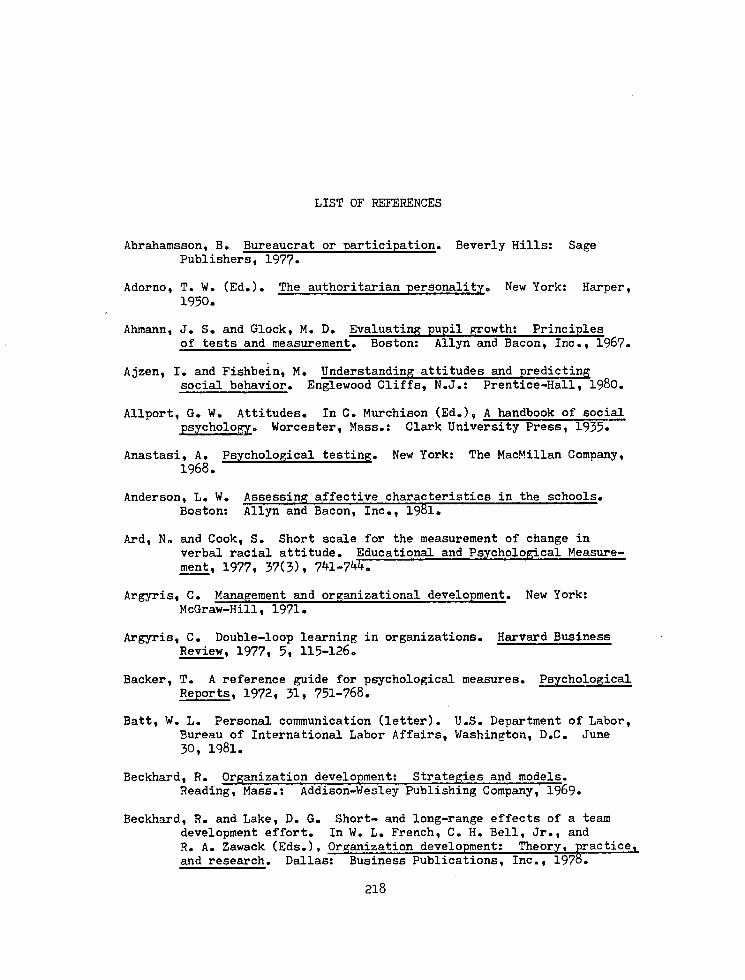
LIST OF REFERENCES
Abrahamsson, B. Bureaucrat or participation. Beverly Hills: Sage Publishers, 1977•
Adorno, T. W. (Ed.). The authoritarian personality. New York: Harper, 1950.
Ahmann, J. S. and Glock, M. D. Evaluating pupil growth: Principles of tests and measurement. Boston: Allyn and Bacon, Inc., 1967.
Ajzen, I. and Fishbein, M. Understanding attitudes and predicting social behavior. Englewood Cliffs, N.J.: Prentice-Hall, 1980.
Allport, G. W. Attitudes. In C. Murchison (Ed.), A handbook of social psychology. Worcester, Mass.: Clark University Press, 1935»
Anastasi, A. Psychological testing. New York: The MacMillan Company, 1968.
Anderson, L. W. Assessing affective characteristics in the schools. Boston: Allyn and Bacon, Inc., 1981.
Ard, N. and Cook, S. Short scale for the measurement of change in verbal racial attitude. Educational and Psychological Measurement, 1977, 37(3), 7 1-7 !
Argyris, C. Management and organizational development. New York: McGraw-Hill, 1971•
Argyris, C. Double-loop learning in organizations. Harvard Business Review, 1977, 5, 115-126.
Backer, T. A reference guide for psychological measures. Psychological Reports, 1972, 31, 751-768.
Batt, W. L. Personal communication (letter). U.S. Department of Labor, Bureau of International Labor Affairs, Washington, D.C. June 30, 1981.
Beckhard, R. Organization development: Strategies and models. Reading, Mass.: Addison-Wesley Publishing Company, 1969.
Beckhard, R. and Lake, D. G. Short- and long-range effects of a team development effort. In W. L. French, C. H. Bell, Jr., and R. A. Zawack (Eds.), Organization development: Theory, practice, and research. Dallas! Business Publications, Inc., 1978.
218
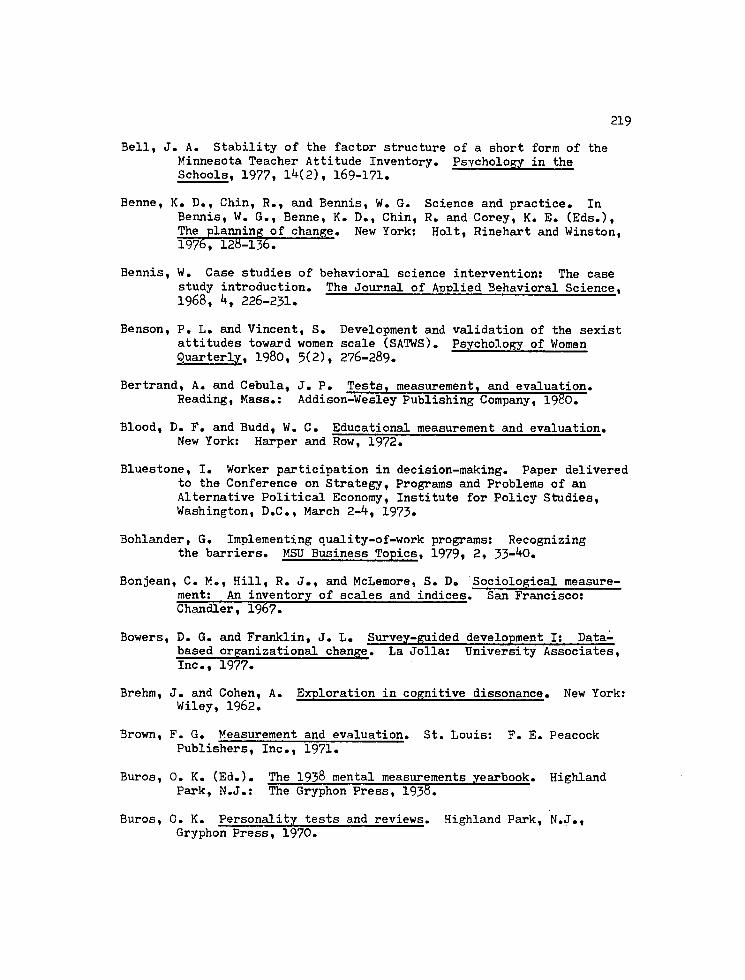
219
Bell, J. A. Stability of the factor structure of a short form of the Minnesota Teacher Attitude Inventory. Psychology in the Schools, 1977, 1M2), 169-171.
Benne, K. D., Chin, R., and Bennis, W. G. Science and practice. In Bennis, W. G., Benne, K. D., Chin, R. and Corey, K. B. (Eds.), The planning of change. New York: Holt, Rinehart and Winston, 1976, 128-136.
Bennis, W. Case studies of behavioral science intervention: The case study introduction. The Journal of Applied Behavioral Science, 1968, k, 226-231.
Benson, P. L. and Vincent, S. Development and validation of the sexist attitudes toward women scale (SATWS). Psychology of Women Quarterly. 1980, 5(2), 276-289.
Bertrand, A. and Cebula, J. P. Tests, measurement, and evaluation. Reading, Mass.: Addison-Wesley Publishing Company, 1980.
Blood, D. F. and Budd, W. C. Educational measurement and evaluation. New York: Harper and Row, 1972.
Bluestone, I. Worker participation in decision-making. Paper delivered to the Conference on Strategy, Programs and Problems of an Alternative Political Economy, Institute for Policy Studies, Washington, D.C., March 2-4, 1973.
Bohlander, G. Implementing auality-of-work programs: Recognizing the barriers. MSU Business Topics, 1979$ 2, 33- 0.
Bonjean, C. M., Hill, R. J., and McLemore, S. D. Sociological measurement: An inventory of scales and indices. San Francisco: Chandler, 1967.
Bowers, D. G. and Franklin, J. L. Survey-guided development I: Data-based organizational change. La Jolla: University Associates, Inc., 1977.
Brehm, J. and Cohen, A. Exploration in cognitive dissonance. New York: Wiley, 1962.
Brown, F. G. Measurement and evaluation. St. Louis: F. E. Peacock Publishers, Inc., 1971.
Buros, 0. K. (Ed.). The 1938 mental measurements yearbook. Highland Park, N.J.: The Gryphon Press, 1938. "
Buros, 0. K. Personality tests and reviews. Highland Park, N.J., Gryphon Press, 1970.
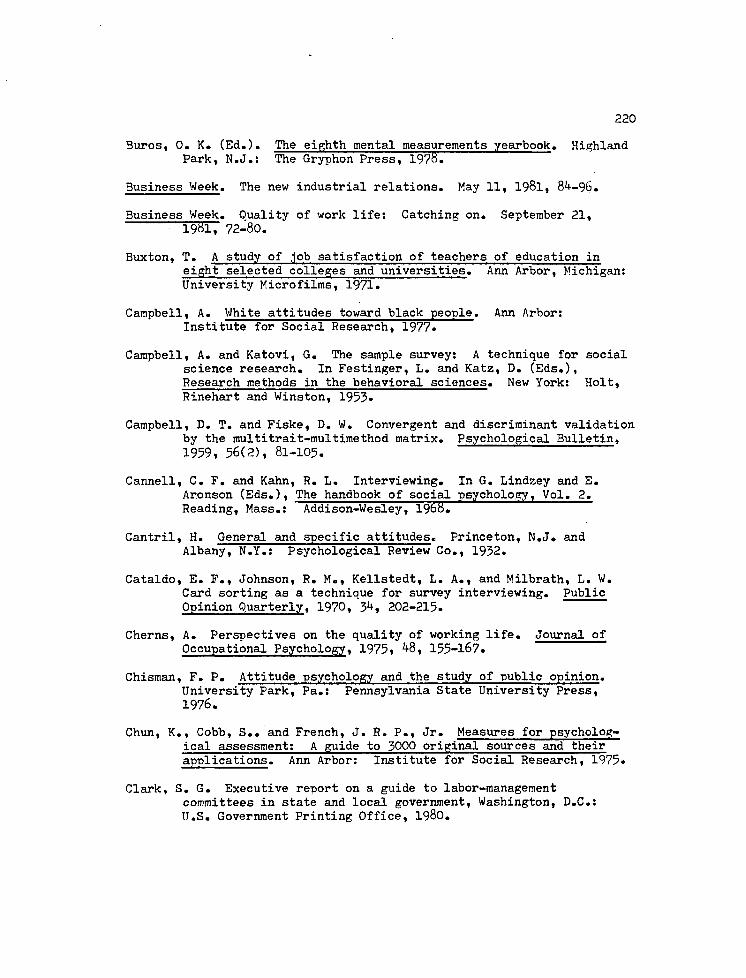
220
Buros, 0. K. (Ed.). The eighth mental measurements yearbook. Highland Park, N.J.: The Gryphon Press, 1978.
Business Week. The new industrial relations. May 11, 1981, 84-96.
Business Week. Quality of work life: Catching on. September 21, 1981, 72-80.
Buxton, T. A study of .job satisfaction of teachers of education in eight selected colleges and universities. Ann Arbor, Michigan: University Microfilms, 1971.
Campbell, A. White attitudes toward black people. Ann Arbor: Institute for Social Research, 1977*
Campbell, A. and Katovi, G. The sample survey: A technique for social science research. In Festinger, L. and Katz, D. (Eds.), Research methods in the behavioral sciences. New York: Holt, Rinehart and Winston, 1953»
Campbell, D. T. and Fiske, D. W. Convergent and discriminant validation by the multitrait-multimethod matrix. Psychological Bulletin, 1959, 56(2), 81-105.
Cannell, C. F. and Kahn, R. L. Interviewing. In G. Lindzey and E. Aronson (Eds.), The handbook of social psychology, Vol. 2. Reading, Mass.: Addison-Wesley, 1968.
Cantril, H. General and specific attitudes. Princeton, N.J. and Albany, N.Y.: Psychological Review Co., 1932.
Cataldo, E. F., Johnson, R. M., Kellstedt, L. A., and Milbrath, L. W. Card sorting as a technique for survey interviewing. Public Opinion Quarterly, 1970, Jk, 202-215.
Cherns, A. Perspectives on the quality of working life. Journal of Occupational Psychology, 1975« 8, 155-167#
Chisman, F. P. Attitude psychology and the study of public opinion. University Park, Pa.: Pennsylvania State University Press, 1976.
Chun, K., Cobb, S.. and French, J. R. P., Jr. Measures for psychological assessment: A guide to 3000 original sources and their applications. Ann Arbor: Institute for Social Research, 1975»
Clark, S. G. Executive report on a guide to labor-management committees in state and local government, Washington, D.C.: U.S. Government Printing Office, 1980.
Comrey, A. L., Backer, T. E., and Glaser, E. M. A sourcebook for mental health measures. Springfield, Va.: National Technical Information Service, 1973*
Cook, S. W. and Sellitz, C. A multiple indicator approach to attitude measurement. Psychological Bulletin, 1964, 62, 36-55.
Cooper, C. L. Humanizing the work-place in Europe: An overview of six countries. Personnel Journal, 1980, 6, 488-491.
Cooper, M. R., Morgan, B. S., Foley, P. M., Kaplan, L. B. Changing employee values: Deepening discontent? Harvard Business Review, 1979, 57, 117-125.
Crawford, I. Sharing profits and productivity. Work and People, 1975, 1(1).
Crespi, I. Attitude research. Chicago: American Marketing Associa-tion, 1965.
Cronbach, L. J. Coefficient alpha and the internal structure of tests. Psychometrika, 1951, 16(3), 297-334.
Cronbach, L. Essentials of psychological testing. New York: Harper and Row, 1970.
Cronbach, L. J. and Meehl, P. Construct validity of psychological tests. Psychological Bulletin, 1955» 52, 281-302.
Crowne, D. P. and Marlowe, D. A. A new scale of social desirability independent of psychopathology. Journal of Consulting Psychology, I960, 24, 349-354.
Cummings, T. G. and Malloy, E. S. Improving the productivity and quality of work life. New York: Praeger, 1977.
Cummings, T. G., Malloy, E. S., and Glen, R. A methodological critique of fifty-eight selected work experiments. Human Relations, 1977, 30, 675-708.
Darom, E., Sharan, S. and Hertz-Lazarowitz, R. The development and validation of a multidimensional scale for assessment of teachers' attitudes toward small-group teaching. Educational and Psychological Measurement, 1978, 38(4), 1233-1238.
Davis, J. C. and Forey, J. P. Mental examiners' source book. Springfield, Illinois: Charles C. Thomas, 1975.
Davis, L. E., Cherns, A. B., and Associates (Eds.). The quality of working life: Problems, prospects, and the state of the art. Vol. 1. New York: Free Press, 1975a.
Davis, L. E., Cherns, A. B., and Associates (Eds.). The quality of working life; Cases and commentary. Vol. 2. New York: Free Press, 1975b.
Dawes, R. M. Fundamentals of attitude measurement. New York: John Wiley & Sons, 1972.
Dewar, D. Quality circle member manual. Red Bluff, California: Quality Circle Institute, 1980.
Dickson, J. W. Graduate seminar in College of Business and Public Administration. University of Arizona, January, 1981.
Doob, W. L. Propaganda; Its psychology and technology. New York: Holt, and Reinhart, 1935®
Dubois, P. H. A history of psychological testing. Boston: Allyn and Bacon, 1970.
Ebel, R. L. Writing the test item. In Lindquist, E. F. (Ed.), Educational measurement. Washington, D.C.: American Council on Education, 1951.
Ebel, R. T. Essentials of educational measurement. Englewood Cliffs: Prentice-Hall, 1972.
Economic Development Administration. American Center for the Quality of Working Life. Office of Technical Assistance, Department of Commerce, Washington, D.C., no date.
Edwards, A. L. Techniques of attitude scale construction. New York: Appleton-Century-Crofts, Inc., 1957.
Edwards, A. L. and Kenney, K. C. A comparison of the Thurstone and Likert techniques of attitude scale construction. Journal of Applied Psychology, 19 , 30, 72-83.
Emery, F. E. and Trist, E. L. Towards a social ecology. New York: Plenum Press, 1973-
Engelhart, M. D. A comparison of several item discrimination indices. In Mehrens, W. A. and Ebel, R. L. (Eds.), Principles of educational and psychological measurement. Chicago: Rand McNally and Co., 1967, 3»7-393.
Ferguson, L. W, A study of the Likert technique of attitude construction. The Journal of Social Psychology, 19 1, 13i 51-57.
Festinger, L. A theory of cognitive dissonance. Stanford: Stanford University Press, 1957.
223
Finch, F. E. Collaborative leadership in work settings. The Journal of Applied Behavioral Science, 1977, 13(3)» 292-302.
Fishbein, M. (Ed.). Readings in attitude theory and measurement. New York: John Wiley and Sons, 1967.
Fishbein, M. Belief, attitude, intention and behavior: An introduction to theory and research. Reading, Mass.: Addison Wesley Publishing Co., 1975.
Fordyce, J. K. and Weil, R. Methods for finding out what is going on. In French, W. L., Bell, C. H., Jr., and Zawacki, R. A. (Eds.), Organizational development: Theory, practice and research. Dallas:Business Publications, Inc., 1978.
Franklin, J. L., Wissler, A. L. and Spencer, G. J. Survey-guided development III: A manual for concepts training. La Jolla: University Associates, Inc., 1977 •
Frazier, L. P. An evaluation of the Marital Satisfaction Inventory. Doctoral dissertation, Texas A & M University, 1976.
Freeman, F. S. Theory and practice of psychological testing. New York: Harper, Row and V/inston, 1966.
French, V/. L. and Bell, C. H., Jr. Organization development: Behavioral science interventions for organization improvement. Princeton, N.J.: Prentice-Hall, Inc., 1973-
French, W. L., Bell, C. H., Jr., and Zawacki, R. A. (Eds.). Organization development: Theory, practice and research. Dallas: Business Publications, Inc., 1978.
Fromm, E. and MacCoby, M. Social character in a Mexican village. Englewood Cliffs: Prentice-Hall, 1970.
Frost, C. F., Wakely, J. H., and Ruh, R. A. The Scanlon Plan for Organization development: Identity, participation and equity. Lansing: Michigan State University Press, 197 .
Fuller, S. H. How to become the organization of the future. Management Review, 1980, 69, 50-53.
General Motors. QWL update. Organizational Research and Development Department Newsletter, 1982.
Gershenfeld, J. Personal communication. Quality of Work Life Council, February 10, 1982.
Ghiselli, E. E. Theory of psychological measurement. New York: McGraw-Hill, 1964.

22k
Glaser, E. M. Productivity gains through worklife improvements. Personnel, 1980, 57, 71-77.
Glueck, W. E. Personnel: A diagnostic approach. Dallas: Business Publications, 1978.
Goldberg, A. L. The effects of two types of sound motion pictures on attitudes of adults toward minority groups. San Francisco: R and E Research Associates, 1955»
Goldman, B. A. and Busch, J. C. Directory of unpublished experimental mental measures. New York: Human Sciences Press, 1978.
Grabow, S. and Heskin, A. Foundations for a radical concept of planning. In Bennis, W., Benne, K. D., Chin, R. and Corey, K. E. (Eds.), The planning of change. New York: Holt, Rinehart and Winston, Inc., 1976.
Green, B. F. A primer of testing. American Psychologist, 1981, 36 (10), 1001-1011.
Greenberg, E. S. The consequences of worker participation: A classification of the theoretical literature. Social Science Quarterly, 1975, 56(2), 191-209.
Greenwald, A. C., Brock, T. C. and Ostrom, T. M. Psychological Foundations of Attitudes. New York: Academic Press, 1968.
Greiner, L. E. and Barnes, L. B. Organization change and development. In Dalton, G. W., Lawrence, P. R. and Greiner, L. E. (Eds.), Organizational change and development. Homewood, Illinois: Richard D. Irwin, Inc., 1970.
Guilford, J. P. Psychometric methods. New York: McGraw-Hill, 195 «
Guttman, L. A basis for scaling qualitative data. American Sociological Review, 19 , 9» 139-150.
Guttman, L. Questions and answers about scale analysis. Research Branch, Information and Education Division, Army Sercice Forces. Report D-2, 19 5.
Habbe, S. Following up attitude survey findings. In National Industrial Conference Board, Studies in Personnel Policy, 1961, l8l.
Hall, 0. M. Attitudes and unemployment. - Archives of Psychology, 193 t 165.
Halloran, J. D. Attitude formation and change. Westport, Conn.: Greenwood Press, 1976.
225
Hampton, D. R., Sumner, C. E. and Webber, R. A. Organizational Behavior and Practice of Management. Glenville, Illinois: Scott, Foresman and Company, 1978.
Hanson, R. W. General beliefs scales; Toward the assessment of the Weltanschauung. Thesis for University of Arizona, 1970.
Hartke, A. R. The development of conceptually independent subscales in the measurement of attitudes. Educational and Psychological Measurement, 1979, 39(3), 585-592.
Haussler, D. L., Pecorella, P. A., and Wissler, A. L. Survey-guided development II; A manual for consultants. La Jolla: University Associates, Inc., 1977 •
Healing, T. S. Attitudes of high school and college students toward old people. Doctoral dissertation, University of Arizona, 1971.
Heider, F. Attitudes and cognitive organization. Journal of Psychology, 19 6, 21, 107-112.
Helfant, K. Parents' attitudes vs. adolescent hostility in the determination of adolescents' sociopolitical attitudes. Psychological Monographs, 1952, 66(13), Whole No. 3 5.
Henerson, M. E., Morris, L. L., Taylor Fitz-Gibbon, C. How to measure attitudes. Beverly Hills: Sage Publishers, 197HT
Hennessy, B. C. Public opinion. Belmont, Ca.: Wadsworth Publishing Co., Inc., 1970.
Hepburn, M. A. and Napier, J. D. Development and initial validation of an instrument to measure political attitudes. Educational and Psychological Measurement, 1980, 0, 1131-113 1
Herbst, P. G. Autonomous group functioning. London: Tavistock, 1962.
Herbst, P. G. Socio-technical design; Strategies in multidiscrolinary research London: Tavistock, 197'+.
Herrick, N. Q. Organizational policies. Unpublished manuscript, 1972.
Herrick, N. 0. The quality of work and its outcomes. Columbus, Ohio: The Academy for Contemporary Problems, 1975.
Herrick, N. 0. Six interviews on the Quality of Working Life. Washington, D.C.: National Center for Productivity and Quality of Working Life, 1977.
Herrick, N. Q. Address to the Division of the Office of the Director, Department of Transportation Quality of Working Life Orientation, November 2*+, 1980a.
226
Herrick, N. Q. Pima County Department of Transportation and Flood Control District OWL Orientation Manual, 1980b.
Herrick, N. 0. Work in America: A comparison of industrial and municipal worker attitudes. Employee Relations, 1980c, 2, 6-10.
Herrick, N. 0. The means and end of work. Human Relations, 198la, J>k (7), 611-632.
Herrick, N. 0. How dissatisfied is the American Worker? Society, 1981b, 18(2), 26-33.
Herrick, N. Q. Address to the Pima County Labor Management Quality of Working Life Committee, December 16, 198lc.
Herrick, N. Q. Cooperative self-interest: Learning from Joe Scanlon. Public Productivity Quarterly, 1982a, 6.
Herrick, N. Q. (Ed.). Quality of working life in the public sector. Unpublished manuscript, University of Arizona, 1982b.
Herrick, N. Q. Graduate seminar, University of Arizona, January 22, 1982c.
Herrick, N. Q. Graduate seminar at The University of Arizona, February 20, 1982d.
Herrick, N. Q. and Maccoby, M. Humanizing work: A priority goal of the 1970s. In L. E. Davis and A. B. Cherns (Eds.), The quality of working life, Vol. 1. New York: Free Press, 1975.
Herrick, N. Q. and Ronchi, D. Springfield Ohio: Four years of labor-management cooperation to improve the quality of working life. Unpublished manuscript, University of Arizona, 1982.
Hlawek, J. Pima County Labor Management Quality of Working Life Committee Directory. Tucson: Pima County Government, 1982.
Hoffman, T. Measurement scale analysis: Pima County QWL project. Unpublished paper, 1981.
Hollander, E. P. and Hunt, R. G. Intergroup relations. In Hollander, E. P. and Hunt, R. G. (Eds.), Current perspectives in social psychology. New York: Oxford University Press, 1967.
Horowitz, E. L. The development of attitude toward the Negro. New York: Archives of Psychology, 1936.
Huckleberry, C. H. The Quality of working life experience at the Department of Transportation and Flood Control District, May, 1981.
227
Huse, E. F. Organization development and change. St. Paul: West Publishing Company, 1980.
Insko, C. A. (Ed.). Theories of attitude change. New York: Appleton-Century-Crofts, 1967.
Institute for Social Research. The Quality of Work Program: First eighteen months, a report. Ann Arbor: University of Michigan, April' 197 -October 1975.
International Association of Quality Circles. The Quality Circles Journal, 1981, *+(4).
Isakson, R. L. and Ellsworth, R. The measurement of teacher attitudes toward educational research. Educational Research Quarterly, 1979, 4(2), 12-18.
Iwanicki, E. F. and Schwab, R. L. A cross validation study of the Maslach Burnout Inventory. Educational and Psychological Measurement, 1981, 41, 1167-117%l
Jackson, D. M. and Bidwell, C. E. A modification of the Q-technique. Educational and Psychological Measurement, 1959, 9(12), 221-232.
Jahoda, M. and Warren, N. (Eds.). Attitudes: Selected readings. Baltimore: Penguin Books, 1966.
Jain, H. C. Worker participation: Lessons from the European experience. Management Review, 1980, 69, '+6-52.
Kahn, L. The organization of attitudes toward the Negro as a function of education. Psychological Monographs, 19511 65(13), Whole No. 330.
Kahn, R. L., Wolfe, D. M. and Quinn, R. P. Organization stress: Studies in role conflict and ambiguity. New York: Wiley, 1964.
Katzel, R. A. and Yankelovich, D. Work, productivity, and job satisfaction. New York: The Psychological Corporation, 1975«
Keidel, R. W. Quality of working life in the private sector: An overview and a developmental perspective. Washington, D.C.: U.S. Government Printing Office, 1980.
Keisler, C. A., Collins, B. E. and Miller, N. Attitude change: A critical analysis of theoretical approaches. New York: Wiley,
Kerlinger, F. N. Foundations of behavioral research. New York: Holt, Rinehart and Winston, Inc., 1973.
228
Kidder, L. H. and Campbell, D. T. The indirect testing of social attitudes. In Summers, G. (Ed.), Attitude measurement. Chicago: Rand McNally, 1970.
Kim, J. Factor analysis. In Nie, N. H. and Hull, C. H. (Eds.), Statistical package for the social sciences. New York: McGraw-Hill, 1975.
Kimberly, J. R. and Nielsen, W. R. Organization development and change in organizational performance. In W. L. French, C. H. Bell, Jr., and R. A. Zawacki (Eds.), Organization development: Theory, practice, and research. Dallas: Business Publications, Inc.,
Klein, A. Redundancy in the comprehensive tests of basic skills. Educational and Psychological Measurement, 1981, *t-0, 1105-1110.
Kochan, T. A. and Dyer, L. A model of organizational change in the context of union-management relations. The Journal of Applied Behavioral Science, 1976, 12(1), 59-78.
Kochan, T. A., Lipsky, D. B. and Dyer, L. D. Collective bargaining and the quality of work: The views of local union activists. Proceedings of the 27th Annual Winter Meeting of the Industrial Relations Research Association! Madison: IRRA, 1975, 150-162.
Kuper, G. H. Developments in the duality of working life. Labor Law Journal, 1977, 28(12), 752-762.
Landen, D. L. Quality of work life, quality of human life. Or is it vice versa? Detroit: General Motors, 1981.
Lawler, E. E. Should the quality work life be legislated? In Glueck, W. (Ed.), Personnel: A Book of Readings. Dallas: Business Publications, Inc., 1979.
Lawler, E. E>, III, Nadler, D. A., and Mirvis, P. H. Organizational change and the conduct of assessment research. Unpublished manuscript, 1978.
Lazarsfeld, P. F. and Barton, A. H. Qualitative measurement in the social sciences. In D. Lerner and H. D. Lasswell (Eds.), The policy sciences: Recent developments in scone and method. Stanford: Stanford University Press, 1951.
Lazarsfeld, P. and Rosenberg, M. (Eds.). The language of social research. Glencoe, Illinois: The Free Press, 1955*
Leeds, C. H. A scale for measuring teacher-pupil attitudes and teacher-pupil rapport. Psychological Monographs, 1950, 6M6), Whole No. 312.

229
Leedy, P. D. Practical research: Planning and design. New York: MacMillan Publishing Company, Inc., 197^.
Lemon, N. Attitudes and their measurement. New York: John Wiley and Sons, 1973.
Leonard, J. W. and Thanopoulos, J. Japanese management: Reasons for success. Unpublished paper, University of Arkansas at Fayetteville, July, 1981.
Lewin, K. Field theory in social science. New York: Harper and Row, 1951.
Likert, R. A. A technique for the measurement of attitudes. Archives of Psychology, 1932, 140.
Lindquist, E. F. Educational measurement. Washington, D.C.: American Council on Education, 1951.
Lippitt, G. and Rumley, J. Living with work—the search for quality in work life. Optimum, 1977« 8, 38.
Luiten, J. Personal communication. Doctoral student in Educational Psychology, University of Arizona, April, 1982.
Lujan, M. and Brandon, R. W. A "reader's digest" version of AWL. Tucson: Pima County Government, 1981.
Lukes, S. H. Power: A radical view. London: MacMillan, 197^.
Maccoby, M. Foreword. In N. Q. Herrick, The quality of work and its outcomes. Columbus, Ohio: The Academy for Contemporary Problems, 1975.
Maccoby, M. and Terzi, K. A. What happened to the work ethic? Technology, work, and the changing American character. Unpublished paper, 1979.
Macy, B. A. and Mirvis, P. H. A methodology for assessment of quality of work life and organizational effectiveness in behavioral-economic terms. Administrative Sciences Quarterly, 1976, 21, 212-226.
Mannweiler, R. A. and Talbott, V. G. Joint workshops to facilitate labor-management cooperation. Urbana, Illinois: Institute of Labor and Industrial Relations, 1977.
Maranell, G. M. (Ed.). Scaling: A sourcebook for behavioral scientists. Chicago: Aldine Publishing Company, 197^.
230
Margolis, B. L., Kroes, W. H. and Quinn, R. P. Job stress: An unlisted hazard. The Journal of Occupational Medicine, 197 , 10, 659-661.
Martens, F. L. A scale for measuring attitude toward physical education in the elementary school. Journal of Experimental Education. 1979, 47(3), 239-247.
Matell, M. S. and Jacoby, J. Is there an optimal number of alternatives for Likert scale items? Study I: Reliability and validity. Educational and Psychological Measurement, 1971, 31(3), 657-674.
Maye, W. T. Presidential labor-management committees: Productive failures. Industrial and Labor Relations, 1980, 34, 51 •
McDaniel, R. R. and Ashmos, D. P. Participatory management: An executive alternative for human service organizations. Human Resource Management, 1980, 1, 14-8.
McGuire, W. Cognitive consistency and attitude change. Journal of Abnormal Social Psychology, i960, 60, 345-353•
Mehrens, W. A. (Ed.). Readings in measurement and evaluation in education and psychology. New York: Harper, Row and Winston, 197T.
Mehrens, W. A. and Ebel, R. L. (Eds.). Principles of educational and psychological measurement. Chicago: Rand McNally and Company, 19671
Michaels, L. A. and Forsyth, R. A. Construction and validation of an instrument measuring certain attitudes toward mathematics. Educational and Psychological Measurement, 1977, 37(4), 1043-
Miles, R. H. Macro organizational behavior. Santa Monica, Cal.: Goodyear Publishing Company, Inc., 1980.
Miller, E. J. and Rice, A. K. Systems of organization. London: Tavistock, 1967.
Millward, Robert E. Attitude development through outdoor education. University Park: The Pennsylvania State University, n.d. (Pennsylvania State HYPER Series, No. 1).
Morgan, L. B. and Wicas, E. A. The short, unhappy life of student dissent. Personnel and Guidance Journal, 1972, 51(1), 33-38.
Mosier, C. I. A critical examination of the concepts of tape validity. In Mehrens, W. A. and Ebel, R. L. (Eds.), Principles of educational and psychological measurement. Chicago: Rand McNally and Co., 1967, 207-218.
231
Murphy, G. and Likert, R. Public opinion and the individual. New York: Harper, 1937.
Murphy, G. and Likert, R. Public opinion and the individual; A psychological study of student attitudes on public questions. New York: Russell and Russell, 1967.
Murphy, R. F. An attitude scale for dental health. The Journal of School Health, 1970, *+0(5), 268-270.
Napior, D. Nonmetric multidimensional techniques for summated ratings. In Shepard, R. N., Romney, A. K. and Nerlove, S. B. (Eds.), Multidimensional scaling; Theory and applications in the behavioral sciences. New York; Seminar Press, 1972.
National Center for Productivity and Quality of Working Life.
A summary of the role of third parties in labor-management cooperative endeavors. Washington, D.C.; U.S. Government Printing Office, 1978.
Nelson, E. Radicalism-conservatism in student attitudes. Columbus, Ohio":Psychology Review Company, 1938.
Newcomb, T. M. Personality and social change. New York: Dryden, 19 3.
Newcomb, T. M. An approach to the study of communicative acts. Psychology Review, 1953, 60, 393- 04.
Nie, N. H. and Hull, C. H. (Eds.). Statistical Package for the Social Sciences. New York: McGraw-Hill, 1975-
Nonnally, J. C. Introduction to psychological and educational measurement and evaluation. New York; McGraw-Hill, 1972.
Nunnally, J. C. Psychometric theory. New York: McGraw-Hill, 1978.
Nuttin, J. M., Jr. The illusion of attitude change: Towards a response contagion theory of persuasion. New York: Academic Press, 197 . '
Oppenheim, A. N. Questionnaire design and attitude measurement. New York: Basic Books, 1966.
Oppenheimer, R. Prospects in the arts and sciences. Perspectives USA, 1955, 2, 10-11.
Osgood, C. E., Suci, G. J. and Tannenbaum, P. H. The measurement of meaning. Urbana, Illinois: University of Illinois Press, 1957.
Osgood, C. and Tannenbaum, P. The principle of congruity in the prediction of attitude change. Psychology Review, 1955, 62, 2-55.
232
Owens, L. and Straton, R. G. The development of a co-operative, competitive and individualized learning preference scale for students. British Journal of Educational Psychology, 1980, 50(2), 1V7-T5T;
Patchin, R. I. Is respect the key? The Quality Circles Journal, 1981, 9.
Payne, D. A. The assessment of learning;: Cognitive and affective. Lexington, Mass.: D. C. Heath and Company, 197*+•
Payne, S. L. The art of asking questions. Princeton, N.J.: Princeton University Press, 1951®
Perney, J. The development and validation of the student opinion inventory factor scales. Educational and Psychological Measurement, 1975, 35(*0, 9«3-986.
Peter, H. W. Redesigning human work: A new challenge. Work and People, 1975, 1(1), 3-9.
Pfeiffer, W. J., Heslin, R. and Jones, J. E. Instrumentation in human relations training: A guide to 92 instruments with wide applicability to the behavioral sciences. La Jolla, Ca.: University Associates, 1976.
Pfitzer, K. Program boosts county workers' morale. Tucson Citizen, Tuesday, July 21, 1981.
Pidgeon, D. and Yates, A. An introduction to educational measurement. New York: Humanities Press, 1968.
Pima County Board of Supervisors and the Employees. Declaration of Agreement by and between the Board of Supervisors and the Employees, 1981.
Pittell, S. M. and Mendelsohn, G. A. Situational appraisal inventory: Development and validation of a measure of evaluative attitudes. Journal of Consulting and Clinical Psychology. 1969, 33(iO» 396-405.
Porras, J. and Berg, P. 0. Evaluation methodology in organizational development: An analysis and critique. Journal of Applied Behavioral Sciences, 1978, 1 (2), 151-173.
Powers, Stephen. Personal communication. Evaluator for Tucson Unified School District, April 1982.
Quinn, R. P., Seashore, S., Mangione, T., Campbell, D, Staines, G. L. and McCullough, M. Survey of working conditions. Washington, D.C.: U.S. Government Printing Office, 1971.
233
Quinn, R. P. and Staines, G. L. Quality of emuloyment survey. Ann Arbor, Michigan: Institute for Social Research, 1977.
Raube, S. A. Experience with employee attitude surveys. In National Industrial Conference Board, Studies in Personnel Policy, 1951, 115.
Reddin, W. Managerial effectiveness. New York: McGraw-Hill, 1970.
Reicken, H. W. Memorandum on program evaluation. In W. L. French, C. H. Bell, Jr., and R. A. Zawacki (Eds.), Organization development: Theory, practice, and research. Dallas: Business Publications, Inc., 1978.
Remmers, H. H. Introduction to opinion and attitude measurement. New York: Harper and Brothers, 1954.
Remmers, H. H. Anti-democratic attitudes in American schools. Evanston, Illinois: Northwestern University Press, 1963.
Rendell, E. Quality circle—a "third wave" intervention. Training and Development Journal, 1981, 35, 28-31.
Reynolds, W. M. and Greco, V. T. The reliability and factorial validity of a scale for measuring teachers' attitudes towards mainstreaming. Educational and Psychological Measurement, 1980, 40(2), 463-468.
Rice, G. H. Structural limits on organizational development. Human Resource Management, 1977, 4, 9-13«
Richards, H. C. and Gamache, R. Belief polarity: A useful construct for studies of prejudice. Educational and Psychological Measurement, 1979, 39(4), 791-801.
Roberts, D. M. and Bilderback, E. W. Reliability and validity of a statistics attitude survey. Educational and Psychological Measurement, 1980, 40(1), 235?2W.
Robinson, J. P., Athanasiou, R. and Head, K. B. Measures of occupational attitudes and occupational characteristics. Ann Arbor: Institute for Social Research, 1969.
Robinson, J. P., Rusk, J. G. and Head, K. B. Measures of political attitudes. Ann Arbor: Institute for Social Research, 196H.
Robinson, J. P. and Shavers, P. R. Measures of social psychological attitudes. Ann Arbor: Institute for Social Research, 1969.
Rogers, Carl. Freedom to learn. Columbus, Ohio: Charles E. Merrill Publishing Company, 1969.
23
Rogers, R. Book review. In Buros, 0. K. (Ed.), The eighth mental measurements yearbook. Highland Park, N.J.: The Gryphon Press, 1978, p. 1889.
Rokeach, M. Political and religious dogmatism: An alternative to the authoritarian personality.Washington:A.P.A., 1956.
Rokeach, M. Beliefs, attitudes, and values: A theory of organizations and change.San Francisco:Josey-Bass, 1968.
Rokeach, M. and Rothman, G. The principle of belief congruence and the congruity principle as models of cognitive interaction. Psychology Review, 1965, 72, 128-172.
Ronchi, D. The quality of working life movement I: History. Unpublished manuscript, 1980.
Rosenberg, M. An analysis of affective-cognitive consistency. In Hovland, C. and Rosenberg, M. (Eds.), Attitude organization and change. New Haven: Yale University Press, I960, 15-6 .
Sabers, Daryll. Personal communication, Professor of Educational Psychology, University of Arizona, March 1981.
Salancik, G. R. and Pfeffer, J. A social information processing approach to job attitudes and task design. Administrative Sciences Quarterly, 1978, 23, 22 -253*
Schein, E. H. Intergroup problems in organizations.. In French, W. L., Bell, C. H., Jr., and Zawacki, R. A. (Eds.), Organization development: Theory, practice and research. Dallas: Business Publications, Inc., 1978.
Schelble, J. M. Construction and validation of a behaviorally specific attitude scale. Doctoral dissertation, University of Arizona, 1977.
Schreischeim, C. A. The effect of grouping or randomizing items on leniency response bias. Educational and Psychological Measurement, 1981, kOl-kll.
Scott, 0. and Rohrbach, J. A comparison of five criteria for identi-bying fakable items on an attitude inventory. Journal of Experimental Education, 1977, 5(3), 51-55.
Scott, W. A. Attitude measurement. In Lindzey, G. and Aronson, E. (Eds.), The handbook of social psychology, Vol. 2. Reading, Mass.: Addison-Wesley Publishing Company, 1968.
235
Seashore, S. Overview and analysis of eight OWL demonstration projects. A proposal to the U.S. Department of Labor, Office of Research and Development. Ann Arbor: Institute for Social Research, University of Michigan, December 1 , 1979.
Seashore, S. E. and Bowers, D. G. Durability of organization change. In W. L. French, C. H. Bell, Jr., and R. A. Zawacki (Eds.), Organization development; Theory, practice, and research. Dallas:Business Publications, Inc., 1978.
Shaw, M. E. and Wright, J. M. Scales for the measurement of attitudes. New York: McGraw-Hill, 1967.
Shaw, P. Participation in the Post Office and the pre-requisites for success. Personnel Management, 1980, 8, 2 -27.
Shepard, R. N., Romney, A. K. and Nerlove, S. B. (Eds.). Multidimensional scaling: Theory and application in the behavior sciences. New York: Seminar Press, 1972.
Sheppard, H. and Herrick, N. 0. Where have all the robots gone? New York: The Free Press, 1972.
Sherif, C. W. and Sherif, M. (Eds.). Attitude, ego-involvement and change. New York: Wiley, 1967*
Snider, J. G. and Osgood, C. E. Semantic differential technique: A source book. Chicago, Illinois: Aldine, 1969.
Spier, M. S. Kurt Lewin's "force field analysis." The 1973 annual handbook for group facilitators. La Jolla: University Associates, 1973» 111-113*
Srivastva, S, Salipante, P., Cummings, T., Notz, W., Bigelow, J., and Waters, J. Job satisfaction and productivity. Cleveland: Case Western Reserve University Press, 1975.
Stauffer, A. J. An investigation of the procedures for developing and validating the classroom attitude measure toward educational inquiry. Educational and Psychological Measurement, 197 i 3Z+(10, 893 %W~.
Stephenson, W. The study of behavior: Q-techniaue and its methodology.
Chicago: University of Chicago Press, 1953.
Stephenson, W. The play theory of mass communications. Chicago: University of Chicago Press, 1967.
Stone, E. F. Research on OD phenomena: Methods, problems, and prospects. In Huse, E. F., Organization development and change. St. Paul: West Publishing Company, 19 0.
236
Suedfeld, P. Attitude change: The competing views. Chicago: Aldine, 1971.
Summers, G. (Ed.). Attitude measurement. Chicago: Rand McNally, 1970.
Susman, G. I. Autonomy at work: A sociotechnical analysis of participative management. New York: Praeger, 1979.
Susman, G. I. A guide to labor-management committees in state and local government. Washington, D.C.: U.S. Government Printing Office, 1980.
Susman, G. I. and Evered, R. D. An assessment of the scientific merits of action research. Administrative Sciences Quarterly, 1978, 23, 582-603.
Symonds, P. M. What is an attitude? Psychological Bulletin, 1927, 2 , 200.
Tannenbaum, R. and Davis, S. A. Values, man, and organization. In W. L. French, C. H. Bell, Jr., and R. A. Zawacki (Eds.), Organization development: Theory, practice, and research. Dallas:Business Publications, Inc., 1978.
Terkel, S. Working. New York: Random House, 1972.
Thomas, K. (Ed.). Attitudes and behavior. London: Penguin Books, 1971.
Thomas, W. I. and Znaniecki, F. The Polish peasant in Europe and America. Boston: Badger, 1918.
Thorndike, R. L. (Ed.). Educational measurement. Washington, D.C.: American Council on Education, 1971•
Thorndike, R. L. and Hagen, E. Measurement and evaluation in psy-chology and education. New York: John Wiley and Sons, Inc., 1955.
Thorsrud, D. E. Sociotechnical approach to job design and organizational development. In French, W. L., Bell, C. H., Jr., and Zawacki, R. A. (Eds.), Organization development: Theory, practice, and research. Dallas: Business Publications, Inc., 197HT
Thurstone, L. L. The measurement of values. Chicago: University of Chicago Press, 195 *
Thurstone, L. L. Comment. American Journal of Sociology, 19 6, 52, 39-50.

237
Thurstone, L. L. and Chave, E. J. The measurement of attitude. Chicago: The University of Chicago Press, 1929.
Toffler, A. Future shock. New York: Random House, 1970.
Torgerson, W. L. Theory and methods of scaling. New York: Wiley and Sons, 1958.
Triandis, H. C. Attitude and attitude change. New York:" Wiley, 1971.
Trist, E. Collaboration in work settings: A personal perspective. The Journal of Applied Behavioral Science, 1977, 13(3)» 268-278.
Trist, E. Adapting to a changing world. The Labour Gazette, 1978, 14-20.
Trist, E. L. and Bamforth, K. W. Some social and psychological conse-auences of the longwall method of coal getting. Human Relations, 1*951. 4, 3-38.
Trumbo, D. A. Individual and group correlates of attitudes toward work-related change. Journal of Applied Psychology, 1961, 45, 338-344.
Tyler, L. Theory and practice of psychological testing. New York: Harper, Row and Winston, 1963.
United States Department of Health, Education, and Welfare. Work in America: A report of a special task force to the Secretary of Health, Education and Welfare. Cambridge, Mass.: M.I.T. Press, 1973.
United States Steel Corporation. Agreement between United States Steel Corporation and the United Steel Workers of America, August 1, 1980. (Available from Neal Herrick, University of Arizona Management Department.)
Viano, E. and Wilderman, J. Organizational size and managerial attitudes of probation administrators. Sociology and Social Research, 1972, 56, 480-493.
Wacker, G. and Nadler, G. Seven myths about quality of working life. California Management Review, 1980, 22(2), 15-23.
Wadia, M. Participative management: Three common problems. Personnel Journal, 1980, 11(6), 927-928.
Walker, K. F. Workers' participation in management for Australia. Work and People, 1980, 5(3)» 3-H«

Walton, R. Advantages and attributes of the case study. Journal of Applied Behavioral Sciences, 1972, 8, 77-78.
Walton, R. E. The Topeka story: Teaching an old dog food new tricks The Wharton Magazine, 1978, 38- 8.
Walton, R. E. and McKensie, R. B. A behavioral theory of labor negotiations. New York: McGraw-Hill, 1965*
Webb, E. J., Campbell, D. T., Schwartz, R. D. and Sechrest, L. Unobtrusive measures. Chicago: Rand McNally, 1966.
Wesman, A. G. Writing the test item. In Thorndike, R. L. (Ed.), Educational measurement. Washington, D.C.: American Council on Education, 1971» 81-129.
White, S. E. and Mitchell, T. R. Organization development: A review of research content and research design. In W. L. French, C. H. Bell, Jr., and R. A. Zawacki (Eds.), Organization development: Theory, practice, and research. Dallas: Business Publications, Inc., 1978.
Wiseman, A. Job redesign—two more examples. Work and People, 1975» 1, 16-19.
Wittenborn, J. R. Contributions and current status of 0. methodology. Psychological Bulletin, 1961, 58(2), 132-142.
Wood, D. A. Test construction: Development and interpretation of achievement tests. Columbus, Ohio: Charles E. Merrill Books Inc., I960.
Yin, R. K. The case study crisis: Some answers. Administrative Sciences Quarterly, 1981, 26, 58-65.
Youngberg, C. F. X., Hedberg, R. and Baxter, B. Management action recommendations based on one versus two dimensions of a job satisfaction questionnaire. Personnel Psychology, 1962, 15» 149.
Zemke, R. Quality circles: Can they work in the United States? Journal of Applied Management, 1980, 5i 16-21.