Embed Size (px)
Citation preview

Infrared Technology (IR) What is it and why use it? Harold L. Von Quintus, P.E. November 9, 2015

IR – What is it & why use it?
2
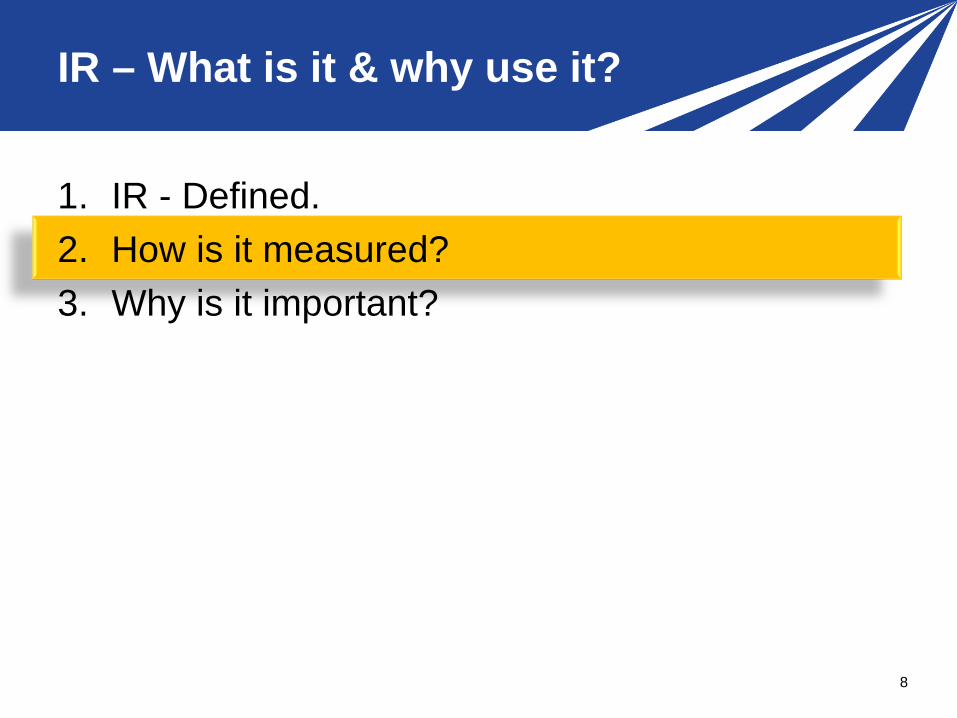
1. IR - Defined. 2. How is it measured? 3. Why is it important?

IR – What is it & why use it?
Infrared Thermography: • The mapping of temperature contours (equal
temperature) over the surface of a material. • Contours are used to evaluate materials by
measurement of their surface temperature and its variation.
3
IR – What is it & why use it?
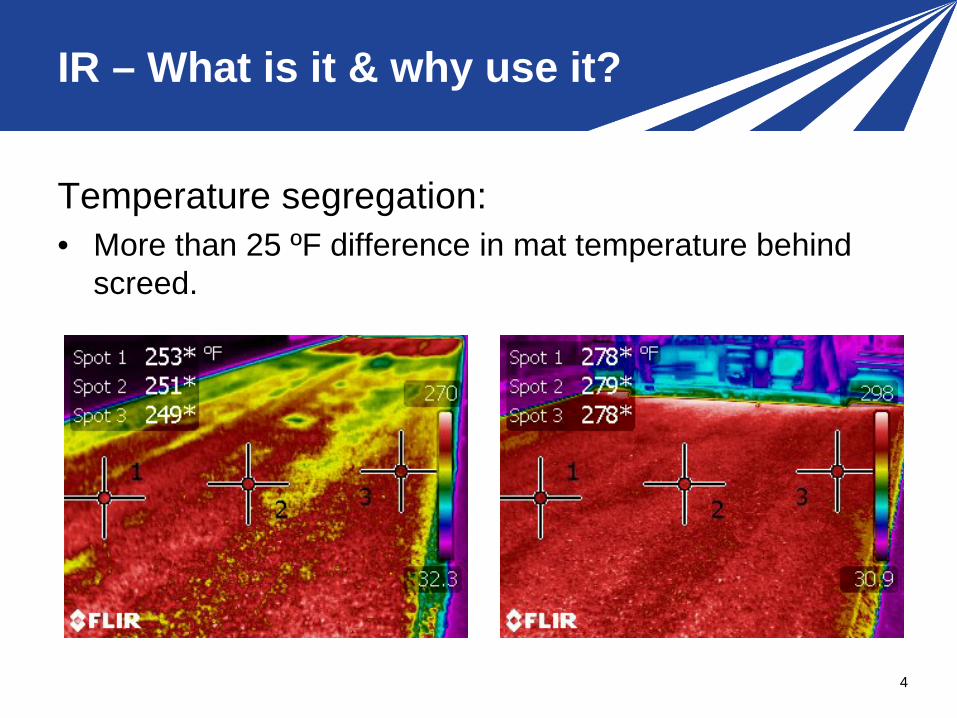
Temperature segregation: • More than 25 ºF difference in mat temperature behind
screed.
4

IR – What is it & why use it?
Types of Temperature Differences: 1. Cold spots
– Truck to truck temperature differences
– Improper loading and unloading of trucks
2. Thermal streaks – Longitudinal segregation – Inadequate or non-uniform
amount of material across the mat

IR – What is it & why use it?
• Cold spots – Temperature difference of
mat between truck exchanges – common.
– Areas with higher air voids • Focused testing have
validated higher air voids – Coring – Radar (full coverage) – Nuclear gauge

IR – What is it & why use it?
Background • 1996 through 2000s – field
work concluded temperature differences could be accurately detected and quantified: – Low temperatures result
in low density zones in mat
– A few States adopt temperature uniformity specification
.
Temperature profile criteria based on desired density
uniformity.
IR – What is it & why use it?
8
1. IR - Defined. 2. How is it measured? 3. Why is it important?
IR – What is it & why use it?
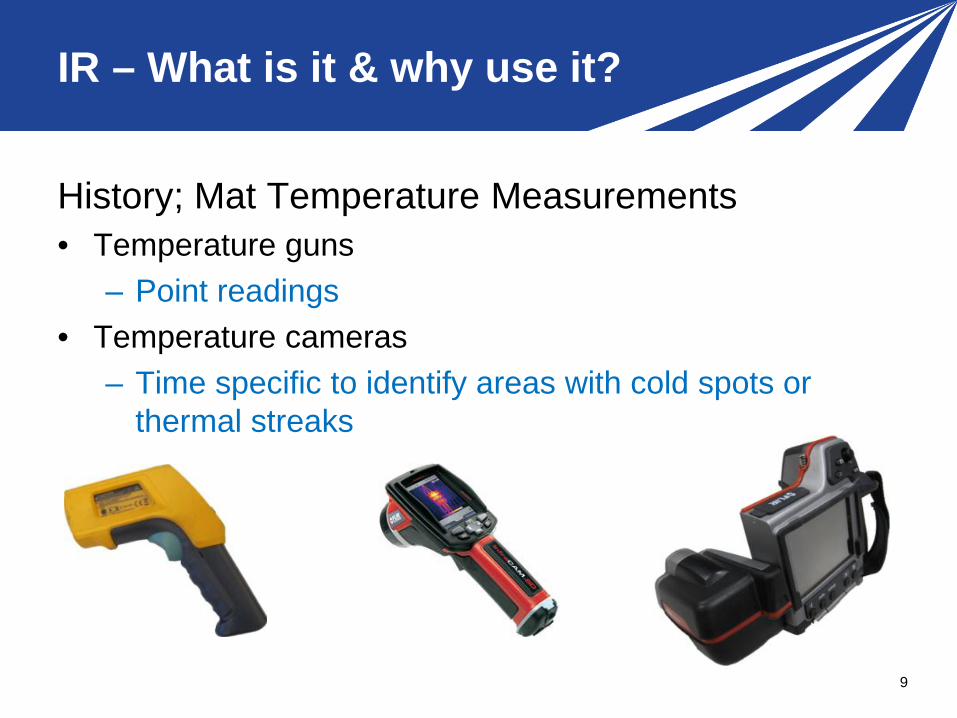
History; Mat Temperature Measurements • Temperature guns
– Point readings • Temperature cameras
– Time specific to identify areas with cold spots or thermal streaks
9

IR – What is it & why use it?
History; Mat Temperature Measurements • IR sensors, IR-Bar; first device for continuous readings • Pave-IR Scanner; second generation device for
continuous readings
10

IR – What is it & why use it?
Application & use of temperature cameras • Identify areas with cold spots for biased sampling in
density specification • Identify thermal streaks
11

IR – What is it & why use it?
Application & use of IR-Bar and Scanner • Continuous readings to
evaluate mat uniformity through temperature uniformity.
• Non-uniform temperatures usually mean, non-uniform densities.

IR – What is it & why use it?
13
1. IR - Defined. 2. How is it measured? 3. Why is it important?

IR – What is it & why use it?
• Aggregate segregation in mat = temperature segregation • Non-uniform temperatures usually result in non-uniform
densities
14

Segregation – A difficult issue to resolve, when it is difficult to identify or confirm.
IR – What is it & why use it?

IR – What is it & why use it?
• Truck to truck segregation results in cold spots; IR can accurately identify these areas.

IR – What is it & why use it?
• Both sided longitudinal and centerline segregation result in thermal streaks; IR can identify these areas.

IR – What is it & why use it?
• Effect of cold spots, low mat temperatures on percent compaction; densities are: – Lower – More variable
18

IR – What is it & why use it?
• Effect of reduced compaction or higher air voids because of lower mat temperatures.
19

IR – What is it & why use it?
• Fatigue life can be substantially reduced, as a result of lower densities because of lower mat temperatures.
Source: NCAT (2000)
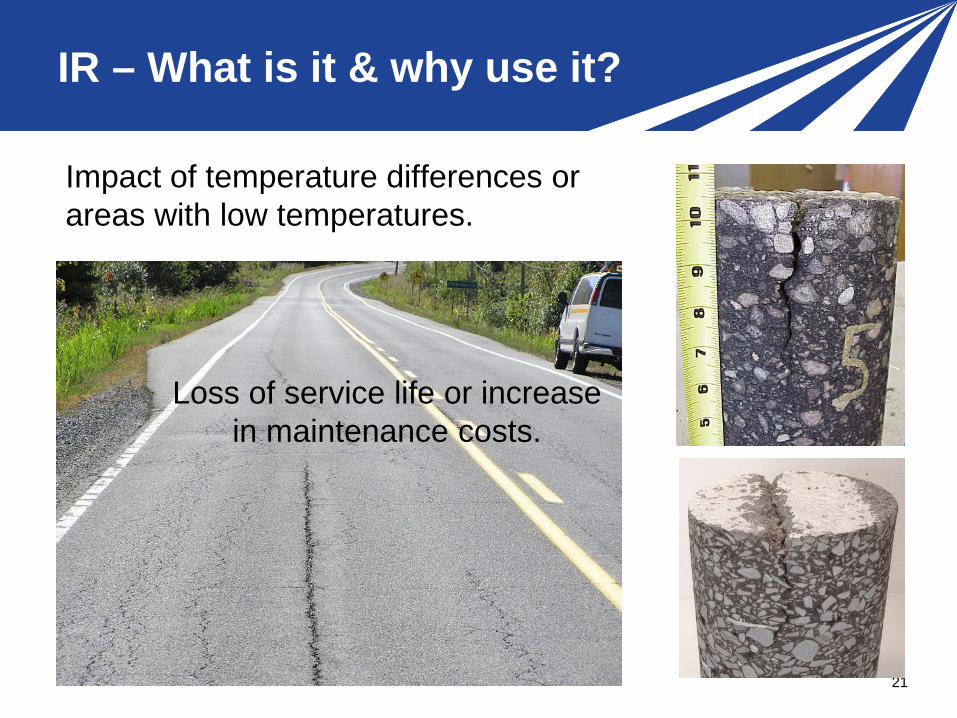
Impact of temperature differences or areas with low temperatures.
21
Research and Development
IR – What is it & why use it?
Loss of service life or increase in maintenance costs.
IR – What is it & why use it?
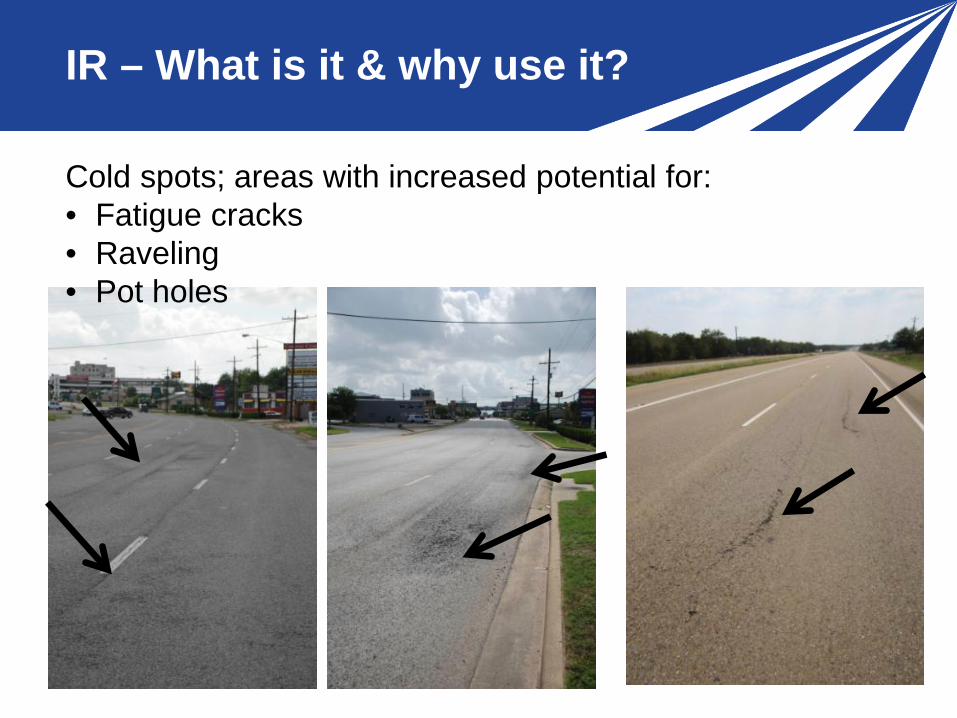
Cold spots; areas with increased potential for: • Fatigue cracks • Raveling • Pot holes

IR – What is it & why use it?
Thermal streaks; longitudinal areas with increased potential for: • Longitudinal cracking
23

IR – What is it & why use it?
• Thermal streaks can be very damaging, depending on the level of density achieved in localized areas.
• Measuring the density, accurately, in a localized area is complicated.
24
Infrared Technology (IR) What is it and why use it?

Infrared Technology (IR) Data Analyses and Findings Harold L. Von Quintus, P.E. November 9, 2015
Data Analyses & Findings Anchorage Airport
27
1. Project Overview 2. Data Collection 3. Data Processing 4. Data Summary
Data Analyses & Findings Anchorage Airport
28
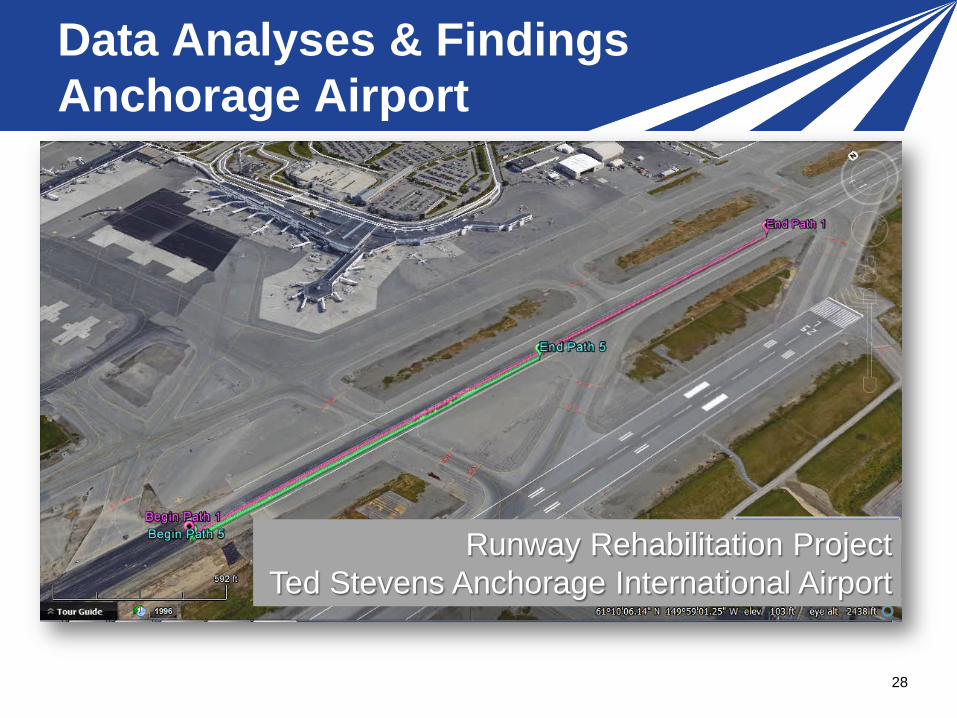
Runway Rehabilitation Project Ted Stevens Anchorage International Airport
Data Analyses & Findings Anchorage Airport
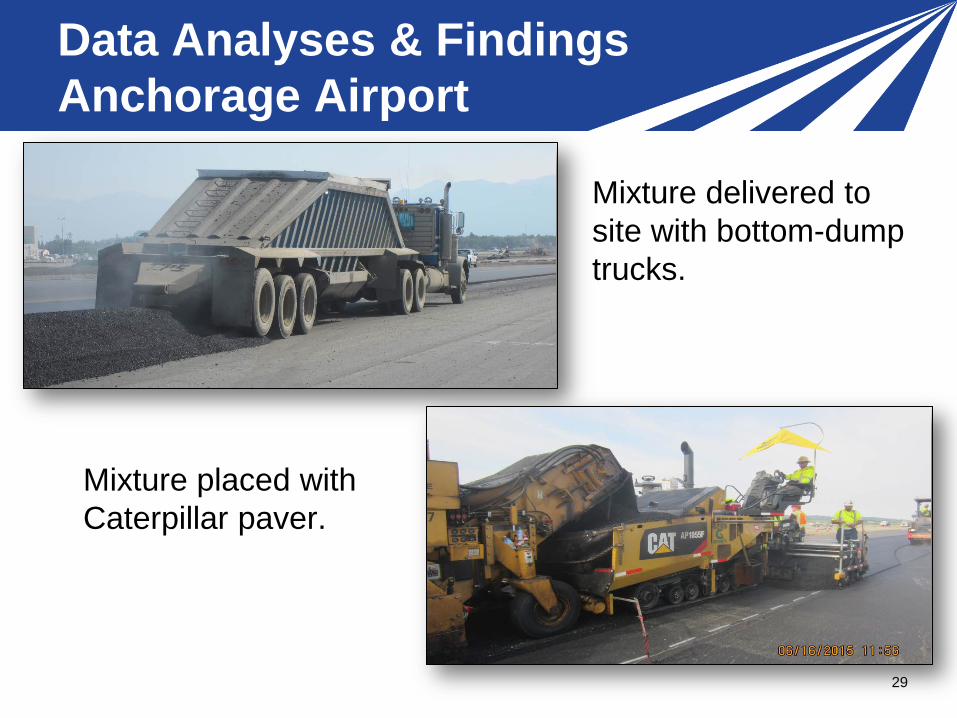
Mixture delivered to site with bottom-dump trucks.
29
Mixture placed with Caterpillar paver.
Data Analyses & Findings Anchorage Airport
30
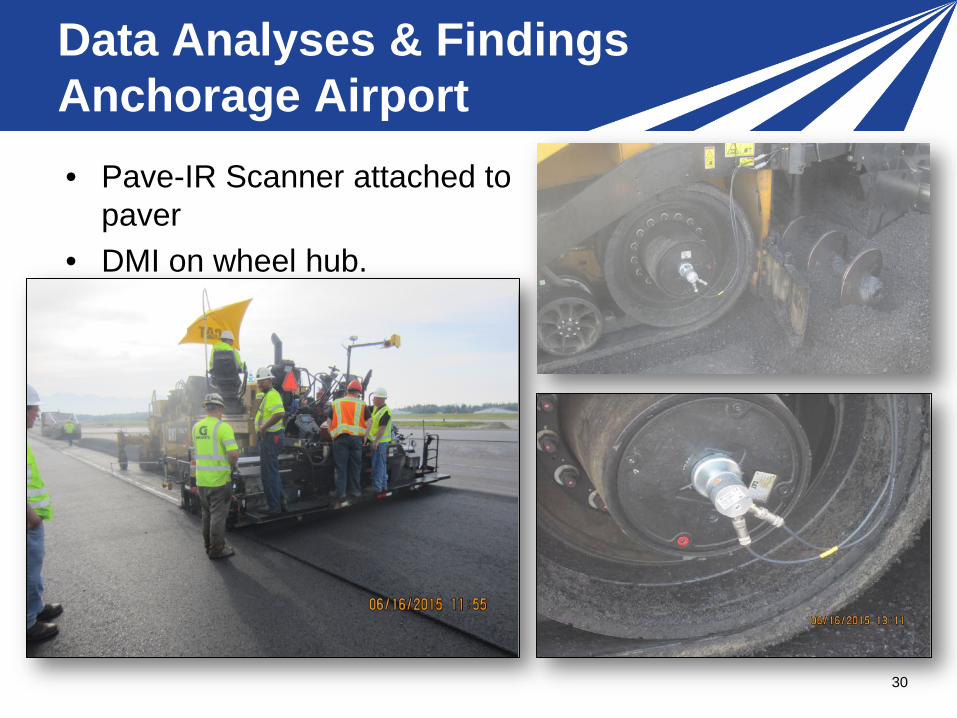
• Pave-IR Scanner attached to paver
• DMI on wheel hub.

Data Analyses & Findings Anchorage Airport
• IR Scanner attached to paver and scans mat behind screed in one direction.
• GPS attached to the scanner arm.
31
Data Analyses & Findings Anchorage Airport
32
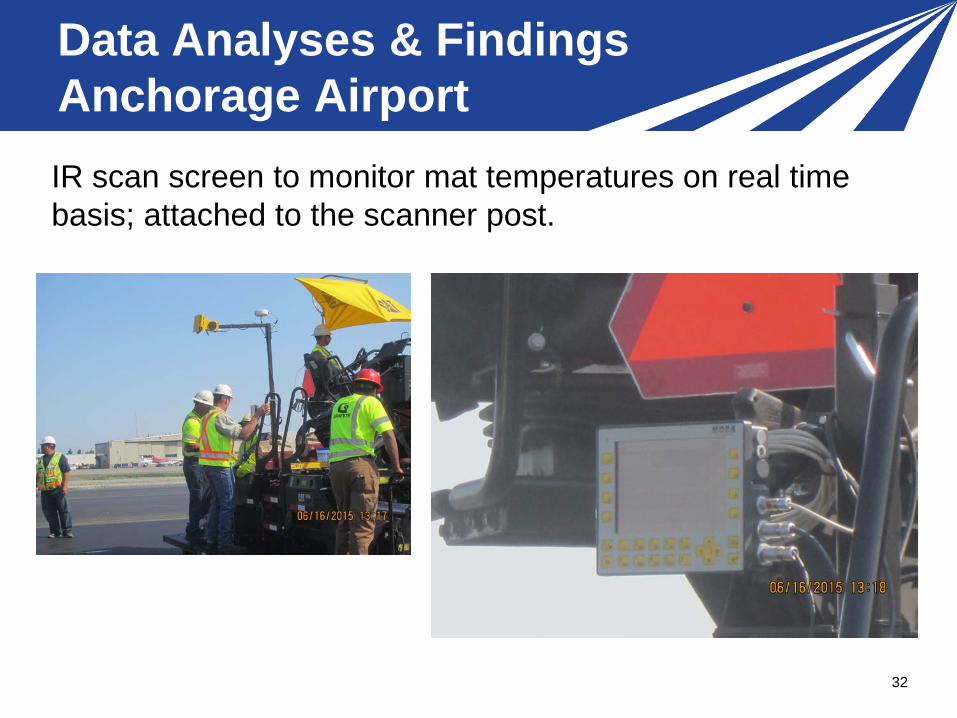
IR scan screen to monitor mat temperatures on real time basis; attached to the scanner post.
Data Analyses & Findings Anchorage Airport
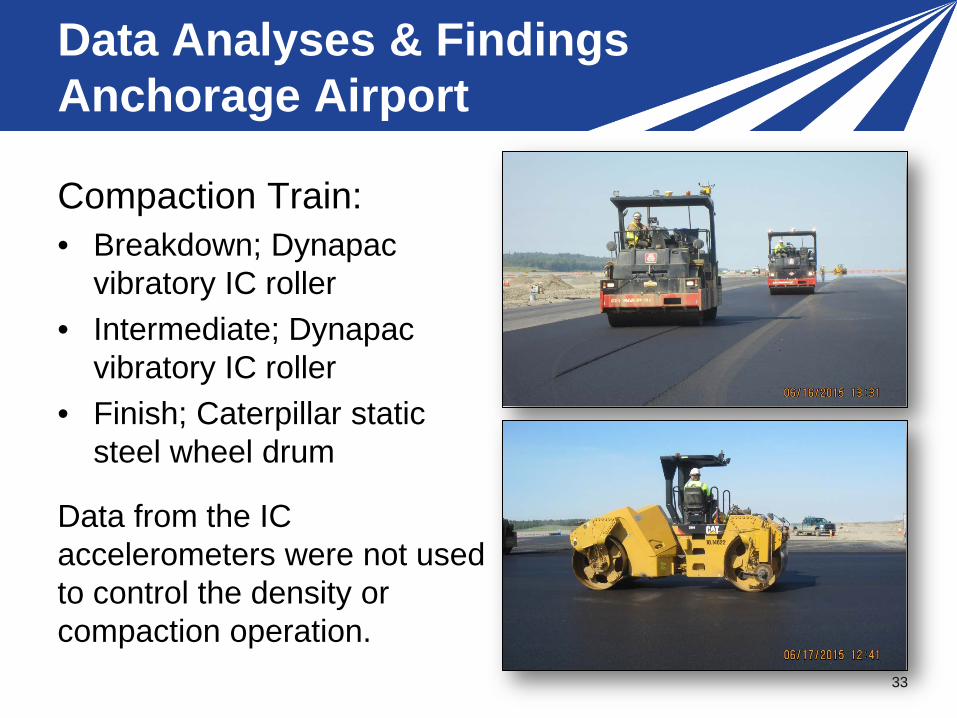
Compaction Train: • Breakdown; Dynapac
vibratory IC roller • Intermediate; Dynapac
vibratory IC roller • Finish; Caterpillar static
steel wheel drum
33
Data from the IC accelerometers were not used to control the density or compaction operation.

Data Analyses & Findings Anchorage Airport
34
IC Rollers used GIS device to
ensure uniform coverage of
rollers.
Data Analyses & Findings Anchorage Airport
35
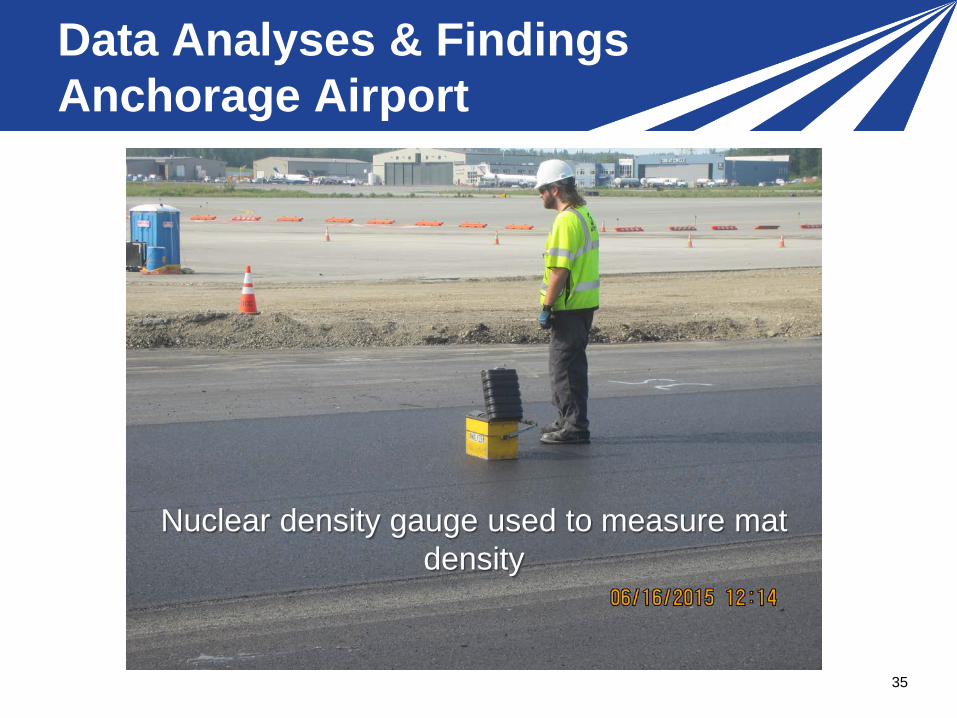
Nuclear density gauge used to measure mat density

Data Analyses & Findings Anchorage Airport
36
1. Project Overview 2. Data Collection 3. Data Processing 4. Data Summary

Data Analyses & Findings Anchorage Airport
37
Raw Temperature Profile for first part of the first path.

Data Analyses & Findings Anchorage Airport
38
Raw Temperature Profile for second part of the first path.

Data Analyses & Findings Anchorage Airport
39
Raw Temperature Profile for fifth path.

Data Analyses & Findings Anchorage Airport
40
Summary of Raw Data for Path #1
Avg. Temp. = 280.8 ºF
Not temperatures of mat

Data Analyses & Findings Anchorage Airport
41
Not temperatures of mat
Summary of Raw Data for
Path #5 Avg. Temp. =
289.9 ºF

Data Analyses & Findings Anchorage Airport
42
Paver Speed Summary of Raw Data
for Path #1 On the avg.: 15 ft./min.

Data Analyses & Findings Anchorage Airport
43
Paver Speed Summary of Raw Data for
Path #5 On the avg.: 13 ft./min.

Data Analyses & Findings Anchorage Airport
44
1. Project Overview 2. Data Collection 3. Data Processing 4. Data Summary

Data Analyses & Findings Anchorage Airport
Data Processing—eliminate invalid temperature measurements: 1. Eliminate measurement locations within 2 feet of the
mat’s edge.
45

Data Analyses & Findings Anchorage Airport
Data Processing—eliminate invalid temperature measurements: 2. Eliminate data with paver stops greater than 10 seconds,
between locations: – 2 feet behind measurement location of stop – 8 feet in front of measurement location of stop
3. Eliminate temperature readings < 170 ºF and > 400 ºF.
46

Data Analyses & Findings Anchorage Airport
47
T1.0 T98.5
• Temperature Differential, each 150 foot segment

Data Analyses & Findings Anchorage Airport • Temperature Differential Criteria, each 150 foot
segment:
• Tdiff < 25 ºF No temperature difference • 25 ºF < Tdiff < 50 ºF Moderate temperature difference • Tdiff > 50 ºF Severe temperature difference
48
0.15.98 TTTDiff −=

Data Analyses & Findings Anchorage Airport
49
Summary of Processed Data for Path #1
Data Analyses & Findings Anchorage Airport
50
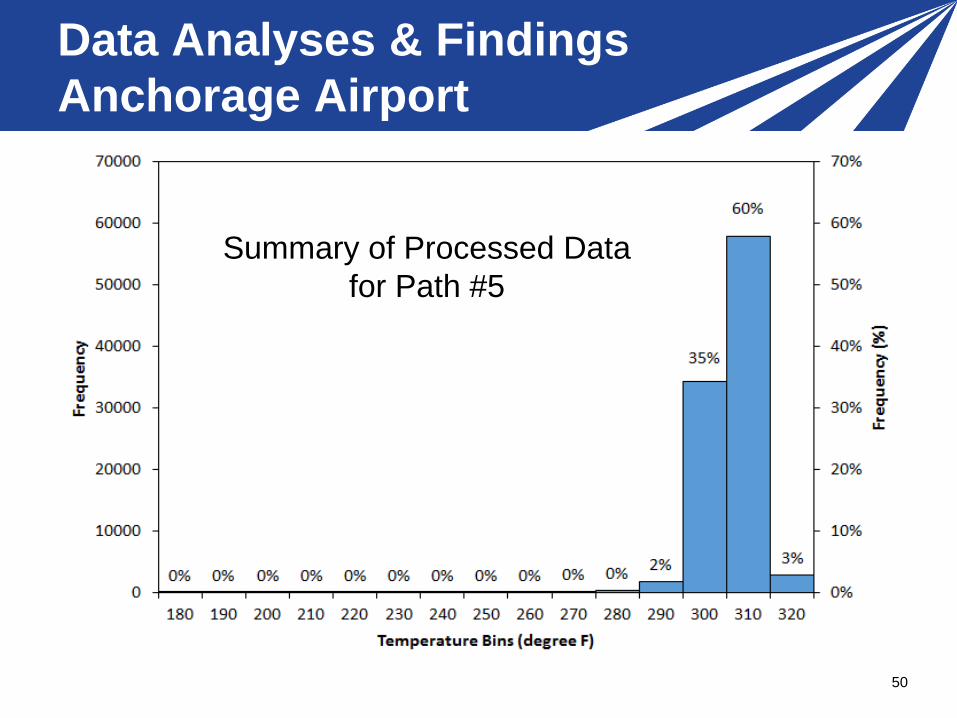
Summary of Processed Data for Path #5

Data Analyses & Findings Anchorage Airport
51
1. Project Overview 2. Data Collection 3. Data Processing 4. Data Summary
Data Analyses & Findings Anchorage Airport
52
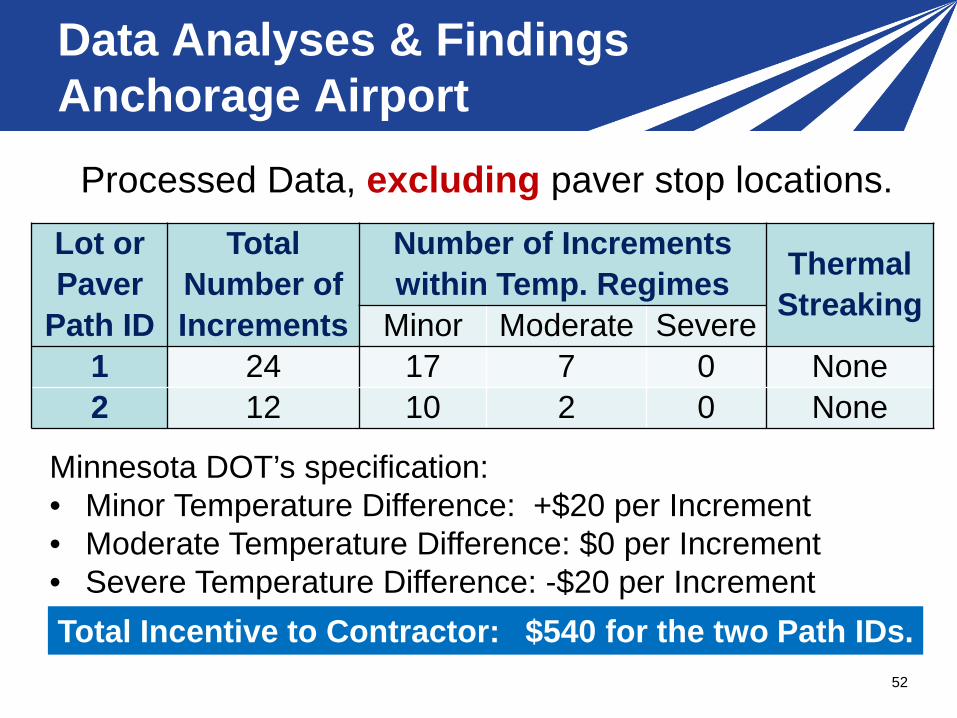
Lot or Paver
Path ID
Total Number of Increments
Number of Increments within Temp. Regimes
Thermal Streaking Minor Moderate Severe
1 24 17 7 0 None 2 12 10 2 0 None
Processed Data, excluding paver stop locations.
Minnesota DOT’s specification: • Minor Temperature Difference: +$20 per Increment • Moderate Temperature Difference: $0 per Increment • Severe Temperature Difference: -$20 per Increment Total Incentive to Contractor: $540 for the two Path IDs.

Data Analyses & Findings Anchorage Airport
53
Lot or Paver ID
Total Number of Increments
Number of Increments within Temperature Regimes
Minor Moderate Severe Path 1 24 17 5 2 Path 5 12 5 3 4
Processed Data, including paver stop locations.
Total Incentive to Contractor: $320 for the two Path IDs.

Data Analyses & Findings Anchorage Airport
54
Required paver stops due to sampling should be eliminated from temperature difference profiles.
Data Analyses & Findings Anchorage Airport Contact Information: • Richard Giessel; [email protected] • Stephan Saboundjian;
[email protected] • Steve Ayers; [email protected] • Paul Angerhofer; [email protected] • Harold Von Quintus; [email protected] • Paul Dalbey; [email protected] • Monica Jurado; [email protected] • Stephen Cooper; [email protected]
55

Infrared Technology (IR) Data Analyses and Findings

Infrared Technology (IR) Implementation & Application of Products Harold L. Von Quintus, P.E. November 9, 2015

Implementation & Application
Application & use: • Continuous readings to
evaluate mat uniformity through temperature uniformity.
• Non-uniform temperatures imply non-uniform densities, which usually mean penalties.
58

Implementation & Application
Role of IR in Quality Assurance Programs 1. Quality control plan; contractor
– Monitor production/placement operations to minimize temperature differentials of mat.
– Trouble shooting 2. Acceptance plan; agency
– Reduce future distress and maintenance costs – Dispute resolution
59

Implementation & Application
IR Role in Quality Control Plans; 3 examples 1. Missouri demonstration project 2. Virginia demonstration project 3. Federal Lands demonstration project
60

Implementation & Application
1. Missouri demonstration project – Monitor production/placement operations to minimize
temperature differentials of mat.
61

Implementation & Application
2. Virginia demonstration project – Identify reason for severe temperature differentials and
take action. • Avg. temperature differential at start of paving
project; about 30 ºF. • Avg. temperature differential after adding two
trucks; bout 15 ºF.
62
Implementation & Application
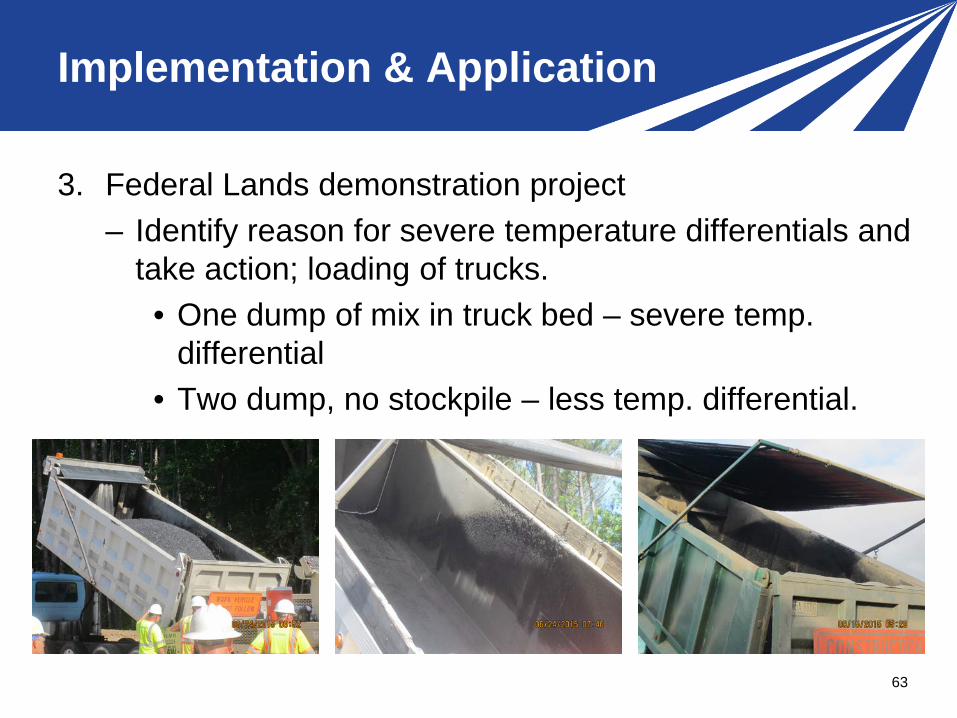
3. Federal Lands demonstration project – Identify reason for severe temperature differentials and
take action; loading of trucks. • One dump of mix in truck bed – severe temp.
differential • Two dump, no stockpile – less temp. differential.
63

Implementation & Application
IR Role in Acceptance Plans; identify: • Cold spots
– Colorado, Michigan, Minnesota, Quebec, Texas, Washington
• Thermal streaks – Quebec
64

Implementation & Application
Cold spots; areas with increased potential for: • Fatigue cracks • Raveling • Pot holes
65
• Increase in maintenance costs.
• Loss of service life

Thermal streaks; areas with increased potential for longitudinal cracking.
Research and Development
Implementation & Application
Loss of service life & increase in maintenance costs.
66

Implementation & Application
Specification Guide; AASHTO PP 80-14
67

Implementation & Application
IR Role in Acceptance Plan • Determine biased areas for
sampling and testing – Washington DOT
• Determine pay factors – Minnesota DOT – Quebec
• Minnesota pay factors for each 150 foot segment: – $200 bonus; <25ºF – $200 penalty; >50ºF
68
Implementation & Application
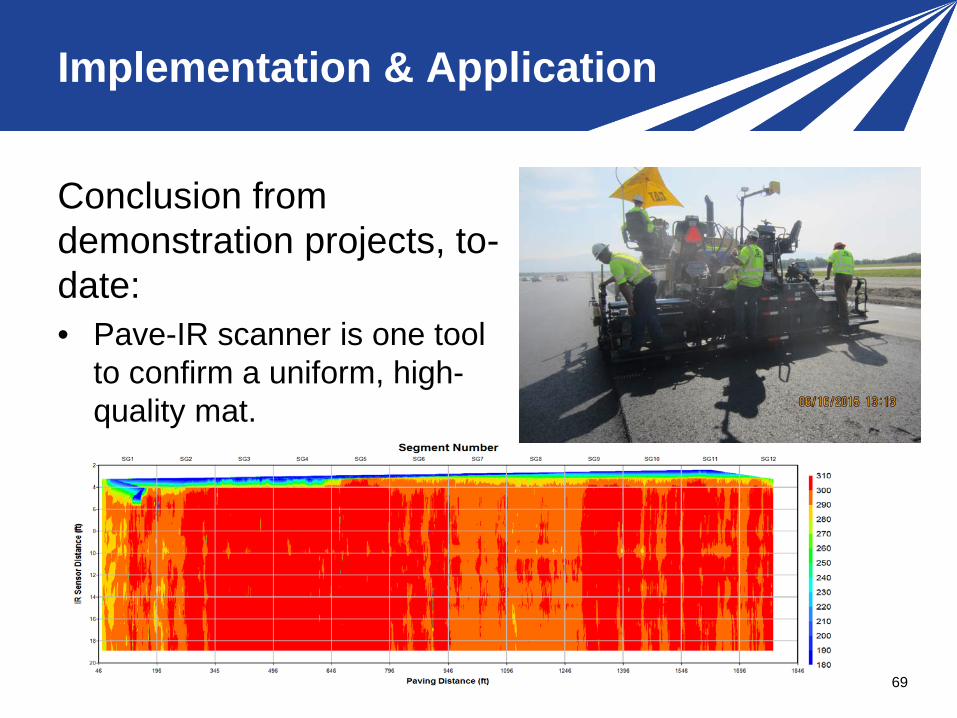
Conclusion from demonstration projects, to-date: • Pave-IR scanner is one tool
to confirm a uniform, high-quality mat.
69
Infrared Technology (IR) Implementation & Application of Products

Infrared Technology (IR) Products from Demonstration Projects Harold L. Von Quintus, P.E. November 9, 2015
Products from Demonstration Projects
1. Case Study/Demonstration Project 2. Showcase 3. Trouble Shooting and Best Practices Guide 4. Specification Guide 5. IR Guide/Primer
72

CA
AZ
CO
NM
TX
OK AR
LA
MO KY
AL GA
FL
VA
OH
MI
VT AK
MT
NV
ME WA
OR
UT KS
ID WY
ND
SD
MN
NE
WI
IA IL IN
MS
TN SC
NC
WV
PA
NY
CT NJ DE MD
MA NH
PR
RI
Products from Demonstration Projects
DC
HI
Northern Mariana Islands / Guam
American Soma
V.I.
EFL

Products from Demonstration Projects
1. Case Study/Demonstration Projects: • Purpose
– Enhance the deployment and use of the IR technology.
– Identify/summarize lessons learned from field trials. – Confirm Pave-IR can identify the different types of
temperature differentials that affect mat density and pavement performance.
74

Products from Demonstration Projects
1. Case Study/Demonstration Projects: • Outcome
– Case Study Report – Workshop
• Demonstrate and discuss value added using IR technology to agency and contractor.
75
Products from Demonstration Projects
2. Showcase: • Showcase for IR Technology
– Maine DOT is the host agency – June time frame
• Purpose – Highlight IR technology, provide training & operation. – Attendance includes agencies, contractors, industry,
consultants and academia. • Outcome
– Report to document showcase
76
All participating agencies in IR
demonstration projects will receive invitation.

Products from Demonstration Projects
3. Trouble Shooting and Best Practices Guide • Purpose of Guide
– Provide guidance on: • Setting up the equipment and getting started. • Interpreting the raw data for making decisions.
– Identify data collection and maintenance issues with the equipment and software.
• Outcome – Based on all 10 demonstration projects – Experience of agencies & consultants
77
Products from Demonstration Projects
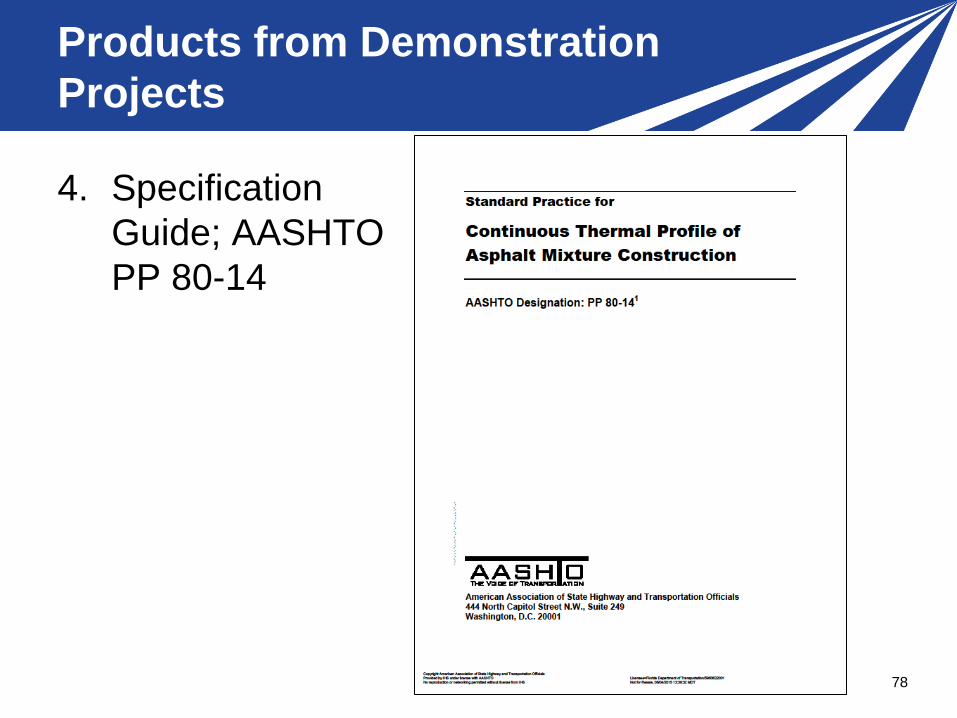
4. Specification Guide; AASHTO PP 80-14
78

Products from Demonstration Projects
4. Specification Guide • Purpose
– Advance standardization of IR equipment and testing protocols through AASHTO.
– Agencies can customize it to their needs • Outcome
– Revised/Enhanced AASHTO PP 80-14 • Based on:
– Demonstration Projects – Agency Experience: Minnesota DOT, Texas DOT, etc.
79

Products from Demonstration Projects
5. IR Guide/Primer • Purpose
– Introduce the Pave-IR method to transportation agencies and contractors.
– Increase awareness of how IR can improve paving operations and increase uniformity of mat.
– Demonstrate use of Pave-IR as a QC Tool. • Outcome
– Based on all 10 demonstration projects.
80
Infrared Technology (IR) Products from Demonstration Projects