Embed Size (px)
Citation preview

Safety Rating of Road Infrastructure-Focus on Vulnerable Road Users
Said DahdahRoad Safety ConsultantEnergy, Transport and Water Department
Road Safety Learning Day
30 March 2007

1.7Trachea, broncus, lung cancer12
1.8Diabetes mellitus11
1.8Malaria10
2.4Road Traffic Injuries9
2.8Tuberculosis8
3.4Diarrhoeal diseases 7
4.6Perinatal conditions6
5.4Chronic obstructive pulmonary disease 5
5.6HIV/AIDS4
6.7Lower respiratory infections3
10.0Cerebrovascular disease 2
12.4Ischaemic heart disease 1
Proportion of total (%)Disease or InjuryRank Deaths
Global Health LossesTwelve leading causes of mortality, 2005 in LMIC

1.0Tuberculosis12
1.0Malaria11
1.4Diarrhoel diseases10
2.5Perinatal conditions9
2.8Trachea, broncus, lung cancer8
2.8Diabetes mellitus7
3.2Road traffic injuries6
3.5Lower respiratory infections5
8.3Chronic obstructive pulmonary disease 4
10.2HIV/AIDS3
10.9Cerebrovascular disease 2
13.1Ischaemic heart disease 1
Proportion of total (%)Disease or injuryRank
Global Health LossesTwelve leading causes of mortality, 2030 in LMIC

3
DALYs in low and middle income countries (Total Population)
020,000,00040,000,00060,000,00080,000,000
100,000,000120,000,000140,000,000160,000,000180,000,000200,000,000
2005 2015 2030
TuberculosisMalariaRoad Traffic InjuriesHIV/AIDSPerinatal Conditions
13
91012
1
612
17
1
4
1526

DALYs in low and middle income countries (Male Population)
0
20,000,000
40,000,000
60,000,000
80,000,000
100,000,000
120,000,000
2005 2015 2030
MalariaTuberculosisRoad Traffic InjuriesHIV/AIDSPerinatal Conditions
12
61014
1
31315
1
2
16 22

DALYs in low and middle income countries (Male Population age 15-44)
010,000,00020,000,00030,000,00040,000,00050,000,00060,000,00070,000,00080,000,00090,000,000
2005 2015 2030
Malaria
Tuberculosis
Road Traffic Injuries
HIV/AIDS
12
522
1
1
22
622 1117

DALYs in low and middle income countries (Children age 5-14)
0
2,000,000
4,000,000
6,000,000
8,000,000
10,000,000
12,000,000
14,000,000
2005 2015 2030
Malaria
Tuberculosis
HIV/AIDS
Road Traffic Injuries
Lower respiratoryinfections
1
2
4
1622
1
1
4
2022
2
2327

DALYs 000’ in East Asia and The Pacific Region (Total Population)
-
5,000
10,000
15,000
20,000
25,000
30,000
2002 2015 2030
HIV/AIDS
Tuberculosis
Road Traffic Injuries
Perinatal Condition
Unipolar depressivedisorders
1
68
21
3
1
1549
5 57
4

DALYs 000’ in East Asia and the Pacific Region (Children age 5-14)
-
200
400
600
800
1,000
1,200
1,400
1,600
1,800
2002 2015 2030
Road traffic injuries
Respiratory infections
Unipolar depressivedisorders
4
3 1
22
1 1
7
10

DALYs 000' Europe and Central Asia (Children age 5-14)
-
50
100
150
200
250
300
350
400
450
2002 2015 2030
HIV/AIDS
Road Traffic Injuries
RespiratoryInfectionsUnipolar depressivedisorders36
104
42 3
2
713
11
1

DALYs 000' in Middle East and North Africa Region (Male Population)
0
500
1000
1500
2000
2500
3000
3500
4000
4500
2002 2015 2030
HIV/AIDS
UnipolardepressivedisordersRespiratoryinfections
Road trafficinjuries
Perinatalconditions
65
5
311
1
74
42
46
13

DALYs 000' in Middle East and North Africa Region (Children age 5-14)
-
100
200
300
400
500
600
700
800
900
1,000
2002 2015 2030
Unipolar depressivedisordersFalls
Respiratory infections
Road traffic injuries
11
1
4 2 23 3 32
47

DALYs 000' in South Asia Region (Children age 5-14)
-
1,000
2,000
3,000
4,000
5,000
6,000
2002 2015 2030
Road Traffic injuries
Unipolar depressivedisordersRespiratory infections4
2 1
1
1
62 3 2

DALYs in Sub-Saharan Africa Region (Total Population)
-
20,000
40,000
60,000
80,000
100,000
120,000
2002 2015 2030
Road traffic injuriesTuberculosisMalariaHIV/AIDS
11
1
10 66
9 9 9
3 34

DALYs 000’ in Sub-Saharan Africa Region (Children age 5-14)
-
1,000
2,000
3,000
4,000
5,000
6,000
7,000
8,000
2002 2015 2030
TuberculosisMalariaRoad traffic injuriesHIV/AIDSRespiratory infections
11 11 1410
13 16
3
2
11
1
32 3 2

Road crashes kill an estimated 1.2 million persons and injure around 50 million persons annually in low and middle income countries. Policies will need to focus on country-level strategies owned by governments in order to combat this epidemic.

0
500,000
1,000,000
1,500,000
2,000,000
2,500,000
2002 2020
High Income Countries
Europe and Central Asia
Latin America and the Carribean
Middle East and North Africa
Sub Saharan Africa
South Asia
East Asia and Pacific
Road traffic fatalities are predicted to increase by 67% by the year 2020
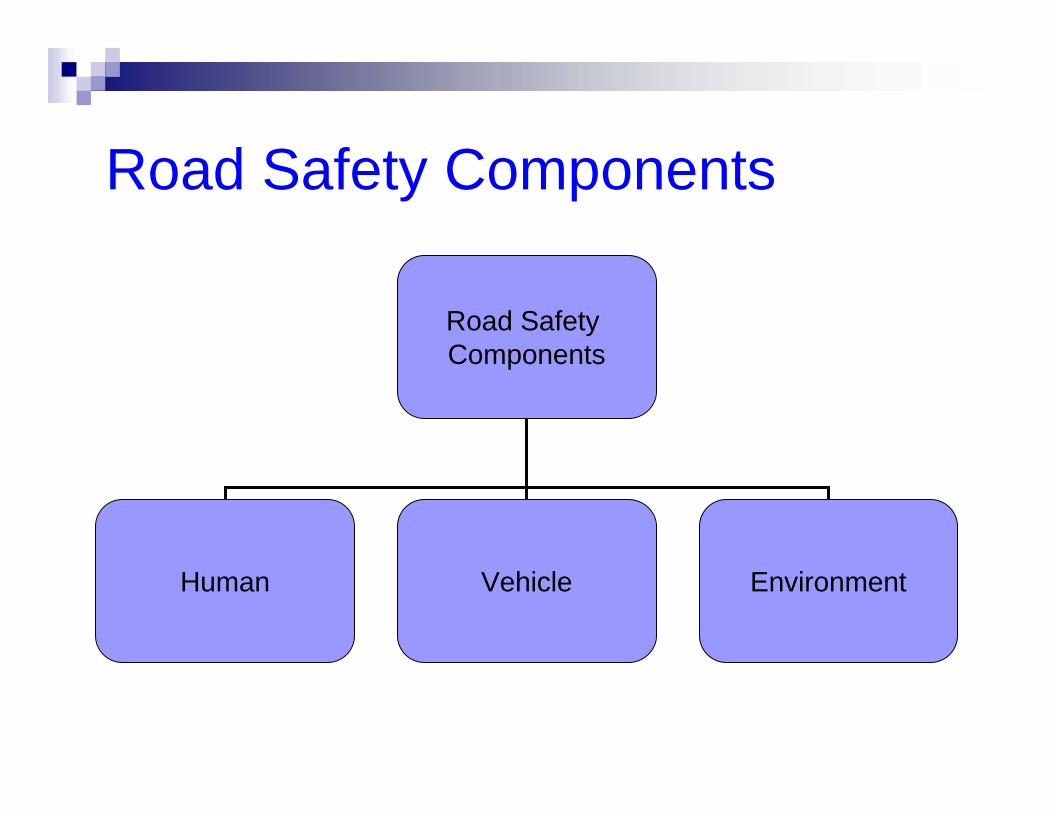
Road Safety Components
Road Safety Components
Human Vehicle Environment

National Casualty Reduction Target
In developed countries analysis shows that road infrastructure improvements are expected to deliver the greatest saving compared to vehicles and driver behaviorIn developing countries it is expected to deliver faster savings compared to behavior and vehicles

Problem of Accidents
Problem of Injury
System User System Designer

Quality Assurance of Safe Infrastructure

Tools Used in Infrastructure Safety

Network Safety Upgrading –Continuous Improvement
1. Collect reliable data
Police and statisticians must ensure serious crashes and risk factors are well recorded
2. Track performance
carry out post-project appraisals so that what works, and what does not, is learnt
Update the evidence base and improve the targeting of efficient life-saving measures
3. Apply what works

Reliable Crash data from Developing countries?
512260006
202050005
303040004
302140004
202040004
202040004
TotalPed.NMV occupants
MV occupantsTotalPed.NMV
occupantsMV
occupants
Number of Injuries (04-06)Number of Fatalities ( 04-06)Number of
accidents (04-06)

Yes it can be reliable but why and how and when?
74213518943269
15782215
28101351128
89353816281310598
651242111411366
TotalPedNMV occupants
MV occupantsTotalPedNMV
occupantsMV
occupants
Number of Injuries 04-06
Number of Fatalities 04-06
Number of
accidents 04-06

International Road Assessment Program iRAP
Drive safety upgrading where large numbers are killed and seriously injured
Global methodology to generate effective and economic countermeasure programmes
Cost efficient scale: economically significant reductions in death and serious injury measured by DALYs
Implement performance tracking methodologies for funding bodies to assess outcomes
Provide the training, manuals and web tools to build and sustainnational capability

Network Safety Upgrading –The Process1. Define action network
2. Inspect roads & map serious deficits
find the busy network where large numbers of deaths and maiming injury are concentrated
from road inspections, map deficits in lifesaving counter-measures falling below intervention levels
estimate option costs, casualty reduction benefits, and size of economic return. Assess and refine.
3. Generate safety upgrading options
generate options of affordable, economically significant, counter-measure packages
5. Recommend upgrading for action
recommend affordable, high return route and network safety upgrading projects – and action
4.Evaluate safety upgrading options

Star Rating using the extendedRoad Protection Score

iRAP Safety Rating Methodology

Risk table for headRisk table for head--on collisionon collision
Median treatment risk matrix and assignment of star rating
NB: Relative risk figures included in the table above are for illustrative purposes only

Risk table for lane width ( AMFs)

Road Design Elements and Risk
Undivided
Severe roadside
Narrow shoulders
Bad overtaking
Curves

Road Design Elements and Risk
DividedModerate roadside
Wide lanesWide shoulders
Good lines
Good overtaking Straight

Relative fatality risk/km/year
1 10 200

Road Protection Score- overall route
RPS starsTotal
1234Not rated

Detail: side area and median score
RPS starsTotal
1234Not rated

Fatal accidents
RPS starsTotal
1234Not rated

Pedestrian/Cyclists Risk TableProbability of serious or fatal injury ( MAIS3+)
0.0%
10.0%
20.0%
30.0%
40.0%
50.0%
60.0%
70.0%
80.0%
90.0%
100.0%
0 5 10 15 20 25 30 35 40 45 50 55 60 65 70 75 80 85 90 95 100Impact Speed ( Kph)
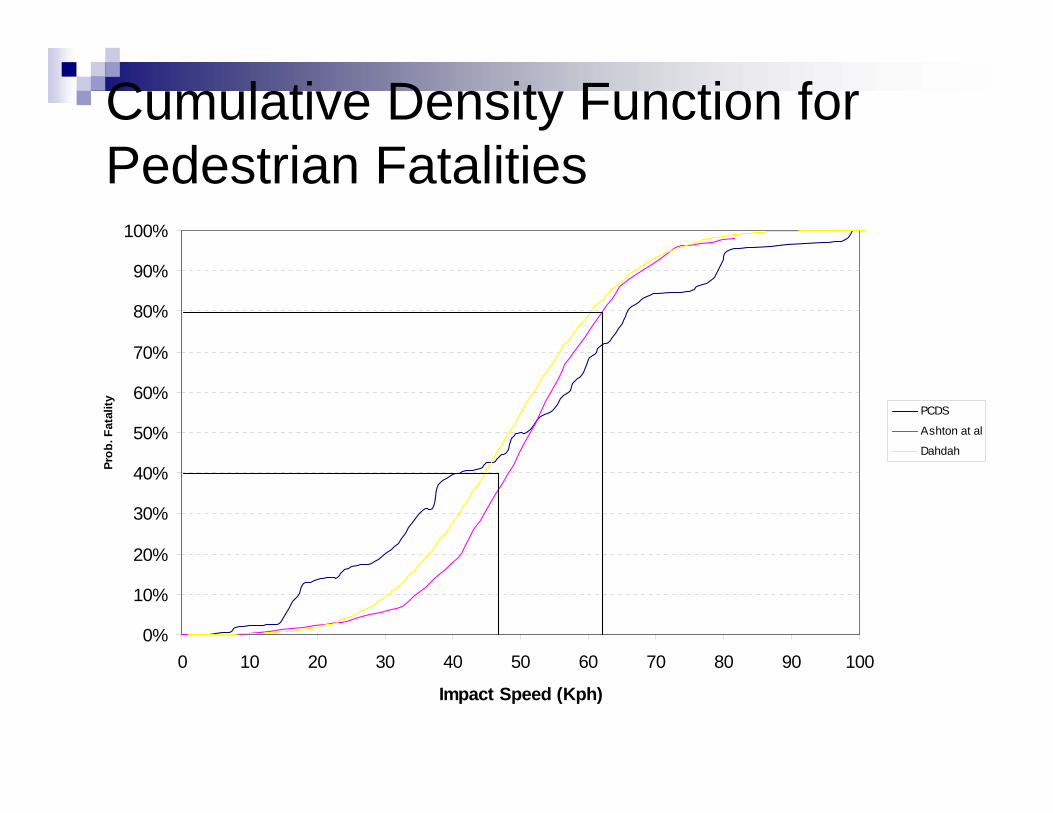
Cumulative Density Function for Pedestrian Fatalities
0%
10%
20%
30%
40%
50%
60%
70%
80%
90%
100%
0 10 20 30 40 50 60 70 80 90 100
Impact Speed (Kph)
Prob
. Fat
ality PCDS
Ashton at al
Dahdah

Vision Zero philosophyIntegration and Separation.1. Vulnerable road users should not be exposed to
motorised vehicles at speeds exceeding 30 km/h
2. If 1. cannot be satisfied then separate or reduce vehicle speed to 30 km/h
3. Car occupants should not be exposed to other motorised vehicles at speeds exceeding 50 km/h in 90 degree crossings
4. If 3. cannot be satisfied then separate or reduce angel or reduce speed to 50 km/h

Big Question
Why Developing Countries will not adopt such philosophy?
1- Is that because of lack of resources?2- Is there any conflict between this
philosophy and Mobility?3- Institutional problems?4- Is that because they don’t know about it?

iRAP Pilot
EuroRAPusRAP
AusRAPSouth Africa
MalaysiaCostaRica
Chile

What Transport Staff Can Do?

Pedestrian Markings at Uncontrolled Intersections

Safety Islands at Uncontrolled Wide intersections