Embed Size (px)
Citation preview

The Jai GroupThe Jai GroupThe Jai GroupThe Jai GroupBusiness Services for the BRICs EconomiesBusiness Services for the BRICs EconomiesBusiness Services for the BRICs EconomiesBusiness Services for the BRICs Economies
Infrastructure in Brazil- A mountain top view
JJJJ
The Jai GroupThe Jai GroupThe Jai GroupThe Jai GroupBusiness Services for the BRICs EconomiesBusiness Services for the BRICs EconomiesBusiness Services for the BRICs EconomiesBusiness Services for the BRICs Economies
AGENDA
• The Jai Group Profile
• Brazil
• Brazilian Infrastructure
• Sectors
• Framework
• What is new ?
• Recently announced infrastructure package
• Opportunities for Indian companies
• Investment
• Product Supply
• Services Supply
JJJJ
The Jai GroupThe Jai GroupThe Jai GroupThe Jai GroupBusiness Services for the BRICs EconomiesBusiness Services for the BRICs EconomiesBusiness Services for the BRICs EconomiesBusiness Services for the BRICs Economies 2
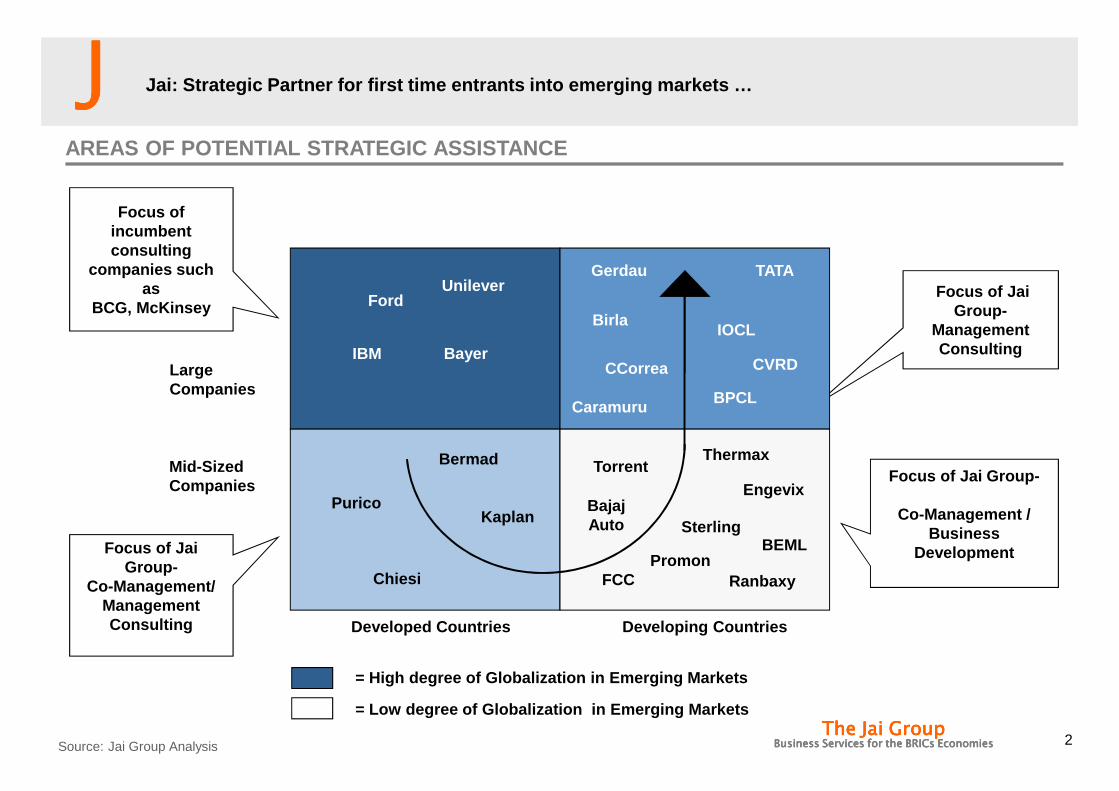
Large Companies
Mid-Sized Companies
Developed Countries Developing Countries
Focus of Jai Group-
Management Consulting
Focus of Jai Group-
Co-Management / Business
DevelopmentFocus of Jai Group-
Co-Management/Management Consulting
= High degree of Globalization in Emerging Markets
= Low degree of Globalization in Emerging Markets
Gerdau
CVRD
Birla
Focus of incumbent consulting
companies such as
BCG, McKinsey
Thermax
Sterling
Purico
Ford
Torrent
Unilever
IBM Bayer
Bermad
Chiesi
Kaplan
FCC Ranbaxy
Jai: Strategic Partner for first time entrants into emerging markets …
AREAS OF POTENTIAL STRATEGIC ASSISTANCE
Caramuru BPCL
IOCL
EngevixBajajAuto
Promon BEML
Source: Jai Group Analysis
CCorrea
TATA

JJJJ
The Jai GroupThe Jai GroupThe Jai GroupThe Jai GroupBusiness Services for the BRICs EconomiesBusiness Services for the BRICs EconomiesBusiness Services for the BRICs EconomiesBusiness Services for the BRICs Economies 3
SOME CLIENTS WHO WORK WITH US TODAYRepeat projects and long term relationships
… with a good track record in the India- Brazil corri dor …
Source: Jai Group Analysis
GOVERNMENT OF INDIAGOVERNMENT OF INDIAGOVERNMENT OF INDIAGOVERNMENT OF INDIA

JJJJ
The Jai GroupThe Jai GroupThe Jai GroupThe Jai GroupBusiness Services for the BRICs EconomiesBusiness Services for the BRICs EconomiesBusiness Services for the BRICs EconomiesBusiness Services for the BRICs Economies 4
JAI GROUP RESOURCES
…while bringing people, process, and access edge…
Source: Jai Group Analysis 4
• Presence in India, Brazil, North America, South Africa, China and Mexico
• Superior access to political leaders, embassies and industry leaders
• In constant dialogue with investors and generators of opportunities
GLOBAL NETWORKUNIQUE PROPOSITION
• Global strategy consulting firm dedicated exclusively to BRICS and emerging markets
• Over 40 engagements, corresponding to more than US $ 5 billion
• Experience, proprietary approaches and models in all sectors
• Consultants from first tier consulting firms and top executives of large BRICS companies
• iBRICS dedicated to the research, training and dissemination of business practices in BRICS
• Regularly published in newspapers and periodicals
PEOPLE AND KNOWLEDGE
• Understanding of strategy, culture, practices, and main players in emerging markets
• Full support while presenting, discussing and working with local companies
INSIGHT INTO EMERGING MARKETS

JJJJ
The Jai GroupThe Jai GroupThe Jai GroupThe Jai GroupBusiness Services for the BRICs EconomiesBusiness Services for the BRICs EconomiesBusiness Services for the BRICs EconomiesBusiness Services for the BRICs Economies 5
ManagementContractorServices
The Jai Group
ManagementConsulting
• Help emerging market multinationals – Structure and analyze complex issues involved
in international expansion in emerging markets– Numerically and using hard facts validate
intuitive hypotheses– Synthesize findings to evolve coherent strategy
• Stand in as country managers until local operation attains critical size to build a local team
– Implement strategies /structure partnerships
– Coordinate investment projects
– Recruit and manage other service providers
– Provide basic infrastructure and logistical support
… and acting as both Management Consultant and Manag ement Contractor …
FOCUS ON INTERNATIONAL OPERATIONS IN EMERGING MARKE TS
Source: Jai Group Analysis

JJJJ
The Jai GroupThe Jai GroupThe Jai GroupThe Jai GroupBusiness Services for the BRICs EconomiesBusiness Services for the BRICs EconomiesBusiness Services for the BRICs EconomiesBusiness Services for the BRICs Economies 6
… having served clients in 5 countries …
Source: Jai Group Analysis
GEOGRAPHIC COVERAGE
Brazil
Mexico
US
South Africa
India
Corporate partnerships/ actively prospecting
Permanent offices
Relevant experience
Alliance partners

JJJJ
The Jai GroupThe Jai GroupThe Jai GroupThe Jai GroupBusiness Services for the BRICs EconomiesBusiness Services for the BRICs EconomiesBusiness Services for the BRICs EconomiesBusiness Services for the BRICs Economies 7
SCOPE OF ACTIVITIES
MiningAgro
Retail
Auto
Services
Pharma
Energy
… in a variety of projects for several sectors …
Source: Jai Group Analysis
Service BreakdownIndustry Breakdown
Market Analysis & Segmentation
Target and/or Partner Search
Sourcing Analysis & Optimization
Opportunity Scan
Investment Evaluation

JJJJ
The Jai GroupThe Jai GroupThe Jai GroupThe Jai GroupBusiness Services for the BRICs EconomiesBusiness Services for the BRICs EconomiesBusiness Services for the BRICs EconomiesBusiness Services for the BRICs Economies 8
MANAGEMENT TEAM
RAKESH VAIDYANATHAN – JAI GROUP’S FOUNDER AND MANAGING DIRE CTOR• Rakesh Vaidyanathan co-founded The Jai Group after years of experience in Management consulting
first with late Dr. Jaikumar of the Harvard Business School in the United States and Mexico and laterwith Mckinsey and Company in their Miami and Madrid offices and most recently with The BostonConsulting Group in their São Paulo office
• A graduate from the Indian Institute of Management, Calcutta and MBA from The Wharton School ,Rakesh also holds an Electrical Engineering degree from the College of Engineering Guindy in ChennaiIndia. In addition, he obtained an M.A. in International affairs specializing in Latin America from theUniversity of Pennsylvania
PRASHANTH NAYAK – PARTNER & HEAD INDIA OFFICE• Prashanth is a partner of The Jai Group. Before, he had a long tenure with the Tata Group, in their auto
component business. Part of the initial start up leadership team, Prashanth has held Group HeadPositions of Human Resources and Business Planning and for four years, also ran the wiring harnessJV (Indo Japanese Joint Venture) of Tata Group, as its CEO. He was based in Mumbai and Pune inIndia.
• Prashanth graduated from the National Institute of Technology at Surathkal, Karnatake in 1992. He hasan MBA from IIM Calcutta in 1995 and was awarded the Bharat Chamber of Commerce Medal for mostbalanced and progressive outlook on Management Problems, on his graduation. He speaks English,Hindi, Kannada and Konkani fluently and understands Japanese.
When not helping clients, Rakesh is either writing Tamil Poetry or trekking in the mountains of the south of Brazil
Source: Jai Group Analysis
When not helping clients, Prashanth is learning from his kids how to be a child again.
… with a highly experienced and knowledgeable leader ship team…

JJJJ
The Jai GroupThe Jai GroupThe Jai GroupThe Jai GroupBusiness Services for the BRICs EconomiesBusiness Services for the BRICs EconomiesBusiness Services for the BRICs EconomiesBusiness Services for the BRICs Economies 9
COMMERCIAL REFERENCES
Brazilian Executives / Authorities
• Tropico Mr. Raul Delfiol, Chief Executive Officer 55 19 3707 3465
• FCC Mr. Valentino Reichert, President 55 54 2129 2200
• Gerdau Mr Ruy Lopes, Executive Director 55 51 3323 2339
• Engevix Mr. José Antunes, Partner 55 11 2106 0101
Source: Jai Group Analysis
Indian Executives / Authorities
• Aditya Birla Dr. Bharat K. Singh, Board Member 91 22-6652 5000
• Tata International Mr. Kaul, President, CEO 91 22-66652200
• Bharat Petroleum Mr. R K Mehra, Executive Director 91 22 2218 5144
• Rajshree Sugars Mr. Varadarajan, COO 91 42 2258 0981
• TVS Mr. Dinesh R, Executive Director 91 44 6679 3222
• Torrent Mr. H. Balakishna, Exec. Director of Mktg 91 97 9411 2222

JJJJ
The Jai GroupThe Jai GroupThe Jai GroupThe Jai GroupBusiness Services for the BRICs EconomiesBusiness Services for the BRICs EconomiesBusiness Services for the BRICs EconomiesBusiness Services for the BRICs Economies 10
SAMPLE PROJECTS
Source: Jai Group Analysis
• Aditya Birla Opportunity landscape for investments in Latin America
• Tata International Opportunity landscape for investments in Brazil
• Bharat Petroleum Project 1: feasibility study for investments in ethanol capacity
Project 2: partner search and valuation of selected companies
• Rajshree Sugars Feasibility study for investments in ethanol capacity, target search and valuation
• TVS Partner search and negotiations to leverage Brazilian banking automation capabilities in India
• Torrent Market entry strategy for Mexico

JJJJ
The Jai GroupThe Jai GroupThe Jai GroupThe Jai GroupBusiness Services for the BRICs EconomiesBusiness Services for the BRICs EconomiesBusiness Services for the BRICs EconomiesBusiness Services for the BRICs Economies
AGENDA
• The Jai Group Profile
• Brazil
• Brazilian Infrastructure
• Sectors
• Framework
• What is new ?
• Recently announced infrastructure package
• Opportunities for Indian companies
• Investment
• Product Supply
• Services Supply

JJJJ
The Jai GroupThe Jai GroupThe Jai GroupThe Jai GroupBusiness Services for the BRICs EconomiesBusiness Services for the BRICs EconomiesBusiness Services for the BRICs EconomiesBusiness Services for the BRICs Economies
BRAZIL – OVERVIEW
� Brazil is a 200 million, 2.5 trillion economy
• Sixth in the world, ahead of UK and breathing down France
• Larger area than the continental United States
• Democracy and private sector capitalism
• One of the BRICS, relatively less affected by crisi s
� Growth driven by:
• Commodity trade, Rise of a new middle class
• Strong Macro-economic fundamentals: fiscal surplus, trade surplus, inflation under control, lot of space to lower interest rates
• Upcoming sporting events and huge Oil finds, ongoin g investment cycle
� Problems exist, and have to be managed
• Taxes and Bureaucracy
• Corruption
• Market Concentration
In an uncertain world, western , democratic and w ith a large domestic market that is growing, Br azil is a very attractive proposition
Source: Jai Group Analysis

Klp-pnr 03/09/2012 13:28
JJJJ
13The Jai GroupThe Jai GroupThe Jai GroupThe Jai Group
Business Services for the BRICs EconomiesBusiness Services for the BRICs EconomiesBusiness Services for the BRICs EconomiesBusiness Services for the BRICs Economies
MACROECONOMIC INDICATORS
CAGR**: 8%
PURCHASE POWER PARITY IN USD TRILLION IN BRAZIL
* PPP rate equalizes the purchasing power of different currencies in their home countries for a given basket of goods.. Using a PPP basis is arguably moreuseful when comparing differences in living standards on the whole between nations because PPP takes into account the relative cost of living and theinflation rates of different countries, rather than just a nominal gross domestic product. Brazil is ranked number 9th as an economy in PPP terms. NominalGDP is USD 1.6 trillion which puts Brazil in the 10th position. Only China, India, Japan, and the US have grown at higher pace over the last hundred years
** Compound annual growth rate. *** Annualized 12 month moving average.Source: Central Bank of Brazil
Brazilian macro-economic indicators positive
1,2
1,6
2,2
2,4
2000 2005 2010 2011
… and trading more … … and despite the appreciation of
the exchange rate, reserves are
growing …
… as the economy becomes stable
0
50
100
150
200
250
1996 1998 2000 2002 2004 2006 2008 2010 2011
Dollar reservesin December2011 reachedUSD 354 bi
-5%
0%
5%
10%
15%
20%
25%
30%
35%
2002 2004 2006 2011
Projected Interest Rate
Projected Inflation Rate*** (IGPM)
Exchange R$/US$
Imports
0
0,5
1
1,5
2
2,5
3
3,5
0
50
100
150
200
250
300
350
400
2003 2004 2005 2006 2007 2008 2009 2010 2011
Reserves US$
2008
Brazil is growing …

JJJJ
The Jai GroupThe Jai GroupThe Jai GroupThe Jai GroupBusiness Services for the BRICs EconomiesBusiness Services for the BRICs EconomiesBusiness Services for the BRICs EconomiesBusiness Services for the BRICs Economies
INVESTMENT TRENDS
Brazil is a favorable destination for foreign direct investment and expected to remain so
Bloomberg provides a quarterlyinsight into how business menperceive markets for FDI*.
1o 2o3o 4o
Brazil
China
India
US
OCTOBER, 2010
* Poll is carried out among investors, analysts, and traders. Source: Bloomberg, BACEN (Central Bank of Brazil), Link Investimentos
FDI* (USD billion)FDI Destination Ranking
Favorable macroeconomic conditions
• Credit is growing
• Interest rate lowering
Growing demand
• Growing population with rising income
and huge housing deficit
Growing supply
• Specific investment-heavy projects
• World cup (2014)
• Olympic Games (2016)
• Government-led programs and state-
controlled company investments
• Luz para Todos (Energy)
• Minha Casa Minha Vida (Housing)
• PAC (Civil Infrastructure)
• Petrobras oil platforms
forecastevolution
Driving forces
31% of the investment goes to heavily regulatedindustry (Electrical, Transport, Metallurgy, Mining, andTelecom)

JJJJ
The Jai GroupThe Jai GroupThe Jai GroupThe Jai GroupBusiness Services for the BRICs EconomiesBusiness Services for the BRICs EconomiesBusiness Services for the BRICs EconomiesBusiness Services for the BRICs Economies
00,3
4,3
1,3
2,7
1,1
5,7
3,2
4
6,1
5,2
-0,3
7,5
2,93,3
4
6
-1
0
1
2
3
4
5
6
7
8
1998 1999 2000 2001 2002 2003 2004 2005 2006 2007 2008 2009 2010 2011* 2012** 2013** 2014**
Source: Brazilian Institute of Geography and Statistics (IBGE), Ministry of Finance.
BRAZILIAN ECONOMY GROWTH
International Crisis
International Crisis
International Crisis
International Crisis
No international crisis has held it back in the las t decade and Brazil is recovering smartly from this crisis as well ..

JJJJ
The Jai GroupThe Jai GroupThe Jai GroupThe Jai GroupBusiness Services for the BRICs EconomiesBusiness Services for the BRICs EconomiesBusiness Services for the BRICs EconomiesBusiness Services for the BRICs Economies
BILATERAL TRADE WITH BRAZIL
* Compound annual growth rateSource: Unctad, Secex, Indian Department of Commerce, Jai Group Analysis
... Trade with Asia is growing .....
USD MILLION (FOB BASIS) NUMBERS ARE NOT ON THE SAME SCALE
1227
7734
CAGR*=26%
Major Indo-Brazilian Joint Ventures
• Steel: Gerdau and Kalyani Auto Parts: COFAP and Endurance
• Buses: Tata and Marcopolo Automation: Perto and Lipi
All joint ventures have
happened over the last
5 years
4073
Brazil to India
India to Brazil
Brazil to China
China to Brazil
CAGR*=39%
56379 82255
CAGR*=14%
Brazil to Europe
Europe to Brazil
29103

JJJJ
The Jai GroupThe Jai GroupThe Jai GroupThe Jai GroupBusiness Services for the BRICs EconomiesBusiness Services for the BRICs EconomiesBusiness Services for the BRICs EconomiesBusiness Services for the BRICs Economies
30
2625 24
21 21 20 20
13 13
11
7 6 64 4 3 3 2 2 2 1 1 1 1 1 0,9 0,7 0,4 0,3
0
5
10
15
20
25
30
35
Top 30 Sectors for FDI Inflow into Brazil Cumulativ e (2001-10)US $ Billion
Source: Central Bank Of Brazil, Jai Group Analysis
Torrent Pharma, Dr ReddysLabs,Glenmark, Zydus Cadila, Neelam America,Pidlite, Aurobindo Pharma, Stride Arcolab,
Wipro, Infosys, TCS, Hcl, Mahindra Satyam, Genpact
RenukaSugars
Aditya BirlaNovelis,
L&T
Mahindra Automotive, TVS, Motherson Sumi, Minda
Vijai Electrical, Crompton Greaves,KEC, Kalpataru
ONGC CRI Pumps,Thermax
Aditya Birla Carbon Black United
Phosphorus
…Investors including emerging market ones continue t o invest across diverse sectors in Brazil …
FOREIGN DIRECT INVESTMENT

JJJJ
The Jai GroupThe Jai GroupThe Jai GroupThe Jai GroupBusiness Services for the BRICs EconomiesBusiness Services for the BRICs EconomiesBusiness Services for the BRICs EconomiesBusiness Services for the BRICs Economies
BRAZILIAN CHALLENGES: ECONOMY AND DOING BUSINESS
…
Source: Jai Group Analysis 18
• Abundant low cost, low quality talent pool
• Entry in to mature sectors next to impossible
• Multinationals face competition in unregulated sect ors in asymmetric ways
• Regulation and Government costs however could also choke you
• Brazilian entry has to be driven by opportunity INSP ITE of costs
… and businesses in Brazil are impacted by themBrazil faces several issues …..
• Uneven income distribution, Poor public education
• Significant imbalance of market concentration
• Informal economy that hinders tax collection
• Tariff barriers, a complex custom system, overload ed legal system, heavy taxes, bureaucratic procedures and onerous product licensing raise costs for doing business in Brazil
• The World Bank ranks Brazil 127 out of 183 economies in the world in terms of ease of doing business
• Bureaucracy
• Poor Infrastructure
• Corruption
• Preference to Local Companies
• Heavy Import Taxes
• Labor taxes
• Unions
Challenges on doing business …..
• Don’t spare on legal and administrative costs
• Build redundancy, locate right for reliability and ease of access
• While being flexible, draw clear ethical lines
• Be open to partnerships, JVs, local face strategies
• Source right, adopt creative taxation structures
• Minimize labor, plan for liabilities
• Locate, manage
…. And Solutions have to be thought through
Brazilian challenges are similar to many emerging ec onomies, but taxes and market concentration is a ke y area of concern …

JJJJ
The Jai GroupThe Jai GroupThe Jai GroupThe Jai GroupBusiness Services for the BRICs EconomiesBusiness Services for the BRICs EconomiesBusiness Services for the BRICs EconomiesBusiness Services for the BRICs Economies
ECO-FRIENDLY ORIENTATION IN BRAZIL
Brazilian strength in agriculture is powering its co mmodity boom
Source: Jai Group Analysis
Context Result
38% of the world’s unexplored arable land
15% of the world’s fresh water resources
Largest concentration of vegetal species on an average
square meter. 58% of the territory covered by rain forest
• Largest agri-business boom in the decade
• 40% of the GDP in food & food-processing related ar eas
with growing export items in over 20 global commodi ties
• World record 80% of the electricity matrix based on clean
and renewable sources (ove r 70% is hydro-based)
unrivalled combination of fertile soil and stable w eather • Only country where biofuels sell more than fossil-b ased
fuels. Brazil commands half of the foreign trade of such
fuels with 15% of its production
• Tradition in herbal products in household products,
personal care, and medicine

JJJJ
The Jai GroupThe Jai GroupThe Jai GroupThe Jai GroupBusiness Services for the BRICs EconomiesBusiness Services for the BRICs EconomiesBusiness Services for the BRICs EconomiesBusiness Services for the BRICs Economies
BRAZILIAN PRODUCTION – SELECTED CROPS
Brazil has become a global power in agribusiness, wi th a clear focus on beverages and meats
2009 BASIS
Share of Global ProductionC
6%
5%
3%
6%
17%
16%
27%
35%
22%
15%
16%
40%
56%
milk
cotton
pork
corn
soy oil
soy cake
soybeans
ethanol
sugar
chicken
beef
coffee
FCOJ*
Share of Global Trade (Exports/Imports)
World Rank
1
1
2
3
1
2
2
4
4
3
4
5
6
Brazilian Agricommodity Rank
1
2
3
4
5
6
7
8
9
10
11
12
13 1%
9%
12%
9%
21%
25%
39%
96%45%
38%
22%
32%
85%
World Rank
1
1
1
1
1
1
2
2
2
2
4
4
7
* Frozen concentrated orange juice. ** Also a biofuel and raw material to many applications.Source: Markestrat (FGV – Brazil), USDA jan 2010.
beverage products meats

JJJJ
The Jai GroupThe Jai GroupThe Jai GroupThe Jai GroupBusiness Services for the BRICs EconomiesBusiness Services for the BRICs EconomiesBusiness Services for the BRICs EconomiesBusiness Services for the BRICs Economies
….. Consuming middle class, another major driver be hind rise of Brazil ….
Note: Monthly household per capita income by class at 2009 prices: Class A/B: more than R$ 4,800.00; Class C: R$ 1,115.00 – R$ 4,800.00; Class D: R$ 804.00 – R$ 1,115.00; Class E: up to R$ 804.00.* IMF ForecastSource: Brazilian Institute of Geography and Statistics (IBGE). Preparation and estimates by the Ministry of Finance.Getúlio Vargas Foundation/National Household Sample Survey. Prepared and estimated by the Ministry of Finance
BRAZILIAN ECONOMY
Brazilian Economy
GDP(US $)GDP per Capita (US
$)
2002 500 Bn 2,800
2012* 2.6 Tn 13,300
Composition of Social
Classes (Mn People)
Enhanced income distribution has added 29 million t o middle class (Class C).
7,6 7,7 8,3 9,4 9,7 10,4 10,6
37,6 39,7 41,844,9 46,9
49,2 50,2
26,726,7
27,227,1 26,4
25,1 24,4
28,1 25,4 22,8 19,3 18,3 16 15,3
0%
10%
20%
30%
40%
50%
60%
70%
80%
90%
100%
2003 2004 2005 2006 2007 2008 2009
Distribution of Economic Classes in Brazil
(% Population)
Class A/B Class C Class D Class E
14.5
67.5
46.1
46.6
20
95.0
44.5
28.9
188
Mn
175
Mn
JJJJ
The Jai GroupThe Jai GroupThe Jai GroupThe Jai GroupBusiness Services for the BRICs EconomiesBusiness Services for the BRICs EconomiesBusiness Services for the BRICs EconomiesBusiness Services for the BRICs Economies
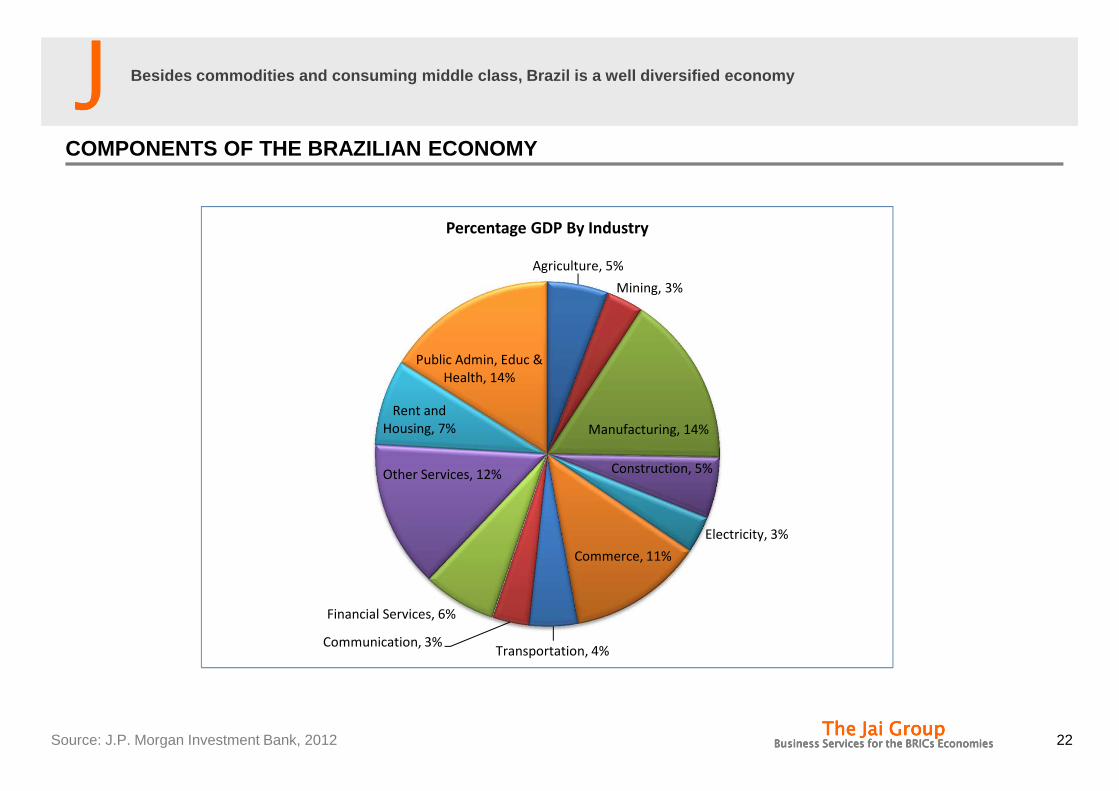
COMPONENTS OF THE BRAZILIAN ECONOMY
22
Agriculture, 5%
Mining, 3%
Manufacturing, 14%
Construction, 5%
Electricity, 3%
Commerce, 11%
Transportation, 4%Communication, 3%
Financial Services, 6%
Other Services, 12%
Rent and
Housing, 7%
Public Admin, Educ &
Health, 14%
Percentage GDP By Industry
Source: J.P. Morgan Investment Bank, 2012
Besides commodities and consuming middle class, Bra zil is a well diversified economy

JJJJ
The Jai GroupThe Jai GroupThe Jai GroupThe Jai GroupBusiness Services for the BRICs EconomiesBusiness Services for the BRICs EconomiesBusiness Services for the BRICs EconomiesBusiness Services for the BRICs Economies
AGENDA
• The Jai Group Profile
• Brazil
• Brazilian Infrastructure
• Sectors
• Framework
• What is new ?
• Recently announced infrastructure package
• Opportunities for Indian companies
• Investment
• Product Supply
• Services Supply
JJJJ
The Jai GroupThe Jai GroupThe Jai GroupThe Jai GroupBusiness Services for the BRICs EconomiesBusiness Services for the BRICs EconomiesBusiness Services for the BRICs EconomiesBusiness Services for the BRICs Economies
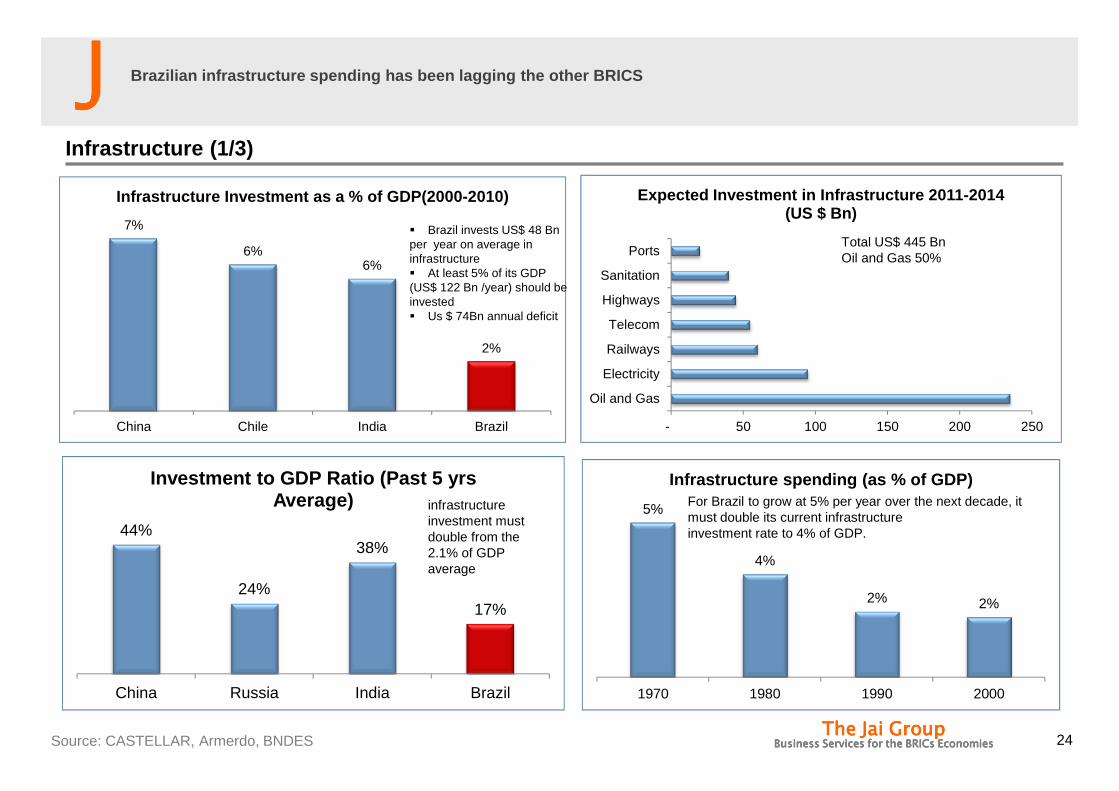
Infrastructure (1/3)
7%
6%6%
2%
China Chile India Brazil
Infrastructure Investment as a % of GDP(2000-2010)
24Source: CASTELLAR, Armerdo, BNDES
� Brazil invests US$ 48 Bn per year on average in infrastructure� At least 5% of its GDP (US$ 122 Bn /year) should be invested� Us $ 74Bn annual deficit
- 50 100 150 200 250
Oil and Gas
Electricity
Railways
Telecom
Highways
Sanitation
Ports
Expected Investment in Infrastructure 2011-2014 (US $ Bn)
Total US$ 445 BnOil and Gas 50%
Brazilian infrastructure spending has been lagging t he other BRICS
44%
24%
38%
17%
China Russia India Brazil
Investment to GDP Ratio (Past 5 yrs Average) infrastructure
investment must double from the 2.1% of GDP average
5%
4%
2% 2%
1970 1980 1990 2000
Infrastructure spending (as % of GDP)For Brazil to grow at 5% per year over the next decade, it must double its current infrastructure investment rate to 4% of GDP.

JJJJ
The Jai GroupThe Jai GroupThe Jai GroupThe Jai GroupBusiness Services for the BRICs EconomiesBusiness Services for the BRICs EconomiesBusiness Services for the BRICs EconomiesBusiness Services for the BRICs Economies
Infrastructure (2/3)
10
79
32
51
80
58
46
91
109
99
43
74
93
-
20
40
60
80
100
120
0
1
2
3
4
5
6
Global Competitiveness Index
Score 1-7 Ranking Of Brazil amongst 133 Countries
2
3 3 3
4
5
86
127
106
81
89
55
0
20
40
60
80
100
120
140
-
1
2
3
4
5
6
RailroadInfrastructure
PortInfrastructure
Roads OverallInfrastructure
Air Transport ElectricitySupply
Brazil Infrastructure by Sector
Score 1-7 Ranking of Brazil amongst 133 countries
Brazilian infrastructure has a lower rank among nati ons compared to many other characteristics, ports a re the worst, Electricity supply among the best
Source: JP Morgan

JJJJ
The Jai GroupThe Jai GroupThe Jai GroupThe Jai GroupBusiness Services for the BRICs EconomiesBusiness Services for the BRICs EconomiesBusiness Services for the BRICs EconomiesBusiness Services for the BRICs Economies
Infrastructure (3/3)
Situation
• Lack of infrastructure• Important advances but
small investment• Growing demand for
increasingly sophisticated services
Opportunities
• Domestic Market growth
• Oil and Gas• World Cup and
Olympic Games• Housing Programs• Major works;
hydropower plants, high speed railway, etc
Challenges
• Improve regulatory frameworks and raise private capital
• Increase government efficiency, management planning and project development
26
Less DevelopedMost Developed
Among the BRIC nations, Brazil probably has an immed iate opportunity, relatively unconstrained by resou rces or political will to develop infrastructure, Indian i nvestors looking at infrastructure need to look car efully
Source: National Confederation of Industry, Jai Group Analysis

JJJJ
The Jai GroupThe Jai GroupThe Jai GroupThe Jai GroupBusiness Services for the BRICs EconomiesBusiness Services for the BRICs EconomiesBusiness Services for the BRICs EconomiesBusiness Services for the BRICs Economies
AGENDA
• The Jai Group Profile
• Brazil
• Brazilian Infrastructure
• Sectors
• Framework
• What is new ?
• Recently announced infrastructure package
• Opportunities for Indian companies
• Investment
• Product Supply
• Services Supply

JJJJ
The Jai GroupThe Jai GroupThe Jai GroupThe Jai GroupBusiness Services for the BRICs EconomiesBusiness Services for the BRICs EconomiesBusiness Services for the BRICs EconomiesBusiness Services for the BRICs Economies
Railways (1/3)
• Privatization started in 1992 when 96% of the Cargo Railway Grid was privatized– Grid mostly concentrated in the South, Southeast and Northeast– Goal to improve service and reduce State’s investments in the sector– 1997: CVRD to operate Carajas and EFVM
• Rail is responsible for roughly 25% of the country’s cargo transportation, and 7mm passengers in 68 municipalities, of which 59% in Sao Paulo and 19% in Rio de Janeiro
• Different gauge sizes within the country• Large investments expected include:
– TGV Rio – Sao Paulo – Campinas– Sao Paulo city – airport link
28
RegionalNetworks
ConcessionariesStart
OperationKm
West Ferrovia Novoeste S.A.
Jul .96 1621
Centre-WestFerrovia Centro-Atlântica S.A.
Sep 96 7080
South EastMRS LogísticaS.A.
Dec 96 1674
TerezaCristina
Ferrovia TerezaCristinaS.A.
Feb 97 164
South
ALL-AméricaLatinaLogística do BrasilS.A
Mar 97 6586
North EastCompanhiaFerroviáriado Nordeste
Jan 98 4238
PaulistaFerroviasBandeirantesS.A.
Jan 99 4236
For a country of its size, Brazil has very little rai l network, much of it privatized
Source: Infrastructure in Brazil: A Brief Overview Fabiana Eggers HSH Nordbank AG, Jai Group Analysis

JJJJ
The Jai GroupThe Jai GroupThe Jai GroupThe Jai GroupBusiness Services for the BRICs EconomiesBusiness Services for the BRICs EconomiesBusiness Services for the BRICs EconomiesBusiness Services for the BRICs Economies
Railways (2/3)
29
Progress in Long Range Planning
High Speed Rail (TAV)Length 518 kmInvestment US$ 20.4 Bn
First Round: Supply and operation of trains (technology)•Auction announcement concluded•Expected auction date Oct 2012Second Round: TGV Construction•Date to be defined
The development of a North- South corridor and the T rans-Nordestina railway is the recent big initiativ e in Brazilian railway,
Source: Ministry of Transport, Jai Group Analysis

JJJJ
The Jai GroupThe Jai GroupThe Jai GroupThe Jai GroupBusiness Services for the BRICs EconomiesBusiness Services for the BRICs EconomiesBusiness Services for the BRICs EconomiesBusiness Services for the BRICs Economies
Railways (3/3)
30
Railway Network in Brazil
Source: Ministry of Transport
Expected to add to existing railway lines
JJJJ
The Jai GroupThe Jai GroupThe Jai GroupThe Jai GroupBusiness Services for the BRICs EconomiesBusiness Services for the BRICs EconomiesBusiness Services for the BRICs EconomiesBusiness Services for the BRICs Economies
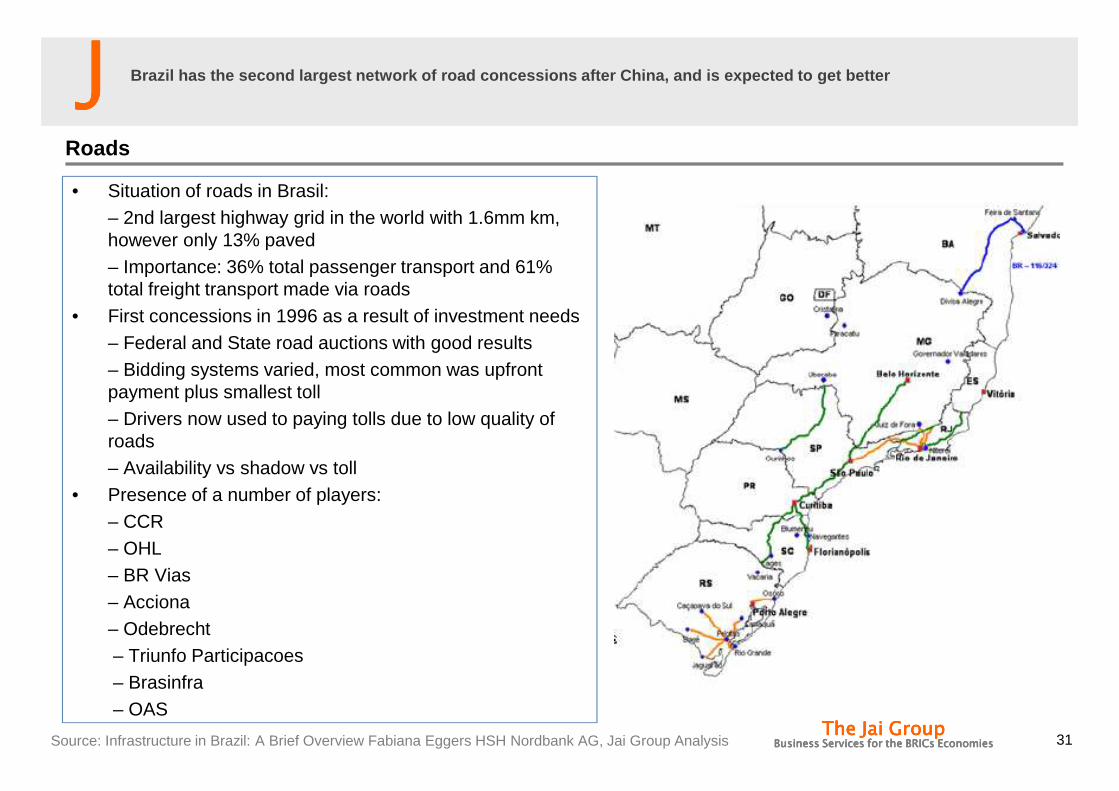
Roads
• Situation of roads in Brasil:– 2nd largest highway grid in the world with 1.6mm km, however only 13% paved– Importance: 36% total passenger transport and 61% total freight transport made via roads
• First concessions in 1996 as a result of investment needs– Federal and State road auctions with good results– Bidding systems varied, most common was upfront payment plus smallest toll– Drivers now used to paying tolls due to low quality of roads– Availability vs shadow vs toll
• Presence of a number of players:– CCR– OHL– BR Vias– Acciona– Odebrecht– Triunfo Participacoes– Brasinfra– OAS
31
Brazil has the second largest network of road conces sions after China, and is expected to get better
Source: Infrastructure in Brazil: A Brief Overview Fabiana Eggers HSH Nordbank AG, Jai Group Analysis

JJJJ
The Jai GroupThe Jai GroupThe Jai GroupThe Jai GroupBusiness Services for the BRICs EconomiesBusiness Services for the BRICs EconomiesBusiness Services for the BRICs EconomiesBusiness Services for the BRICs Economies
CCR Vs Other Road concessionary Operators
32
Brazilian CCR is the largest road concessionary in t he world by market cap
R$ Mn - 2011 EMarket
CapD. Yield EBITDA EV/EBITDA
Net Debt / EBITDA
P/E ROE SALES EV YTD*
CCR 21079 3.1 2929 9.3 1.8 21.9 28.8 4786 27341 1.1
ABERTIS 20500 8.9 5906 9.9 5.5 12.6 17 9510 58418 -6.3
ATLANTA 15305 7.5 5625 7.3 3.9 183.4 22.9 9380 40829 29.7
FERROVIAL 13972 5.3 5268 13.6 9.3 109 2.9 24988 71899 7.9
TRANSURBAN GROUP 13704 5.4 1105 19.3 7.2 10.9 2.5 1614 21303 4.1
SOC. DES AUTOROUTES 13633 8.8 3451 8.6 4.6 11.8 4977 29789 -1.3
PLUS EXPRESSWAYS 12226 4.7 1934 6.3 2.5 9.4 26.2 2340 12258 -3.8
JIANGSU EXPRESS 72677.7. 1241 7.2 0.9 11 16 1913 8892 -31.6
BRISA 3509 12.4 1128 12.2 4.7 7.4 1611 13775 -52.8
Source: Bloomberg 14/9/11 CCR R$ 47.4*Changes in Local Currency** USD -1.728

JJJJ
The Jai GroupThe Jai GroupThe Jai GroupThe Jai GroupBusiness Services for the BRICs EconomiesBusiness Services for the BRICs EconomiesBusiness Services for the BRICs EconomiesBusiness Services for the BRICs Economies
CCR portfolio
33
Large portfolio of relatively profitable road conce ssions in South East of Brazil
Consolidated Numbers - 2010
Concessionaires Stake(%) Net Revenues EBITDA EBITDA Mg. Expiration YearsAutoBan 100% 32% 34% 68% 15
Nova Dutre 100% 22% 19% 55% 9.2Via Oeste 100% 15% 15% 66% 11.1Rodonorte 86% 9% 10% 65% 9.9RodoAnel 95% 3% 3% 66% 26.6Renovias 40% 3% 3% 63% 10.5SPVias 100% 9% 10% 65% 15.8Ponte 100% 3% 3% 54% 4.5
Via Lagos 100% 2% 2% 69% 9.9Via Quatro 58% 12% 13% 68% 28.6Controlar 45% 8% 6% 45% 6
STP 38% 2% 2% 44%*Full YearAverage 13.5
CCR Ponte
CCR Via Lagos
CCR Nova Dutre
CCR Rodo Norte
CCR ViaOeste
CCR Auto Ban
CCR RodoAnel
Renovias
Rodovias Integredas Do Oeste S/A
Source: Bloomberg, Jai Group Analysis

JJJJ
The Jai GroupThe Jai GroupThe Jai GroupThe Jai GroupBusiness Services for the BRICs EconomiesBusiness Services for the BRICs EconomiesBusiness Services for the BRICs EconomiesBusiness Services for the BRICs Economies
Road Concessions Program
34
Road Concession Program in brazil
Size of the toll road
programme
• As of 2011, there were 54 motorway concessions in Brazil, totaling 13,100 km
• From 1994 to 1997, the Federal government granted five motorway concessions for 854 km of roads. After ten years and many studies, in 2007 the government granted seven more concessions totaling 2,600 km
• A few Brazilian States also launched private toll road programs, most notably Sao Paulo, Paraná and Rio Grande do Sul, all of them between 1997 and 2000. Only the State of Sao Paulo launched a second program, in 2007.
Generous terms in the
past
• contracts, include a clause which allow toll increases based on additional investments required by the government.
• between contract signing date and 2008 (an average period of 13 years) the tariff in real terms increased in four of the five concessions by 185%, 36%, 16% and 8%. In the fifth concession the tariff was reduced in real terms by 9%
PPP framework
of 2004
• Another important step in the development of road concessions in Brazil was the passing of the Public Private Partnership law in 2004.
• It overcame a limitation of the previous legislation, enabling governments to a unitary fee to the private sector when projects are not financially sustainable (Griloet al, 2005; Furtado, 2007).
• As of 2011, only one Federal project had been implemented through the PPP law. At the State level, however, the application of this law was more common, and several projects were implemented
The experiences of the previous program were taken into account when preparing the second round of federal concessions in 2007. The main changes were:
i) the engineering works were less detailed than in the first program
ii) the Amplified Consumer Price Index (IPCA) was selected as the index to adjust the toll rates (the formula of previous adjustment was based on the weighted variation of the relative indices to the main components of costs, such as pavement index, index of special structures and index of consultant services;
iii) The risk transfer was better defined in the contracts
iv) The contracts had quality standards to be achieved instead of quantities to be measured. As of 2011, it was still too early to know the results of this second program – the seven motorways were under construction or in early operation.
Concessions have followed two phases, phases 1 and 2, phase 2 concessions from 2007, subject to greater integration of construction and maintenance and mo re competition ….
Source: Jai Group Analysis

JJJJ
The Jai GroupThe Jai GroupThe Jai GroupThe Jai GroupBusiness Services for the BRICs EconomiesBusiness Services for the BRICs EconomiesBusiness Services for the BRICs EconomiesBusiness Services for the BRICs Economies
Comparison of cost structure of 1st and 2nd phases concessions at constant prices Nova Dutra and Fernao Dia highways
35
Dutra (ANTT 1997 data in 2007 prices)
Fernao Dia
(commercial
proposition of winner)%
Fernao Dia (ANTT estimations before
tendering)%
1. General dataLength 402 562 562Length / toll gate 80 70 70
2. Forecast traffic (concessionaire's data)Base toll units
Traffic equivalent in second year per km 162,000 244,000 51% 132,000 -19%Traffic equivalent in tenth year per km 246,000 385,000 57% 178,000 -28%Traffic equivalent in twentieth year per km 315,000 562,000 78% 245,000 -22%
3. Investments (concessionaire's data)R$ 2008/km/yearRoad rehabilitation 115,000 54,000 -53% 92,000 -20%Improvements 97,000 19,000 -80% 25,000 -74%Operating necessities 60,000 24,000 -60% 29,000 -52%Total 272,000 96,000 -65% 146,000 -46%
4. Operational costs (concessionaire's data)R$ 2008/km/yearRoad maintenance 132,000 25,000 -81% 22,000 -83%Operation and services 472,000 104,000 -78% 134,000 -72%
including administration costs 114,000 22,000 -81% 34,000 -70%including toll collection costs 72,000 27,000 -63% 34,000 -53%Including costs of services to users 106,000 29,000 -73% 27,000 -75%
Total 604,000 129,000 -79% 156,000 -74%
5. Total costs including guarantees, police and fi scalization
R$ 2008/km/year 914,000 247,000 -73% 327,000 -64%6. Economic & financial data
Base tariff in 2008 7.80 1.36 -83% 2.88 -63%
IRR of concession (not accounting for capital structure) 17.58 8.55 -51% 8.95 -49%
…… Resulting in lower costs, lower tariffs and lo wer IRRs
Source: Private Participation in the Road Sector in Brazil: Recent Evolution and Next Steps AdrienVéron and Jacques Cellier

JJJJ
The Jai GroupThe Jai GroupThe Jai GroupThe Jai GroupBusiness Services for the BRICs EconomiesBusiness Services for the BRICs EconomiesBusiness Services for the BRICs EconomiesBusiness Services for the BRICs Economies
Transport
36Source: Ministerio da Fazenda
6,7
4,3
3,8
3,4
0 2 4 6 8
Norte SulRailway
Sao PauloSubway
Sao PauloBeltway
Transnordestina Railway
Important Transport Projects in Brazil (US$ Bn)
Programme of Investment in Logistics (Roads and Railways)
23,518,5
05
10152025
In Next 5 Years Over 20 Years
Roads(7500km) : R$ 42Bn
56
35
0102030405060
In Next 5 Years Over 25 Years
Railways(10,000km) : R$ 91Bn
Significant spend on road and rail networks planned in the next few years

JJJJ
The Jai GroupThe Jai GroupThe Jai GroupThe Jai GroupBusiness Services for the BRICs EconomiesBusiness Services for the BRICs EconomiesBusiness Services for the BRICs EconomiesBusiness Services for the BRICs Economies
Airports (1/2)
• Main airports managed by INFRAERO (97% of total airport market in 2008)
• State-owned company linked to the Defense Ministry, manages 67 airports and 32 cargo terminals
• Historical underinvestment affects capacity and efficiency in runways, passenger and cargo terminals and air traffic control
• Demand continues growing: business (GDP growth), tourism (average income growing; safety perception ie international music performances), sports events (World Cup and Olympics)
• SINART – Porto Seguro Airport: only case of successful privatization of mid/large size airport in Brazil, before the recent privatization of three large airports
37
Airports another large area ripe for privatization, with one round of privatizations already over
Source: Infrastructure in Brazil: A Brief Overview Fabiana Eggers HSH Nordbank AG, Jai Group Analysis

JJJJ
The Jai GroupThe Jai GroupThe Jai GroupThe Jai GroupBusiness Services for the BRICs EconomiesBusiness Services for the BRICs EconomiesBusiness Services for the BRICs EconomiesBusiness Services for the BRICs Economies
Airports (2/2)
96 102 111 113128
155180
0
50
100
150
200
2005 2006 2007 2008 2009 2010 2011
Evolution of Passengers in Brazilian Airports (Mn People)
38Source: Infraero, ANAC
67 Major Airports
1715
10
02468
1012141618
Cogonhas/SP Galeao/RJ Confins/MG
Movement of Passengers in 2011
9% of Total 8% of Total
5% of Total
2,6
9,5
2,2
1,6
2,7
5,1
0
1
2
3
4
5
6
7
8
9
10
Brasilia/DF Guarulhos/SP Viracopos/SP
Brazilian Airport Auctions Results
Winner Bid
Planned Investment
With three airports privatized with multi-billion do llar bids, and three others in the fray, large scop e for privatization, with 67 airports carrying 180 million people
JJJJ
The Jai GroupThe Jai GroupThe Jai GroupThe Jai GroupBusiness Services for the BRICs EconomiesBusiness Services for the BRICs EconomiesBusiness Services for the BRICs EconomiesBusiness Services for the BRICs Economies
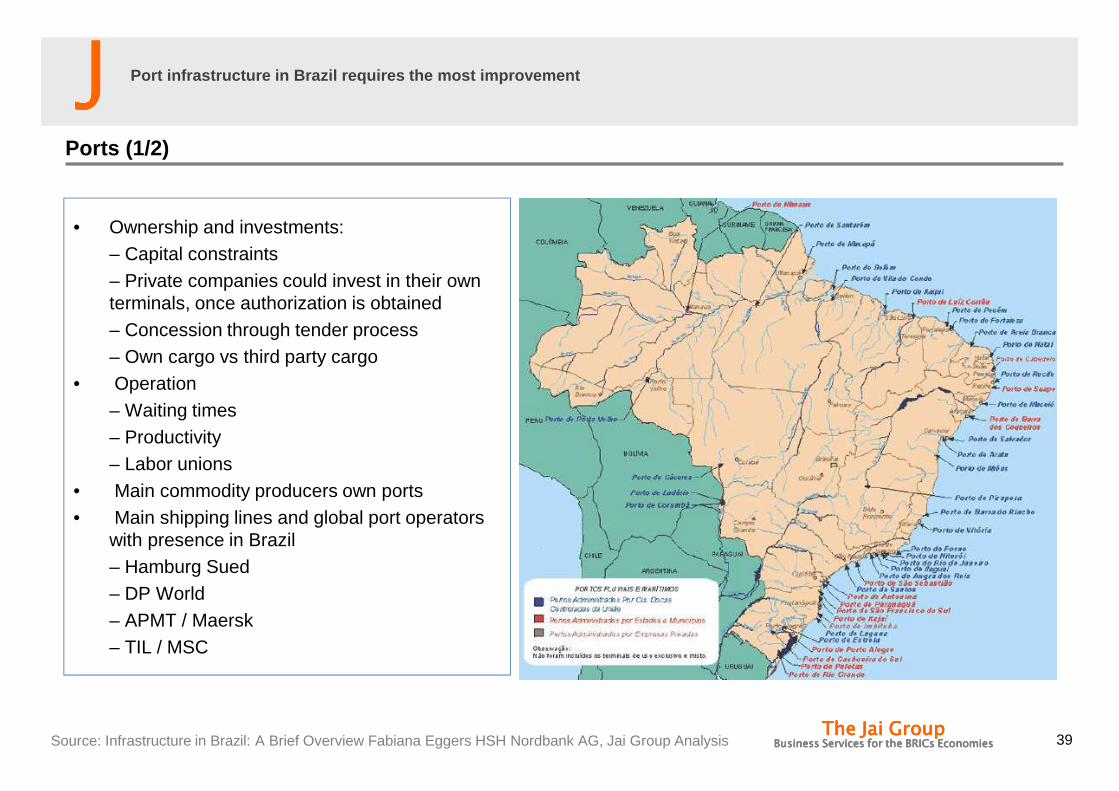
Ports (1/2)
• Ownership and investments:– Capital constraints– Private companies could invest in their own terminals, once authorization is obtained– Concession through tender process– Own cargo vs third party cargo
• Operation– Waiting times– Productivity– Labor unions
• Main commodity producers own ports• Main shipping lines and global port operators
with presence in Brazil– Hamburg Sued– DP World– APMT / Maersk– TIL / MSC
39
Port infrastructure in Brazil requires the most impr ovement
Source: Infrastructure in Brazil: A Brief Overview Fabiana Eggers HSH Nordbank AG, Jai Group Analysis
JJJJ
The Jai GroupThe Jai GroupThe Jai GroupThe Jai GroupBusiness Services for the BRICs EconomiesBusiness Services for the BRICs EconomiesBusiness Services for the BRICs EconomiesBusiness Services for the BRICs Economies
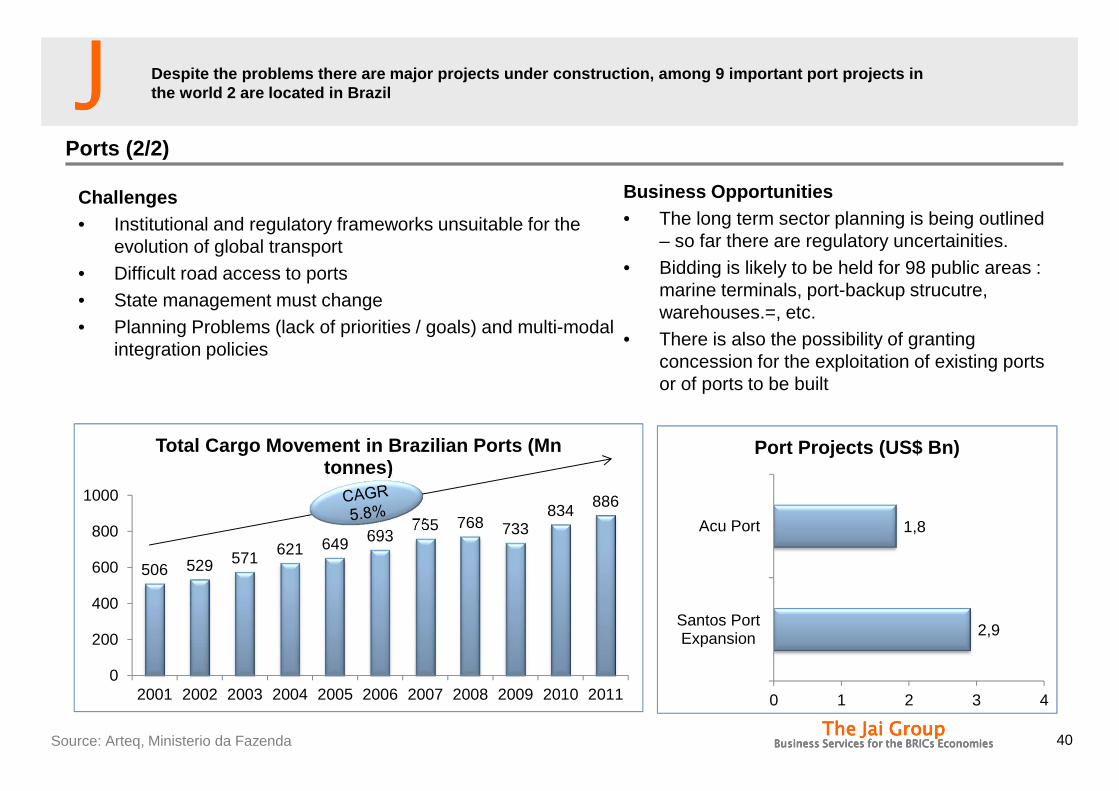
Ports (2/2)
Challenges• Institutional and regulatory frameworks unsuitable for the
evolution of global transport• Difficult road access to ports• State management must change• Planning Problems (lack of priorities / goals) and multi-modal
integration policies
40Source: Arteq, Ministerio da Fazenda
506 529 571 621 649 693755 768 733
834886
0
200
400
600
800
1000
2001 2002 2003 2004 2005 2006 2007 2008 2009 2010 2011
Total Cargo Movement in Brazilian Ports (Mn tonnes)
2,9
1,8
0 1 2 3 4
Santos PortExpansion
Acu Port
Port Projects (US$ Bn)
Despite the problems there are major projects under construction, among 9 important port projects in the world 2 are located in Brazil
Business Opportunities• The long term sector planning is being outlined
– so far there are regulatory uncertainities.• Bidding is likely to be held for 98 public areas :
marine terminals, port-backup strucutre, warehouses.=, etc.
• There is also the possibility of granting concession for the exploitation of existing ports or of ports to be built

JJJJ
The Jai GroupThe Jai GroupThe Jai GroupThe Jai GroupBusiness Services for the BRICs EconomiesBusiness Services for the BRICs EconomiesBusiness Services for the BRICs EconomiesBusiness Services for the BRICs Economies
Energy
• National Program of Privatization 1995 – 2000 (“Programa Nacional de Desestatizacao)– Model: segregation of segments within the generation, transmission and distribution chain
• Current status:– Brazil is the largest energy producer in Latin America in terms of installed capacity (over 100,000 MW)– 9th largest energy producer in the world (after USA, China, Japan, Russia, India, Germany, Canada and France)
• Generation:– Main energy source: 83% hydroelectric power plants– Environmental concerns– Other sources: natural gas (5%), biomass (4%), nuclear (3%), coal (2%)– Thermoelectric becoming increasingly important with the discovery of natural gas reserves
• Transmission:– Successful bidding process with over 60 lines auctioned, most of them to private companies– Strong presence of foreign investors, mainly Spanish, Italian and Colombian and China
• Distribution: fragmented, with 47 private companies (out of 64) responsible for 80% of all distribution– Regulation requires them to be fully contracted to fulfill commitments
41
In energy Brazil has made significant progress alrea dy versus countries like India
Source: National Confederation of Industry, Jai Group Analysis
JJJJ
The Jai GroupThe Jai GroupThe Jai GroupThe Jai GroupBusiness Services for the BRICs EconomiesBusiness Services for the BRICs EconomiesBusiness Services for the BRICs EconomiesBusiness Services for the BRICs Economies
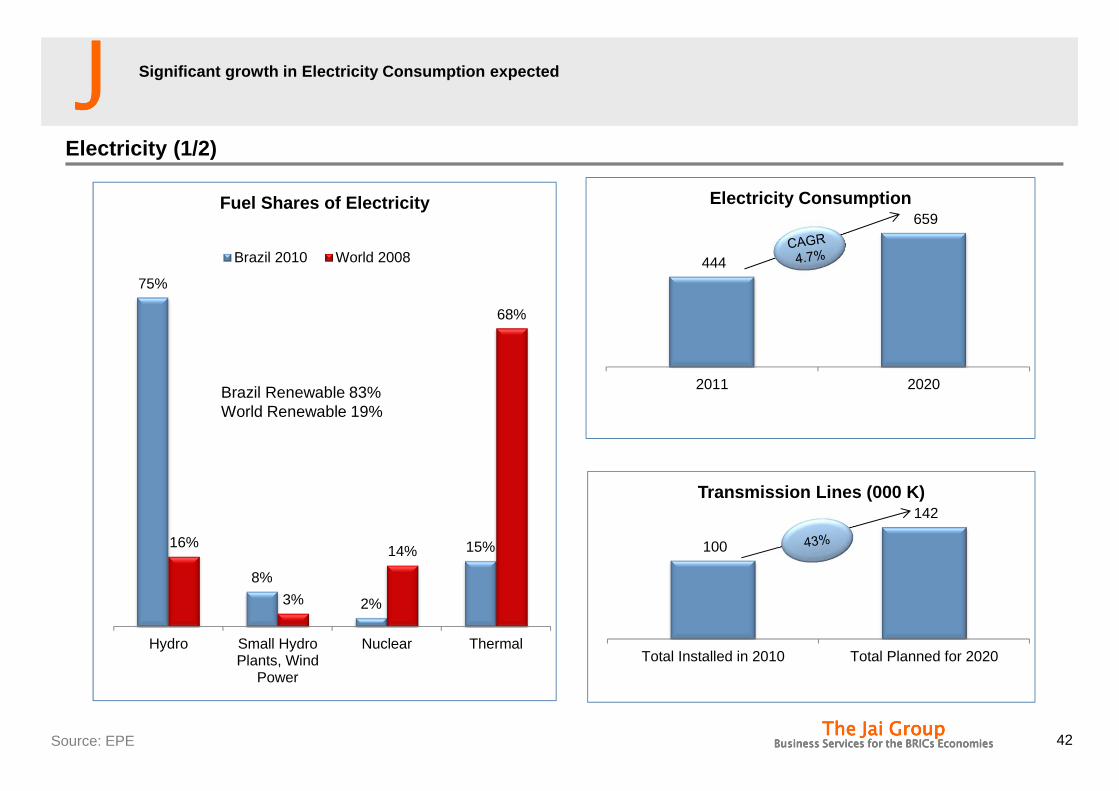
Electricity (1/2)
42Source: EPE
75%
8%
2%
15%16%
3%
14%
68%
Hydro Small HydroPlants, Wind
Power
Nuclear Thermal
Fuel Shares of Electricity
Brazil 2010 World 2008
Brazil Renewable 83%World Renewable 19%
444
659
2011 2020
Electricity Consumption
Significant growth in Electricity Consumption expec ted
100
142
Total Installed in 2010 Total Planned for 2020
Transmission Lines (000 K)

JJJJ
The Jai GroupThe Jai GroupThe Jai GroupThe Jai GroupBusiness Services for the BRICs EconomiesBusiness Services for the BRICs EconomiesBusiness Services for the BRICs EconomiesBusiness Services for the BRICs Economies
2,5
6,3
8,2
10
12,6
16
0 5 10 15 20
Tele Pires Hydro Plant
Angra 3 Nuclear Plant
Jirau Hydro Plant
Santo Antonio HydroPlant
Tapajos Hydro Plant
Belo Monte Hydro Plant
Major Power Projects in Brazil (projects in North in red)
(US$ Bn)
43Source: Ministerio de Fazenda, EPE
Electricity (2/2)
1797 20052225
890
41973881
4341
3667
611
1012
1128
1130
1601
3499
0
1000
2000
3000
4000
5000
6000
2011 2012 2013 2014 2015 2016 2017 2018 2019 2020
Hydroelectric Expansion 2011-2020: 32184 MW ( planned in red, contracted in blue)
Several billion dollar power projects in course of being completed waiting to get started, mostly in N orth of Brazil distant from the consumption centers
JJJJ
The Jai GroupThe Jai GroupThe Jai GroupThe Jai GroupBusiness Services for the BRICs EconomiesBusiness Services for the BRICs EconomiesBusiness Services for the BRICs EconomiesBusiness Services for the BRICs Economies
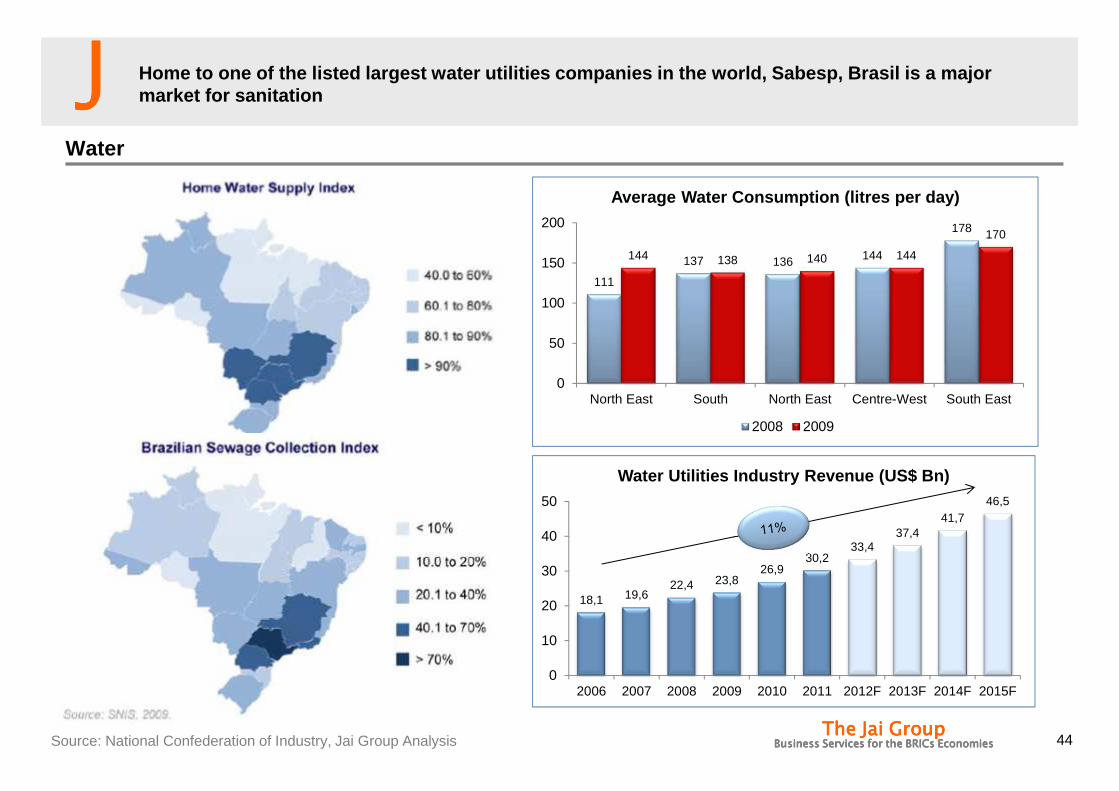
Water
44
111
137 136 144
178
144 138 140 144
170
0
50
100
150
200
North East South North East Centre-West South East
Average Water Consumption (litres per day)
2008 2009
18,1 19,622,4 23,8
26,930,2
33,437,4
41,746,5
0
10
20
30
40
50
2006 2007 2008 2009 2010 2011 2012F 2013F 2014F 2015F
Water Utilities Industry Revenue (US$ Bn)
Home to one of the listed largest water utilities c ompanies in the world, Sabesp, Brasil is a major market for sanitation
Source: National Confederation of Industry, Jai Group Analysis

JJJJ
The Jai GroupThe Jai GroupThe Jai GroupThe Jai GroupBusiness Services for the BRICs EconomiesBusiness Services for the BRICs EconomiesBusiness Services for the BRICs EconomiesBusiness Services for the BRICs Economies
Market Measurement
Industrial Water
Industrial Waste Water
Municipal Water
Municipal Waste Water
Total Market
Total Revenues 2010 2015 2010 2015 2010 2015 2010 2015 2010 2015
($ Mn) 213.4 287.8 317.4 497.3 70.4 91.7 94 167.8 695.2 1044.6
Top End - User Segments
Oil and gas, petrochemicals, mining, pulp and paper
Small and medium sized agglomerations and nutrient sensitive
areas
Degree of Competition
High High Medium Medium Medium - High
Top Market Participants
Enfil, Centroprojekt, Veolia Water Solutions and Technologies Haztec, Dedini Engineering (Paques), Siemens Water Technologies, Degremont, Tecitec, Perenne
CAGR 2010-2015 (%)
6.2% 9.4% 5.4% 12.3% 8.5%
Brazil Water and Wastewater Treatment Market
45
Equipment sale to the industry expected to be a USD 1 Bi opportunity in 2015, industrial water treatment almost ~ 80 % of total market
Source: Base year 20120, Frost and Sullivan, Jai Group Analysis
JJJJ
The Jai GroupThe Jai GroupThe Jai GroupThe Jai GroupBusiness Services for the BRICs EconomiesBusiness Services for the BRICs EconomiesBusiness Services for the BRICs EconomiesBusiness Services for the BRICs Economies
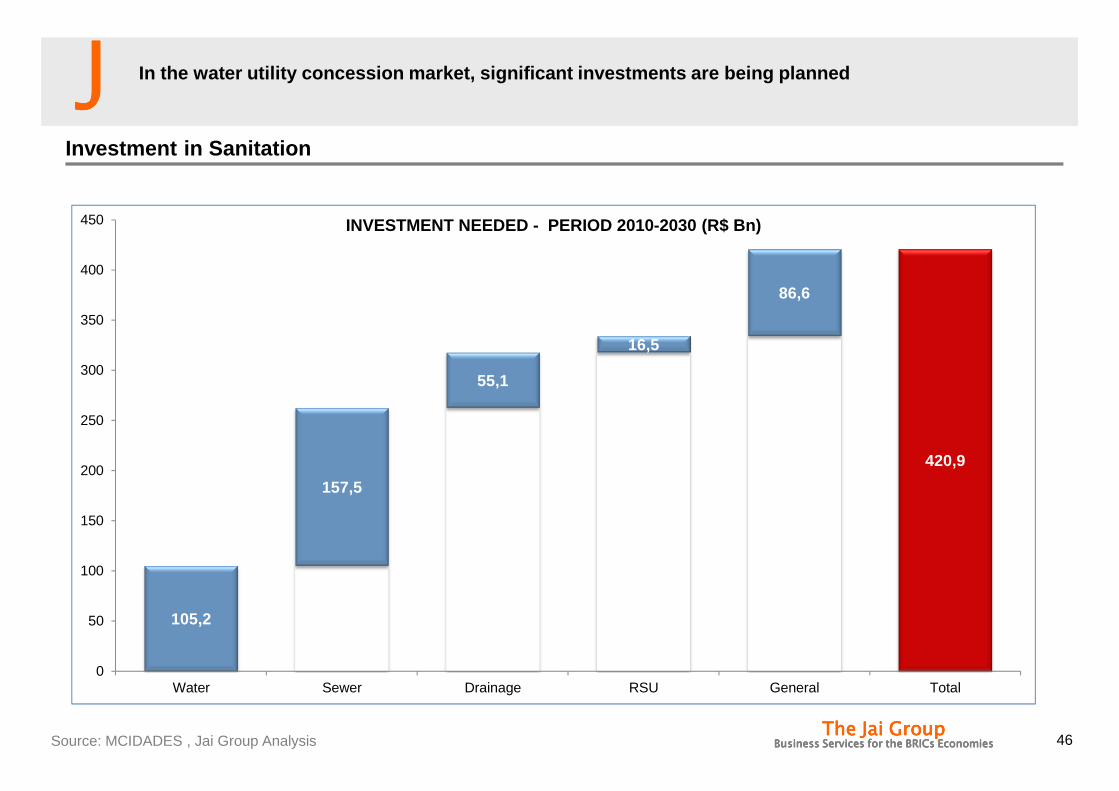
Investment in Sanitation
46
105,2
157,5
55,1
16,5
86,6
420,9
0
50
100
150
200
250
300
350
400
450
Water Sewer Drainage RSU General Total
INVESTMENT NEEDED - PERIOD 2010-2030 (R$ Bn)
In the water utility concession market, significant investments are being planned
Source: MCIDADES , Jai Group Analysis

JJJJ
The Jai GroupThe Jai GroupThe Jai GroupThe Jai GroupBusiness Services for the BRICs EconomiesBusiness Services for the BRICs EconomiesBusiness Services for the BRICs EconomiesBusiness Services for the BRICs Economies
Investment - PAC / Sanitation
Selected investments
PAC Sanitation Predicted Selected Contracted
PAC 1**2007-2010
Municipalities above50 000 inhabitants - and OGU Financing Public Sector
26 31.7 31.7
Municipalities below 50,000 inhabitants – OGU 4 4 4
Financing Private Sector 10 4.6 4.6
Total PAC 1 40 40.3 40.3
PAC 2***
Group 1 and 2 ( above 70 K and 50 K respectively in South East + South and North)
35.1 12.9 11.7
Group 3 5 4.1 2.4
Financing Private Sector 5 1.2 1.2
Total PAC 2 45.1 18.2 15.3
Total General 85.1 58.5 55.6
47PAC 1 Value of Investment, PAC 2 : Value of UnionSource: Jai Group Analysis
55 Bi reals of investment has been contracted to be executed in the next 3 years, 27 billion reals st ill to be selected

JJJJ
The Jai GroupThe Jai GroupThe Jai GroupThe Jai GroupBusiness Services for the BRICs EconomiesBusiness Services for the BRICs EconomiesBusiness Services for the BRICs EconomiesBusiness Services for the BRICs Economies
AGENDA
• The Jai Group Profile
• Brazil
• Brazilian Infrastructure
• Sectors
• Framework
• What is new ?
• Recently announced infrastructure package
• Opportunities for Indian companies
• Investment
• Product Supply
• Services Supply

JJJJ
The Jai GroupThe Jai GroupThe Jai GroupThe Jai GroupBusiness Services for the BRICs EconomiesBusiness Services for the BRICs EconomiesBusiness Services for the BRICs EconomiesBusiness Services for the BRICs Economies
Revenue Generation and Type of Contract
PPP
Law
11.079/04
Concessions8.987/959.074/95 PPP
11.079/04
and
Public Tendering Law
8.666/93
Sustainable projects
Traditional projects of public investments and public procurement
Partially sustainable projects by means of public resources
Clear laws govern the multiple types of infrastruct ure projects in Brazil
Source: Jai Group Analysis

JJJJ
The Jai GroupThe Jai GroupThe Jai GroupThe Jai GroupBusiness Services for the BRICs EconomiesBusiness Services for the BRICs EconomiesBusiness Services for the BRICs EconomiesBusiness Services for the BRICs Economies
Sources of Funding
50
DEBT:• BNDES• Multilaterals
– IFC– IDB
• Commercial Banks– BES– Caixa– Santander– WestLB– SocGen– Scotia Bank– Standard Bank
EQUITY:• Strategic Investors
– Asset Operators (airport, port, road, etc)– Shipping companies
• Infrastructure Funds
• Construction Companies– Odebrecht– Andrade Gutierrez– Camargo Correa
Funding through multiple agencies, BNDES, the loca l development bank a major source of funding
Source: Infrastructure in Brazil: A Brief Overview Fabiana Eggers HSH Nordbank AG, Jai Group Analysis

JJJJ
The Jai GroupThe Jai GroupThe Jai GroupThe Jai GroupBusiness Services for the BRICs EconomiesBusiness Services for the BRICs EconomiesBusiness Services for the BRICs EconomiesBusiness Services for the BRICs Economies
Independence of the regulatory authority
51Percentage of 25 OECD countries that replied positively to the question.Source: OECD Infrastructure Questionnaire and PMR questionnaire
The regulatory authority is independent from the
executive and has its own legal status and budget
Does the regulatory authority receive instructions from the
executive ?
Can the executive overturn the decisions of the regulatory
authority ?
Brazil OECD Brazil OECD Brazil OECD
Electricity Yes 73% No 37% No 23%
Gas Yes 73% No 30% No 20%
Telecommunications Yes 83% Yes 10% No 17%
Railways Yes 53% Yes 43% No 30%
Operation of road infrastructure Yes 29% Yes 44% No 44%
Operation of air transport infrastructure
Yes 39% Yes 48% No 44%
Operation of water transport infrastructure
Yes 37% Yes 40% No 36%
Brazilian regulatory authority is relatively indepen dent, even compared to rich country bench marks

JJJJ
The Jai GroupThe Jai GroupThe Jai GroupThe Jai GroupBusiness Services for the BRICs EconomiesBusiness Services for the BRICs EconomiesBusiness Services for the BRICs EconomiesBusiness Services for the BRICs Economies
Degree of price regulation in infrastructure indust ries
52Percentage of 25 OECD countries that replied to the questionnaire. Percentages may sum to less than 100 because of non responses. Source: OECD Infrastructure Questionnaire
Are prices regulated?
Brazil OECD1
Yes, for all prices Partially No
Electricity, consisting of: electricity generation Partially 0 20% 64%electricity transmission Yes, for all prices 0.8 12% 4%
electricity distribution and supply Yes, for all prices 0.28 68% 4%
Gas, consisting of: gas production No 0 8% 48%gas transmission Yes, for all prices 0.68 16% 4%
gas distribution and supply Yes, for all prices 0.36 56% 4%
Water collection, purification and distribution
Yes, for all prices 0.32 32% 12%
Operation of railroad infrastructure Yes, for all prices 0.32 32% 12%
Operation of road infrastructure Yes, for all prices 0.32 12% 16%
Operation of water transport infrastructure Partially 0.08 20% 44%
Operation of air transport infrastructure Yes, for all prices 0.08 52% 16%
Telecommunications, consisting of:
fixed-line network Yes, for all prices 0.12 68% 16%
fixed-line service Yes, for all prices 0 76% 20%mobile services Partially 0 64% 20%
internet services Price was never
regulated0 24% 40%
However, most concessions are subject to significan t price controls/ price regulation
JJJJ
The Jai GroupThe Jai GroupThe Jai GroupThe Jai GroupBusiness Services for the BRICs EconomiesBusiness Services for the BRICs EconomiesBusiness Services for the BRICs EconomiesBusiness Services for the BRICs Economies
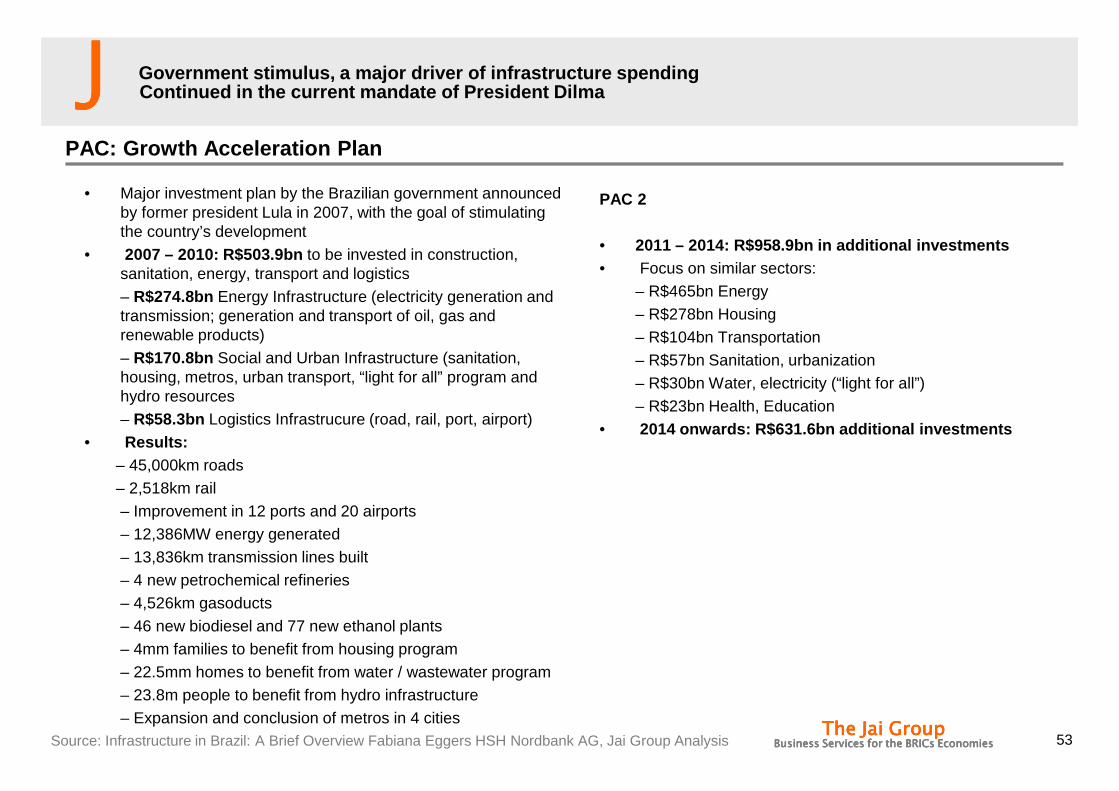
PAC: Growth Acceleration Plan
• Major investment plan by the Brazilian government announced by former president Lula in 2007, with the goal of stimulating the country’s development
• 2007 – 2010: R$503.9bn to be invested in construction, sanitation, energy, transport and logistics– R$274.8bn Energy Infrastructure (electricity generation and transmission; generation and transport of oil, gas and renewable products)– R$170.8bn Social and Urban Infrastructure (sanitation, housing, metros, urban transport, “light for all” program and hydro resources– R$58.3bn Logistics Infrastrucure (road, rail, port, airport)
• Results:– 45,000km roads– 2,518km rail– Improvement in 12 ports and 20 airports– 12,386MW energy generated– 13,836km transmission lines built– 4 new petrochemical refineries– 4,526km gasoducts– 46 new biodiesel and 77 new ethanol plants– 4mm families to benefit from housing program– 22.5mm homes to benefit from water / wastewater program– 23.8m people to benefit from hydro infrastructure– Expansion and conclusion of metros in 4 cities
53
Government stimulus, a major driver of infrastructu re spendingContinued in the current mandate of President Dilma
PAC 2
• 2011 – 2014: R$958.9bn in additional investments• Focus on similar sectors:
– R$465bn Energy– R$278bn Housing– R$104bn Transportation– R$57bn Sanitation, urbanization– R$30bn Water, electricity (“light for all”)– R$23bn Health, Education
• 2014 onwards: R$631.6bn additional investments
Source: Infrastructure in Brazil: A Brief Overview Fabiana Eggers HSH Nordbank AG, Jai Group Analysis
JJJJ
The Jai GroupThe Jai GroupThe Jai GroupThe Jai GroupBusiness Services for the BRICs EconomiesBusiness Services for the BRICs EconomiesBusiness Services for the BRICs EconomiesBusiness Services for the BRICs Economies
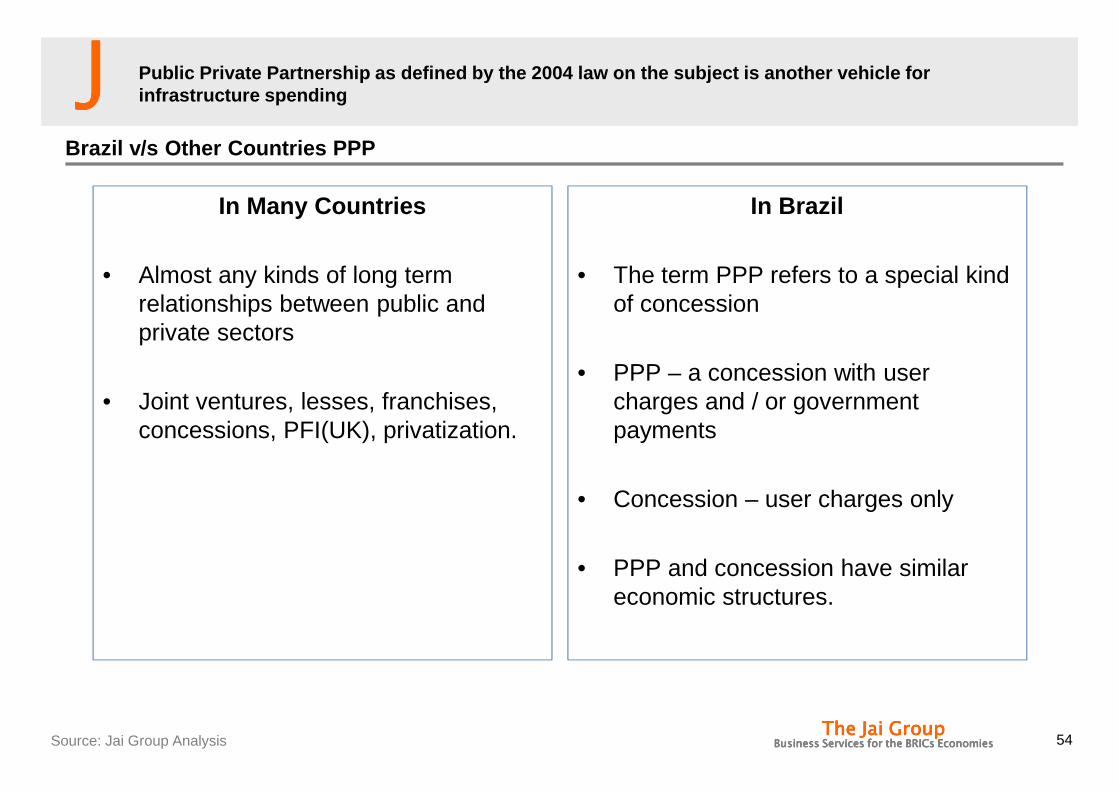
Brazil v/s Other Countries PPP
In Many Countries
• Almost any kinds of long term relationships between public and private sectors
• Joint ventures, lesses, franchises, concessions, PFI(UK), privatization.
In Brazil
• The term PPP refers to a special kind of concession
• PPP – a concession with user charges and / or government payments
• Concession – user charges only
• PPP and concession have similar economic structures.
54
Public Private Partnership as defined by the 2004 l aw on the subject is another vehicle for infrastructure spending
Source: Jai Group Analysis

JJJJ
The Jai GroupThe Jai GroupThe Jai GroupThe Jai GroupBusiness Services for the BRICs EconomiesBusiness Services for the BRICs EconomiesBusiness Services for the BRICs EconomiesBusiness Services for the BRICs Economies
Overview of PPPs
Types of PPPs
• Established general norms for PPP, tenders and contracts within Federal Government, States and Municipalities
• PPP is a concession contract
• Sponsored Concession : User Charges + Direct payment from the public sector• Eg: road, railways, ports,
sanitation
• Administrative Concession : Direct payment from the public sector only (no possibility for user charges)• Eg :prisons
Restrictions
• Contractors design (green-field), build finance operate, maintain and transfer (new bidding is required at the end of the contract term if no renewal is possible.
• Long term contracts (5 to 35 years)
• Only large contracts (over BRL 20 Mn, US$ 11.4 Mn)
• Possibility of complementing user charges with government payments
• Government payments are due as service is delivered and based on performance indicators (output – based contracts)
• Government payments guaranteed by the PPP Guarantee Fund – FGP (to mitigate Government default risk)
Structure and Management
• FGP was established as a Trust Fund of public assets
• Trustee : Banco do Brasil(Federal Government owned Bank)
• For each PPP contract the FGP issues a guarantee letter
• In case of default the FGP covers payment 45 days after it is due, or after 90 days if the public authority does not recognize the debt without a formal justification.
• FGP is a private legal entity and its assets are separated from those of the Federal Government.
Financial Aspects
• Maximum of BRL 6 Bn (US $ 3.4 Bn) in assets (legal limit)
• Assets eligible to be used :• Cash• Public Bonds• Real Estates • Stocks
• Nowadays, the Federal government has around US $ 360 Mn in assets committed with FGP.
• No leverage is allowed (NPV of FGP guarantees must equal the NPV of its assets)
• The guarantee is provided free of charge to the private partner.
• All FGP costs are paid by the Federal government.
55
Detailed description of PPP contract structures
Source: Jai Group Analysis
JJJJ
The Jai GroupThe Jai GroupThe Jai GroupThe Jai GroupBusiness Services for the BRICs EconomiesBusiness Services for the BRICs EconomiesBusiness Services for the BRICs EconomiesBusiness Services for the BRICs Economies
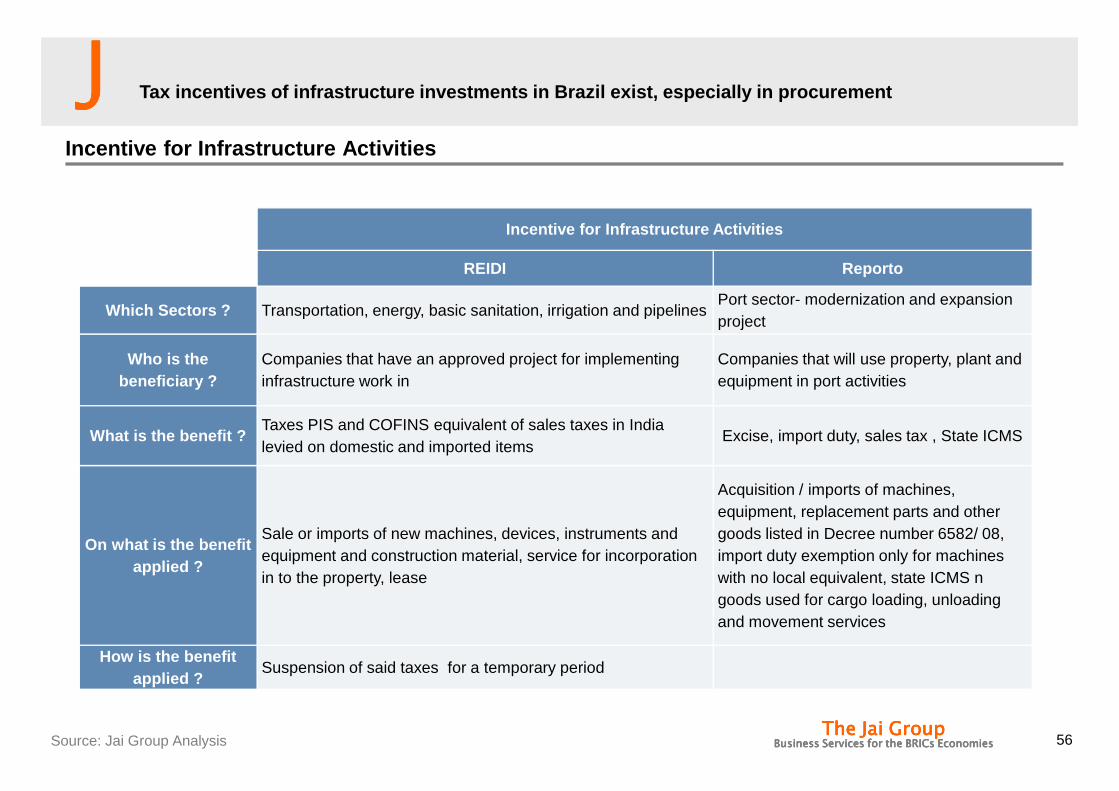
Incentive for Infrastructure Activities
56
Incentive for Infrastructure Activities
REIDI Reporto
Which Sectors ? Transportation, energy, basic sanitation, irrigation and pipelinesPort sector- modernization and expansion project
Who is the beneficiary ?
Companies that have an approved project for implementing infrastructure work in
Companies that will use property, plant and equipment in port activities
What is the benefit ?Taxes PIS and COFINS equivalent of sales taxes in India levied on domestic and imported items
Excise, import duty, sales tax , State ICMS
On what is the benefit applied ?
Sale or imports of new machines, devices, instruments and equipment and construction material, service for incorporation in to the property, lease
Acquisition / imports of machines, equipment, replacement parts and other goods listed in Decree number 6582/ 08, import duty exemption only for machines with no local equivalent, state ICMS n goods used for cargo loading, unloading and movement services
How is the benefit applied ?
Suspension of said taxes for a temporary period
Tax incentives of infrastructure investments in Bra zil exist, especially in procurement
Source: Jai Group Analysis

JJJJ
The Jai GroupThe Jai GroupThe Jai GroupThe Jai GroupBusiness Services for the BRICs EconomiesBusiness Services for the BRICs EconomiesBusiness Services for the BRICs EconomiesBusiness Services for the BRICs Economies
Key Players in Brazil
Engages in the construction and assembly of energy and telecommunications systems and it is also one of the largest investors in the power sector in Brazil. Over the past few years the company has been diversifying its activities and also developing large projects in the oil & gas and infrastructure areas.
Operates in the engineering and construction, telecommunications, power, and public concessions. The Heavy Construction segment engages in the construction of hydroelectric power stations, thermoelectric power stations, petrochemical units and refineries, roads, airports, tunnels, viaducts, ports, etc.
Engages in the engineering and construction, environment, and concessions activities. The company is involved in infrastructure projects, provision of engineering and design services, and construction of ships and offshore platforms.
Engages in construction, public utilities concessions, oil and gas, steel, and environmental engineering. Its construction services include infrastructure projects, hydroelectric plants, sewage systems, water resources, oil and gas exploration, highways, railroads, airports, metro-rail transit systems, ports, and environmental engineering services
Engages in the generation, transmission, and distribution of electric energy in Brazil. The company constructs and operates nuclear power plants and transmission lines
Provides integrated energy solutions for hydropower and wind energy projects. IMPSA Hydro division engages in the development, design, and manufacturing of turbines, hydro mechanical generators, hydraulic gates, and valves. The company’s Wind division offers design services and construction capacity for wind turbines and generators. Its IMPSA Energy division provides project finance to develop, design, build, and operate hydroelectric and wind generation projects
Provides integrated engineering, procurement, construction, installation, and management services for civil and industrial construction, and specialized technology projects. The company invests in projects in various sectors, including energy, industrial plants (petrochemicals and ethanol), infrastructure, and public services concessions.
57
Several local companies exist in construction and e ngineering arena in Brazil
Source: Jai Group Analysis

JJJJ
The Jai GroupThe Jai GroupThe Jai GroupThe Jai GroupBusiness Services for the BRICs EconomiesBusiness Services for the BRICs EconomiesBusiness Services for the BRICs EconomiesBusiness Services for the BRICs Economies
AGENDA
• The Jai Group Profile
• Brazil
• Brazilian Infrastructure
• Sectors
• Framework
• What is new ?
• Recently announced infrastructure package
• Opportunities for Indian companies
• Investment
• Product Supply
• Services Supply

JJJJ
The Jai GroupThe Jai GroupThe Jai GroupThe Jai GroupBusiness Services for the BRICs EconomiesBusiness Services for the BRICs EconomiesBusiness Services for the BRICs EconomiesBusiness Services for the BRICs Economies
Programme on Road and Rail Concessions
59
What is being proposed ?
Grant concessions to private-sector investors for 7,500 kilometers of roads
Grant concessions to private-sector investors 10,000 kilometers of railways.
Total amount of these concessions is to reach 133 billion reais, with 60% of that amount disbursed over the next five years and the rest within 20 to 25 years.
Bidding and operational
model
In the road concession model, the criterion for selecting companies will be the lowest toll. Toll payments may begin to be charged once 10% of the roadwork has been completed.
In the case of railways, the public-private partnership (PPP) model states that the construction, maintenance and operation of railways are the responsibility of the private-sector partner(s). Through VALEC, the government will purchase the railway’s total transportation capacity and sell transportation rights in the rail system, to users wishing to ship their own cargo, to independent rail operators and to rail transportation concessionaires.
Thus, programs providing incentives for investment, particularly investment from the private sector, are likely to contribute positively to the long-term growth of the Brazilian economy. In order to integrate the investment plans for roads, railways, ports, etc., the government has created an entity called the Planning and Logistics Company (EPL in its Portuguese acronym).
Financing Model
The financing conditions for road concessions are: interest rate (TJLP) + up to 1.5%, a grace period of three years and amortization in up to 20 years.
The financing conditions for rail investments are: interest rate (TJLP) + up to 1.0%, a grace period of five years and amortization in up to 25 years.
According to the government, the state development bank (BNDES) will play a very active role in the projects’ financial engineering.
New credit line has been announced for concessions for private sector, Government will be allowing private sector to lead these investments
Source: Jai Group Analysis

JJJJ
The Jai GroupThe Jai GroupThe Jai GroupThe Jai GroupBusiness Services for the BRICs EconomiesBusiness Services for the BRICs EconomiesBusiness Services for the BRICs EconomiesBusiness Services for the BRICs Economies
New Investments in Highways
60
Highways
Highways covered link the Agriculturally strong cen ter west with south-Eastern Atlantic coast ports
Source: Jai Group Analysis

JJJJ
The Jai GroupThe Jai GroupThe Jai GroupThe Jai GroupBusiness Services for the BRICs EconomiesBusiness Services for the BRICs EconomiesBusiness Services for the BRICs EconomiesBusiness Services for the BRICs Economies
New Investments in Railroads
61
Railroads
New railroads planned are contemplating a north sou th corridor along the coast and inter connectivity to the North South corridor that is currently being executed under Government money
Source: Jai Group Analysis

JJJJ
The Jai GroupThe Jai GroupThe Jai GroupThe Jai GroupBusiness Services for the BRICs EconomiesBusiness Services for the BRICs EconomiesBusiness Services for the BRICs EconomiesBusiness Services for the BRICs Economies
AGENDA
• The Jai Group Profile
• Brazil
• Brazilian Infrastructure
• Sectors
• Framework
• What is new ?
• Recently announced infrastructure package
• Opportunities for Indian companies
• Investment
• Product Supply
• Services Supply
JJJJ
The Jai GroupThe Jai GroupThe Jai GroupThe Jai GroupBusiness Services for the BRICs EconomiesBusiness Services for the BRICs EconomiesBusiness Services for the BRICs EconomiesBusiness Services for the BRICs Economies
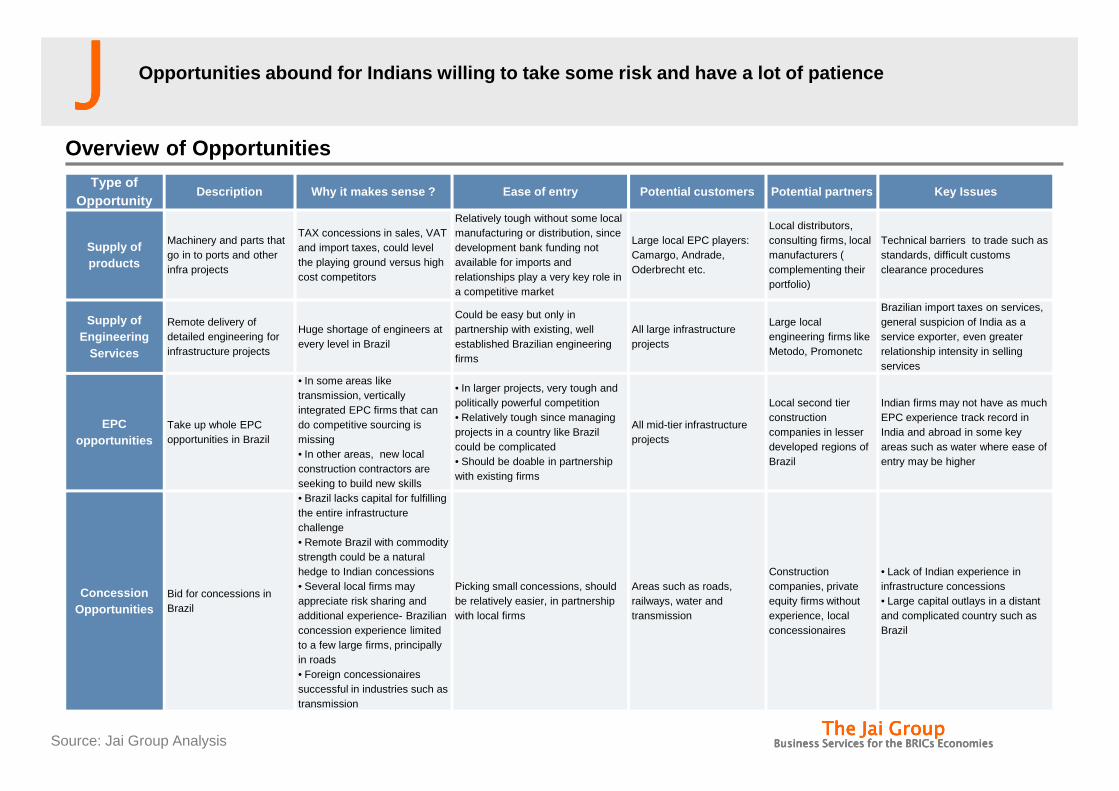
Type of Opportunity
Description Why it makes sense ? Ease of entry Potenti al customers Potential partners Key Issues
Supply of products
Machinery and parts that go in to ports and other infra projects
TAX concessions in sales, VAT and import taxes, could level the playing ground versus high cost competitors
Relatively tough without some local manufacturing or distribution, since development bank funding not available for imports and relationships play a very key role in a competitive market
Large local EPC players: Camargo, Andrade, Oderbrecht etc.
Local distributors, consulting firms, local manufacturers ( complementing their portfolio)
Technical barriers to trade such as standards, difficult customs clearance procedures
Supply of Engineering
Services
Remote delivery of detailed engineering for infrastructure projects
Huge shortage of engineers at every level in Brazil
Could be easy but only in partnership with existing, well established Brazilian engineering firms
All large infrastructure projects
Large local engineering firms like Metodo, Promonetc
Brazilian import taxes on services, general suspicion of India as a service exporter, even greater relationship intensity in selling services
EPC opportunities
Take up whole EPC opportunities in Brazil
• In some areas like transmission, vertically integrated EPC firms that can do competitive sourcing is missing• In other areas, new local construction contractors are seeking to build new skills
• In larger projects, very tough and politically powerful competition• Relatively tough since managing projects in a country like Brazil could be complicated• Should be doable in partnership with existing firms
All mid-tier infrastructure projects
Local second tier construction companies in lesser developed regions of Brazil
Indian firms may not have as much EPC experience track record in India and abroad in some key areas such as water where ease of entry may be higher
Concession Opportunities
Bid for concessions in Brazil
• Brazil lacks capital for fulfilling the entire infrastructure challenge• Remote Brazil with commodity strength could be a natural hedge to Indian concessions• Several local firms may appreciate risk sharing and additional experience- Brazilian concession experience limited to a few large firms, principally in roads• Foreign concessionaires successful in industries such as transmission
Picking small concessions, should be relatively easier, in partnership with local firms
Areas such as roads, railways, water and transmission
Construction companies, private equity firms without experience, local concessionaires
• Lack of Indian experience in infrastructure concessions• Large capital outlays in a distant and complicated country such as Brazil
Overview of Opportunities
Opportunities abound for Indians willing to take so me risk and have a lot of patience
Source: Jai Group Analysis

JJJJ
The Jai GroupThe Jai GroupThe Jai GroupThe Jai GroupBusiness Services for the BRICs EconomiesBusiness Services for the BRICs EconomiesBusiness Services for the BRICs EconomiesBusiness Services for the BRICs Economies
Jai Group – Contact Details
Please feel free to contact us at our India or Braz il office as below :
• Mr Prashanth Nayak (Pune, India)– Email – [email protected]– Ph – +91 20 66458901– Cell – +91 9822036738
• Mr Rakesh Vaidyanathan (Sao Paulo, Brazil)– Email – [email protected]– Ph: +55 11 3254 3524– Cell: +55 11 9 8339 5983
64