Embed Size (px)
Citation preview
Initial Cost and Performance Results from the Greenidge
Multi-Pollutant Control ProjectDaniel P. Connell
CONSOL Energy Inc. Research & Development
Douglas J. Roll, P.E., and William B. RadyAES Greenidge LLC
Richard F. AbramsBabcock Power Environmental Inc.
Wolfe P. Huber, P.E.U.S. Department of Energy, National Energy Technology Laboratory
Chicago, IL May 3, 2007
Greenidge Multi-Pollutant Control Project
• Part of U.S. DOE’s Power Plant Improvement Initiative
• Participants– CONSOL Energy Inc. (administration, testing, reporting)– AES Greenidge LLC (host site, operations)– Babcock Power Environmental Inc. (EPC contractor)
• Funding– U.S. Department of Energy, National Energy Technology Laboratory– AES Greenidge LLC
• Goal: Demonstrate a multi-pollutant control system that can cost-effectively reduce emissions of NOx, SO2, mercury, acid gases (SO3, HCl, HF), and particulate matter from smaller coal-fired power plants
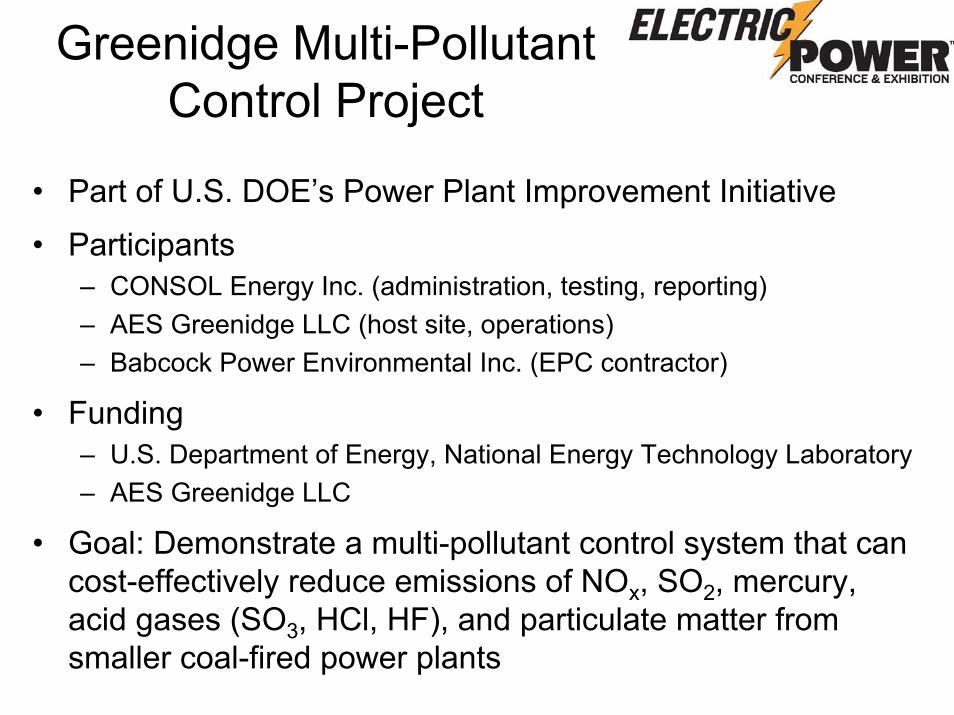
Existing Coal-Fired EGUs50-300 MWe
• ~ 440 units not equipped with FGD, SCR, or Hg control– Represent ~ 60 GW of installed capacity
– Greater than 80% are located east of the Mississippi River
– Most have not announced plans to retrofit
• Increasingly vulnerable to retirement or fuel switching because of progressively more stringent environmental regulations– CAIR, CAMR, CAVR, state regulations
• Difficult to retrofit for deep emission reductions– Large capital costs
– Space limitations
• Need to commercialize technologies designed to meet the environmental compliance requirements of these units
Existing Coal-Fired EGUs50-300 MWe
AES Greenidge Unit 4 (Boiler 6)
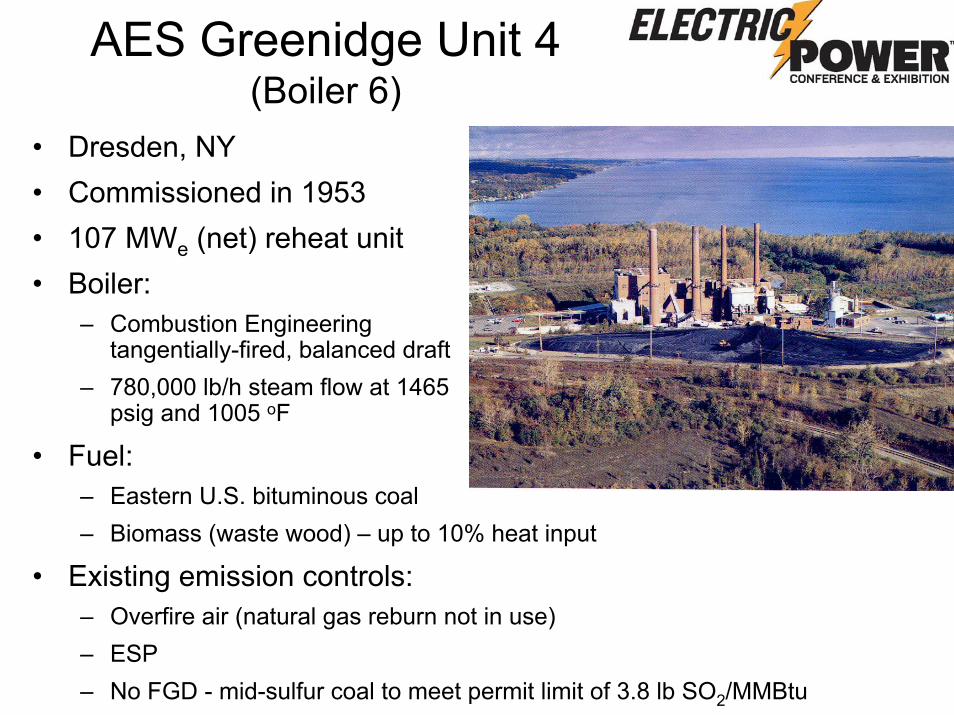
• Dresden, NY• Commissioned in 1953• 107 MWe (net) reheat unit• Boiler:
– Combustion Engineeringtangentially-fired, balanced draft
– 780,000 lb/h steam flow at 1465psig and 1005 oF
• Fuel:– Eastern U.S. bituminous coal– Biomass (waste wood) – up to 10% heat input
• Existing emission controls:– Overfire air (natural gas reburn not in use)– ESP– No FGD - mid-sulfur coal to meet permit limit of 3.8 lb SO2/MMBtu
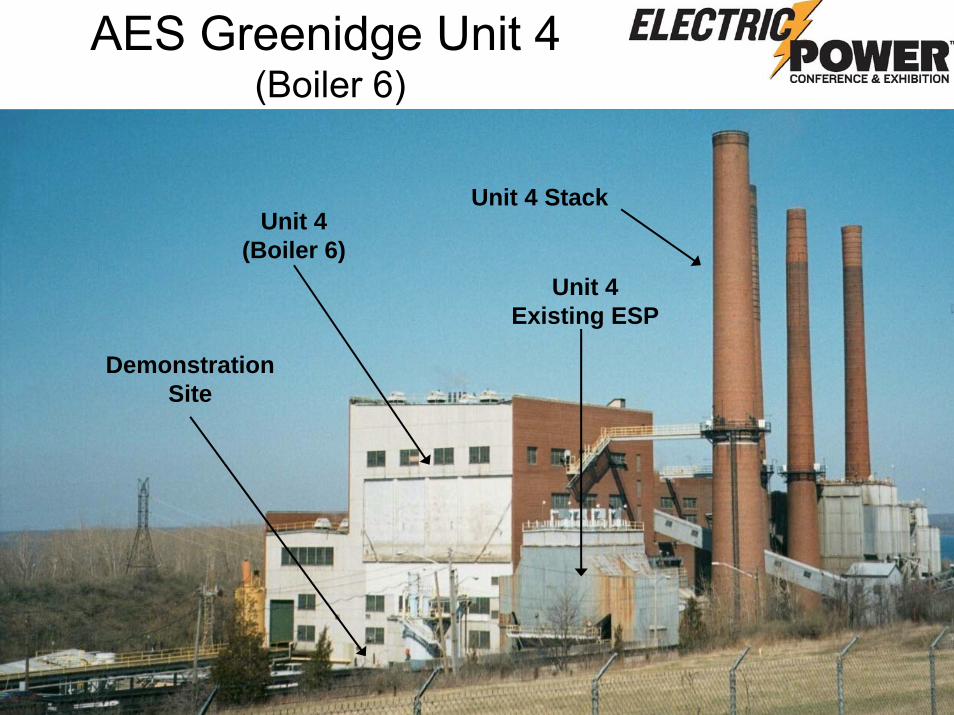
Unit 4 Stack
Unit 4Existing ESP
Unit 4 (Boiler 6)
Demonstration Site
AES Greenidge Unit 4(Boiler 6)
Multi-Pollutant Control Process
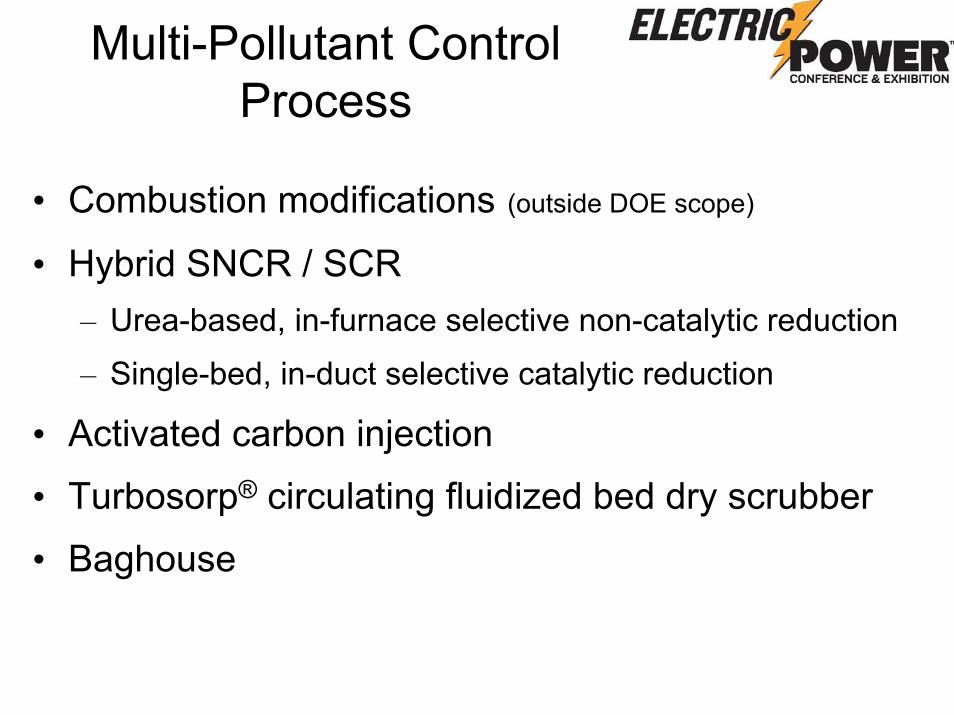
• Combustion modifications (outside DOE scope)
• Hybrid SNCR / SCR– Urea-based, in-furnace selective non-catalytic reduction
– Single-bed, in-duct selective catalytic reduction
• Activated carbon injection
• Turbosorp® circulating fluidized bed dry scrubber
• Baghouse
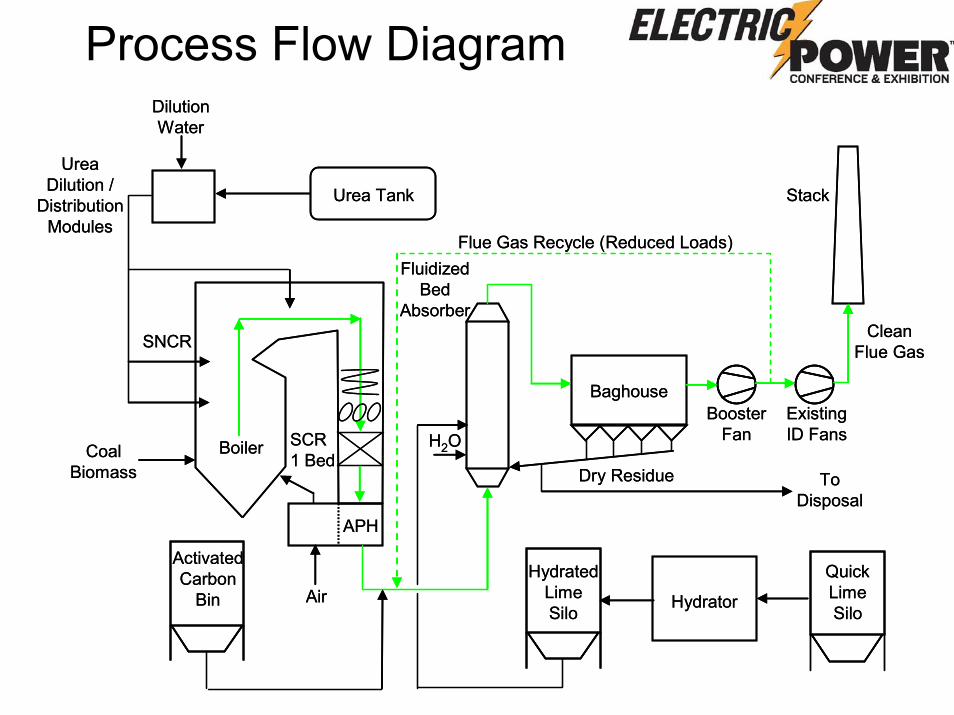
Process Flow Diagram
Clean Flue Gas
FluidizedBed
Absorber
Urea Dilution /
Distribution Modules
APH
Boiler
Urea Tank
Baghouse
Quick Lime Silo
Hydrated LimeSilo Hydrator
ActivatedCarbon
Bin
H2O
Stack
Dry Residue
SCR1 Bed
SNCR
Air
DilutionWater
To Disposal
Flue Gas Recycle (Reduced Loads)
Booster Fan
Existing ID Fans
Coal Biomass

Single-Bed SCR
Reactor Cross Section: 45’ x 14’
Bed Depth: 1330 mm
• Fed by NH3 slip from SNCR
• NOx Reduction: ≥ 30%
• SO2 → SO3: ≤ 1.0%
• NH3 slip from SCR: ≤ 2 ppmv
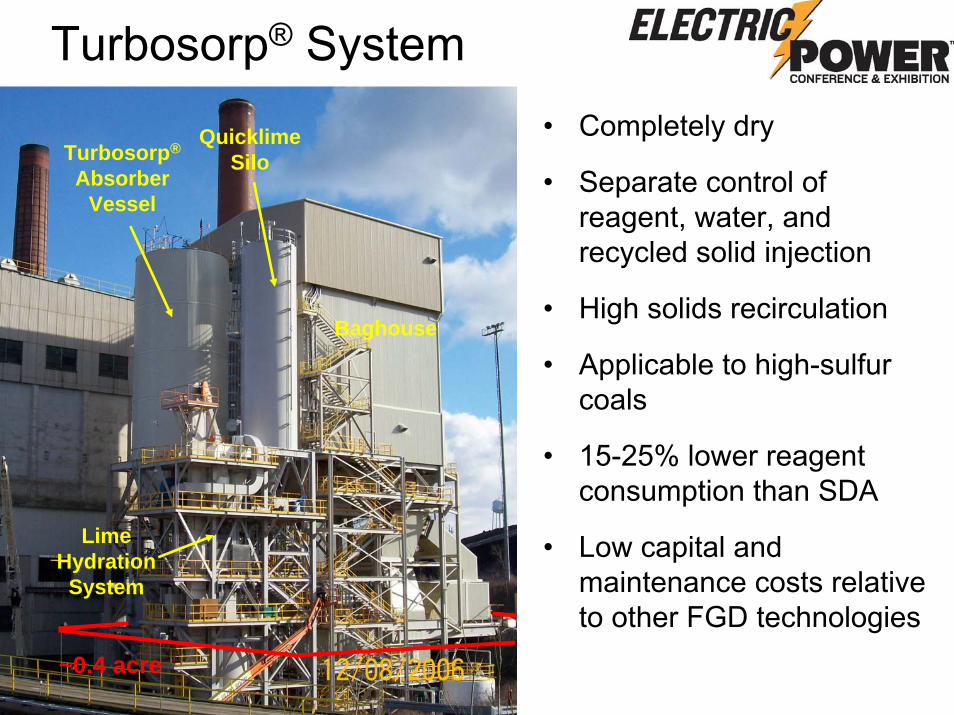
Turbosorp® System
Turbosorp®
Absorber Vessel
Baghouse
Lime Hydration
System
Quicklime Silo
~0.4 acre
• Completely dry
• Separate control of reagent, water, and recycled solid injection
• High solids recirculation
• Applicable to high-sulfur coals
• 15-25% lower reagent consumption than SDA
• Low capital and maintenance costs relative to other FGD technologies
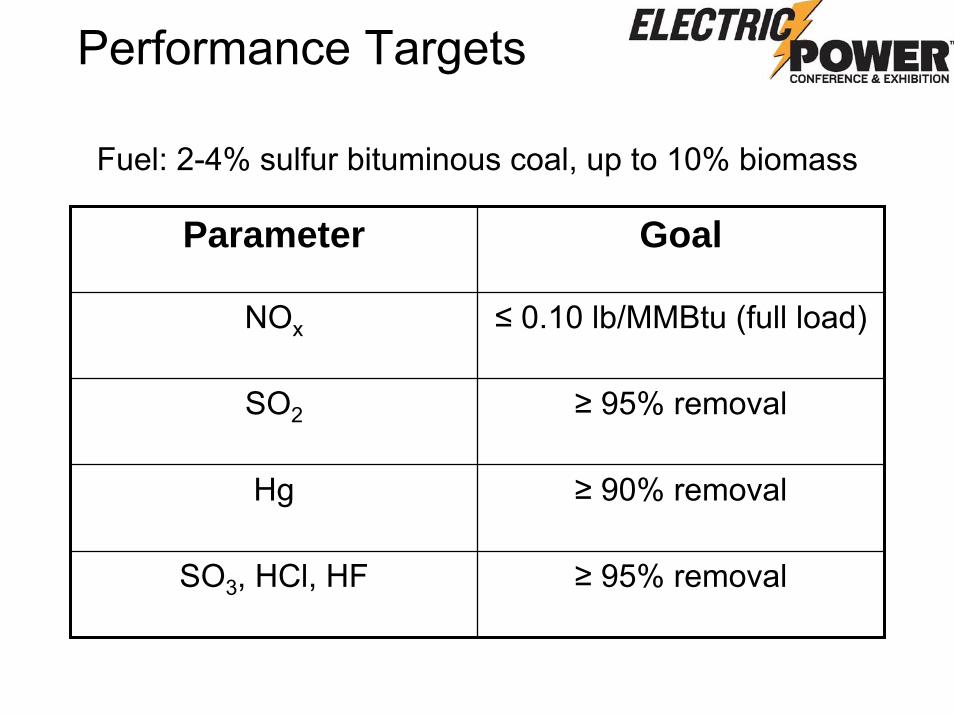
Performance Targets
Parameter Goal
NOx ≤ 0.10 lb/MMBtu (full load)
SO2 ≥ 95% removal
Hg ≥ 90% removal
SO3, HCl, HF ≥ 95% removal
Fuel: 2-4% sulfur bituminous coal, up to 10% biomass
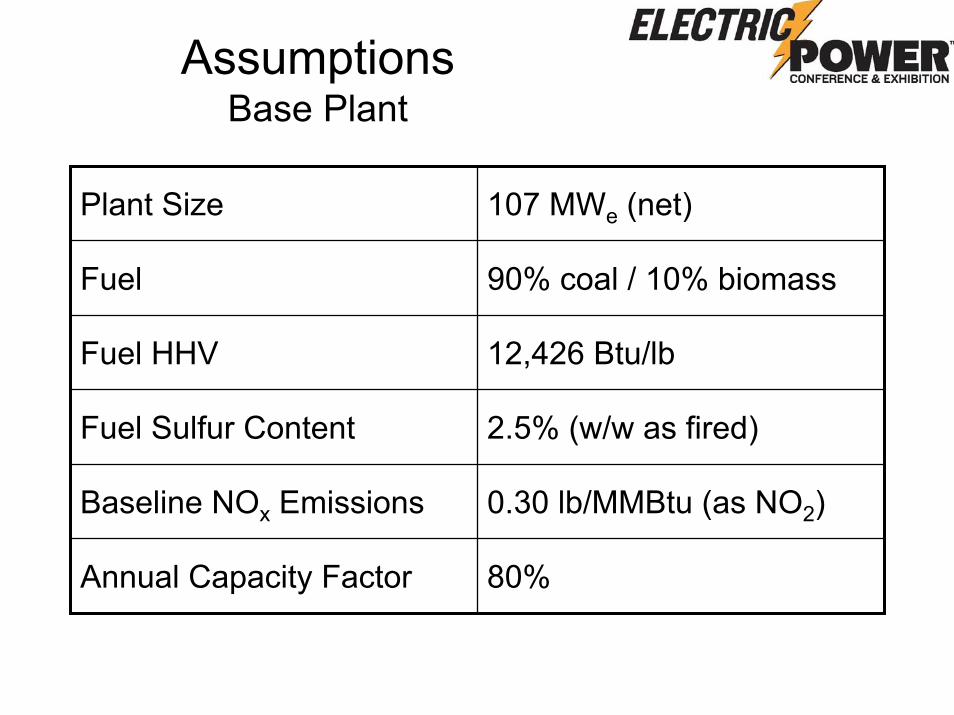
AssumptionsBase Plant
Plant Size 107 MWe (net)
Fuel 90% coal / 10% biomass
Fuel HHV 12,426 Btu/lb
Fuel Sulfur Content 2.5% (w/w as fired)
Baseline NOx Emissions 0.30 lb/MMBtu (as NO2)
Annual Capacity Factor 80%
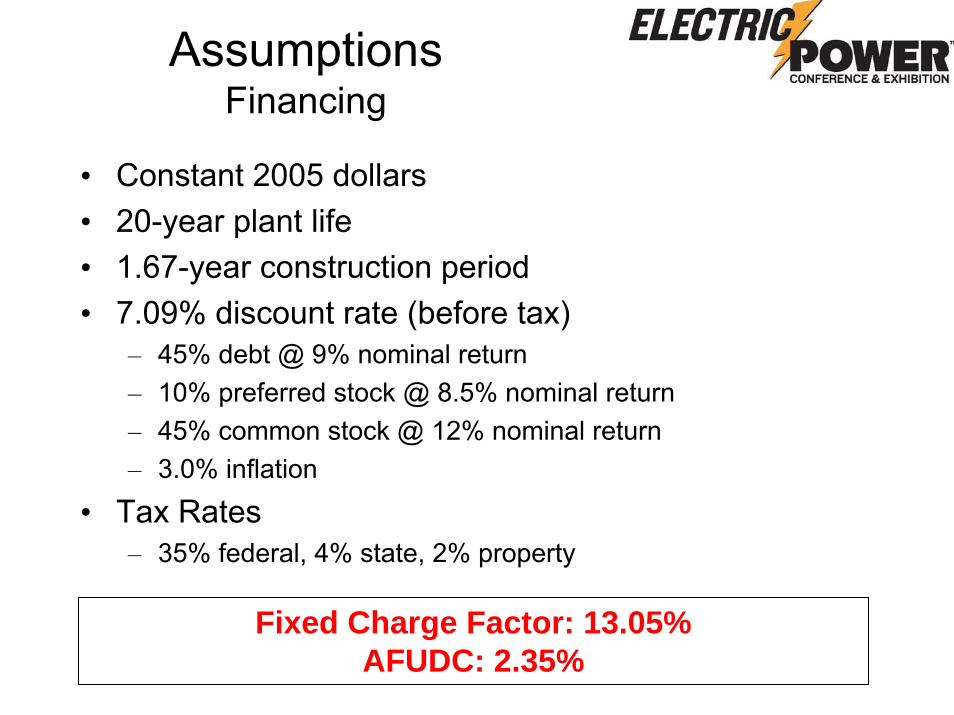
AssumptionsFinancing
• Constant 2005 dollars• 20-year plant life• 1.67-year construction period• 7.09% discount rate (before tax)
– 45% debt @ 9% nominal return– 10% preferred stock @ 8.5% nominal return– 45% common stock @ 12% nominal return– 3.0% inflation
• Tax Rates– 35% federal, 4% state, 2% property
Fixed Charge Factor: 13.05%AFUDC: 2.35%
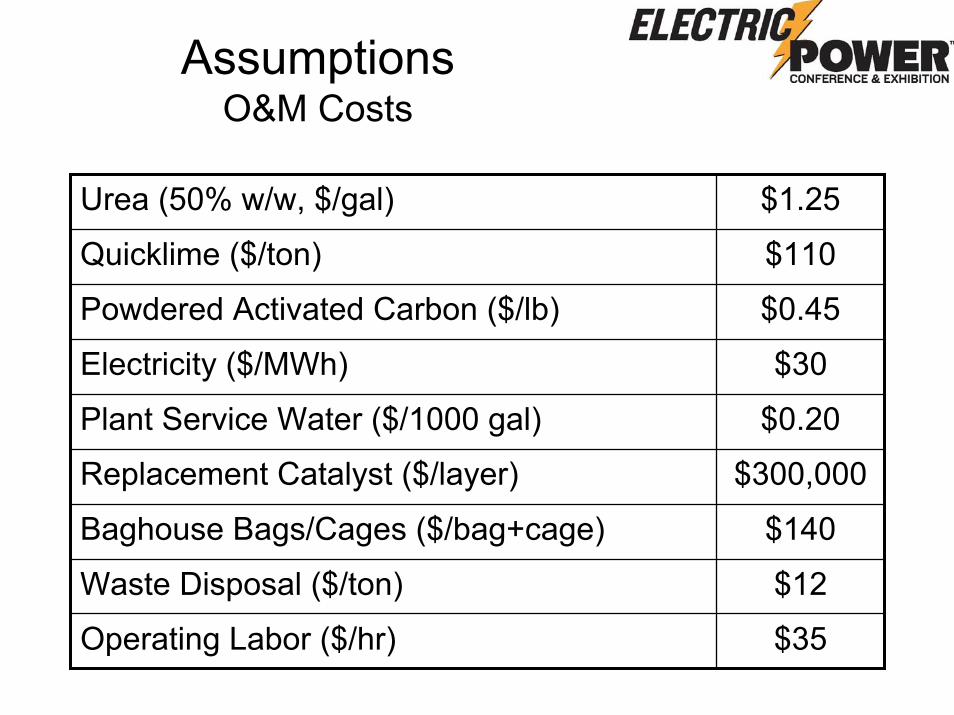
AssumptionsO&M Costs
Urea (50% w/w, $/gal) $1.25
Quicklime ($/ton) $110
Powdered Activated Carbon ($/lb) $0.45
Electricity ($/MWh) $30
Plant Service Water ($/1000 gal) $0.20
Replacement Catalyst ($/layer) $300,000
Baghouse Bags/Cages ($/bag+cage) $140
Waste Disposal ($/ton) $12
Operating Labor ($/hr) $35
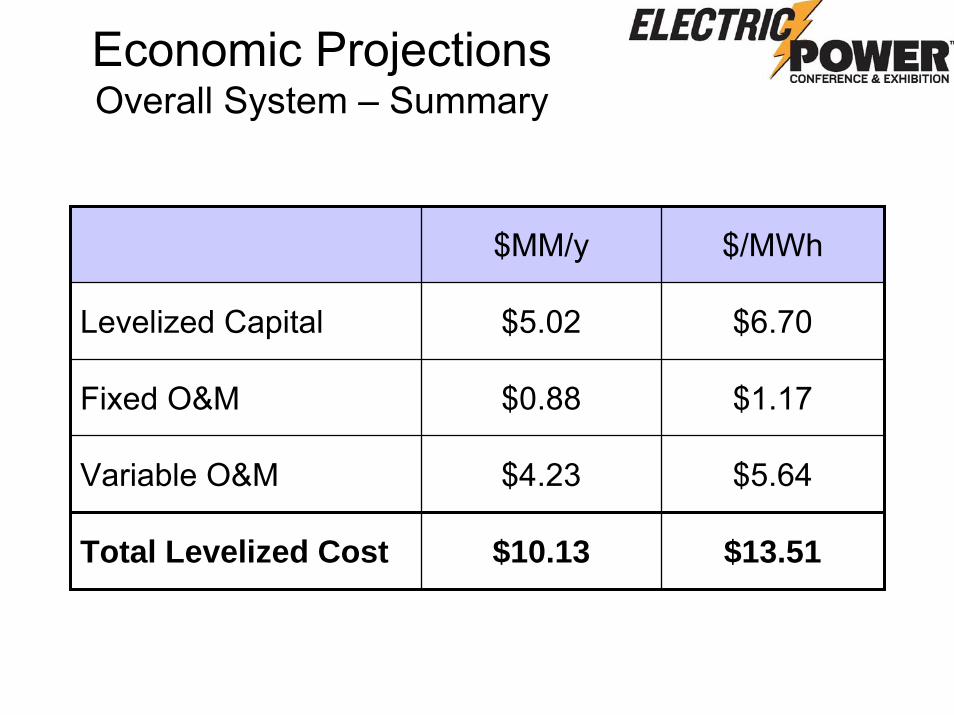
Economic ProjectionsOverall System – Summary
$MM/y $/MWh
Levelized Capital $5.02 $6.70
Fixed O&M $0.88 $1.17
Variable O&M $4.23 $5.64
Total Levelized Cost $10.13 $13.51
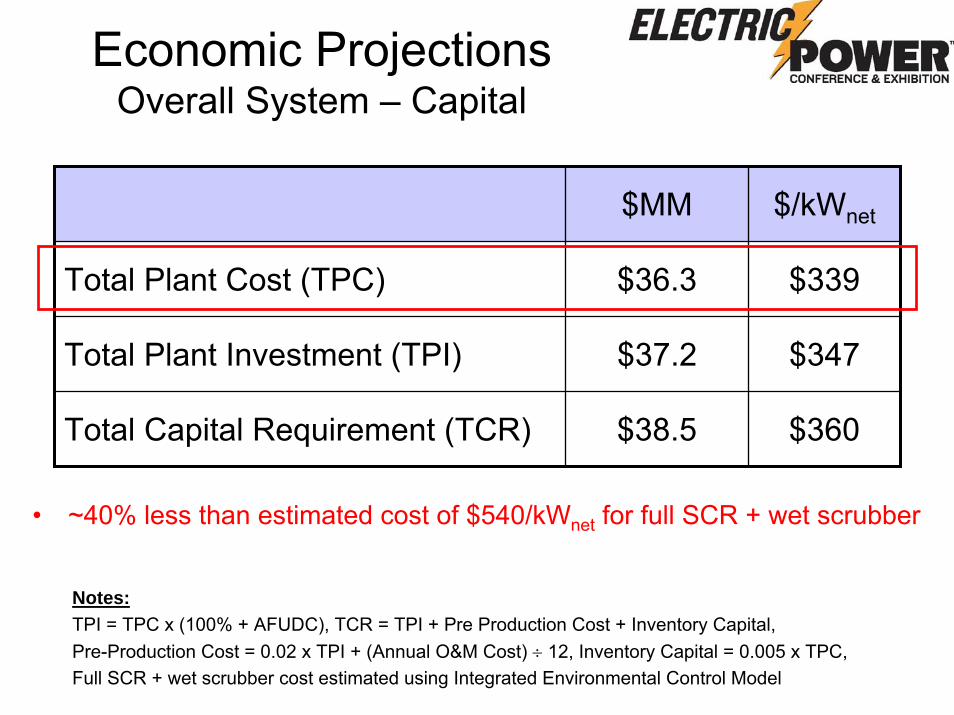
Economic ProjectionsOverall System – Capital
$MM $/kWnet
Total Plant Cost (TPC) $36.3 $339
Total Plant Investment (TPI) $37.2 $347
Total Capital Requirement (TCR) $38.5 $360
Notes:TPI = TPC x (100% + AFUDC), TCR = TPI + Pre Production Cost + Inventory Capital, Pre-Production Cost = 0.02 x TPI + (Annual O&M Cost) ÷ 12, Inventory Capital = 0.005 x TPC,Full SCR + wet scrubber cost estimated using Integrated Environmental Control Model
• ~40% less than estimated cost of $540/kWnet for full SCR + wet scrubber
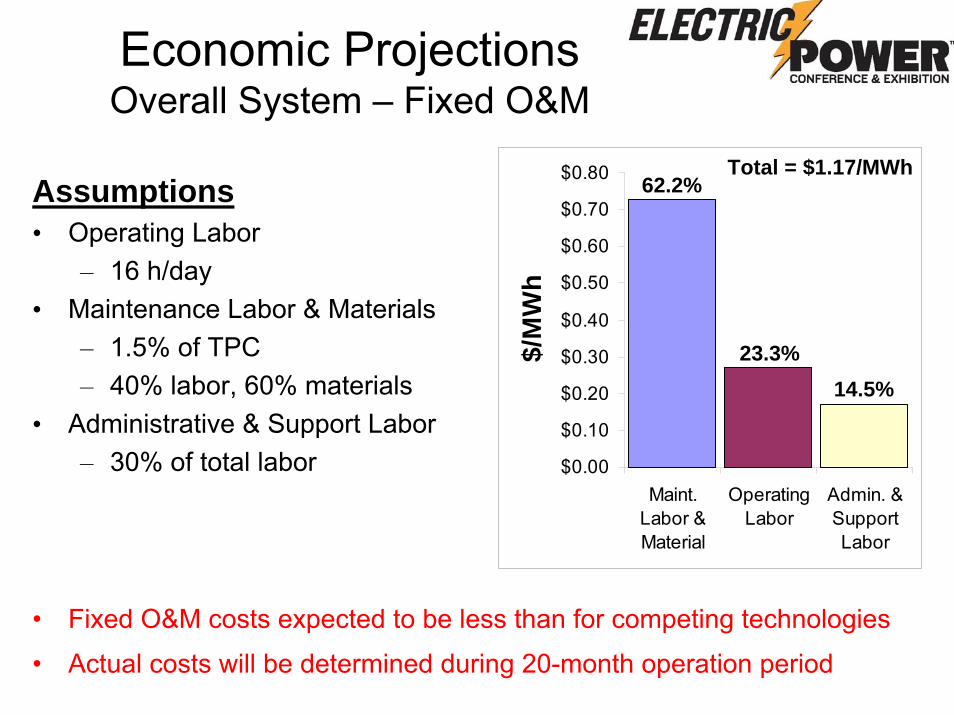
Economic ProjectionsOverall System – Fixed O&M
Assumptions• Operating Labor
– 16 h/day• Maintenance Labor & Materials
– 1.5% of TPC– 40% labor, 60% materials
• Administrative & Support Labor– 30% of total labor $0.00
$0.10
$0.20
$0.30
$0.40
$0.50
$0.60
$0.70
$0.80
Maint.Labor &Material
OperatingLabor
Admin. &SupportLabor
$/M
Wh
62.2%
23.3%14.5%
Total = $1.17/MWh
• Fixed O&M costs expected to be less than for competing technologies
• Actual costs will be determined during 20-month operation period
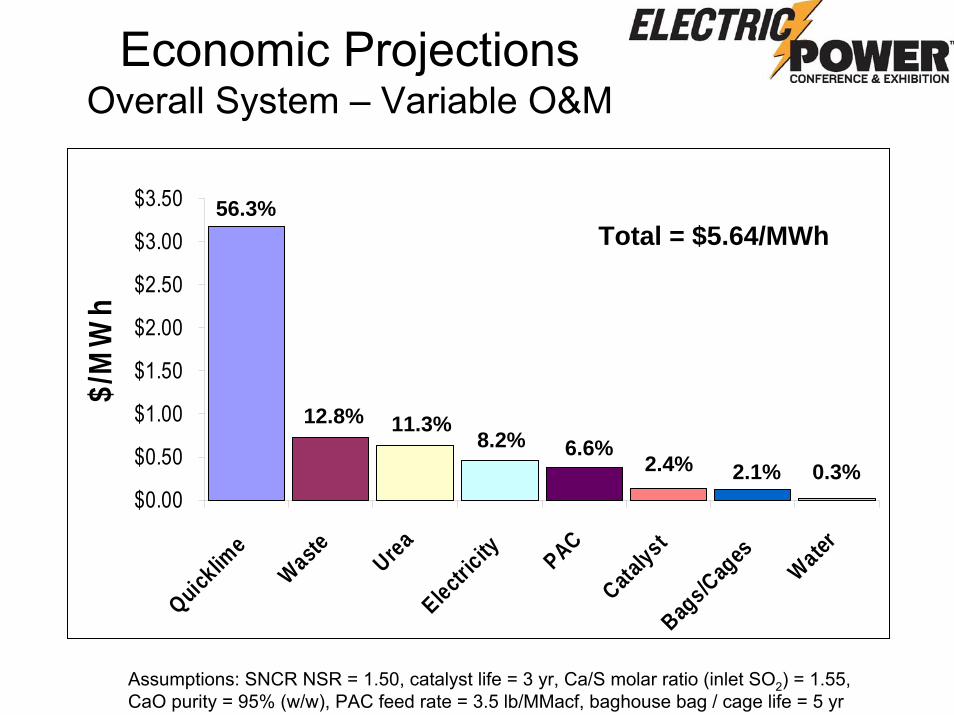
Economic ProjectionsOverall System – Variable O&M
$0.00
$0.50
$1.00
$1.50
$2.00
$2.50
$3.00
$3.50
Quicklim
e
Waste UreaElectr
icity PACCata
lystBag
s/Cages
Water$/
MW
h
56.3%
12.8% 11.3%8.2% 6.6%
2.4% 2.1% 0.3%
Total = $5.64/MWh
Assumptions: SNCR NSR = 1.50, catalyst life = 3 yr, Ca/S molar ratio (inlet SO2) = 1.55,CaO purity = 95% (w/w), PAC feed rate = 3.5 lb/MMacf, baghouse bag / cage life = 5 yr
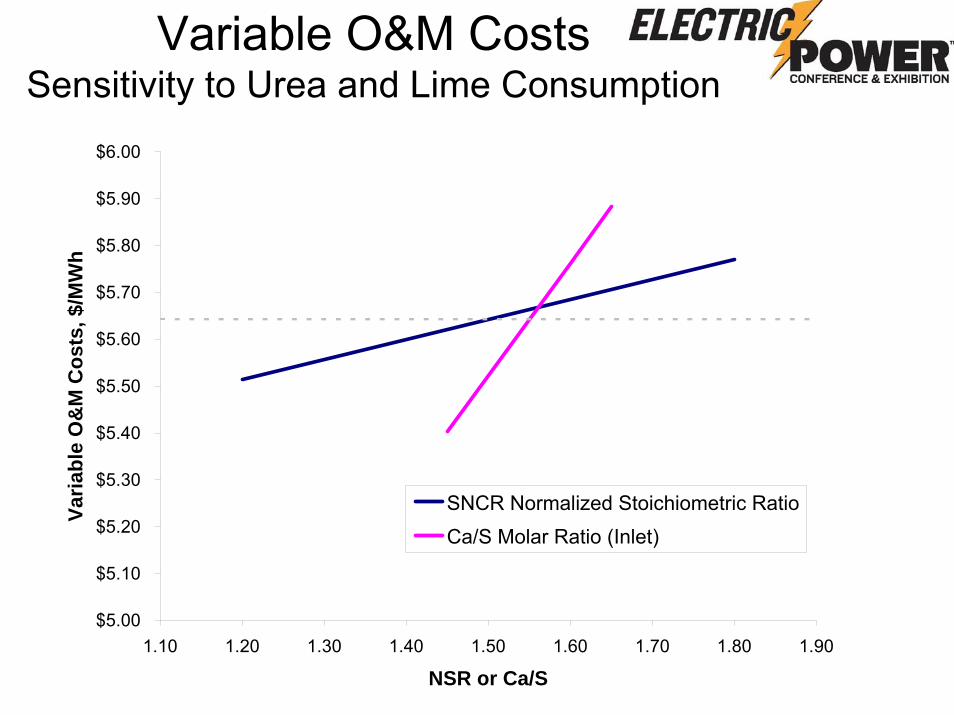
Variable O&M CostsSensitivity to Urea and Lime Consumption
$5.00
$5.10
$5.20
$5.30
$5.40
$5.50
$5.60
$5.70
$5.80
$5.90
$6.00
1.10 1.20 1.30 1.40 1.50 1.60 1.70 1.80 1.90
NSR or Ca/S
Varia
ble
O&
M C
osts
, $/M
Wh
SNCR Normalized Stoichiometric RatioCa/S Molar Ratio (Inlet)
• System design favors high baseline Hg removal without activated carbon injection– Hg oxidation across in-duct SCR catalyst– Low temperature (~170 oF) in scrubber / baghouse– High residence time for fly ash and Ca(OH)2 in scrubber / baghouse– Similar to SCR / SDA / FF with bituminous coal
• Field sampling shows 90% Hg removal often achieved with no ACI
• Expect ≥ 90% removal with low carbon injection rate– Projected activated carbon requirement: 0.0 – 3.5 lb/MMacf
• Economic projections assume maximum rate– Activated carbon accounts for $0.37/MWh of variable O&M cost– Actual cost likely to be less than this - will be determined as part of
DOE demonstration project
Variable O&M CostsMercury Control
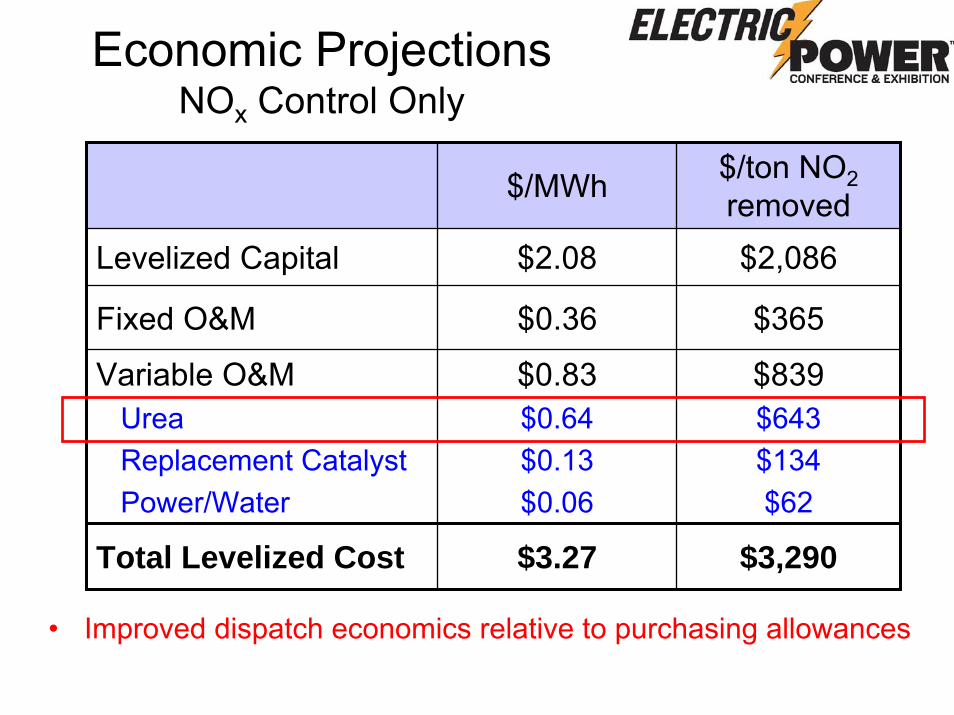
Economic ProjectionsNOx Control Only
$/MWh $/ton NO2removed
Levelized Capital $2.08 $2,086
Fixed O&M $0.36 $365
Variable O&MUreaReplacement CatalystPower/Water
$0.83$0.64$0.13$0.06
$839$643$134$62
Total Levelized Cost $3.27 $3,290
• Improved dispatch economics relative to purchasing allowances
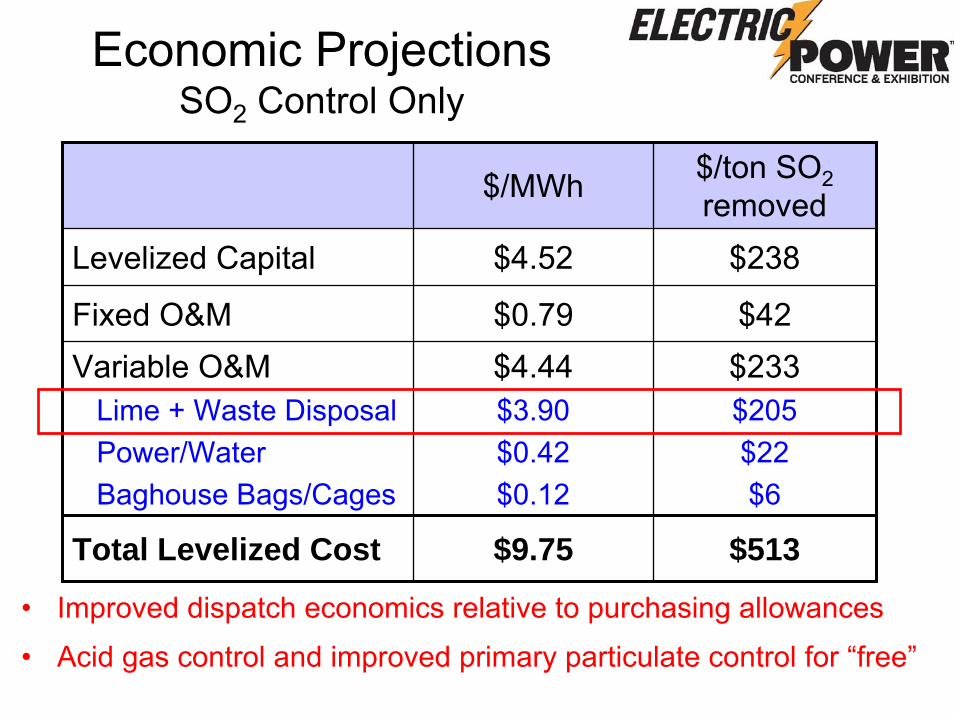
Economic ProjectionsSO2 Control Only
$/MWh $/ton SO2removed
Levelized Capital $4.52 $238
Fixed O&M $0.79 $42Variable O&M
Lime + Waste DisposalPower/WaterBaghouse Bags/Cages
$4.44$3.90$0.42$0.12
$233$205$22$6
Total Levelized Cost $9.75 $513
• Improved dispatch economics relative to purchasing allowances
• Acid gas control and improved primary particulate control for “free”
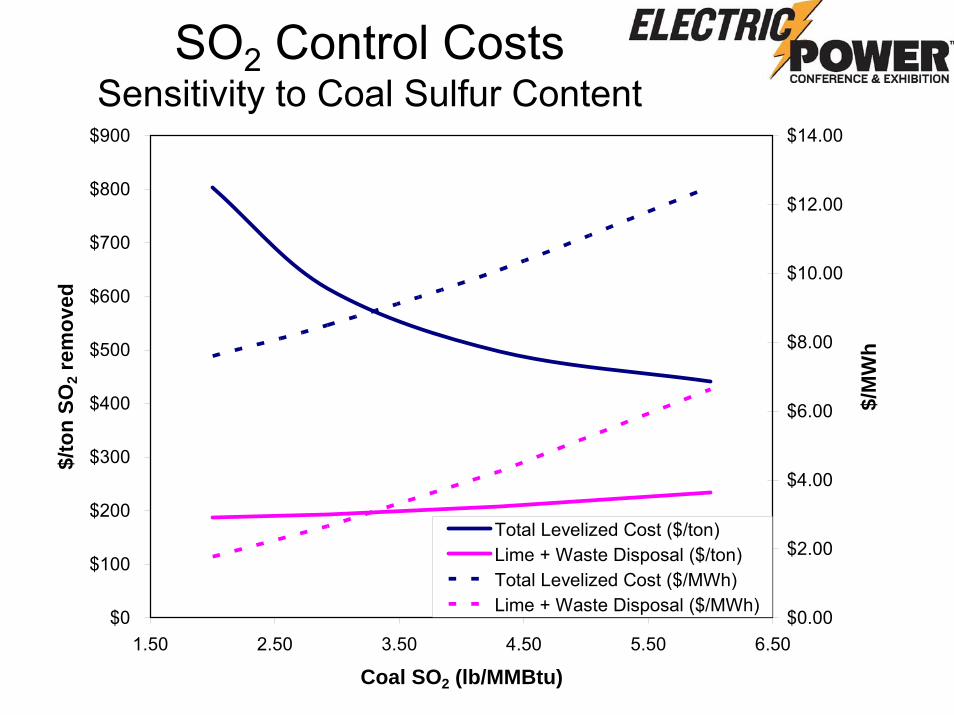
SO2 Control CostsSensitivity to Coal Sulfur Content
$0
$100
$200
$300
$400
$500
$600
$700
$800
$900
1.50 2.50 3.50 4.50 5.50 6.50
Coal SO2 (lb/MMBtu)
$/to
n SO
2 rem
oved
$0.00
$2.00
$4.00
$6.00
$8.00
$10.00
$12.00
$14.00
$/M
Wh
Total Levelized Cost ($/ton)Lime + Waste Disposal ($/ton)Total Levelized Cost ($/MWh)Lime + Waste Disposal ($/MWh)
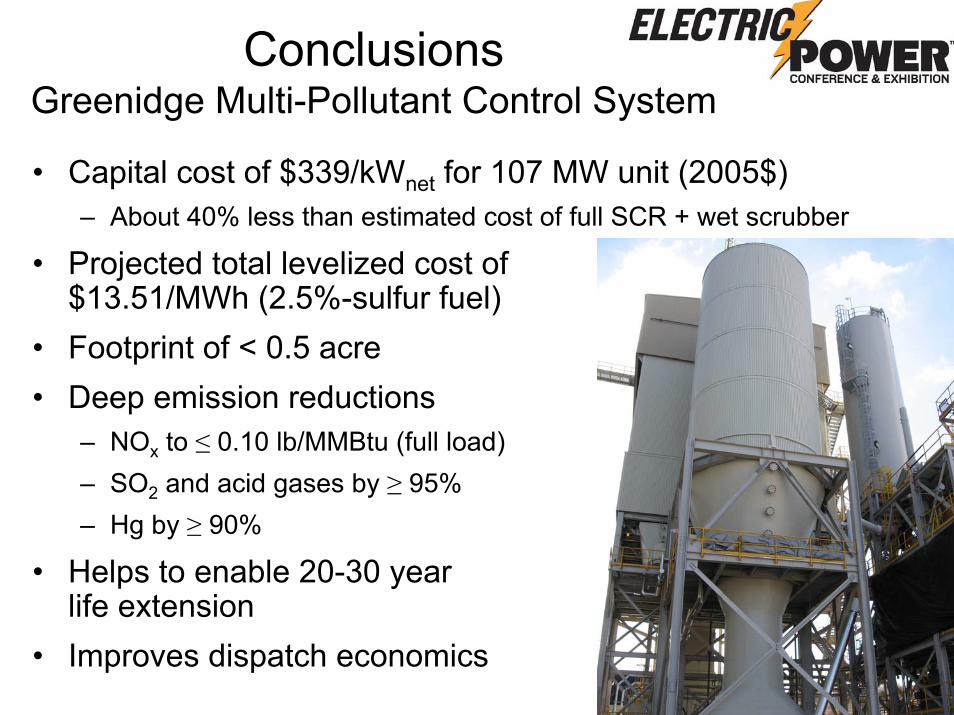
ConclusionsGreenidge Multi-Pollutant Control System
• Capital cost of $339/kWnet for 107 MW unit (2005$)– About 40% less than estimated cost of full SCR + wet scrubber
• Projected total levelized cost of$13.51/MWh (2.5%-sulfur fuel)
• Footprint of < 0.5 acre• Deep emission reductions
– NOx to ≤ 0.10 lb/MMBtu (full load)– SO2 and acid gases by ≥ 95%– Hg by ≥ 90%
• Helps to enable 20-30 yearlife extension
• Improves dispatch economics
Project Status and Plans
• System started up in early 2007
• 20-month period of operation and testing underway
• Specific goals:– Confirm emissions reduction performance
– Determine / optimize reagent consumption rates
– Characterize Hg removal co-benefits, ACI requirements
– Determine actual fixed O&M costs
– Assess effects of fuel / load
– Evaluate balance-of-plant impacts
Disclaimer
This presentation was prepared as an account of work sponsored by an agency of the United States Government. Neither the United States Government nor any agency thereof, nor any of their employees, makes any warranty, express or implied, or assumes any legal liability or responsibility for the accuracy, completeness, or usefulness of any information, apparatus, product, or process disclosed, or represents that its use would not infringe privately owned rights. Reference herein to any specific commercial product, process, or service by trade name, trademark, manufacturer, or otherwise does not necessarily constitute or imply its endorsement, recommendation, or favoring by the United States Government or any agency thereof. The views and opinions of authors expressed herein do not necessarily state or reflect those of the United States Government or any agency thereof.