Embed Size (px)
Citation preview

Tushar Manudhane - Research analyst ([email protected]); +91 022 6129 1536
Rajat Srivastava - Research analyst ([email protected]); +91 22 3010 2511
Making great strides
Initiating Coverage | 7 August 2017 Sector: Healthcare
Investors are advised to refer through important disclosures made at the last page of the Research Report.Motilal Oswal research is available on www.motilaloswal.com/Institutional-Equities, Bloomberg, Thomson Reuters, Factset and S&P Capital.
Strides Shasun

Strides Shasun
7 August 2017 2
Contents
Making great strides ............................................................................................. 3
Current business description ................................................................................. 5
Strides Pharma to deliver 25% EBITDA CAGR in FY17-20 ....................................... 6
API business is a game changer ............................................................................. 7
Time to reap benefits from regulated markets ...................................................... 9
Branded generics the focus in emerging markets ................................................. 18
Key levers in place for institutional segment ....................................................... 20
SWOT analysis .................................................................................................... 24
Return ratios to double over FY17-20 .................................................................. 25
Sensitivity analysis indicates limited downside .................................................... 28
Valuation and view ............................................................................................. 29
Manufacturing facilities and USFDA inspection update ........................................ 32
About Strides Shasun .......................................................................................... 33
Financials and Valuations ................................................................................... 34

Strides Shasun
7 August 2017 3
Strides Shasun (STR) is a first generation, vertically integrated global pharmaceuticals company, with business interests in differentiated pharma and branded generics. It sells formulations in regulated markets (51% of FY17 sales), emerging markets (18% of FY17 sales), and to global institutions (16% of FY17 sales). The API business, which would soon largely be a part of Solara, constituted 15% of FY17 sales.
Making great strides Robust outlook led by higher sales growth and improved asset utilization
STR has rebuilt its R&D infrastructure, instituted a strong compliance cultureacross the organization, backed by suitable IT investments, and integrated itsmanufacturing operations to reduce external dependence. We believe it is now ina position to begin reaping the benefits of the ~USD550m investments it has madein focus geographies in the last three years.
Given the consistent compliance history of its API facilities and low costmanufacturing, we expect the API business (through Solara) to deliver 23%revenue CAGR over FY17-20 and 18-20% EBITDA margin.
Excluding the API business, we expect revenue to grow at a CAGR of 20% overFY17-20 to INR52b, driven by 43% CAGR in the US business, 16% CAGR in theAustralia business, 15% CAGR in emerging markets and 15% CAGR in theinstitutional business. Adjusted earnings of Strides Pharma are likely to grow at aCAGR of 44%.
In the US, STR has 26 pending ANDAs and has guided 15-20 ANDA filings per year –largely niche products – in the next 2-3 years. In Australia, dominated by a few manufacturers and distributors, it is among the top-3 generic players. Its exclusive agreement with the largest distributor and ongoing tie-ups with standalone pharmacies stand it in good stead. In the institutional business, its backward integration, local manufacturing for ARV/anti-malaria, and awareness drives on Hep-C in conjunction with governments of developing nations give it an edge.
We value the STR’s pharma business at 18x FY19E earnings (industry average P/Emultiple for midcap pharma) and Solara at an EV of 13x FY19E EBITDA to arrive ata price target of INR1,300. In addition to robust performance expected in thepharma business, we believe there is significant value accretion potential in theAPI business. We initiate coverage with a Buy rating.
Regulated market business – key growth driver STR has 26 ANDAs pending for approval. The target approval dates are
within the next 6-10 months, providing visibility of higher approvals. STR has guided 15-20 ANDA filings per year over next 2-3 years. With
reduced timeline for approval, we expect the strong pace of approvals tocontinue over the next 2-3 years. STR made USD100m (annualized) from 18products (commercialized). Based on product development capability, weexpect STR to have additional run rate of USD55m-60m per year over thenext 2-3 years.
STR has re-entered the Australia generic pharma market through theacquisition of Aspen’s portfolio under Arrow Pharma. It has been working on
Initiating Coverage | Sector: Healthcare
Strides Shasun CMP: INR1000 TP: INR1,300 (+30%) Buy BSE Sensex S&P CNX
32,325 10,066
Stock Info Bloomberg STR IN Equity Shares (m) 89.4 52-Week Range (INR) 1259/849 1, 6, 12 Rel. Per (%) -1/-30/-27M.Cap. (INR b) 94.7 M.Cap. (USD b) 1.5 Avg Val, INRm 433 Free float (%) 68.9
Financial Snapshot (INR b) Y/E Mar FY17 FY18E FY19E Sales 34.8 43.9 54.5 EBITDA 6.4 8.3 11.0 NP 2.9 4.2 6.7 EPS (Rs) 32.3 47.4 74.8 EPS Gr (%) 108.2 46.9 57.9 BV/Sh (INR) 303.3 341.6 401.9 P/E (x) 31.0 21.1 13.4 P/BV (x) 3.3 2.9 2.5 RoE (%) 10.7 14.7 20.1 RoCE (%) 7.8 9.2 12.2
Shareholding pattern (%) As On Jun'17 Mar'17 Dec'16 Promoter 31.1 31.1 31.1 DII 14.3 12.9 11.4 FII 34.5 34.5 36.2 Others 20.1 21.6 21.3 FII Includes depository receipts
Strides Shasun Making great strides
Tushar Manudhane +91 22 3010 2498
Please click here for Video Link

Strides Shasun
7 August 2017 4
three fronts to aid increase in sales growth and profitability. It is expanding its generic product basket, securing supplies via tie-up with largest distributor, and expanding reach by catering to standalone pharmacies also.
Overall, we expect STR to deliver 26% CAGR in regulated markets over FY17-20.
Backward integration, newer products to drive institutional business Over the last couple of years, STR added anti-malaria products to its existing
ARV segment. Also, it is developing niche ARVs for medium-term growth. It alsoadded Sofosbuvir-based Hep-C products to its institutional portfolio.
In addition, STR has integrated manufacturing operations, which have not onlyincreased capacity but also helped secure supply of APIs for its formulations,providing increased scope of business.
Branded generics the name of the game in emerging markets Largely inorganically, STR has expanded its reach from South India to Pan India;
in the Africa market, STR got access to East Africa, adding to its existingpresence in West and French Africa. We expect 14.8% CAGR in emerging marketsales to INR8b over FY17-20.
Extensive efforts towards consistent compliance to reduce regulatory risk STR has proactively raised the bar of compliance at its facilities to reduce
regulatory risk. It has fully-integrated, compliant laboratories, with paperlessoperations. It also has fully-integrated manufacturing equipment, with completecontrol on operations and data management.
STR has improved compliance culture through open communication andemployee empowerment, thus reducing regulatory risk, considerably. Notably, ithas had four USFDA inspections in the recent past, with zero 483s.
Valuation and view With significant investments in R&D, reduced outsourcing of APIs, strong
compliance culture, increased automation, and presence in diversified markets,we believe STR is poised to deliver strong return ratios through improved assetturnover and higher share of better margin regulated market business.
We expect 20% CAGR in sales, 25% CAGR in EBITDA, and 44% CAGR in PAT ofStrides Pharma over FY17-20. Solara’s API business has niche portfolio andsuperior margin compared to commodity business, hence, we ascribe 40%premium multiple to 13x EV/EBITDA. We value STR on sum-of-the-parts (SOTP),valuing the pharma business at 18x FY19E earnings (average midcap pharma P/Emultiple) and Solara at an EV of 13x FY19E EBITDA to arrive at price target ofINR1,300.
Exhibit 1: Comparative valuations (INR b) MCap Sales EBITDA margin (%) PAT P/E (x) RoE (%) INR b FY17 FY18E FY19E FY17 FY18E FY19E FY17 FY18E FY19E FY17 FY18E FY19E FY17 FY18E FY19E
Ajanta 117.8 20.0 22.6 27.4 34.9 34.7 34.2 5.2 5.8 7.0 24.1 21.3 17.7 37.7 32.2 29.9 Natco 165.5 20.7 26.0 23.8 33.1 37.5 28.1 4.9 6.0 4.2 35.3 34.8 27.5 32.9 25.0 24.3 Alembic 99.9 31.0 32.5 37.2 19.7 18 19.5 4.1 3.9 4.8 25.1 26.5 21.3 23.0 19.0 20.4 Jubilant 112.0 60.1 65.9 72.9 22.4 23.9 24.3 5.8 7.3 8.8 19.8 15.6 12.9 18.1 19.5 19.6 Torrent 212.3 58.6 65.4 76.1 23.5 23.3 24.5 9.3 9.6 12.1 23.0 22.4 17.8 25.3 22.4 24.2 Strides 89.9 34.8 43.9 54.5 18.5 19.0 20.3 2.9 4.2 6.7 31.0 21.1 13.4 10.7 14.7 20.1
Source: Company, MOS
Stock Performance (1-year)

Strides Shasun
7 August 2017 5
Current business description
Exhibit 2: Share of regulated markets maximum in FY17 revenue
Source: Company, MOSL
51 Regulated
Market
18
Emerging Market
16
Institutional Business
15
API
Segment wise revenue breakup for FY17
Within Regulatedmarket, US andAustralia are the keymarkets.
STR’s strategy is todevelop andcommercializecomplex, lowcompetition genericsfor US market.
Re-entered Australiabusiness throughArrow Pharma. Aims tobecome market leaderin generic space byincreasing productofferings and enhancepharmacy coverage.
Within emergingmarket, India andAfrica are the keymarkets
STR’s approach tothese markets hasbeen through productsin branded genericsspace.
In addition, acquisitionin past couple of yearsin each market hasenabled STR to accessnewer areas in thesemarkets, therebydriving growth for STR.
Develops &Manufactures drugs inthe Anti-retroviral,Hep-C & Anti-Malarialsegments to supply toInstitutionally fundedaid projects and globalprocurement agencies.
STR is developing nextgen products as perdonor agencies’guidelines in ARVs andanti-malaria segmentfor future growth.
Agencies catered to –UNITAID, CHAI &PEPFAR
Key suppliers ofIbuprofen, Ranitidine &Gabapentin globally.
Has a strong APImanufacturingcapability with 2USFDA approvedmanufacturing facilitiesin India.
Strides Shasun, with these business segments would be renamed as Strides Pharma
API business would largely be
transferred to Solara

Strides Shasun
7 August 2017 6
Strides Pharma to deliver 25% EBITDA CAGR in FY17-20
Post demerger of API business into separate entity, Solara Active PharmaSciences (SAPS), Strides Shasun would be renamed Strides Pharma. StridesPharma would retain the formulations business (regulated markets, emergingmarkets and institutional segment), and specialty API business.
Adjusting for API business, we expect 20% CAGR in sales, 25% CAGR in EBITDAand 44% CAGR in PAT for Strides Pharma over FY17-20.
Exhibit 3: P&L snapshot for Strides Pharma (INR m) FY17 FY18E FY19E FY20E
Total sales 35,105 39,585 44,819 51,981 EBITDA margin (%) 18.3 19.1 20.5 20.8 Total EBITDA 6,440 7,579 9,200 10,801 EBITDA from API business 854 733 - - EBITDA excl API business 5,586 6,846 9,200 10,801 Forex gain and OOI 400 350 300 300 EBITDA incl forex gain and OOI 6,840 7,929 9,500 11,101 Other Income 1,286 967 1,062 1,011 Interest 2,269 1,853 1,410 1,240 Depreciation 1,872 1,898 1,831 1,907 PBT 3,985 5,146 7,021 8,664 Tax 630 813 1,109 1,369 Tax rate (%) 15.8 15.8 15.8 15.8 PAT 3,355 4,333 5,912 7,296 Minority Interest 462 476 500 525 PAT post MI (INR m) 2,893 3,857 5,412 6,771 EPS (INR) 32.4 43.2 60.6 75.8
Source: MOSL, Company
The strong growth trajectory would be led by 26% CAGR in regulated market sales and 15% CAGR in institutional business sales. Profit growth is likely to be higher due to: Increase in share of high margin business from regulated markets. Lower financial leverage and transfer of some debt to SAPS, resulting in lower
interest burden on Strides Pharma. Tax benefits to keep effective tax rate low.
SAPS would also have human API business from Sequent Scientific.
Highlights of the transaction are: STR shareholders to get one share of SAPS for every six shares of STR. Sequent Scientific shareholders to get one share of SAPS for every 25 shares of
Sequent Scientific. Based on the swap ratio, STR shareholders would have 60% of SAPS and
Sequent Scientific shareholders would have 40% of SAPS. The appointed date for the scheme of merger is October 01, 2017.
With this demerger, STR’s API sales would be shifted to SAPS. At the end of FY17, API constituted 15% of STR’s sales.
STR has two manufacturing facilities for this business – one in Puducherry, India and one in Cuddalore, India. These would also be shifted to SAPS in addition to three facilities from Sequent Scientific.
Strides Pharma would have formulation business from
regulated market, institutional segment and
emerging market. It would also have specialty API
business

Strides Shasun
7 August 2017 7
API business is a game changer
Compliance has become a critical parameter to select API supplier Increasing regulatory hurdles have been adversely impacting business for many pharmaceutical companies over the last 2-3 years. These hurdles could be in formulation plants or API manufacturing plants.
Compliance-related issues with API suppliers not only impact the business of the supplier, but also of the formulator. Delays in resolving regulatory hurdles could adversely impact economic viability of the product for the formulator. Refiling ANDA with alternate API supplier is a time-consuming exercise. Also, the formulator needs to build confidence in new API supplier in terms of compliance.
Given this scenario, sound compliance history, in addition to low cost manufacturing capability, has become an important parameter to select an API supplier. This would not only lead to higher customer stickiness, but also enhance the ability of a compliant API supplier to sell its products at premium. We believe STR, through Solara, is in a sweet spot to grab the growing opportunity from API business.
Sound compliance history We understand that both of STR’s API facilities (Puducherry and Cuddalore), which would be transferred to Solara, have been inspected 4-5 times. Every inspection has been successful, without any major observations. This helps assure formulators of minimal regulatory risk at the API site and assured supply (as per contract).
Also, STR produces limited-competition API molecules, primarily Ibuprofen, Ranitidine and Gabapentin.
Couple of attractive medium-term business opportunities 1. Consistent compliance, limited competition makes Ibuprofen an attractive
opportunity for US marketOnly six companies manufacture 90-95% of the global Ibuprofen API requirement. Of these, only five cater to the US market. In terms of volume, the global market is 30,000-32,000MT per annum, with stable demand; the US market is 10,000-12,000MT per annum. Value-wise, the API market would be about USD150m in the US. This product has multiple manufacturing issues, which have been resolved by existing manufacturers. However, there is limited scope for new entrants, given low economic viability and difficulty in resolving manufacturing issues.
The Ibuprofen API prices in US market have increased by at least 20% in the last one year due to supply constraints with one or the other manufacturer. With limited scope for capacity increase over 2-3 years and delayed entry of a sixth company in the US market, we expect prices to rise by a further 8-10% over the next one year.

Strides Shasun
7 August 2017 8
2. Sevelamer API – another interesting opportunitySevelamer being a phosphate binding drug, there are multiple studies involved atlaboratory level for analysis. These studies require specialized analytical skills andinstruments, making Sevelamer a niche and complex API.
Very few formulators have captive API manufacturing for the US market. Some have used STR’s API for ANDA filing and subsequent formulation sales post approval. We expect gradual price erosion and phased entry of formulators for this product in the US market, providing good business opportunity for API manufacturers such as STR. The current market size for Renvela (Sevelamer Carbonate) is about USD1.9b, with only one generic approval.
With more such molecules in its portfolio, we believe STR’s API business, which would be transferred to Solara, is as attractive as its formulation piece.
Even the API molecules from Sequent’s portfolio are fairly stable ones in terms of volume growth and enjoy higher EBITDA margins than commodity API business.
Exhibit 4: Proforma Solara Financials Solara Financials FY17 FY18E FY19E FY20E Sales from Strides 5,336 4,313 9,660 10,433 Sales from sequent 3,000 3,600 4,248 5,013 Total sales 8,336 7,913 13,908 15,445 EBITDA margin (%) 17.4 18.6 19.5 18.8 EBITDA (m) 1,454 1,471 2,719 2,910
Source: MOSL, Company
FY18 Solara financials includes only six months sales of API business from Strides. API business from strides would be transferred to Solara post demerger on 1 October 2017.
Solara would have API business from strides Shasun and Sequent

Strides Shasun
7 August 2017 9
Time to reap benefits from regulated markets
STR has built strong geography-specific foundations in the last 1,000 days, which should drive financial performance in regulated market business. The key geographies STR is focusing on in regulated markets are US, Australia and EU.
STR has been making progress on the following to create future value: It has transformed from a partnership-driven B2B model including licensing
income to a fully-integrated manufacturing strategy. In addition to creation of manufacturing base, STR has focused on R&D assets,
portfolio maximization, and backward integration. M&A focus has added the EPS accretion parameter to future value creation. Financial focus has shifted from just revenue maximization to improvement in
operating margins, earnings and cash flows.STR has a portfolio of products across oral solids and topicals, including soft gel capsules, hard gel capsules, tablets, liquids, creams, ointments, and modified and extended release products.
Exhibit 5: We expect 26% CAGR in revenue from regulated market
Source: MOSL, Company
In FY17, regulated markets contributed revenue of INR17.7b, 51% of STR’s total sales. We expect 26% CAGR in regulated market sales to INR35b. Revenue CAGR over past three years was 52%. Growth has been largely driven by inorganic measures, with the intent to build a base for future business opportunities.
We discuss in detail the businesses in each of the focus regulated markets.
6.4 11.4 17.8 23.0 30.7 35.3 7.0
79.0
55.9
29.7 33.2
15.0
FY15 FY16 FY17 FY18E FY19E FY20E
Regulated market (INR b) YoY Growth (%)
US and Australia are the focus market in regulated
space for STR

Strides Shasun
7 August 2017 10
1. US business – aggressive product pipeline, strong compliance culture,and favorable regulatory guidelines to drive growth
Many pharmaceutical companies having considerable business exposure to the US market are faced with pricing pressure on account of consolidation and regulatory hurdles at their manufacturing facilities. We believe STR is well placed to tide over these issues and deliver strong growth over the next 2-3 years.
Exhibit 6: We expect 43% CAGR in US sales over FY17-20
Source: MOSL, Company
Post the sale of Agila Specialties in December 2013, STR has rebuilt its R&D base from scratch by investing USD70m in the past three years. It now has two dedicated R&D facilities, with 500+ headcount and capabilities in oral, topical, liquid, cream, ointment, soft gel, tablet and modified release formats.
Exhibit 7: Current dosage profile of ANDAs for approval
Source: MOSL, Company
STR has filed 62 ANDAs till date, with 36 approvals. Of these, it has commercialized 18 products and has achieved annualized sales of USD100m against USD70m in FY16.
Strong US ANDA pipeline over next 2-3 years STR has 26 ANDAs pending for approval. Based on target approval date, STR expects 90% of products to have approval timeframe of 6-10 months.
95
150
239
278
FY17 FY18E FY19E FY20E
US sales (US$m)
19
5
1 1
Tablets / Capsules Topical's Modified Release Others

Strides Shasun
7 August 2017 11
Exhibit 8: Good number of approvals can be expected based on target approval date
Note: GDUFA – Generic Drug User Fee Act; Source: MOSL, Company
As STR was in the process of rebuilding R&D capabilities, the pace of ANDA filings was gradual, with average filing of 6-7 ANDAs per annum over FY14-17.
Exhibit 9: ANDA filing run-rate to pick up aggressively
Source: MOSL, Company
Aggressive filing over the next 2-3 years STR has guided 15-20 filings per year over the next 2-3 years, with focus on niche and difficult-to-develop products. It has 21 products with an addressable market size of USD2.6b as part of its current and/or future filings. Moreover, despite being off-patent, these products have limited competition due to smaller market size and/or complexity in terms of developing and manufacturing.
Favorable guidelines by USFDA to accelerate pace of approvals USFDA has been putting considerable effort on reducing the time taken for approval post submission of ANDAs by generic companies. It has already reduced the average approval cycle from over 60 months pre-GDUFA to 10-40 months in GDUFA-I cohort. This has been possible on the back of increased hiring by USFDA followed by training and system development.
23 26 34
52
62
12 13 17
23
36
CY12 FY14 FY15 FY16 FY17
ANDA filed ANDA approved
10 months
8 months
6 months
Expected time remaining for
approvals, based on target approval date
Out of GDUFA 1 (Cohort 1-3), 9 ANDAs pending for approval
Out of GDUFA 1 (Cohort 5), 7 ANDAs pending for approval
Out of Pre-GDUFA (Legacy), 3 ANDAs pending for approval Out of GDUFA 1 (Cohort 4) , 7 ANDAs pending for approval
26 ANDAs await approval, over next 6 to 10 months, on cumulative basis

Strides Shasun
7 August 2017 12
Exhibit 10: Faster action expected on ANDAs as per GDUFA cohorts
Source: USFDA, MOSL
USFDA would be starting GDUFA-II from October 2017, wherein the timeline for approvals is expected to reduce to 8-10 months. USFDA would be taking action on 90% of the applications within 10 months of submission.
Advantage STR With reduced timeline for approval and aggressive filings by STR, we expect significant ramp up of revenue from the US market over the next 2-3 years.
It’s not just about g-Lovaza, approved product pipeline highlights STR’s differentiated strategy
One interesting product over the medium term is g-Lovaza. Though it is genericized, competition is limited and the market size is USD300m. We expect STR to garner annual revenue of USD30m post approval, assuming 20% market share and 25% price erosion. Based on its other recent approvals, we believe STR has a good product selection strategy, with more of limited-competition and complex generics.
Pre-GDUFA
“Backlog”
FY13 “Year 1”
FY14 “Year 2”
FY15 “Year 3”
FY16 “Year 4”
FY17 “Year 5”
Take actionon 90% byend of year5
Expedite revenue of PIVMaintain productivity to
extent possible givenhiring, training, programsand system developmentactivity
Take actionon 60%within 15months ofsubmission
Take actionon 75%within 15months ofsubmission
Take actionon 90%within 10months ofsubmission

Strides Shasun
7 August 2017 13
Exhibit 11: ANDA approvals over past two years
Brand Active Ingredient Approval Date
No. of competitors
Market Size (US$m)
Symmetrel Amantadine Hydrochloride (Tab) 9-Jun-17 3 22 Symmetrel Amantadine Hydrochloride (Cap) 7-Jun-17 5+ 25 Motrin IB Ibuprofen OTC 30-May-17 5+ 520 Namenda Memantine Hydrochloride 23-May-17 5+ 60 Miralax Polyethylene Glycol 3350 (OTC) 24-Aug-16 5+ 260 Zantac Ranitidine Hydrochloride 22-Aug-16 5+ 125 Flagyl Metronidazole 25-May-16 5+ 50 Avodart Dutasteride 20-Nov-15 5+ 470 Soma Carisoprodol 12-Nov-15 5+ 38 Tessalon Benzonatate 30-Jul-15 5+ 41
Note: Market size at the time of approval to STR; Source: MOSL, Company
Cetirizine Softgel Capsule is case in point STR recently received final approval for Cetirizine Softgel Capsules, 10mg (OTC). Cetirizine Softgel is used to temporarily relieve the following symptoms due to hay fever or other upper respiratory allergies: Runny nose Sneezing Itchy, watery eyes Itching of nose or throatThe market size for this product is ~USD60m. Though the market size is small, thereis only one generic competitor. Being a limited-competition product, there would belesser price erosion. Hence, as STR establishes its brand for this product, it wouldfind considerable business potential, with good profitability. We expect annualizedsales of USD15m-18m. The scale-up would be gradual due to brand buildingexercise.Even Amantadine HCL (tablet) has limited competition, making it an attractiveopportunity for STR.
We expect US sales of STR to grow from USD95m to USD278m by FY20 on the back of product launches and increased traction in existing products.
Highlighting STR’s market share (and market share trends) in a few products
Exhibit 12: Since it launched Methoxsalen in June 2014…
Source: MOSL, Bloomberg
Exhibit 13: …STR has continued to gain share
Source: MOSL, Bloomberg
0.0
15.0
30.0
45.0
60.0
Jun-
14
Sep-
14
Dec-
14
Mar
-15
Jun-
15
Sep-
15
Dec-
15
Mar
-16
Jun-
16
Sep-
16
Dec-
16
Mar
-17
strides' share (%) in Methoxsalen Valeant 6%
Actavis Pharma
4%
Strides Pharma
43%
Oceanside Pharm
47%

Strides Shasun
7 August 2017 14
Exhibit 14: Though commercialization was much later than approval timeline…
Source: MOSL, Bloomberg
Exhibit 15: …STR gained significant traction, with 65% market share in Ergocalciferol (Vitamin D2)
Source: MOSL, Bloomberg
Exhibit 16: Since it launched in November 2016…
Source: MOSL, Bloomberg
Exhibit 17: …STR has gained 15% market share in Ranitidine (g-Zantac)
Source: MOSL, Bloomberg
Exhibit 18: Though commercialization was much later than approval timeline…
Source: MOSL, Bloomberg
Exhibit 19: …STR gained significant traction, with 20% market share in Acarbose (g-Precose)
Source: MOSL, Bloomberg
0
20
40
60
80
Oct
-14
Dec-
14Fe
b-15
Apr-
15Ju
n-15
Aug-
15O
ct-1
5De
c-15
Feb-
16Ap
r-16
Jun-
16Au
g-16
Oct
-16
Dec-
16Fe
b-17
Apr-
17
strides' share (%) in Ergocalciferol Barr 1%
Bionpharma
22%
Breckenridge
11% Strides Pharma
65%
Sun/Caraco Phar 1%
0.0
4.0
8.0
12.0
16.0
Nov
-16
Dec-
16
Jan-
17
Feb-
17
Mar
-17
Apr-
17
May
-17
strides' share (%) in Ranitidine
Silarx 4%
Sandoz Inc 2%
Amneal Pharma
45%
Dr.Reddy'S Lab 4%
Strides Pharma
15%
Glenmark Pharma
24%
Nostrum Laborat
1% Pharmaceu Assoc
5%
0.0
5.0
10.0
15.0
20.0
25.0
Jun-
14
Sep-
14
Dec-
14
Mar
-15
Jun-
15
Sep-
15
Dec-
15
Mar
-16
Jun-
16
Sep-
16
Dec-
16
Mar
-17
strides' share (%) in acarbose
Alvogen Inc 9%
Virtus Pharma
64%
Actavis Pharma
2% Strides Pharma
20%
West-War/Roxan
e 5%

Strides Shasun
7 August 2017 15
Expect strong growth on aggressive filing and reduced timeline for approval Even assuming USD5m per ANDA, which has been the average revenue from 18
commercialized products, we expect future approvals to add USD60m-75m toannual US revenue. In addition, superior execution should enable STR to gainmarket share in existing products.
In addition, STR has six para-IV opportunities, of which two are settled.
Exhibit 20: Settled para-IV opportunities
Generic Name Brand Name Market Size(US$m)
Settled date of launch
Probable business of STR in 1st year
post launch Remark
fingolimod Gilenya 2000 Feb-19 20.0 Multiple generics have tentative approvals for this
product. Though current market size is huge,opportunity is limited
Roflumilast Daliresp 201 Jan-20 18.1 Litigation on with multiple companies.
Source: MOSL, Company
Conscious effort on regulatory compliance STR has been working not only on product development and supporting manufacturing base, but also on regulatory compliance.
There have been a number of instances in the past 2-3 years, where peers’ existing business slowed down or even stopped due to regulatory issues. In addition, slippages on the regulatory compliance front have also impacted ANDA approvals, affecting future business.
Four of last five audits cleared with zero 483s In contrast, STR has not only seen a pick-up in approvals in the recent past, but has also had successful inspections. This has been possible on the back of technological upgrades, increased awareness, open communication, and employee empowerment. STR has fully integrated, compliant laboratory and established good manufacturing practices, reducing regulatory risk considerably.
Exhibit 21: Inspection history - US FDA Inspection History Bangalore formulation, India Inspected in May-17. Form 483 issued with 3 observations. Few product approvals already in
place post inspection. Inspected in Jun-16. No form 483 issued Inspected in Feb-16. Form 483 was issued. EIR issued in Jun-16 Inspected in Aug-14. Form 483 was issued. VAI status at closure of inspection Inspected in Dec-13. Form 483 was issued. NAI status at closure of inspection Inspected in Jul-11. No form 483 issued. NAI status at closure of inspectionPuducherry formulation, India Inspected in May-17. No form 483 issued Inspected in Feb-15. Form 483 was issued. VAI status at closure of inspection Inspected in Nov-11. No form 483 issued. NAI status at closure of inspection Inspected in Oct-09. No form 483 issued. NAI status at closure of inspection Milan formulation, Italy Inspected in May-15. No Form 483 was issued Inspected in Jun-13. No form 483 issuedPerrigo API, India Inspected in FY14. No Form 483 was issued Chennai formulation, India Inspected in Nov-16. No form 483 issued Inspected in Jun-15. VAI Status on facility post inspection
Source: MOSL, Company
Consistent compliance track record

Strides Shasun
7 August 2017 16
2. Australia business – re-entry with renewed effort to accelerate growthWith the acquisition of Arrow Pharma in August 2015, STR re-entered the Australiangeneric market. It has taken strategic steps to fast-track growth in Australia.
Exhibit 22: Structure of Australian generic pharma market
Source: MOSL, Company
Generic drugs constitute just ~9% of the USD10.5b pharmaceuticals market (2014). Only five companies supply 90% of generic drugs sold in Australia; entry of new generic drug manufacturers difficult Generic drugs account for a small proportion of products sold in a pharmacy store. Also, the pharmacy alliance negotiates with only wholesalers for availability of generic drugs. Depending on the needs of the pharmacies, the wholesaler is more interested in tying up for a basket of products from a manufacturer than in negotiating for and procuring a particular or few products from a manufacturer. As a result, the wholesaler is inclined to have business relationships with a few manufacturers that are able to supply maximum number of products. It is difficult to break the existing manufacturer-wholesaler relationships.
Even the unorganized pharmacies are in the process of forming virtual procurement platforms, which would again make the entry of new manufacturers more difficult.
5 Companies supply 90% of generic drug sold
3 Wholesalers distribute all PBS drugs to Pharmacies
In addition, there are 5,250 standalone
pharmacies, 3000 are organised and 2,240 are
in process of forming virtual common platform
for procuring generic drugs in cost effective
manner
Apotex Mylan Arrow Sandoz Amneal
Sigma Symbion
API

Strides Shasun
7 August 2017 17
Exhibit 23: STR’s four-pronged strategy to drive financial performance in Australia market
Source: MOSL, Company
STR has taken strategic initiatives to enhance product pipeline, assured off-take, and customer base STR intends to enhance its product portfolio through own R&D, acquisitions, as well as in-licensing.
STR acquired strategic stakes in Australia-based generic partners, giving it immediate access to 47 commercialized market authorizations, 22 pending approval registrations, as well as a strong pipeline of 32 products.
STR has signed a 10-year exclusive distribution agreement with Sigma, the largest pharmacy wholesaler by market share in Australia. With this, STR has not only improved sales of existing products but also introduced new products through the same channel.
In addition to supplying medicines through the traditional route of wholesalers and distributors, STR is in the process of tapping standalone pharmacies through Pharmacy Alliance. STR has entered into a 10-year supply partnership and trading platform with Pharmacy Alliance, Australia’s longest standing cooperative buying group. The agreement guarantees Pharmacy Alliance members a market-leading suite of products and services across the Arrow (now STR) generic range. Pharmacy Alliance is also subsidiary of STR. Currently, out of 2,240 pharmacies, Pharmacy Alliance caters to 600 stores, for which it handles administrative work. STR continues its effort to take it to 1,000 pharmacies over the next 2-3 years.
Also, the shift of manufacturing to India would lead to improvement in profitability.
We expect STR to be on a strong growth trajectory in Australia in the next 2-3 years.
3. EU business – increasing reach, leveraging existing productsSTR is leveraging its existing product portfolio in the US and Australia markets togrow in the regulated markets of the European Union (EU).
STR already supplies generics to hospitals in the UK, which are approved by NHS. It has a diversified portfolio of capsules, sachets and oral solids in different therapies.
STR also has key regulatory approvals including MHRA. Besides expanding its product base, STR intends to grow this business by increasing its reach in the UK as well as through strategic partnerships for own IP generics in the rest of Europe.
Basket of existing products and
more in pipeline
Relationship with largest pharmacy wholeseller in place
Formation of virtual platform for standalone pharmacy underway
Site transfer in progress for cost rationalization
Key drivers for growth in revenue and profit

Strides Shasun
7 August 2017 18
Branded generics the focus in emerging markets
In the emerging market business, STR derives revenue largely from domestic branded formulations and Africa branded formulations.
Exhibit 24: Better outlook in emerging markets on product launches and increased reach
Source: MOSL, Company
Africa – focus on branded generics, with ‘In Africa for Africa’ strategy STR is a leading company in West and French Africa, and has had exposure to branded as well as generic generics. It has been growing faster than industry in the branded generic segment in the past 4-5 years.
Now, STR focuses only on branded generics and has divested six generic facilities in Africa. The divested business used to generate annual revenue of USD21m and EBITDA of USD1.4m. STR received USD16m cash for this business.
Also, it recently acquired 51% stake in Universal Corporation for USD11m.
About Universal Corporation Universal Corporation is a manufacturing and marketing company, with considerable business in East Africa and has supply contracts with donor agencies. It is one of the two WHO-prequalified sites in Sub-Sahara Africa (other than South Africa).
With the acquisition of Universal Corporation, STR has gained a strong foothold in East Africa. It would be consolidating manufacturing of branded generic products at Universal’s facility. The Universal Corporation facility would run on the hub-and-spoke model, catering to branded generic markets across the Sub-Saharan region.
About Africa pharma market The combination of economic strength and an expanding middle class is driving demand for medicines in Africa. This coupled with better logistics, infrastructure and healthcare capabilities is not only increasing demand for medicines, but also their availability for patients. Prescription drugs, generics and OTC drugs are expected to grow at a CAGR of 6%, 9% and 6%, respectively, over 2013-20.
4.6 3.8 6.3 5.9 6.8 8.1
41.0
-16.3
64.9
-7.1
16.1 18.2
FY15 FY16 FY17 FY18E FY19E FY20E
Emerging market (INR b) YoY Growth (%)

Strides Shasun
7 August 2017 19
There have been measures by the government as well to support business activity (like price controls and import restrictions to encourage domestic manufacturing, and country-specific labeling to reduce counterfeiting and parallel imports).
STR has 250MRs catering to 30,000 doctors. It already has 750 product registrations and has a strong pipeline of 500 product registrations.
STR would be utilizing the Universal facility for institutional business, given the preference for local sourcing under donor-funded program. It is in the process of shifting the institutional portfolio to the Universal facility.
We expect medium-term growth in Africa to be driven by new product launches and improving productivity in West and French Africa, higher business from newer territory (East Africa), and increased scope of institutional business.
India – working towards expanding reach and product offerings From a regional player in South India till 2014, STR has expanded its reach to other parts of India through both organic and inorganic means. Its flagship brand is Renerve, and it is among the top-5 in vitamins, minerals and nutrients involving Methylcobalamin combinations.
STR made following acquisitions to strengthen market presence: Acquired global rights of Raricap brand in FY15, which strengthened women’s
health portfolio. Raricap had annual sales of INR200m at the time of acquisition. Acquired the CNS division of the erstwhile Ranbaxy from Sun Pharma in FY16; it
had annual sales of INR920m at the time of acquisition. Acquired Johnson & Johnson’s brands portfolio in derma, anti-emetic and pain
management in FY16; it had annual sales of INR320m at the time of acquisition.
In terms of therapeutic category, STR now has products in CNS, Diabetes, CVS, Women’s Health and Pain Management.
Post the acquisitions, integration of product portfolio, and rationalization of cost and field force, STR has a sales force of 750 MRs and wide network catering to 3,500 stockists and 80,000 doctors.
We expect 1HFY18 performance in domestic formulations to be muted on account of implementation of GST. However, as the effect of GST smoothens, we expect STR to show gradual pick-up in growth and improvement in MR productivity.
On overall basis, we expect STR’s emerging market business to grow at a CAGR of 14.8% (adjusting for divested Africa generic sale) to INR8b, with better profitability compared to previous years.

Strides Shasun
7 August 2017 20
Key levers in place for institutional segment
STR had sales of INR5.7b in institutional business segment and formed 16% of total sales. It has made a few strategic moves in this segment in the last two years to enhance sales and profitability.
Exhibit 25: Higher product offering in institutional segment
Source: MOSL, Company
Exhibit 26: We expect 15% CAGR in institutional business revenue
Source: MOSL, Company
Before merger with Shasun, though STR was in the list of approved suppliers for institutionally-funded projects and global procurement agencies, it was perceived as a fringe player. It had limited formulations capacity and higher dependence on external API. This led to moderate growth in this business.
The merger with Shasun has strengthened STR by not only adding formulations capacity but also by enabling backward integration and securing API supply for its products. Before the merger, STR was the only non-vertically-integrated company in the business other than Aspen.
Collaborations and limited scope of re-entry of competitor to drive anti-malaria business STR started receiving orders from Global Fund to supply anti-malaria products from 2HFY15. The addition of anti-malaria products aided growth in institutional business. This business has grown considerably due to superior execution and partly due to regulatory issues faced by a competitor, Ipca Laboratories.
STR also collaborated with Medicines for Malaria Venture (MMV) for development of rectal artesunate for pre-referral treatment of children with severe malaria.
Growth drivers for
Insitutional business
ARVs
Anti-Malaria
Sofosbovir
4.1
6.0
5.7
6.4 7.3 8.6
16.0
46.0
-4.6
12.0 15.0 18.0
FY15 FY16 FY17 FY18E FY19E FY20E
Institutional business (INR b) YoY Growth (%)
Strides Shasun
7 August 2017 21
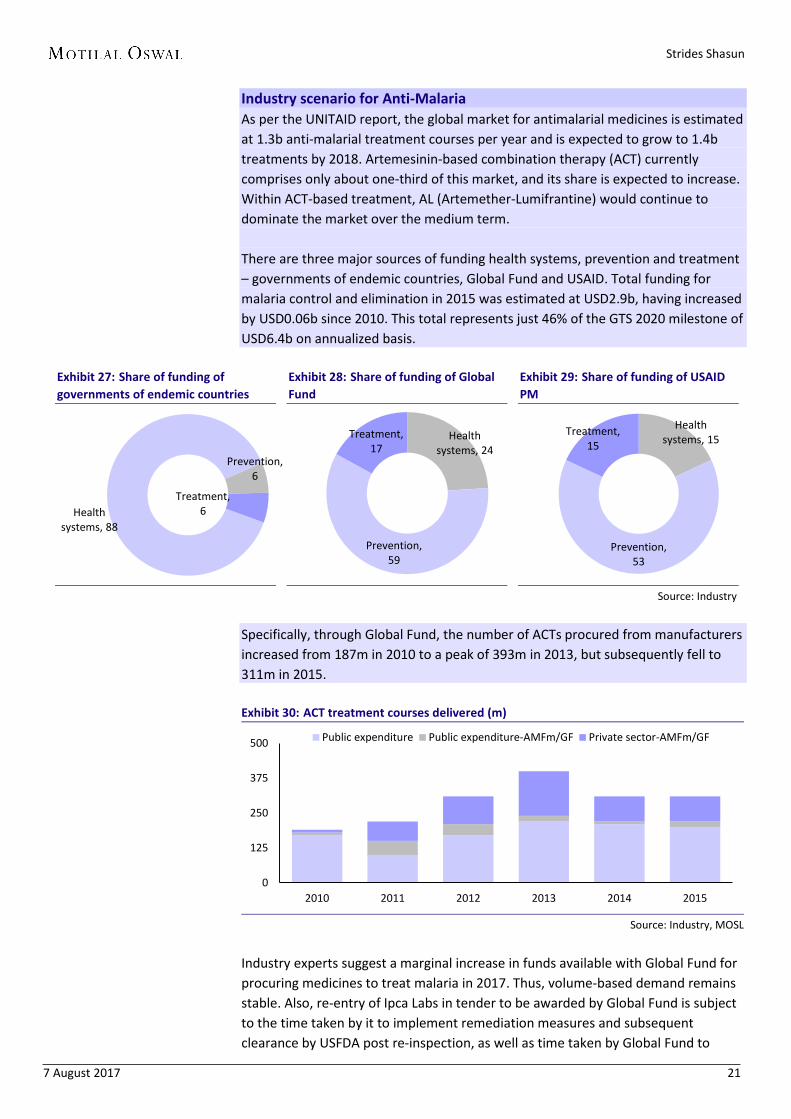
Industry scenario for Anti-Malaria As per the UNITAID report, the global market for antimalarial medicines is estimated at 1.3b anti-malarial treatment courses per year and is expected to grow to 1.4b treatments by 2018. Artemesinin-based combination therapy (ACT) currently comprises only about one-third of this market, and its share is expected to increase. Within ACT-based treatment, AL (Artemether-Lumifrantine) would continue to dominate the market over the medium term.
There are three major sources of funding health systems, prevention and treatment – governments of endemic countries, Global Fund and USAID. Total funding formalaria control and elimination in 2015 was estimated at USD2.9b, having increasedby USD0.06b since 2010. This total represents just 46% of the GTS 2020 milestone ofUSD6.4b on annualized basis.
Exhibit 27: Share of funding of governments of endemic countries
Exhibit 28: Share of funding of Global Fund
Exhibit 29: Share of funding of USAID PM
Source: Industry
Specifically, through Global Fund, the number of ACTs procured from manufacturers increased from 187m in 2010 to a peak of 393m in 2013, but subsequently fell to 311m in 2015.
Exhibit 30: ACT treatment courses delivered (m)
Source: Industry, MOSL
Industry experts suggest a marginal increase in funds available with Global Fund for procuring medicines to treat malaria in 2017. Thus, volume-based demand remains stable. Also, re-entry of Ipca Labs in tender to be awarded by Global Fund is subject to the time taken by it to implement remediation measures and subsequent clearance by USFDA post re-inspection, as well as time taken by Global Fund to
Health systems, 88
Prevention, 6
Treatment, 6
Health systems, 24
Prevention, 59
Treatment, 17
Health systems, 15
Prevention, 53
Treatment, 15
0
125
250
375
500
2010 2011 2012 2013 2014 2015
Public expenditure Public expenditure-AMFm/GF Private sector-AMFm/GF

Strides Shasun
7 August 2017 22
award the business. We assume loss of business to Ipca Labs to continue this year as well, as we expect it to take longer to clear the regulatory issue.
We expect the anti-malaria tender business to remain stable for STR in FY18. Given the regulatory hurdle for Ipca, we expect low probability for award of tender in October-November 2017 for FY19 business, extending stable business for STR in FY19, as well.
Focus on developing and manufacturing limited competition products to increase ARV business over the medium term
Industry scenario for ARV Increased ARV treatment to HIV infected adults in LMICs drive institutional ARV business: The anti-retrovirals (ARV) market to treat HIV infection in LMIC (low and middle income countries) was about US$1.9b in 2015 in terms of value. ARV market has grown at 12% CAGR over FY13-15. This is largely due to increase in number of adult patients to be treated by ARVs. Approximately 14.4m adults received ART (anti-retroviral therapy) in LMICs in 2015, up 13% yoy. Treatment coverage for adults living with HIV/AIDS in LMICs increased from 41% at the end of 2014 to 46% at the end of 2015. The number of adults on ART and ART coverage in LMICs is expected to go to 22.5m by 2020, providing visibility of growth in ARV business.
In an effort to simplify antiretroviral therapy, the WHO’s 2013 guidelines reduced the preferred regimens to a single option, TDF + 3TC (or FTC) + EFV, which could be used across a range of populations as a single-pill once-daily regimen. In turn, LMICs have made great strides towards simplifying their national treatment programs, phasing out non-recommended drugs such as stavudine (d4T) in favor of Tenofovir-based combinations. This progress is reflected in the consolidation of adult first-line regimens from 2013 to 2015 around the preferred first-line regimen, Tenofovir based combination, which represented ~72% of the adult first-line patients in GA (Generic Accessible) LMICs in 2015, up ~from 39 percentage points in 2013.
Exhibit 31: Expect 12.5% CAGR in adult patients over FY17-20
Source: MOSL, Company
Exhibit 32: TDF and EVF combination dominates first-line treatment
Source: MOSL, Company
With countries ramping up TDF use in first-line treatment, EFV uptake also continues to increase. As such, EFV600 is expected to be used among the majority of first-line
6 8 9
11 13
15 16 17 19
21 23
2010
2011
2012
2013
2014
2015
2016
2017
2018
E
2019
E
2020
E
LMIC Total Adults on ART(Actual/Projected) (mn)
19 29 43 20
32 29
27
20 16
33 19
12 10 11.6
12.9
2013
2014
2015
TDF+3TC+EFV TDF+FTC+EFV AZT+3TC+NVP Others
TDF: Tenofovir Disoproxil Fumarate, 3TC: Lamivudine,
EFV: Efavirenz.

Strides Shasun
7 August 2017 23
patients in 2017, after which the NNRTI (class of ARV drugs) market may shift towards new products such as lower-dose EFV (EFV400) and DTG. Both drugs are expected to be more tolerable and more affordable than EFV600.
With increasing use of TDF in first-line, AZT’s share is expected to decline.
Tenofovir alafenamide fumarate (TAF), a potential alternative to TDF, is a tenofovir prodrug that offers high antiviral efficacy and improved renal and bone safety profile at much lower doses than TDF. As of August 2016, Gilead has received FDA approval on three TAF-containing FDCs. Additionally, Gilead filed an NDA for the TAF 25mg singles with the FDA, but only for the adult hepatitis B indication.
The first generically-available TAF FDC is likely to be launched in early-to-mid-2018.
With STR having tied up with Gilead for manufacturing and distributing Tenofovir Alafenamide (TAF) in 112 countries, we expect good traction from this combination post genericization.
Sofosbuvir-based drugs – huge Unmet need for HepC treatment; however, improvement in diagnosis in developing countries remains the key STR has entered into a licensing agreement to produce and distribute generic Sovaldi and investigational single tablet regimen of ledipasvir/sofosbovir for treatment of chronic Hepatitis C, for distribution to 91 developing countries including India, Eqypt and Indonesia, which are high burden countries. STR is one of the 13 companies with whom Gilead has signed licensing agreements.
Generic Sovaldi (Sofosbuvir) is another interesting opportunity for STR in the institutional segment. There are 103m patients estimated to have Hepatitis C in 101 developing countries, indicating good business opportunity for STR. Of the 103m patients, 40-50% are concentrated in Egypt, India, Indonesia and Bangladesh.
Gilead has been using different pricing strategies in different addressable markets. In the US, Gilead sells at USD84,000 per treatment of 12 weeks with one pill a day. A similar package is priced at USD51,000 in France and at USD900 in Egypt.
Though the opportunity looks sizable in terms of number of untreated patients, the key constraint is lack of diagnostic systems for detecting Hepatitis C. At the same time, public and policymaker awareness of the disease is limited, as is national and international funding for Hepatitis C screening and treatment. We expect sales from this opportunity to pick up only gradually.
We expect STR to deliver 15% CAGR in institutional sales to INR8.6b over FY17-20.

Strides Shasun
4 August 2017 24
SWOT analysis
STRENGTH R&D Driven enables STR to develop low competition products which not only provides
visibility of higher growth, but also enhances sustainability of sales and superior marginsin US business
Fully Integrated Manufacturing Operations leads to reduced dependency on out-sourcing, lowers regulatory risk and increases scope of business, both, regulated marketand institutional business.
Strong Regulatory Compliance Structure in terms of product quality and good manufacturing practices considerably reduces scope of adverse impact on existingbusiness or new approvals due to regulatory hurdle.
Geographical diversification into US, Australia, Africa and India reduces businessdependency on particular market
WEAKNESS Current ANDA pipeline pending for approval is small compared to peers. STR has guided
for aggressive filing of 15-20 ANDAs per annum, largely low competition products overnext 3 years to not only fill product basket but also enhance business and margins.
Stringent pricing regulation in India may reduce scope of hike in prices and therebyaffect profitability.
OPPORTUNITIES STR has been focusing on Robust Niche Product Pipeline like modified release, soft gel
capsules, topical and integrated products, build OTC franchise and Faster Pace ofApproval from USFDA provides strong opportunity from US market.
STR’s approach is in line with Strong Demand for Complex Generics wherein there islimited competition due to complexity associated with development and/ormanufacturing operations.
THREATS Delay in Regulatory Approval may increase competition and thereby reduce
profitability of STR. Higher Price Erosion in US generics, either due to distributor level consolidation or
increased competition from supplier would impact STR’s performance as well. Adverse Changes in Regulatory Norms may impact outcome of strategies implemented
by STR.
S
W
O
T
Strides Shasun
7 August 2017 25
Return ratios to double over FY17-20
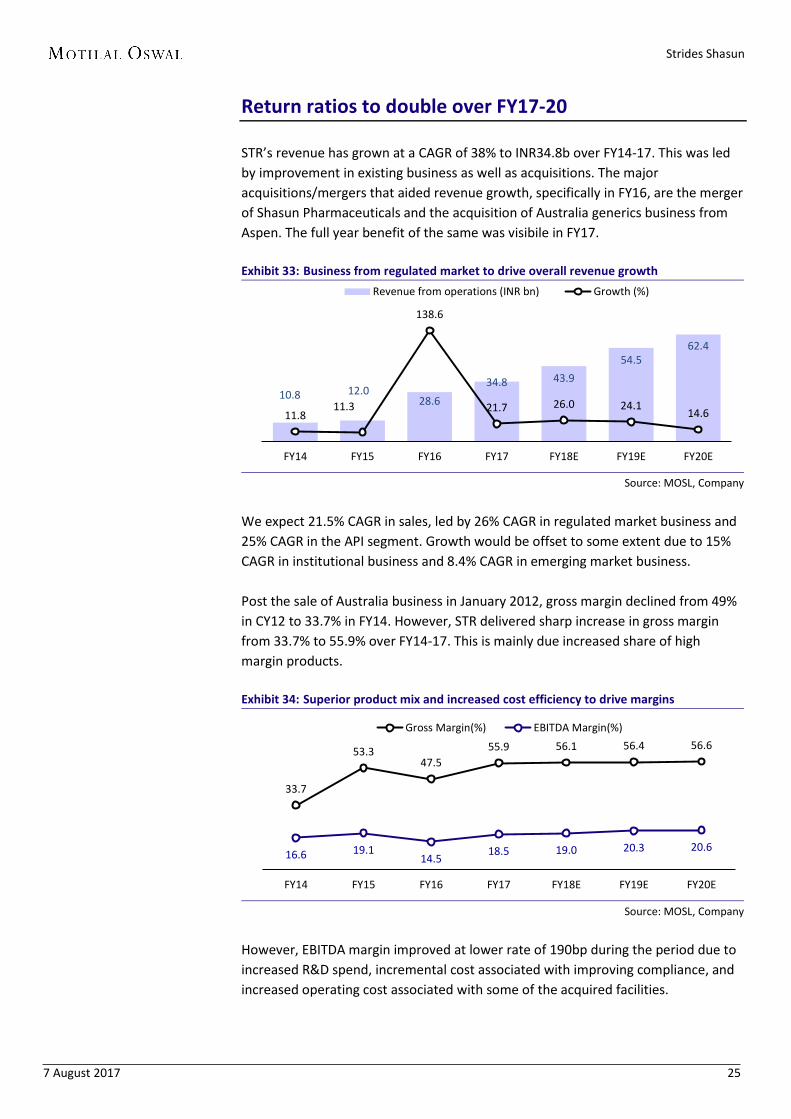
STR’s revenue has grown at a CAGR of 38% to INR34.8b over FY14-17. This was led by improvement in existing business as well as acquisitions. The major acquisitions/mergers that aided revenue growth, specifically in FY16, are the merger of Shasun Pharmaceuticals and the acquisition of Australia generics business from Aspen. The full year benefit of the same was visibile in FY17.
Exhibit 33: Business from regulated market to drive overall revenue growth
Source: MOSL, Company
We expect 21.5% CAGR in sales, led by 26% CAGR in regulated market business and 25% CAGR in the API segment. Growth would be offset to some extent due to 15% CAGR in institutional business and 8.4% CAGR in emerging market business.
Post the sale of Australia business in January 2012, gross margin declined from 49% in CY12 to 33.7% in FY14. However, STR delivered sharp increase in gross margin from 33.7% to 55.9% over FY14-17. This is mainly due increased share of high margin products.
Exhibit 34: Superior product mix and increased cost efficiency to drive margins
Source: MOSL, Company
However, EBITDA margin improved at lower rate of 190bp during the period due to increased R&D spend, incremental cost associated with improving compliance, and increased operating cost associated with some of the acquired facilities.
10.8 12.0 28.6
34.8 43.9 54.5
62.4
11.8 11.3
138.6
21.7 26.0 24.1 14.6
FY14 FY15 FY16 FY17 FY18E FY19E FY20E
Revenue from operations (INR bn) Growth (%)
33.7
53.3 47.5
55.9 56.1 56.4 56.6
16.6 19.1 14.5
18.5 19.0 20.3 20.6
FY14 FY15 FY16 FY17 FY18E FY19E FY20E
Gross Margin(%) EBITDA Margin(%)

Strides Shasun
7 August 2017 26
STR has spent significant amounts on these three fronts to strengthen its R&D for building its future product pipeline. It has invested in infrastructure, human resources, as well as in developing capabilities. Cumulatively, STR has spent USD70m over the last three years, largely towards setting up R&D facility, increasing R&D headcount to 500+, and developing complex generics. These generics mainly relate to topical and modified release drug substances.
Exhibit 35: R&D spend largely for products to be sold in regulated market
Source: MOSL, Company
With large part of the R&D spend incurred in the last three years, STR has guided that R&D spend would be capped at USD30m per annum for the next 2-3 years. This would not slow down or affect the pace of filing ANDAs for future growth.
STR’s net debt stands at INR21b. Till FY15, STR had a small amount of net debt. However, mergers and acquisitions led to considerable increase in net debt. Though net debt has increased, net-debt-to-equity ratio is comfortable at 0.8x.
Exhibit 36: Net debt to reduce through internal accruals
Source: MOSL, Company
With STR having largely completed its capex and investment phase, the capex is likely to be nominal and would be required for maintenance of facilities. The cash generated from ongoing business would be largely used to repay debt and reduce interest cost. STR intends to reduce debt by at least INR3b per annum over the next three years to reduce financial leverage and thereby improve profitability.
525 592 757
1,361 1,750
1,984 2,112
FY14 FY15 FY16 FY17 FY18E FY19E FY20E
R&D spent (INR m)
14.3
(0.9)
1.8
21.4 21.0 18.0
14.4
9.0
CY12 FY14 FY15 FY16 FY17 FY18E FY19E FY20E
Net Debt (INR bn)

Strides Shasun
7 August 2017 27
With the addition of new entities and improvement in profitability in existing business, STR’s PAT multiplied 4x over FY14-17. Including API business, we expect robust 42% CAGR in adjusted PAT over FY17-20 to INR8.2b, led by revenue growth, improved operating efficiency, reduction in finance cost, and lower tax rate.
Exhibit 37: We expect 42% CAGR in adjusted PAT from continuing operations
Note: The trend includes API business, which would be transferred to Solara; Source: MOSL, Company
We expect RoE to improve from 10.7% in FY17 to 21% by FY20.
Exhibit 38: We expect sharp improvement in return ratios
Source: MOSL, Company
Exhibit 39: Free Cash Flow to equity to trend upward
Source: MOSL, Company
The free cash flow to equity (FCFE) has been volatile over FY14-17, largely due to multiple corporate actions in terms of acquisition/divestment of business. We expect FCFE to trend upward, despite decrease in net borrowings, due to better operating cash flow and nominal maintenance capex going forward.
0.7 1.0 1.4
2.9
4.2
6.7
8.2
FY14 FY15 FY16 FY17 FY18E FY19E FY20E
Adj. PAT from continuing operations (INR bn)
1.4 4.3
9.4 7.3
10.7
14.7
20.1 21.0
2.7 4.9
7.3 6.5 7.8 9.2 12.2 13.7
CY12
FY14
FY15
FY16
FY17
FY18
E
FY19
E
FY20
E
ROE ROCE
-5,927
1,636
19,572
3,982
-455
787 2,873
FY14
FY15
FY16
FY17
FY18
E
FY19
E
FY20
E
Free Cash Flow to Equity (INR m)

Strides Shasun
7 August 2017 28
Sensitivity analysis indicates limited downside
In our base case, we factor in 21.5% revenue CAGR to INR62b and 42% PATCAGR to INR8.2b over FY17-20, led by increased business from the US andAustralia. We expect EBITDA margin to expand 214bp over FY17-20 due toincreased share of high margin business and higher operating efficiency.
In our bull case, we factor in 26% revenue CAGR to INR70b and 49% PAT CAGRto INR9.7b over FY17-20, led by faster pace of approvals and lower price erosionfrom the US and superior execution in Australia. We expect EBITDA margin toexpand 288bp over FY17-20. The price target based on SOTP would be INR1,678,implying 60% upside.
In our bear case, we factor in 17% revenue CAGR to INR56b and 33% PAT CAGRto INR6.8b over FY17-20, led by delay in approvals and higher price erosion inthe US, and delay in ramping Australia business. We expect EBITDA margin toexpand 134bp over FY17-20. The price target on SOTP would be INR995,implying limited downside.
Exhibit 40: Sensitivity analysis implies limited downside from current levels Sensitivity Analysis Bear Case Base Case Bull Case
Revenue (INR m) 49,104 54,479 58,934 EBITDA (INR m) 9,428 11,032 12,140 EBITDA margin % 19.2% 20.3% 20.6% PBT (INR m) 6,798 8,537 9,756 Tax rate (%) 15.8 15.8 15.8 PAT (INR m) 5,223 6,687 7,714 EPS 58.5 74.8 86.3 Target Price 995 1,300 1,678 % Return -9% 30% 60%
Source: MOSL, Company

Strides Shasun
7 August 2017 29
Valuation and view
We believe STR is set for strong earnings growth over the next 2-3 years. Over the last three years, it has invested significantly to build pillars of future growth: Integrated R&D capabilities to develop complex generics for regulated markets Vertical integration of manufacturing facilities to reduce external dependency
for key raw materials Strong compliance culture to reduce regulatory risk Increased automation to improve efficiency and reduce compliance-related
errors Presence in diversified markets to reduce geography specific risk Continued focus on branded generics
With significant part of the investments already made, we believe STR is poised for strong improvement in return ratios. Including API business, we expect 21.5% sales CAGR, 26% EBITDA CAGR, and 42% PAT CAGR over FY17-20.
We value STR on sum-of-the-parts (SOTP), valuing the pharma business at 18x FY19E earnings (industry average P/E multiple for midcap pharma) and Solara at an EV of 13x FY19E EBITDA to arrive at a price target of INR1,300, implying 30% upside from current levels. We believe there is significant value accretion in STR’s API business on the back of niche APIs and sound compliance track record, which would drive robust growth in sales and superior margins compared to commodity API business. Hence, we ascribe 40% premium multiple to Solara at 13x EV/EBITDA. We initiate coverage with a Buy rating.
Exhibit 41: Valuation snapshot Particulars FY19
Valuation of Strides Pharma
Strides Pharma PAT (INR m) 5,412
PE multiple (x) 18
Target Mkt Cap (INR m) 97,414
Valuation of Solara
API business EBITDA (INR m) 2,719
EV/EBITDA multiple 13
EV of API business 35,347
Net Debt of API business (INR m) 4500
Stake of Strides Pharma (%) 60
Target Mkt Cap (INR m) 18,508
Total target Mkt Cap (INR m) 115,922
No. of shares 89.4
Target Price (INR) 1,300
% Upside 30.0
Source: MOSL, Company

Strides Shasun
7 August 2017 30
Key risks Delay in ANDA approval may result in lower growth in US business. Higher than
expected price erosion in approved products could put earnings at risk. Higher than expected pricing pressure in Australia and India might result in
lower than expected growth in these markets. Lower donor funding could impact growth in institutional business.
Exhibit 42: Comparative valuations (INR b) MCap Sales EBITDA margin (%) PAT P/E (x) RoE (%) INR b FY17 FY18E FY19E FY17 FY18E FY19E FY17 FY18E FY19E FY17 FY18E FY19E FY17 FY18E FY19E
Ajanta 117.8 20.0 22.6 27.4 34.9 34.7 34.2 5.2 5.8 7.0 24.1 21.3 17.7 37.7 32.2 29.9 Natco 165.5 20.7 26.0 23.8 33.1 37.5 28.1 4.9 6.0 4.2 35.3 34.8 27.5 32.9 25.0 24.3 Alembic 99.9 31.0 32.5 37.2 19.7 18 19.5 4.1 3.9 4.8 25.1 26.5 21.3 23.0 19.0 20.4 Jubilant 112.0 60.1 65.9 72.9 22.4 23.9 24.3 5.8 7.3 8.8 19.8 15.6 12.9 18.1 19.5 19.6 Torrent 212.3 58.6 65.4 76.1 23.5 23.3 24.5 9.3 9.6 12.1 23.0 22.4 17.8 25.3 22.4 24.2 Strides 89.9 34.8 43.9 54.5 18.5 19.0 20.3 2.9 4.2 6.7 31.0 21.1 13.4 10.7 14.7 20.1
Source: Company, MOSL

Strides Shasun
7 August 2017 31
Exhibit 43: STR has appreciated at 30% CAGR over the past nine years (adjusting for dividend)
Source: MOSL, Company
0
200
400
600
800
1000
1200
1400
1600Ja
n-08
Apr-
08
Jul-0
8
Oct
-08
Jan-
09
Apr-
09
Jul-0
9
Oct
-09
Jan-
10
Apr-
10
Jul-1
0
Oct
-10
Jan-
11
Apr-
11
Jul-1
1
Oct
-11
Jan-
12
Apr-
12
Jul-1
2
Oct
-12
Jan-
13
Apr-
13
Jul-1
3
Oct
-13
Jan-
14
Apr-
14
Jul-1
4
Oct
-14
Jan-
15
Apr-
15
Jul-1
5
Oct
-15
Jan-
16
Apr-
16
Jul-1
6
Oct
-16
Jan-
17
Apr-
17
Jul-1
7
Completed Sale of Agila
Announced special dividend of INR500
per share
Sale of Ascent Pharma
Annnounced Sale of Agila
Ex-Dividend Trading Price
MMV announces collaborations with
CIPLA & Strides
Acquisitons of Universal Corp in Kenya
Acquires generic pharma business from Aspen in Australia for A$380m
Announced merger with Shasun
JV with Vivimed for US FDA formulations
Facility
Hives off Commodity API business
Acquires 3 brands from Moberg Pharma for $10m
Acquires US FDA approved Perrigo's API
Facility
Investment & Acquisition Phase for STR Version 2.0

Strides Shasun
7 August 2017 32
Manufacturing facilities and USFDA inspection update
Exhibit 44: Manufacturing facilities as per business segment Business segment Facility used to cater respective market
Regulated Market
Bangalore FDF
Puducherry FDF
SingaporeFDF *
Vivimed Chennai facility #
Perrigo API facility
Emerging market Bangalore facility
Nairobi Kenya
Institutional business Bangalore
Nairobi Kenya *
Source: MOSL, Company

Strides Shasun
7 August 2017 33
About Strides Shasun
Strides Shasun (STR) is a first generation, vertically integrated global pharmaceuticals company, with business interests in differentiated pharma generics, branded generics, and biopharma. It develops niche and complex products for regulated and emerging markets.
Key personnel
Mr Arun Kumar – Founder & Chairman Mr Kumar has founded and led Strides for 27 years. He has moved to a non-executive position from May 18, 2017. He has been on the Board since the company’s inception in 1990. He holds a degree in Commerce.
Mr Shashank Sinha – Managing Director leadership positions at Godrej Consumer Products, Sara Lee Corporation, Reckitt Benckiser plc, and Navis Capital Partners. He has a Bachelor’s Degree in Engineering and received his MBA from the Indian Institute of Management, Lucknow.
Mr Badree Komandur – Executive Director and Group CFO positions in IT and Engineering companies like Larsen & Tubro. He holds a Degree in Commerce from the University of Madras and is a member of the Institute of Chartered Accountants of India, the Institute of Company Secretaries of India, and the Institute of Cost and Works Accountants of India.
Mr Ramaraju PVS – Chief Operating Officer experience in the pharmaceutical industry, and specializes in Manufacturing, Quality, Engineering, Sourcing, Warehouse, Distribution and Planning Functions. Prior to joining Strides, he worked with organizations like Dr Reddy’s for over a decade, USV, and Unichem. He is MTech in Pharma Chemistry from BITS, Pilani.
Mr Umesh Kale – Chief Quality Officer Mr Umesh Kale has over 24 years of experience in the Pharma industry and has been with Strides for more than 10 years. He is responsible for quality governance of the entire organization. He specializes in Qualification, Process Validation, Aseptic Processing, QMS and Automation. Before joining Strides, he worked with organizations like Nicholas Piramal, FDC, Lupin, Dr Reddy’s and Ranbaxy. He is an MPharm (gold medalist) from SGS Institute of Technology and Science, Indore.

Strides Shasun
7 August 2017 34
Financials and Valuations
Consolidated - Income Statement (INR Million) Y/E March CY12 FY14 FY15 FY16 FY17 FY18E FY19E FY20E Total Income from Operations 9,618 13,410 11,959 28,622 34,834 43,898 54,479 62,414 Change (%) -62.3 39.4 -10.8 139.3 21.7 26.0 24.1 14.6 Raw Materials 4,918 7,147 5,605 15,023 15,362 19,271 23,753 27,088 Employees Cost 1,203 1,572 1,721 3,577 5,881 7,287 8,880 10,111 Other Expenses 2,490 2,457 2,345 5,883 7,163 8,999 10,814 12,358 Total Expenditure 8,612 11,175 9,670 24,483 28,406 35,557 43,447 49,557
% of Sales 89.5 83.3 80.9 85.5 81.5 81.0 79.8 79.4 EBITDA 1,006 2,235 2,288 4,139 6,428 8,341 11,032 12,857 Margin (%) 10.5 16.7 19.1 14.5 18.5 19.0 20.3 20.6 Depreciation 309 565 640 1,313 1,872 2,068 2,171 2,247 EBIT 697 1,670 1,648 2,827 4,557 6,273 8,861 10,610 Int. and Finance Charges 795 1,089 474 1,682 2,269 1,993 1,686 1,527 Other Income 342 602 386 921 1,686 1,317 1,362 1,311 PBT bef. EO Exp. 245 1,183 1,560 2,066 3,973 5,597 8,537 10,393 EO Items 7,001 -266 -74 -461 -1,002 0 0 0 PBT after EO Exp. 7,246 918 1,486 1,606 2,971 5,597 8,537 10,393 Total Tax 112 409 532 425 470 885 1,350 1,644 Tax Rate (%) 1.5 44.5 35.8 26.4 15.8 15.8 15.8 15.8 Minority Interest 11 6 -6 135 462 476 500 525 Tax on dividend received from subsidiries 0 2,837 944 0 0 0 0 0 Reported PAT from Continuing Ops. 7,123 -2,333 16 1,046 2,039 4,236 6,687 8,225 Adj. PAT from Continuing Ops. 230 651 1,007 1,385 2,883 4,236 6,687 8,225 Change (%) -87.4 182.9 54.7 37.5 108.2 46.9 57.9 23.0 Margin (%) 2.4 4.9 8.4 4.8 8.3 9.6 12.3 13.2
Consolidated - Balance Sheet (INR Million) Y/E March CY12 FY14 FY15 FY16 FY17 FY18E FY19E FY20E Equity Share Capital 588 596 596 894 894 894 894 894 Total Reserves 19,675 9,473 10,853 25,685 26,210 29,627 35,019 41,653 Net Worth 20,263 10,068 11,449 26,579 27,104 30,520 35,913 42,546 Minority Interest 719 757 187 502 1,640 1,640 1,640 1,640 Total Loans 15,945 5,466 8,917 38,025 42,232 39,107 35,832 32,057 Deferred Tax Liabilities 272 17 -54 126 557 557 557 557 Capital Employed 37,198 16,308 20,500 65,232 71,532 71,823 73,941 76,799
Gross Block 18,240 8,039 9,437 28,578 32,901 35,017 36,304 37,515 Less: Accum. Deprn. 4,976 3,528 3,792 5,104 6,976 9,043 11,214 13,462 Net Fixed Assets 13,264 4,511 5,645 23,474 25,925 25,973 25,089 24,053 Goodwill on Consolidation 16,903 1,034 1,368 9,267 9,670 9,670 9,670 9,670 Capital WIP 2,415 995 1,712 2,942 2,045 889 754 759 Total Investments 1 4,430 6,300 13,085 15,897 15,897 14,997 14,997
Curr. Assets, Loans&Adv. 15,378 9,993 9,668 25,462 27,335 31,101 37,781 43,703 Inventory 4,423 1,760 2,077 6,131 7,380 9,238 11,287 12,875 Account Receivables 4,832 3,640 3,900 10,330 9,971 12,565 15,593 17,865 Cash and Bank Balance 1,658 2,312 1,469 3,116 3,295 869 438 978 Loans and Advances 4,465 2,281 2,223 5,885 6,690 8,430 10,462 11,986 Curr. Liability & Prov. 10,762 4,655 4,194 8,998 9,340 11,707 14,350 16,383 Account Payables 4,631 2,679 2,065 7,754 7,465 9,345 11,418 13,024 Other Current Liabilities 4,733 879 1,268 950 1,445 1,820 2,259 2,588 Provisions 1,399 1,098 861 294 430 542 673 771 Net Current Assets 4,616 5,338 5,474 16,464 17,995 19,394 23,431 27,321 Appl. of Funds 37,198 16,308 20,500 65,232 71,531 71,823 73,941 76,799 E: MOSL Estimates

Strides Shasun
7 August 2017 35
Financials and Valuations Ratios Y/E March CY12 FY14 FY15 FY16 FY17 FY18E FY19E FY20E Basic (INR) EPS 2.6 7.3 11.3 15.5 32.3 47.4 74.8 92.1 Cash EPS 6.0 13.6 18.4 30.2 53.2 70.5 99.1 117.2 BV/Share 226.8 112.7 128.1 297.5 303.3 341.6 401.9 476.2 DPS 1.3 336.8 72.0 4.8 3.7 7.6 12.0 14.7 Payout (%) 1.9 -1,410.0 43,880.3 49.1 19.3 19.3 19.3 19.3 Valuation (x) P/E 88.8 64.5 31.0 21.1 13.4 10.9 Cash P/E 54.2 33.1 18.8 14.2 10.1 8.5 P/BV 7.8 3.4 3.3 2.9 2.5 2.1 EV/Sales 8.1 4.3 3.7 2.9 2.3 1.9 EV/EBITDA 42.3 30.0 20.0 15.3 11.3 9.4 Dividend Yield (%) 0.1 33.7 7.2 0.5 0.4 0.8 1.2 1.5 FCF per share -21.7 -82.3 -17.6 8.4 -2.5 29.9 45.5 74.4 Return Ratios (%) RoE 1.4 4.3 9.4 7.3 10.7 14.7 20.1 21.0 RoCE 2.7 4.9 7.3 6.5 7.8 9.2 12.2 13.7 RoIC 2.0 4.4 10.8 7.3 8.0 10.1 13.3 15.2 Working Capital Ratios Fixed Asset Turnover (x) 0.5 1.7 1.3 1.0 1.1 1.3 1.5 1.7 Asset Turnover (x) 0.3 0.8 0.6 0.4 0.5 0.6 0.7 0.8 Inventory (Days) 168 48 63 78 77 77 76 75 Debtor (Days) 183 99 119 132 104 104 104 104 Creditor (Days) 176 73 63 99 78 78 76 76 Leverage Ratio (x) Current Ratio 1.4 2.1 2.3 2.8 2.9 2.7 2.6 2.7 Interest Cover Ratio 0.9 1.5 3.5 1.7 2.0 3.1 5.3 6.9 Net Debt/Equity 0.7 -0.1 0.1 0.8 0.9 0.7 0.6 0.4
Consolidated - Cash Flow Statement (INR Million) Y/E March CY12 FY14 FY15 FY16 FY17 FY18E FY19E FY20E OP/(Loss) before Tax 9,495 28,899 9,920 2,678 3,973 5,597 8,537 10,393 Depreciation 1,095 1,539 640 1,573 1,872 2,068 2,171 2,247 Interest & Finance Charges 1,523 1,835 163 1,001 584 676 324 217 Direct Taxes Paid -888 -1,259 -560 -770 -470 -885 -1,350 -1,644(Inc)/Dec in WC -3,105 -2,607 -959 -3,424 -1,352 -3,826 -4,467 -3,350CF from Operations 8,121 28,407 9,205 1,058 4,606 3,630 5,214 7,864 Others -6,732 -31,124 -8,371 -341 -1,002 0 0 0 CF from Operating incl EO 1,389 -2,717 834 717 3,604 3,630 5,214 7,864 (Inc)/Dec in FA -3,331 -4,639 -2,406 34 -3,828 -960 -1,152 -1,216Free Cash Flow -1,942 -7,356 -1,572 750 -224 2,670 4,062 6,648 (Pur)/Sale of Investments 11,054 47,935 4,515 312 -2,812 0 900 0 Others -151 -6,739 427 -28,911 1,686 1,317 1,362 1,311 CF from Investments 7,572 36,556 2,536 -28,565 -4,954 357 1,110 95 Issue of Shares 89 259 31 12,264 0 0 0 0 Inc/(Dec) in Debt -7,877 1,430 3,208 18,822 4,206 -3,125 -3,275 -3,775Interest Paid -1,976 -2,192 -381 -1,347 -2,269 -1,993 -1,686 -1,527Dividend Paid -137 -32,683 -7,070 -251 -395 -820 -1,294 -1,592Others 0 0 0 8 -13 -476 -500 -525CF from Fin. Activity -9,900 -33,185 -4,213 29,495 1,529 -6,413 -6,755 -7,419Inc/Dec of Cash -940 654 -843 1,647 179 -2,427 -430 540 Opening Balance 2,597 1,657 2,312 1,469 3,116 3,295 869 438 Closing Balance 1,657 2,312 1,469 3,116 3,295 869 438 978

Strides Shasun
7 August 2017 36
N O T E S

RECENT INITIATING COVERAGE REPORTS
`
REPORT GALLERY

Company name
1 August 2017 4
Disclosures: The following Disclosures are being made in compliance with the SEBI Research Analyst Regulations 2014 (herein after referred to as the Regulations).
Motilal Oswal Securities Ltd. (MOSL) is a SEBI Registered Research Analyst having registration no. INH000000412. MOSL, the Research Entity (RE) as defined in the Regulations, is engaged in the business of providing Stock broking services, Investment Advisory Services, Depository participant services & distribution of various financial products. MOSL is a subsidiary company of Motilal Oswal Financial Service Ltd. (MOFSL). MOFSL is a listed public company, the details in respect of which are available on www.motilaloswal.com. MOSL is registered with the Securities & Exchange Board of India (SEBI) and is a registered Trading Member with National Stock Exchange of India Ltd. (NSE) and Bombay Stock Exchange Limited (BSE), Metropolitan Stock Exchange Of India Ltd. (MSE) for its stock broking activities & is Depository participant with Central Depository Services Limited (CDSL) & National Securities Depository Limited (NSDL) and is member of Association of Mutual Funds of India (AMFI) for distribution of financial products. Details of associate entities of Motilal Oswal Securities Limited are available on the website at http://onlinereports.motilaloswal.com/Dormant/documents/Associate%20Details.pdf
Pending Regulatory Enquiries against Motilal Oswal Securities Limited by SEBI: SEBI pursuant to a complaint from client Shri C.R. Mohanraj alleging unauthorized trading, issued a letter dated 29th April 2014 to MOSL notifying appointment of an Adjudicating Officer as per SEBI regulations to hold inquiry and adjudge violation of SEBI Regulations; MOSL requested SEBI to provide all documents, records, investigation report relied upon by SEBI which were referred in Show Cause Notice and also sought personal hearing. The matter is currently pending. MOSL, it’s associates, Research Analyst or their relative may have any financial interest in the subject company. MOSL and/or its associates and/or Research Analyst may have beneficial ownership of 1% or more securities in the subject company at the end of the month immediately preceding the date of publication of the Research Report. MOSL and its associate company(ies), their directors and Research Analyst and their relatives may; (a) from time to time, have a long or short position in, act as principal in, and buy or sell the securities or derivatives thereof of companies mentioned herein. (b) be engaged in any other transaction involving such securities and earn brokerage or other compensation or act as a market maker in the financial instruments of the company(ies) discussed herein or act as an advisor or lender/borrower to such company(ies) or may have any other potential conflict of interests with respect to any recommendation and other related information and opinions.; however the same shall have no bearing whatsoever on the specific recommendations made by the analyst(s), as the recommendations made by the analyst(s) are completely independent of the views of the associates of MOSL even though there might exist an inherent conflict of interest in some of the stocks mentioned in the research report. Research Analyst may have served as director/officer, etc. in the subject company in the last 12 month period. MOSL and/or its associates may have received any compensation from the subject company in the past 12 months.
In the last 12 months period ending on the last day of the month immediately preceding the date of publication of this research report, MOSL or any of its associates may have: a) managed or co-managed public offering of securities from subject company of this research report,b) received compensation for investment banking or merchant banking or brokerage services from subject company of this research report,c) received compensation for products or services other than investment banking or merchant banking or brokerage services from the subject company of this research report.d) Subject Company may have been a client of MOSL or its associates during twelve months preceding the date of distribution of the research report.
MOSL and it’s associates have not received any compensation or other benefits from the subject company or third party in connection with the research report. To enhance transparency, MOSL has incorporated a Disclosure of Interest Statement in this document. This should, however, not be treated as endorsement of the views expressed in the report. MOSL and / or its affiliates do and seek to do business including investment banking with companies covered in its research reports. As a result, the recipients of this report should be aware that MOSL may have a potential conflict of interest that may affect the objectivity of this report. Compensation of Research Analysts is not based on any specific merchant banking, investment banking or brokerage service transactions.
Terms & Conditions: This report has been prepared by MOSL and is meant for sole use by the recipient and not for circulation. The report and information contained herein is strictly confidential and may not be altered in any way, transmitted to, copied or distributed, in part or in whole, to any other person or to the media or reproduced in any form, without prior written consent of MOSL. The report is based on the facts, figures and information that are considered true, correct, reliable and accurate. The intent of this report is not recommendatory in nature. The information is obtained from publicly available media or other sources believed to be reliable. Such information has not been independently verified and no guaranty, representation of warranty, express or implied, is made as to its accuracy, completeness or correctness. All such information and opinions are subject to change without notice. The report is prepared solely for informational purpose and does not constitute an offer document or solicitation of offer to buy or sell or subscribe for securities or other financial instruments for the clients. Though disseminated to all the customers simultaneously, not all customers may receive this report at the same time. MOSL will not treat recipients as customers by virtue of their receiving this report. Analyst Certification The views expressed in this research report accurately reflect the personal views of the analyst(s) about the subject securities or issues, and no part of the compensation of the research analyst(s) was, is, or will be directly or indirectly related to the specific recommendations and views expressed by research analyst(s) in this report.
Disclosure of Interest Statement Strides Shasun Analyst ownership of the stock No A graph of daily closing prices of securities is available at www.nseindia.com, www.bseindia.com. Research Analyst views on Subject Company may vary based on Fundamental research and Technical Research. Proprietary trading desk of MOSL or its associates maintains arm’s length distance with Research Team as all the activities are segregated from MOSL research activity and therefore it can have an independent view with regards to subject company for which Research Team have expressed their views.
Regional Disclosures (outside India) This report is not directed or intended for distribution to or use by any person or entity resident in a state, country or any jurisdiction, where such distribution, publication, availability or use would be contrary to law, regulation or which would subject MOSL & its group companies to registration or licensing requirements within such jurisdictions.
For Hong Kong: This report is distributed in Hong Kong by Motilal Oswal capital Markets (Hong Kong) Private Limited, a licensed corporation (CE AYY-301) licensed and regulated by the Hong Kong Securities and Futures Commission (SFC) pursuant to the Securities and Futures Ordinance (Chapter 571 of the Laws of Hong Kong) “SFO”. As per SEBI (Research Analyst Regulations) 2014 Motilal Oswal Securities (SEBI Reg No. INH000000412) has an agreement with Motilal Oswal capital Markets (Hong Kong) Private Limited for distribution of research report in Hong Kong. This report is intended for distribution only to “Professional Investors” as defined in Part I of Schedule 1 to SFO. Any investment or investment activity to which this document relates is only available to professional investor and will be engaged only with professional investors.” Nothing here is an offer or solicitation of these securities, products and services in any jurisdiction where their offer or sale is not qualified or exempt from registration. The Indian Analyst(s) who compile this report is/are not located in Hong Kong & are not conducting Research Analysis in Hong Kong.
For U.S. Motilal Oswal Securities Limited (MOSL) is not a registered broker - dealer under the U.S. Securities Exchange Act of 1934, as amended (the"1934 act") and under applicable state laws in the United States. In addition MOSL is not a registered investment adviser under the U.S. Investment Advisers Act of 1940, as amended (the "Advisers Act" and together with the 1934 Act, the "Acts), and under applicable state laws in the United States. Accordingly, in the absence of specific exemption under the Acts, any brokerage and investment services provided by MOSL, including the products and services described herein are not available to or intended for U.S. persons. This report is intended for distribution only to "Major Institutional Investors" as defined by Rule 15a-6(b)(4) of the Exchange Act and interpretations thereof by SEC (henceforth referred to as "major institutional investors"). This document must not be acted on or relied on by persons who are not major institutional investors. Any investment or investment activity to which this document relates is only available to major institutional investors and will be engaged in only with major institutional investors. In reliance on the exemption from registration provided by Rule 15a-6 of the U.S. Securities Exchange Act of 1934, as amended (the "Exchange Act") and interpretations thereof by the U.S. Securities and Exchange Commission ("SEC") in order to conduct business with Institutional Investors based in the U.S., MOSL has entered into a chaperoning agreement with a U.S. registered broker-dealer, Motilal Oswal Securities International Private Limited. ("MOSIPL"). Any business interaction pursuant to this report will have to be executed within the provisions of this chaperoning agreement.
The Research Analysts contributing to the report may not be registered /qualified as research analyst with FINRA. Such research analyst may not be associated persons of the U.S. registered broker-dealer, MOSIPL, and therefore, may not be subject to NASD rule 2711 and NYSE Rule 472 restrictions on communication with a subject company, public appearances and trading securities held by a research analyst account.
For Singapore Motilal Oswal Capital Markets Singapore Pte Limited is acting as an exempt financial advisor under section 23(1)(f) of the Financial Advisers Act(FAA) read with regulation 17(1)(d) of the Financial Advisors Regulations and is a subsidiary of Motilal Oswal Securities Limited in India. This research is distributed in Singapore by Motilal Oswal Capital Markets Singapore Pte Limited and it is only directed in Singapore to accredited investors, as defined in the Financial Advisers Regulations and the Securities and Futures Act (Chapter 289), as amended from time to time. In respect of any matter arising from or in connection with the research you could contact the following representatives of Motilal Oswal Capital Markets Singapore Pte Limited:
Disclaimer: The report and information contained herein is strictly confidential and meant solely for the selected recipient and may not be altered in any way, transmitted to, copied or distributed, in part or in whole, to any other person or to the media or reproduced in any form, without prior written consent. This report and information herein is solely for informational purpose and may not be used or considered as an offer document or solicitation of offer to buy or sell or subscribe for securities or other financial instruments. Nothing in this report constitutes investment, legal, accounting and tax advice or a representation that any investment or strategy is suitable or appropriate to your specific circumstances. The securities discussed and opinions expressed in this report may not be suitable for all investors, who must make their own investment decisions, based on their own investment objectives, financial positions and needs of specific recipient. This may not be taken in substitution for the exercise of independent judgment by any recipient. Each recipient of this document should make such investigations as it deems necessary to arrive at an independent evaluation of an investment in the securities of companies referred to in this document (including the merits and risks involved), and should consult its own advisors to determine the merits and risks of such an investment. The investment discussed or views expressed may not be suitable for all investors. Certain transactions -including those involving futures, options, another derivative products as well as non-investment grade securities - involve substantial risk and are not suitable for all investors. No representation or warranty, express or implied, is made as to the accuracy, completeness or fairness of the information and opinions contained in this document. The Disclosures of Interest Statement incorporated in this document is provided solely to enhance the transparency and should not be treated as endorsement of the views expressed in the report. This information is subject to change without any prior notice. The Company reserves the right to make modifications and alternations to this statement as may be required from time to time without any prior approval. MOSL, its associates, their directors and the employees may from time to time, effect or have effected an own account transaction in, or deal as principal or agent in or for the securities mentioned in this document. They may perform or seek to perform investment banking or other services for, or solicit investment banking or other business from, any company referred to in this report. Each of these entities functions as a separate, distinct and independent of each other. The recipient should take this into account before interpreting the document. This report has been prepared on the basis of information that is already available in publicly accessible media or developed through analysis of MOSL. The views expressed are those of the analyst, and the Company may or may not subscribe to all the views expressed therein. This document is being supplied to you solely for your information and may not be reproduced, redistributed or passed on, directly or indirectly, to any other person or published, copied, in whole or in part, for any purpose. This report is not directed or intended for distribution to, or use by, any person or entity who is a citizen or resident of or located in any locality, state, country or other jurisdiction, where such distribution, publication, availability or use would be contrary to law, regulation or which would subject MOSL to any registration or licensing requirement within such jurisdiction. The securities described herein may or may not be eligible for sale in all jurisdictions or to certain category of investors. Persons in whose possession this document may come are required to inform themselves of and to observe such restriction. Neither the Firm, not its directors, employees, agents or representatives shall be liable for any damages whether direct or indirect, incidental, special or consequential including lost revenue or lost profits that may arise from or in connection with the use of the information. The person accessing this information specifically agrees to exempt MOSL or any of its affiliates or employees from, any and all responsibility/liability arising from such misuse and agrees not to hold MOSL or any of its affiliates or employees responsible for any such misuse and further agrees to hold MOSL or any of its affiliates or employees free and harmless from all losses, costs, damages, expenses that may be suffered by the person accessing this information due to any errors and delays.
Registered Office Address: Motilal Oswal Tower, Rahimtullah Sayani Road, Opposite Parel ST Depot, Prabhadevi, Mumbai-400025; Tel No.: 022-3980 4263; www.motilaloswal.com. Correspondence Address: Palm Spring Centre, 2nd Floor, Palm Court Complex, New Link Road, Malad (West), Mumbai- 400 064. Tel No: 022 3080 1000. Compliance Officer: Neeraj Agarwal, Email Id: [email protected], Contact No.:022-30801085.
Registration details of group entities.: MOSL: NSE (Cash): INB231041238; NSE (F&O): INF231041238; NSE (CD): INE231041238; BSE (Cash): INB011041257; BSE(F&O): INF011041257; BSE(CD); MSE(Cash): INB261041231; MSE(F&O): INF261041231; MSE(CD): INE261041231; CDSL: IN-DP-16-2015; NSDL: IN-DP-NSDL-152-2000; Research Analyst: INH000000412. AMFI: ARN 17397. Investment Adviser: INA000007100. Motilal Oswal Asset Management Company Ltd. (MOAMC): PMS (Registration No.: INP000000670) offers PMS and Mutual Funds products. Motilal Oswal Wealth Management Ltd. (MOWML): PMS (Registration No.: INP000004409) offers wealth management solutions. *Motilal Oswal Securities Ltd. is a distributor of Mutual Funds, PMS, Fixed Deposit, Bond, NCDs, Insurance and IPO products. * Motilal Oswal Commodities Broker Pvt. Ltd. offers Commodities Products. * Motilal Oswal Real Estate Investment Advisors II Pvt. Ltd. offers Real Estate products. * Motilal Oswal Private Equity Investment Advisors Pvt. Ltd. offers Private Equity products