Embed Size (px)
Citation preview
Injection and Mixing of Gas Propellants forPulse Detonation Propulsion
Dora Elia Musielak*Mechanical and Aerospace Engineering Department
University of Texas at Arlington (UTA)Arlington, Texas, USA
Detonation has received attention of late because of its role as the primary combustionmechanism in rocket and airbreathing Pulse Detonation Engines (PDEs). However, there aremany unresolved issues related to the proper utilization of detonation combustion in theseapplications. The detonation process has been studied predominantly under the assumption ofpremixed gases. However, the unsteady nature of PDEs requires relatively small tunes to injectand mix the propellants prior to each cyclic detonation; and this condition is difficult to achieveexperimentally. This paper addresses the injection and mixing processes, and presents new dataaimed at supporting the development of practical PDEs. Results are given to illustrate the mixingcharacteristics of fuel-oxidizer mixtures, modeled with a CFD combustion code.
1 INTRODUCTION
A Pulse Detonation Engine (PDE) is apropulsion system which operates on theprinciple of cyclic detonation combustion.Fuel-air or fuel-oxidizer mixtures areintroduced into the PDE's combustionchamber and an appropriate ignition systemis used to induce a detonation. The relevantenergy produced by the intermittentdetonation process is extracted forpropulsion. The main advantage of the PDEis that the combustion process itself is veryfast, higher pressures and temperatures canbe achieved hi the detonation chamber, andlarge power densities can be derived. Themain goal for development of PDEpropulsion is to increase the detonation
frequency of the engine, hi order to achievehigher levels of thrust.
Although detonation combustion hasbeen studied for many years, attempts toutilize detonations for practical propulsionsystems are relatively recent. Researcherslike Bussing and his team at ASI started withshock-tube experiments for the developmentof PDEs1, and later reported a practicalimplementation of multi-cycle detonationchambers2. Wilson and researchers at UTAhave developed single and multi-cycledetonation combustion with various fuel-oxidizer mixtures3'5. Eidelman6 has patentedPDE concepts and has reported results fromexperimental and computational detonationcombustion. Other groups hi the USA andabroad are known to have developed pulsed
Assistant Professor, AIAA MemberCopyright © 1998 by the autor. Published by the American Institute of Aeronautics and Astronautics, Inc., withpermission.
detonation combustion for variousapplications.
Thus, it appears as if the feasibility ofutilizing intermittent detonation combustionhas already being demonstrated, however,considerable more work is needed to developan efficient airbreathing or rocket-type PDEoperating at competitive thrust levels. Agreat deal of work has been done alreadywith single-shock experiments in detonationrubes, but not nearly enough withfrequency-controlled or cyclic-detonations.This is because detonating propellantmixtures and controlling the detonations toproduce thrust in a propulsion systemrequires more than knowledge of thedetonation process itself. Even thoughseveral investigators2'6 have reportedsuccessful operation of detonation chambersat frequencies over 100 Hz, very little hasbeen reported on the detonation combustionand gas dynamics characteristics of suchdevices. Experimentally, for example,promoting continuous detonations andextracting the energy for thrust remains achallenge. Concluding statements tocharacterize successful detonation at highfrequencies has been derived mainly frompressure data, and in some cases, detonationvelocities have also been measured withquestionable results. It is believed thatdifficulties in attempting to study andcharacterize the performance of PDEs havebeen caused by inadequate detonationinitiation energy2.
Information on the gas dynamics andreactants mixing characteristics inside thevarious PDEs being developed is lacking. Itis well recognized that injection ofpropellants into the detonation chamber andopening of valves, for example, requires acertain amount of time, and this time isdependent on the frequency of operation of
the engine. Most of the PDE performanceanalysis reported to date is based on theassumption of complete instantaneousmixing, which is impossible to achieveexperimentally. Thus, unsatisfactoryexperimental results in many cases could beattributed to poor fuel/oxidizer mixing.
Results from numerical simulations arealso scarce. This is due to the rather slowdevelopment of computer codes that cancalculate the detonation combustionequations, and model the various coupledprocesses in a PDE. Unsteady detonationwaves are difficult to compute because thechemistry equations are very stiff, and inspite of model simplifications, the results arestill inadequate. Steady detonation wavesare also computationally stiff, but not nearlyas much as unsteady ones, thus, steadydetonation waves can and have already beenmodeled with various codes, using a semi-implicit treatment of the chemical reactionterms in the governing equations. Withunsteady detonation waves and highamounts of heat release, the semi-implicittreatment is insufficient and a fully implicittreatment is needed. Unfortunately thiscannot be done with many of the availablecodes. One can still use some of the mostadvanced combustion computer programsfor unsteady detonation waves, but the CFLnumber must be set very small, which makescomputational times prohibitively large.Encouraging results have been obtained bythe author in the simulation of shock-induced combustion with a Navier-Stokescode which incorporates a multi-species,multi-equation kinetics model. Predictions ofthe reaction process in the thin zone of theshock were obtained. It was found that,upon injection, the shock wave created asudden temperature rise above the ignitiontemperature of the fuel, resulting in chemical
reaction. The level of combustion wasdetermined by the production of H2O andOH radicals near the injection zone7.
This paper reports work in progressusing a computational approach to describethe fluid dynamics coupled to the detonationcombustion processes. In this paper, dataare presented on the flow fieldcharacteristics in detonation chambers, andon the mixing profiles of hydrogen-oxygenmixtures simulating injection schemesrelevant to PDEs. This work is aimed tosupport the study of detonationcombustion. Ultimately, knowledge gatheredfrom this research can be used to predictinjection and mixing characteristics ofreactants other than hydrogen-oxygen, andthat can be useful in the design of PDEs.
2 PHYSICAL PROCESSES
There are many processes involved in theflow phenomena associated with a pulsedetonation engine. For example, injection andmixing of reactants, ignition of the mixture,initiation/propagation of the detonationwave inside the combustion chamber,expansion of detonation products from thechamber prior to a new cycle, all areprocesses that affect the performance of aPDE. These processes are interdependent,and their interaction and timing are crucial toengine efficiency6. Strategies for PDEperformance optimization have includedstudies of recharge timing, ignition, andnozzle area variation4' 8. However, mostPDE studies reported to date assumedetonation combustion to occur within aperfect detonation chamber, i.e., one whereinfinitely fast mixing of the reactants occurs.In practice, the fuel and oxidizer are injectedinto a detonation chamber as separate
streams, with different injection conditions.Mixing is therefore not instantaneous.
In addition to the parameters thatgovern any combustion process, there areothers that are very important for thedevelopment of a practical PDE. Theseparameters include detonation limits,initiation energy, critical chamber diameter,quenching diameters, and thickness of thesupporting reaction zone. Knowledge of thewave structure and, thus, chemical reactionrates is needed to quantify and qualify theseparameters in the framework of a PDE.
For practical airbreathing PDEs, thedetonability of mixtures of hydrocarbonfuels with air is of fundamental importance.The spatial scales for fuel-air detonationsand the amounts of energy required toinitiate the detonations are often very large.Also, prior to detonation, knowledge isneeded of the factors that control theinjection and mixing of the reactants, toestablish the flowfield characteristics hi thedetonation chamber, and to ensure uniformdistribution of the detonable mixture. This isbecause the mixture ratio determines thelevel of detonations that can be achieved, andthus the thrust that can be produced by aPDE.
Mixing different gaseous flows canimply a host of processes and phenomena.When mixing is viewed in the context ofchemical reactions and combustion, onlyfluid species mixed on a molecular scale cancontribute to chemical product formationand associated heat release. Mixing candictate the performance of a PDE, which isbelieved to relay on the details of theturbulent mixing process to ensure a highlyuniform detonable mixture prior to ignition.Thus, mixing studies can provide insight intothe fundamental interactions between the
fluid mechanics and chemical kineticproperties of detonation combustion.
It is estimated that it takesapproximately 20 percent of the PDE cycleto inject the propellant gases into the PDEchamber, before they are ignited anddetonated. This implies that, for a 100 HzPDE, the 20 percent cycle time translatesinto less than 2 msec available for mixing. Topromote rapid mixing and ensure shortinjection tunes, several injection approacheshave been proposed. It is the objective ofthis research to provide data to characterizethe mixing that is experimentally possiblewith those injection schemes. First, let usaddress the processes in the PDE cycle.
3 ENGINE CYCLE
A better understanding of thethermodynamics of the PDE cycle is needed,as well as the physical and detonabilitycharacteristics of the candidate fuels. Let usbegin with a review of the theory ofdetonation combustion and then proceed toexamine the thermodynamic cycle of thePDE.
The Zeldovich-vonNeumann-Doring(ZND) theory, for the structure of thedetonation, states that the detonation waveconsists of a planar shock moving at thedetonation velocity and leaving heated andcompressed gas behind it. After an inductionperiod, the chemical reaction starts and, asthe reaction progresses, the temperaturerises and the density and pressure fall untilthey reach the Chapman-Jouguet (C-J)values, and then the reaction attainsequilibrium9. A rarefaction wave then sets in.Thus, behind the C-J shock, energy isgenerated by thermal reaction. It must benoted here that detonation phenomena isdealt mainly with premixed gases.
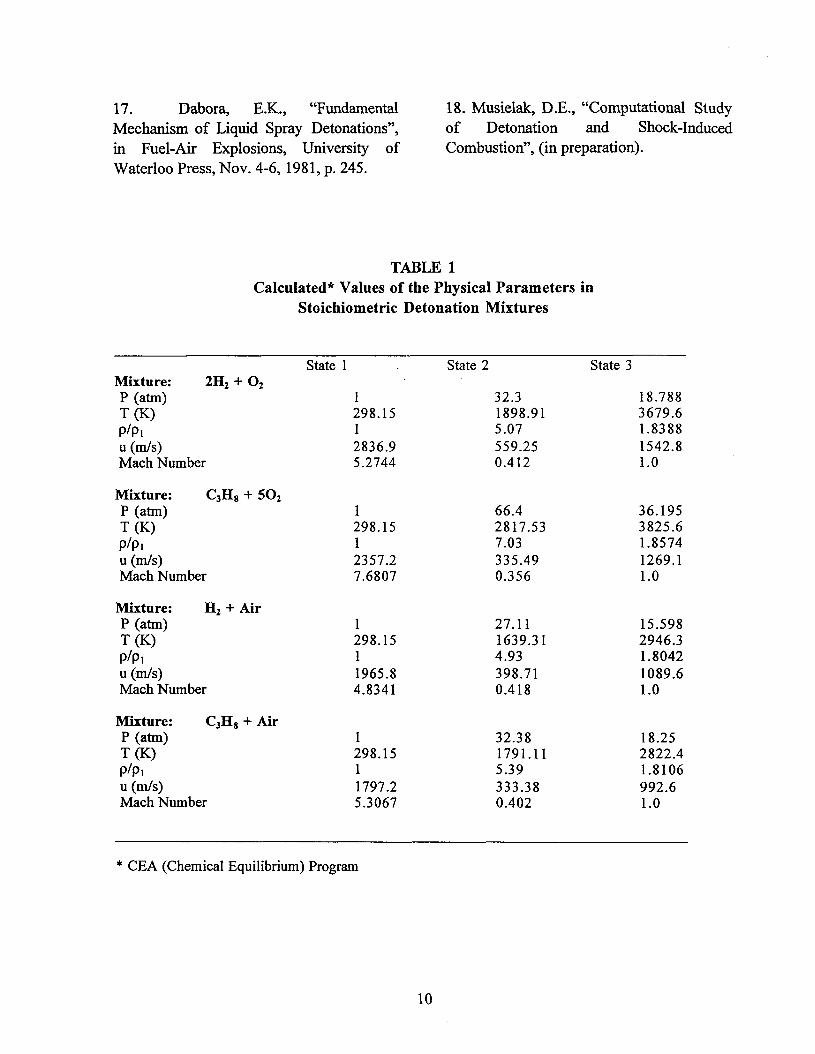
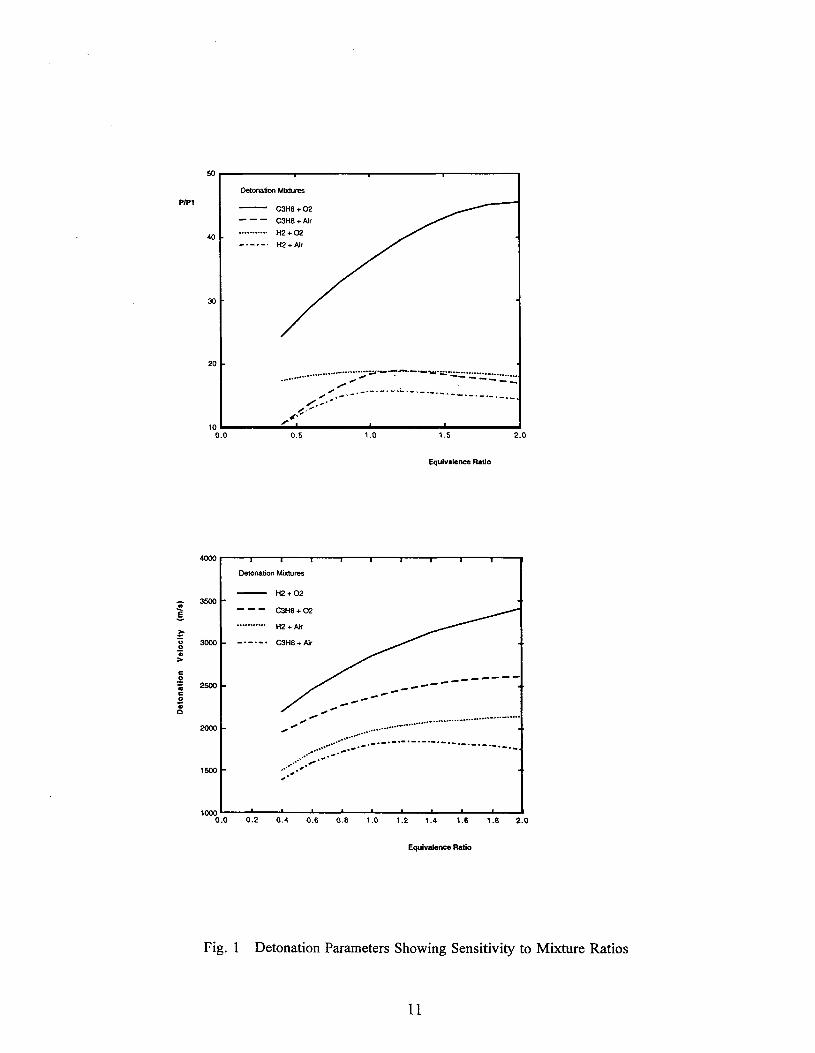
The variation of the physical parametersin stoichiometric detonation mixtures wascalculated using a chemical equilibriumcode10 for mixtures of interest to PDEs.Typical results for various detonationmixtures are given in Table 1, where state 1represents the state of the shock front, state2 is the state of the gases immediately afterthe shock, and state 3 is the Chapman-Jouguet (C-J) state. As shown, as thegaseous mixture passes from the shock frontto the C-J state, its pressure drops about afactor of two, the temperature rises about afactor of two, and the density drops by afactor of three. The sensitivity of thedetonation parameters to the reactants initialmixture ratio is illustrated in Fig. 1. It shouldbe noted that the detonation velocity iscalculated assuming an infinite tube diameter,therefore, experimental values must becorrected before attempting to matchdetonation parameters with those given bythe theory.
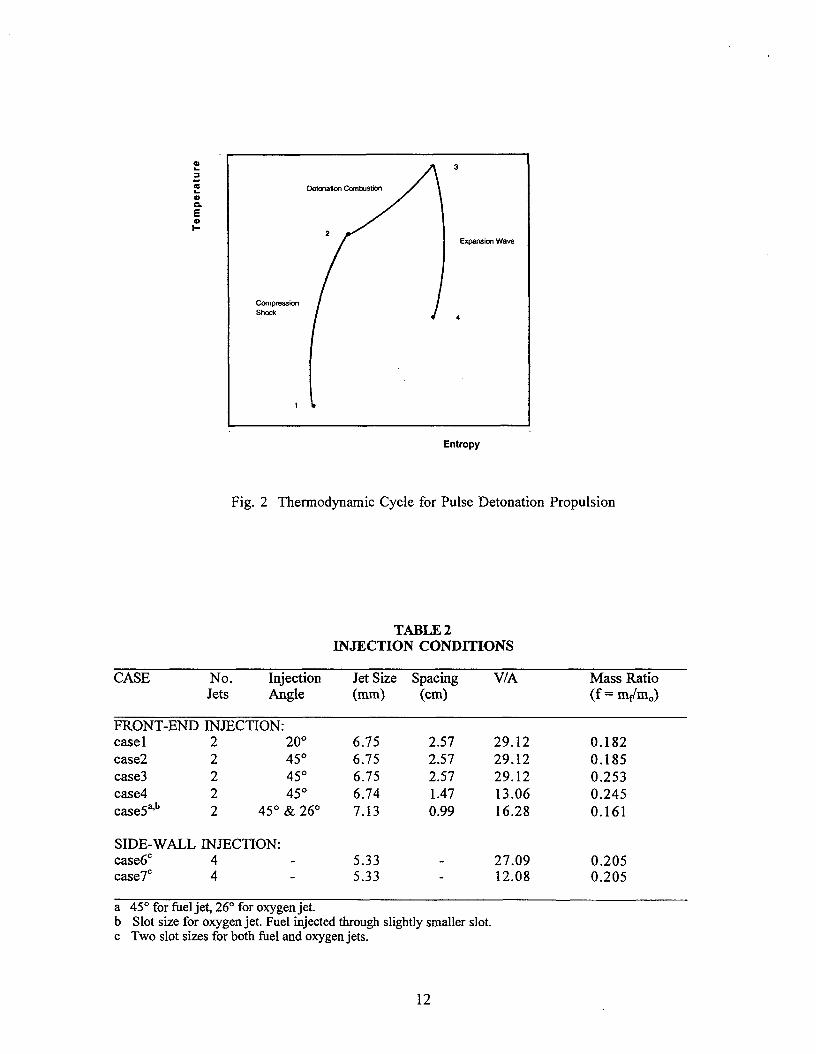
Now, let us relate the above detonationmodel to the three PDE thermodynamicprocesses, which approach a modifiedAdkins cycle. In this model, the detonablemixture is compressed by the shock, heat isadded at near-constant-volume, and the gasis expanded to some pressure level by theexpansion waves that follow the detonation.The PDE cycle diagram is shown in Fig. 2,where states 1, 2, 3 correspond to those inTable 1.
The thrust of a PDE will be derivedmainly from the C-J pressure exerted on thethrust wall of the detonation chamber (P2),and also from the momentum increase in theexhaust stream. As described by the ZNDtheory, the pressure rise is provided by thedetonation shock, which is mainlydependent on the detonation mixture and theinitiation energy. It is important to note that
the pressure ratios in the compression andexpansion processes are not equal, and bydefinition, these processes are notisentropic. It must also be clear that, basedon thermodynamic principles, the entropychange during the PDE thermodynamic cycleis directly proportional to the pressure anddensity gradients9, i.e.,
dp
J-ljTpIpRdl
Also, the entropy across the detonationwave itself (state 1-2) can be estimated with .the normal shock relation, which is afunction of the detonation velocity.
Now, as shown in Table 1, the Machnumber following the expansion, M^, ismuch lower than the detonation Machnumber, MI. However, the sound speed atthe exit of the detonation chamber, 33, ismuch larger than that at the inlet, a^ Forexample, for a propane-air detonationprocess, the sonic velocity of the exhaustgases is three times greater than the sonicvelocity of the unburned mixture. Thus,assuming that the Mach number at the exitof the detonation chamber is of the orderunity, the exit velocity can be increased witha relatively compact divergent nozzle.Results from a systems study to integrate anozzle to a detonation chamber will bepresented in a separate paper.
The detonability of fuels of interest toPDEs must be assessed in the context ofpropulsion performance. It is beyond thescope of the present paper to review theliterature or to address the issue. However,the interested reader is referred to researchwith detonation tubes reported in References12-17.
4 RESULTS AND DISCUSSION
This section describes results from twoseparate studies. One is based on a transientanalysis performed to estimate the gaseouspropellants injection time. The second is aCFD study to model the injection and mixingof reactants in detonation chambers. This ispart of a more comprehensive researchprogram that includes detonationcombustion. The computer code beingdeveloped calculates chemical reaction ofhydrogen-air and hydrogen-oxygen at veryhigh velocities. A new kinetics model forhydrocarbon fuels is being considered18.
4.1 Injection Time
In the context of a pulse detonation chamber,"filling time" is a misnomer since thedetonation chamber is open at one end.Therefore, in this paper the term "injectiontime" will be used instead. One can estimatethe time, it will take for a propellant gas tooccupy a given chamber volume. This can bedone by assuming the pressurized propellantenters the PDE through a choked injectornozzle of a given throat area, and performinga transient analysis. Making use of the idealgas law, the (unsteady) conservation of massprinciple, and assuming isentropic processfor the injection process, one obtains adifferential equation that can be integrated toobtain the time required for injection ofpropellants into a combustion chamber of agiven volume. The analysis begins bydifferentiating the perfect gas equation withrespect to time:
flT Jrr,( 1 )
dp ndT n~dmr— = mR—— + RT——dt dt dt
where the mass rate for choked flow is givenby:
dm~dt
= -PA (2 )
And, for isentropic flow:
a function which is differentiated withrespect to time and rewritten as:
dT 7 -1 T dpdt 7 p dt ( 3 )
Combining equations (1), (2), and (3), ityields:
dt -WMJ-M^T
Let T = T! (p/pi)frl)/Y, where T! and P, arethe initial temperature and pressure of thegas, and rewrite the above equation asfollows:
P =_ (r-»/2rdt
7RR
Separating variables and integrating theabove equation results in the followingrelationship for the injection time, t:
t =
2V WfT)/2r~
A/?(i-r)J rtf 2 r/? vr + ij
(4)
where P! is the propellant pressureupstream from the injector, and P2 is thepressure at the exit. The other variables arechamber volume (V), injection area (A), andgas constant (R) Thus, how long it will takefor a propellant gas to occupy a given
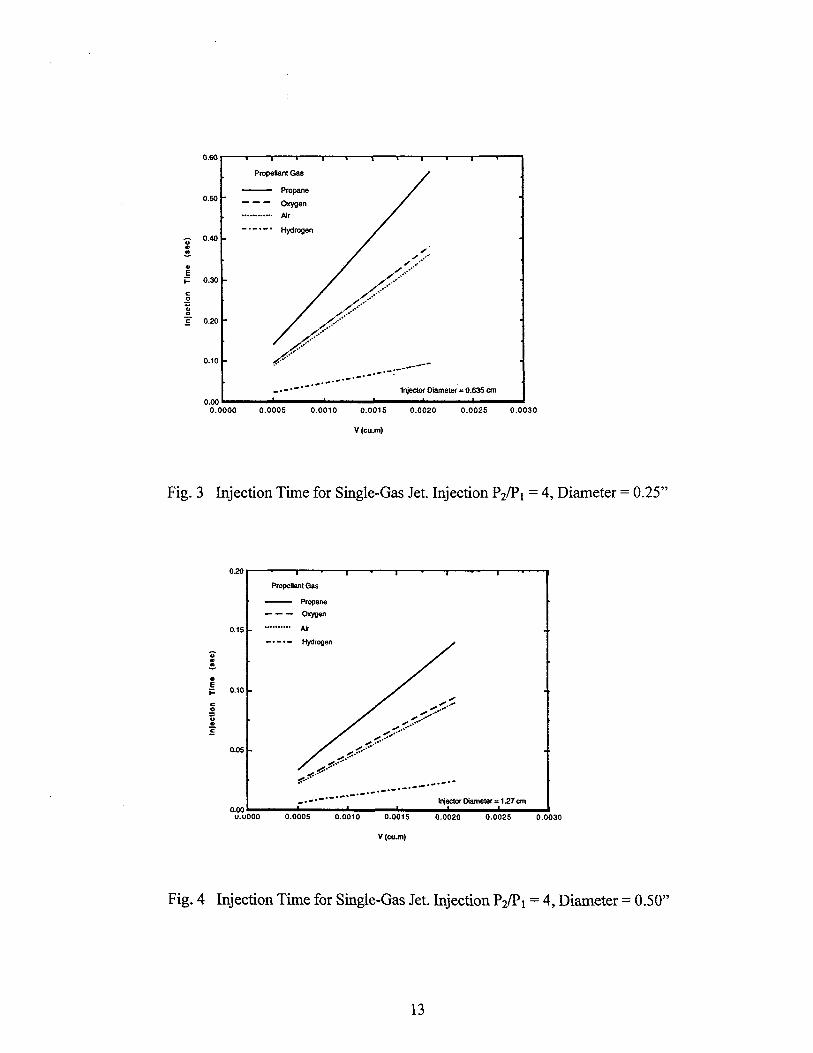
chamber volume depends, not only on thepropellant (y, R), but on the size of theinjector and the pressure drop across it. Theestimated injection times for variouspropellant gases are plotted in Figures 3through 6. As shown in Figs. 3 and 4, ittakes a longer time for propane gas to "fill" agiven volume, as compared with hydrogengas, assuming the same injection conditionsfor both. For example, it takes 23 msec forhydrogen to occupy a volume of 5.148 x 10"4
m3, while propane takes 138 msec at thesame injection conditions (same injector,same Tls Pi/P2).
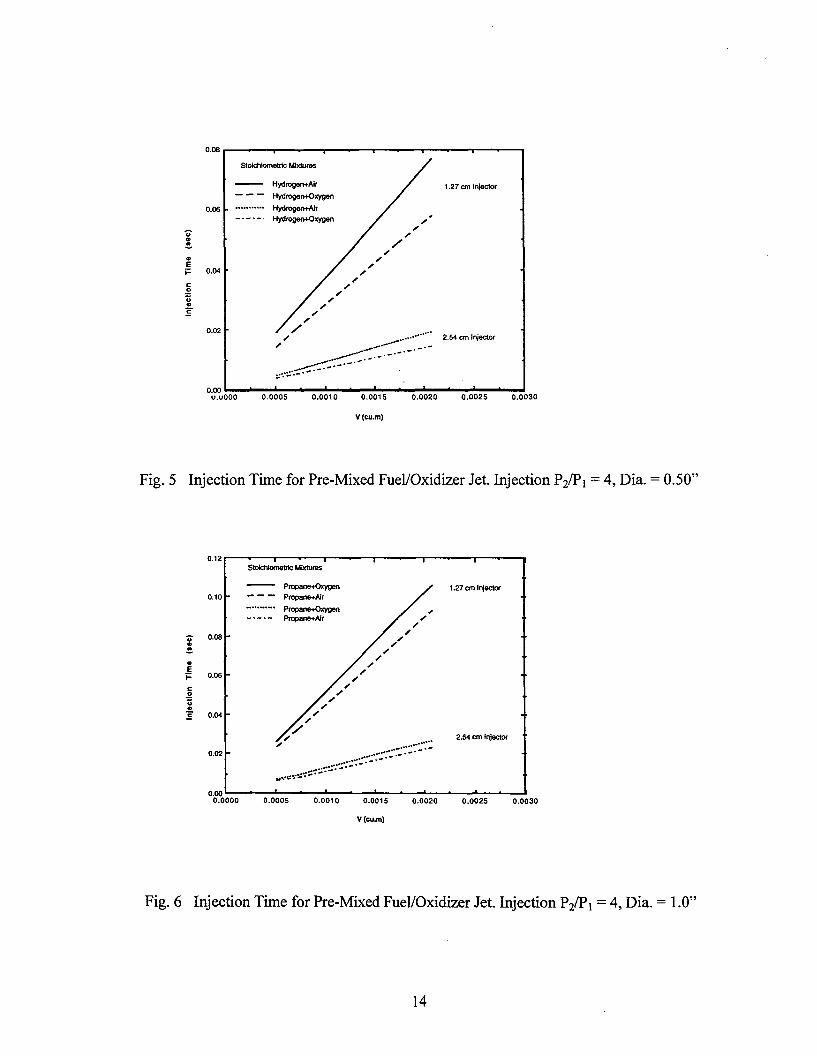
On the other hand, assuming that thepropellants are injected into the detonationchamber as a pre-mixed, stoichiometricmixture, it is found that the time requiredranges from 14 to 106 msec for variousmixtures to fill volumes between 5.148 x 10"4
and 2.085 x 10'3 m3 using a 0.50-inchdiameter injector. If the injector diameter isdoubled, the injection times for the samevolumes are reduced to 3.57 and 26 msec,respectively.
Considering the very short injectiontunes required by a high frequency PDE, it isestimated that only a fraction of thedetonation chamber contains detonablemixture during each cycle. That is why it isso important to ensure that the propellantgases are well mixed and at thestoichiometric conditions for a givenperformance state at least in the vicinity ofthe ignition source. The location of theignitor, thus becomes another designconstraint for the PDE.
4.2 Mixing Characterization
To study the mixing characteristicsinside a detonation chamber, jets ofhydrogen and oxygen were simulated
entering a two-dimensional chamber, using acomputer code originally developed by J.White in 1994, under contract with NASALangley. The CFD code has built-in anumber of diffusion, reaction, and flowmodels which makes it appropriate for thisapplication. The computer program solvesthe Reynolds-averaged Navier-Stokesequations using several turbulence models.For this study, a K-co turbulence model waschosen. The two-dimensional computationaldomain matches the size of two detonationchambers, one chamber is 45.72 cm long and7.62 cm wide, the second has the samelength but is 5 cm wide. The computationalmesh has 129x129 grid nodes. Front-walland lateral-wall injection methods arestudied. Front-wall injection is characterizedby hydrogen and oxygen jets injectedthrough the closed-end wall of the chamberat some angle with the chamber axis. Withlateral-wall injection the fuel and oxidizer areinjected transverse to the chamber axis,through opposite walls. A design thatmatches this side-wall configuration wasreported hi Reference 11. The injector's sizewas of the order of 0.635 cm (1/4 inch) inmost cases. Multiple fuel and oxidizerinjectors were also modeled to study theinteraction that results from multiple-jets.
Injection pressure, temperature, andMach number were assumed to be, hi mostcases, 1 atm, 300 K, and unity, respectively.Due to the difference in molecular structure,the flow characteristics of hydrogen aredifferent from those of oxygen. Therefore, inorder to keep the fuel to oxidizer ratio withinpractical values, the injection conditionswere chosen as those given hi Table 2. Otherinjection angles and injection conditions havealso been considered.
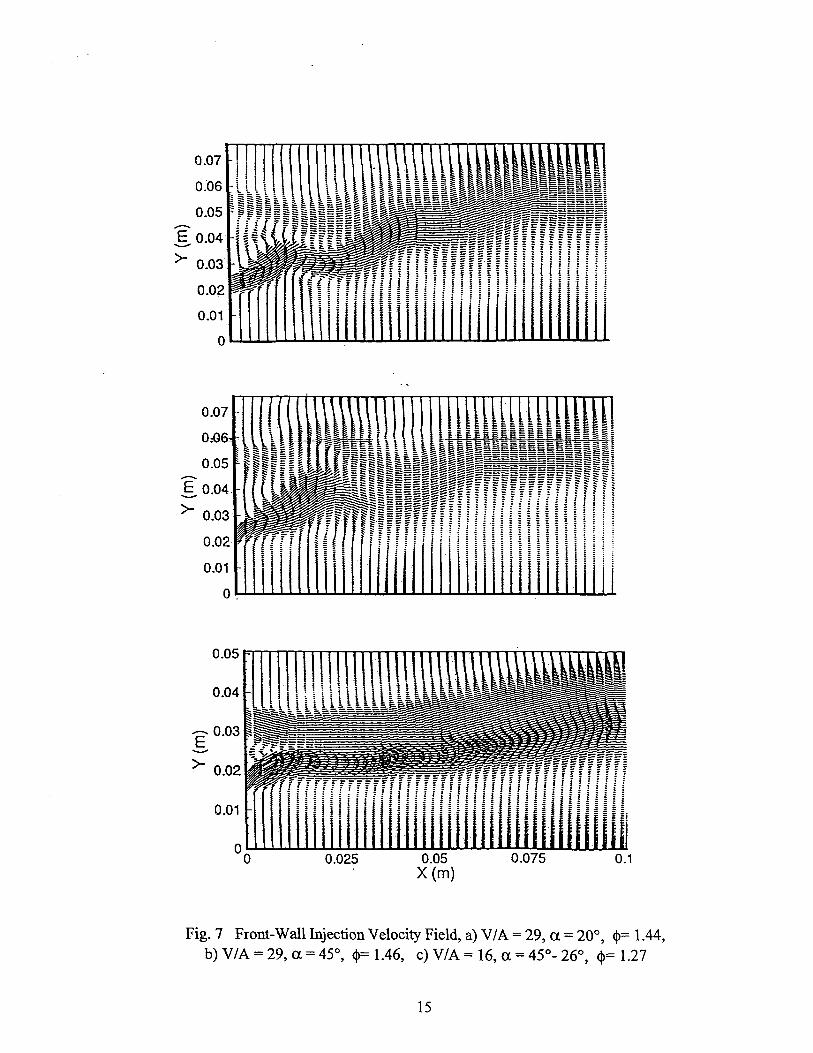
The velocity vector field in Fig. 7illustrates the mixing of fuel and oxidizer jets
injected through the closed-end wall of twocombustion chambers. The upper twovelocity fields correspond to jets of oxygenand hydrogen injected into the same chamberat different angles. The jet on the upper partof the domain is oxygen. Since the oxidizerand fuel jets have different velocities, a grossshear effect takes place and coherentstructures develop throughout the mixinglayers, enhancing the mixing. It is alsoobserved that when the angle is increasedfrom 20° to 45°, the interaction of the fueland oxidizer is stronger. However,downstream at a plane 10 cm from theclosed-end wall of the chamber, the effect isreduced. In the second case, the mixing layeris thicker, indicating increased turbulencewhich pushes the gases faster against theopposite wall. The lower vector field resultswhen the fuel and oxidizer jets are injectedinto a smaller diameter chamber. In this case,the lower jet is hydrogen, with an initialdiameter of 0.47 cm, injected at a 45° angle,and the upper jet is oxygen, initial diameterof 0.71 cm, injected at 26°. Selecting twodifferent injection angles was done afterobserving that the resulting moment ofimpinging jets was directed "upwards", andit was theorized that, hi order to get aresulting moment along the chamber axis,with a zero transverse component, the twojets having different densities, velocities, andmasses would have to be injected at differentangles. Two distinct effects are present incase c), the one due to the smaller gapbetween the injectors, and the one resultingfrom the different injection angles anddifferent initial diameters. Thus, the jetsinteract differently as compared with thefirst two cases a) and b). The resultingvector field seems to have a more uniformgas core, but the mixing pattern observed in
a) and b) is not present. In all cases,however, mixing is not perfect
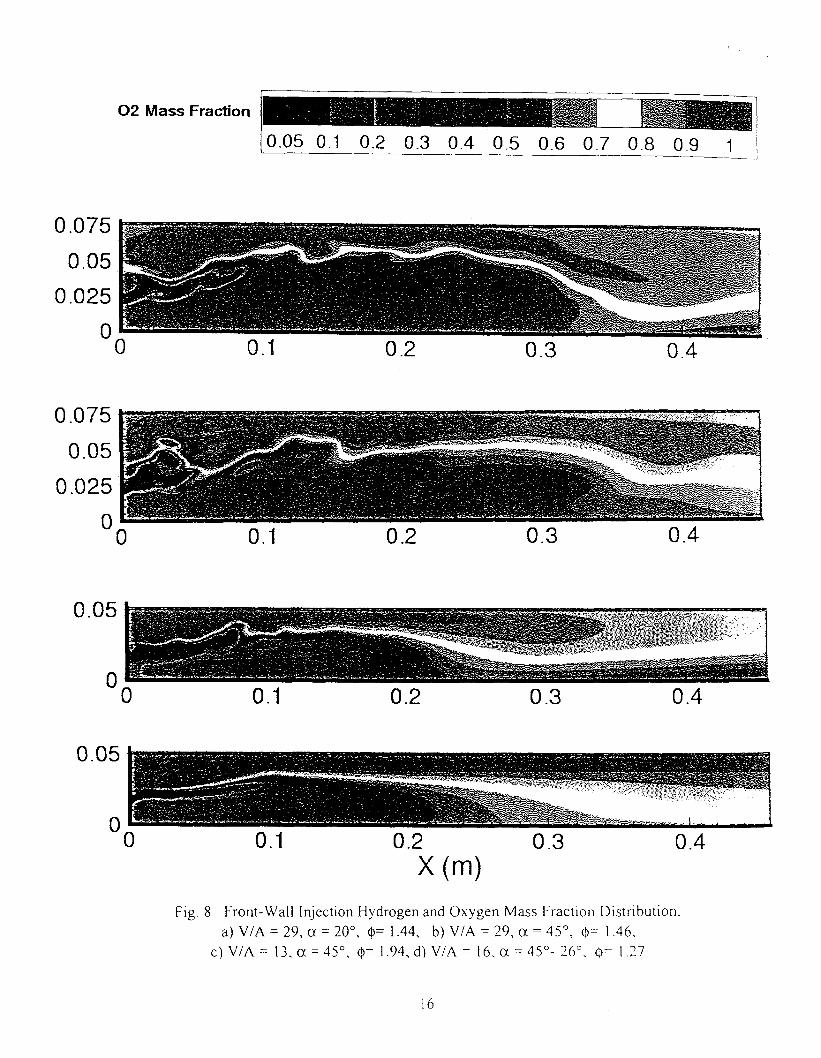
The mixing characteristics of thehydrogen and oxygen jets can also beinferred from the gases mass distribution inthe combustion chamber. Figure 8 showscontour plots of O2 mass fraction for variousinjection conditions. The shadow of thehydrogen jet is also included in these plots.As shown, the oxygen diffuses towards theopen end of the chamber, where it tends to"fill the entire volume". However, in thevicinity of the closed end, the oxygen jet ismoved upward by the effect of the hydrogenjet and, within the first 10 cm, the upperpart of the chamber contains only oxidizer,and the lower part mostly fuel. This wouldimply that the gases in this region are notmixed to the stoichiometric proportionsrequired for detonation. However, towardthe exit plane of the chamber, a bettermixture ratio is apparent.
The mixing characteristics in thechamber are quite different when thepropellants are injected from opposingwalls. The flowfield for this injection modeis shown hi Fig. 9, where the velocity field isillustrated with vector and velocity contourplots, for cases 6 and 7, with same injectionconditions but different chamber volume(please refer to Table 2). One distinctivefeature of these flowfields is the relativelylow axial velocity of the mixing layer,indicating a longer residence time for thepropellants, which would allow them moretime to mix at the molecular level. Thevortices observed hi the first case occur atthe location where the hydrogen impingeswith the oxygen jet, where the diffusion ofreactants occurs. The species distributionsfor these two cases are shown in Fig. 10.The diameter of the chamber has an effect onthe mixing characteristics of the fuel-oxidizer
jets. Intuitively, one should expect that, withsimilar injection conditions, a smaller-diameter chamber would have better mixingcharacteristics than a larger one. This isbecause the jets penetrate farther into theopposite side, impinging upon each otherwith higher intensity.
The rate of mixing between thepropellant jets can be influenced by manyfactors. The initial jet diameter, injectionangle, velocity ratio Uf/Uo, density ratio, theturbulence properties of the jet, the presenceof other jets, both adjacent and opposed, theproximity of walls, and the length of the jetpath are some of the most important. In thispaper only the effects of initial jet diameterand injection angle are included. In addition,three-dimensional effects are also possible,and modeling with a 2-D domain mightshadow some features of the mixing process.Thus, more data are needed for optimizingthe injection process in a given detonationchamber.
5 CONCLUDING REMARKS
A study was made of the injection andmixing processes, aimed at providing a modelto support pulsed detonation combustionresearch. Gaseous hydrogen and oxygen jetswere simulated with a CFD code, injectedinto a two-dimensional chamber, at differentinjection conditions. The parametric studyincluded effects of injection angle and jetinitial diameter, keeping mixture ratios abovestoichiometric values.
Front-end wall and lateral-wall injectionschemes were modeled. The velocity fieldand the species mass distributions in thechamber provide a measure of the degree ofmixing.
Injection and mixing of propellants inthe combustion chamber of multi-cycle
PDEs needs to be optimized. This study,although limited in scope, providesadditional insight which can be helpful in thedesign of practical systems.
Work in progress18 include thedevelopment of a chemical kinetics model tosimulate the combustion process withhydrocarbon-air and hydrocarbon-oxygenmixtures. It is expected that the study willyield numerical predictions of criticaldetonation parameters applicable to practicalPDEs.
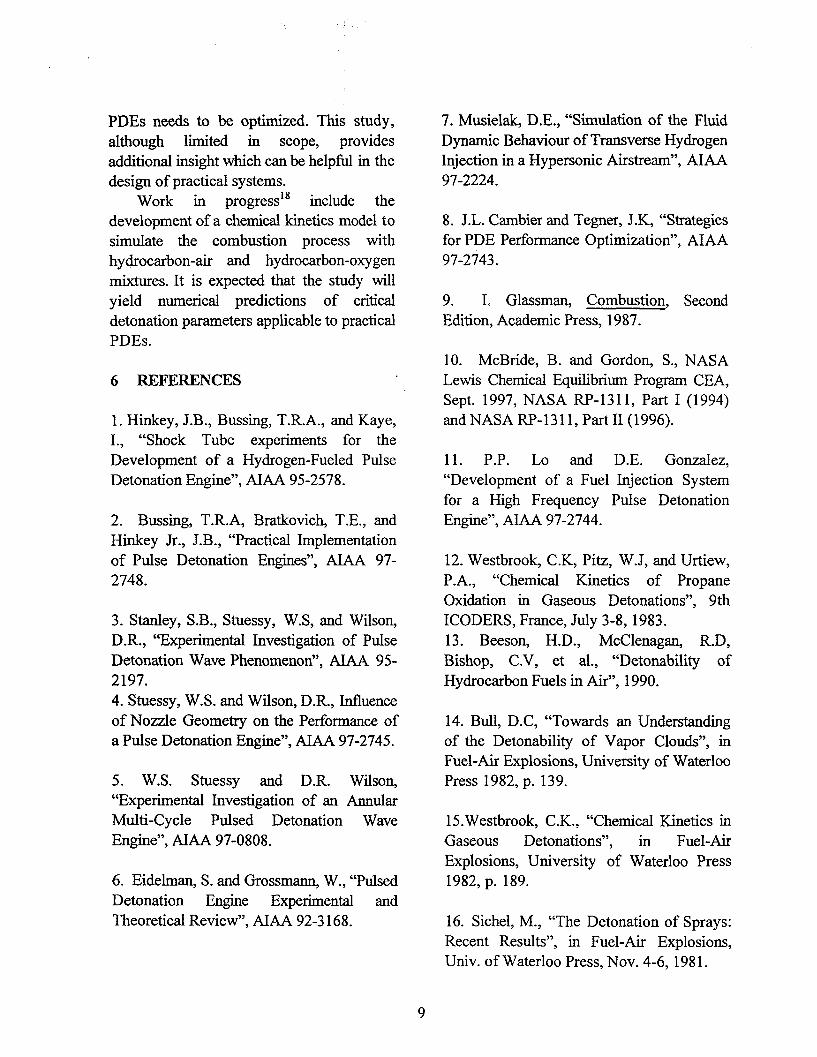
6 REFERENCES
1. Hinkey, J.B., Bussing, T.R.A., and Kaye,1.. "Shock Tube experiments for theDevelopment of a Hydrogen-Fueled PulseDetonation Engine", AIAA 95-2578.
2. Bussing, T.R.A, Bratkovich, T.E., andHinkey Jr., J.B., "Practical Implementationof Pulse Detonation Engines", AIAA 97-2748.
3. Stanley, S.B., Stuessy, W.S, and Wilson,D.R., "Experimental Investigation of PulseDetonation Wave Phenomenon", AIAA 95-2197.4. Stuessy, W.S. and Wilson, D.R., Influenceof Nozzle Geometry on the Performance ofa Pulse Detonation Engine", AIAA 97-2745.
5. W.S. Stuessy and D.R. Wilson,"Experimental Investigation of an AnnularMulti-Cycle Pulsed Detonation WaveEngine", AIAA 97-0808.
6. Eidelman, S. and Grossmann, W., "PulsedDetonation Engine Experimental andTheoretical Review", AIAA 92-3168.
7. Musielak, D.E., "Simulation of the FluidDynamic Behaviour of Transverse HydrogenInjection in a Hypersonic Airstream", AIAA97-2224.
8. J.L. Cambier and Tegner, J.K, "Strategiesfor PDE Performance Optimization", AIAA97-2743.
9. I. Glassman, Combustion,Edition, Academic Press, 1987.
Second
10. McBride, B. and Gordon, S., NASALewis Chemical Equilibrium Program CEA,Sept. 1997, NASA RP-1311, Part I (1994)and NASA RP-1311, Part II (1996).
11. P.P. Lo and D.E. Gonzalez,"Development of a Fuel Injection Systemfor a High Frequency Pulse DetonationEngine", AIAA 97-2744.
12. Westbrook, C.K, Pitz, W.J, and Urtiew,P.A., "Chemical Kinetics of PropaneOxidation in Gaseous Detonations", 9thICODERS, France, July 3-8,1983.13. Beeson, H.D., McClenagan, R.D,Bishop, C.V, et al., "Detonability ofHydrocarbon Fuels hi Air", 1990.
14. Bull, D.C, "Towards an Understandingof the Detonability of Vapor Clouds", inFuel-Air Explosions, University of WaterlooPress 1982, p. 139.
15.Westbrook, C.K., "Chemical Kinetics inGaseous Detonations", hi Fuel-AirExplosions, University of Waterloo Press1982, p. 189.
16. Sichel, M, "The Detonation of Sprays:Recent Results", in Fuel-Air Explosions,Univ. of Waterloo Press, Nov. 4-6, 1981.
17. Dabora, E.K., "Fundamental 18. Musielak, D.E., "Computational StudyMechanism of Liquid Spray Detonations", of Detonation and Shock-Inducedin Fuel-Air Explosions, University of Combustion", (in preparation).Waterloo Press, Nov. 4-6, 1981, p. 245.
TABLE 1Calculated* Values of the Physical Parameters in
Stoichiometric Detonation Mixtures
Mixture: 2H2 + O2P (atm)T(K)P/Piu (m/s)Mach Number
Mixture: C3H8 + 5O2P (atm)T(K)P/Piu (m/s)Mach Number
Mixture: H2 + AirP (atm)T(K)P/Piu (m/s)Mach Number
Mixture: C3H8 + AirP (atm)T(K)P/Piu(m/s)Mach Number
State 1
1298.1512836.95.2744
1298.1512357.27.6807
1298.1511965.84.8341
1298.1511797.25.3067
State 2
32.31898.915.07559.250.412
66.42817.537.03335.490.356
27.111639.314.93398.710.418
32.381791.115.39333.380.402
State 3
18.7883679.61.83881542.81.0
36.1953825.61.85741269.11.0
15.5982946.31.80421089.61.0
18.252822.41.8106992.61.0
* CEA (Chemical Equilibrium) Program
10
soDetonation Mixtures
———— C3H8 + O2— — — C3H8 + Air........... H2 + O2— - - - - H2 + Air
1.0 1.5 2.0
Equivalence Ratio
4000
— 3500
2500
2000
1000
Detonation Mixtures
————— H2 + O2
0.0 0.2 0.4 0.6 0.8 1.0 1.2 1.4 1.6 1.8 2.0
Equivalence Ratio
Fig. 1 Detonation Parameters Showing Sensitivity to Mixture Ratios
11
oa.Eo
Detonation Combustion
Expansion Wave
Entropy
Fig. 2 Thermodynamic Cycle for Pulse Detonation Propulsion
TABLE 2INJECTION CONDITIONS
CASE No.Jets
InjectionAngle
Jet Size(mm)
Spacing(cm)
V/A Mass Ratio(f=m£/m0)
FRONT-END INJECTION:easelcase2caseScase4case5a'b
22222
20°45°45°45°
45° & 26°
6.756.756.756.747.13
2.572.572.571.470.99
29.1229.1229.1213.0616.28
0.1820.1850.2530.2450.161
SIDE-WALL INJECTION:case6c 4case7c 4
5.335.33
27.0912.08
0.2050.205
a 45° for fuel jet, 26° for oxygen jet.b Slot size for oxygen jet. Fuel injected through slightly smaller slot.c Two slot sizes for both fuel and oxygen jets.
12
0.60
- 0.40
0.30
Propellant Gas
Injector Diameter - 0.635 cm0.000.0000 0.0005 0.0010 0.0015 0.0020 0.0025 0.0030
V (cu.m)
Fig. 3 Injection Time for Single-Gas Jet. Injection P2/Pi = 4, Diameter = 0.25"
0.20
0.15
0.05
0.001——u.uOOO
Injector Diameter = 1.27 cm
0.0005 0.0010 0.0015
V(cu.m)
0.0020 0.0025 0.0030
Fig. 4 Injection Time for Single-Gas Jet. Injection P2/Pi = 4, Diameter = 0.50"
13
Ep 0.04
Stotahlometric Mixtures
———— Hydrogen+Air— — — Hydrogen+Oxygen
. ••—•••••• Hydrogen+Air— - - - - Hydrogen+Oxygen
1.27 cm Injector
....--•"" 2.54 cm Injector
0.00u.uOOO 0.0005 0.0010 0.0015 0.0020 0.0025 0.0030
V(cu.m)
Fig. 5 Injection Time for Pre-Mixed Fuel/Oxidizer Jet. Injection P2/Pi = 4, Dia. = 0.50"
•3- 0.08
Stolchiometric Mixtures
—........ Propane+Oxygen- • - • - Propane+Air
1.27 cm Injector
2.S4 cm Injector
0.000.0000 0.0005 0.0010 0.0015 0.0020 0.0025 0.0030
V(oun)
Fig. 6 Injection Time for Pre-Mixed Fuel/Oxidizer Jet. Injection P2/Pi = 4, Dia. = 1.0"
14
0.07
f f f f f f f f f f f :
: : r : : i f t i : : :J : : : : : :1 =
0.05X(m)
Fig. 7 Front-Wall Injection Velocity Field, a) V/A = 29, a = 20°, <|>= 1.44,b) V/A = 29, a = 45°, <|>= 1.46, c) V/A = 16, a = 45°- 26°, <|>= 1.27
15
O2 Mass Fraction
0.05 0.1 0.2 0.3 0.4 0.5 0.6 0.7 0.8 0.9 1
0.05
0.05
00 0.1 0.2 0.3 0.4
X(m)Fig. 8 Front-Wall Injection Hydrogen and Oxygen Mass Fraction Distribution.
a) V/A = 29, a = 20°, 0= 1.44, b) V/A = 29, a = 45°, 0= 1.46,c) V/A = 13, a = 45°, <J)= 1.94, d) V/A = 16, a -45°- 26°. <J>= 1.27
LI
Z9' I =4 'U = V/A (q 'Z9' I =<t> 'LZ = V/A 0"PPM XjpopA uonosfui
S'O I/O 00920" CT<
SZO'O
=====: =rgSSSSSSS S S I :=5=S33§§§§§$^$ * J : j
O2 Mass Fraction0.05 0.15 0.25 0.35 0.45 0.55 0.65 0.75 0.85 0.95
0.05
X(m)
Fig. 10 Lateral-Wall Injection Hydrogen and Oxygen Mass Fraction Distribution,a) V/A = 27, <)>= 1.62, b) V/A - 12, (j)= 1.62
18