Embed Size (px)
Citation preview
© Copyr i gh t 2014 O SIs o f t , LLC .
Presented by
Innovation
around
the PI System
Guillaume GALLON, Veolia Water
Mahyar SEPEHR, Ysance

© Copyr i gh t 2014 O SIs o f t , LLC .
1. Introduction
2
© Copyr i gh t 2014 O SIs o f t , LLC .
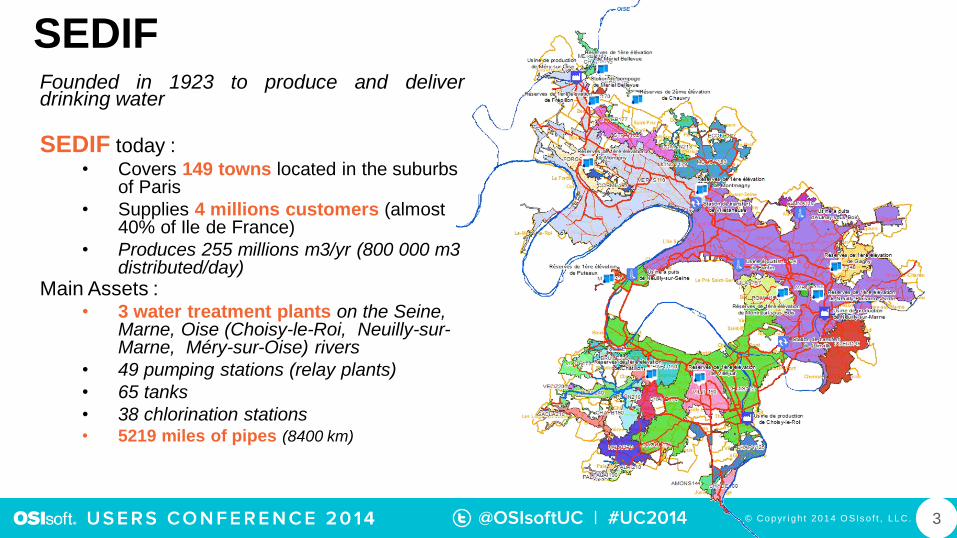
SEDIFFounded in 1923 to produce and deliverdrinking water
SEDIF today :• Covers 149 towns located in the suburbs
of Paris
• Supplies 4 millions customers (almost 40% of Ile de France)
• Produces 255 millions m3/yr (800 000 m3 distributed/day)
Main Assets :• 3 water treatment plants on the Seine,
Marne, Oise (Choisy-le-Roi, Neuilly-sur-Marne, Méry-sur-Oise) rivers
• 49 pumping stations (relay plants)
• 65 tanks
• 38 chlorination stations• 5219 miles of pipes (8400 km)
3
© Copyr i gh t 2014 O SIs o f t , LLC .
Goals : Innovations & Responsible WaterIn June 2010, SEDIF, the water authority for the Greater Paris area, renewed its trust inVEOLIA Water.
New contract Ambitious innovations for the best Water Services
– Design Next Generation and Smart Water Services (Project ServO)
– Increase Security
– Offer more Services
• Water Traceability (Project Qualio)
• Smart Metering (Project Teleo)
• Smart Leak Detection (Project Res’Echo)
– Reduce environmental impact
• Reduce electricity consumption by 6% by 2020 & move completely toRenewable Energy from 2013 onwards (Project PEEE)
• Reduction CO2 emission (33%)
• ISO 50001
4
© Copyr i gh t 2014 O SIs o f t , LLC .
2. Approach
5
© Copyr i gh t 2014 O SIs o f t , LLC .
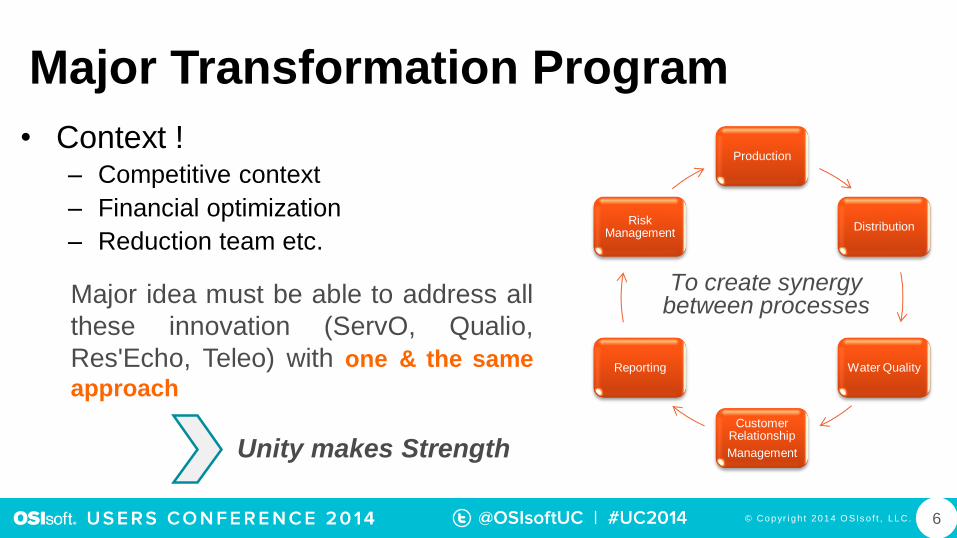
Major Transformation Program
• Context !– Competitive context
– Financial optimization
– Reduction team etc.
6
Production
Distribution
Water Quality
Customer Relationship
Management
Reporting
Risk Management
To create synergy between processesMajor idea must be able to address all
these innovation (ServO, Qualio,
Res'Echo, Teleo) with one & the same
approach
Unity makes Strength
© Copyr i gh t 2014 O SIs o f t , LLC .
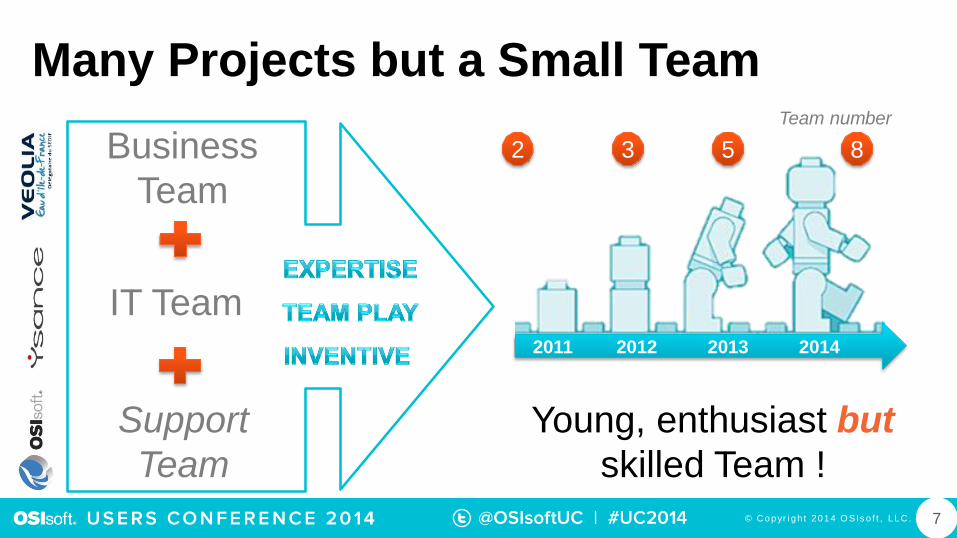
Many Projects but a Small Team
Young, enthusiast but
skilled Team !
7
Business
Team
IT Team
2 3 5 8
2011 2012 2013 2014
Support
Team
Team number
© Copyr i gh t 2014 O SIs o f t , LLC . 8
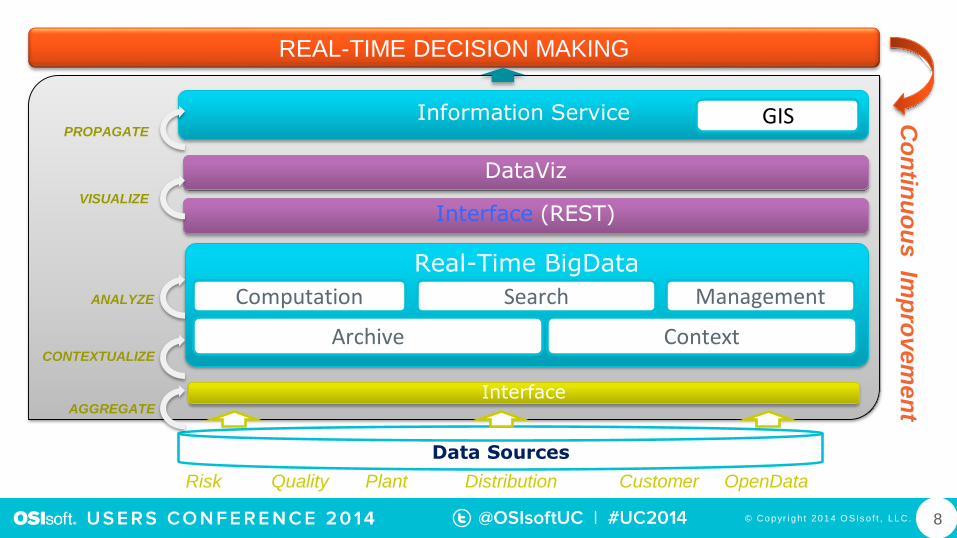
Real-Time BigData
Management
DataViz
Interface (REST)
Computation
Archive
Search
Interface
Data Sources
Context
Information Service
AGGREGATE
CONTEXTUALIZE
ANALYZE
VISUALIZE
PROPAGATE
REAL-TIME DECISION MAKING
Risk Quality Plant Distribution Customer OpenData
GIS Co
ntin
uo
us
Imp
rov
em
en
t
© Copyr i gh t 2014 O SIs o f t , LLC .
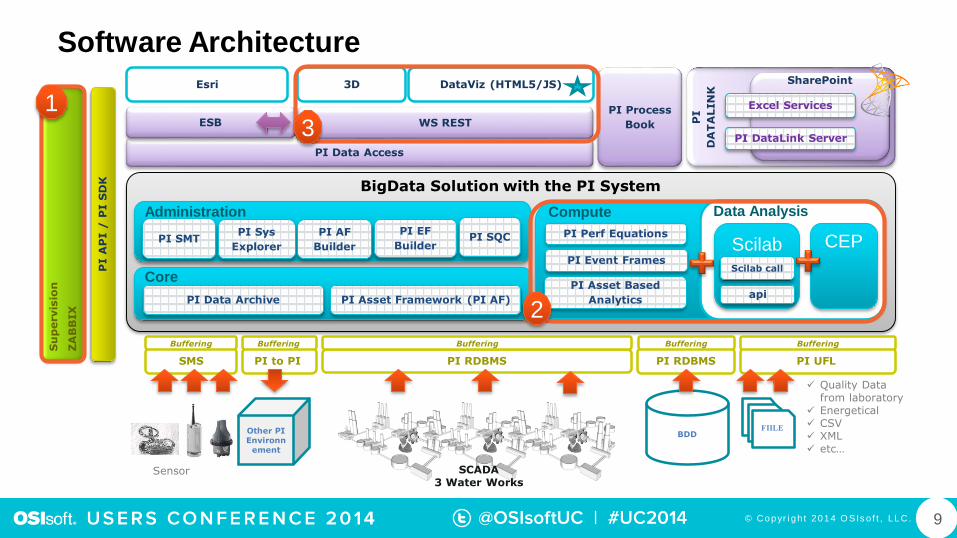
BigData Solution with the PI System
PI
DA
TA
LIN
K
PI Process
Book
SharePoint
PI A
PI /
PI S
DK
PI Data Access
PI UFLPI to PI PI RDBMS
PI DataLink Server
WS REST
BDD
EDFEDF
FIILE
DataViz (HTML5/JS)
Excel Services
ESB
Esri
SMS
Quality Data from laboratory
Energetical CSV XML
etc…
BufferingBufferingBufferingBuffering
Other PI Environn
ement
PI RDBMS
3D
Buffering
Sensor
Su
perv
isio
n
ZA
BB
IX
SCADA3 Water Works
PI
SQC
PI Asset Based
AnalyticsPI Data Archive
Core
Compute
PI Asset Framework (PI AF)
PI SMT
Administration
CEPScilabPI Event Frames
PI Perf EquationsPI AF
Builder
PI EF
Builder
PI Sys
ExplorerPI SQC
9
Data Analysis
api
Scilab call
Software Architecture
1
2
3
© Copyr i gh t 2014 O SIs o f t , LLC .
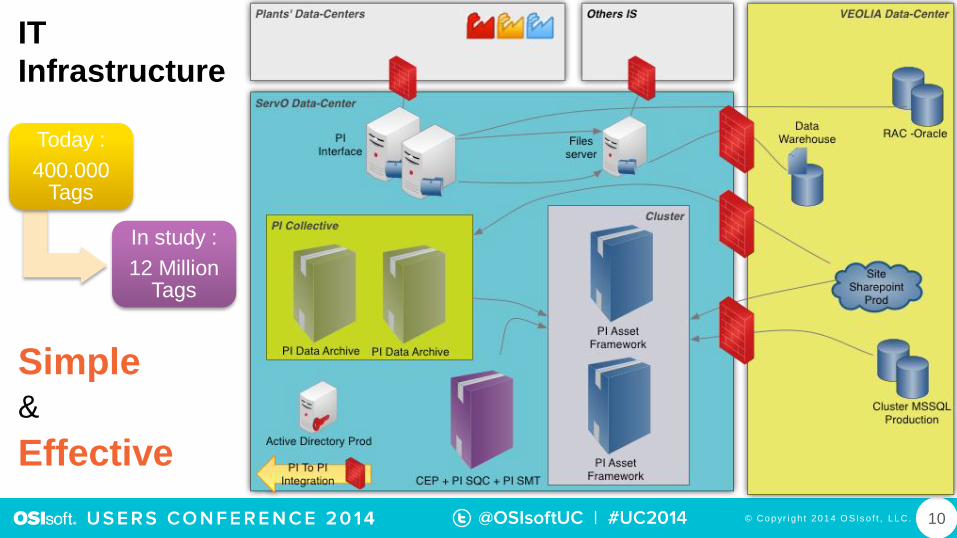
IT
Infrastructure
10
Simple&
Effective
Today :
400.000Tags
In study :
12 Million Tags
© Copyr i gh t 2014 O SIs o f t , LLC .
3. Achievement
11
© Copyr i gh t 2014 O SIs o f t , LLC .
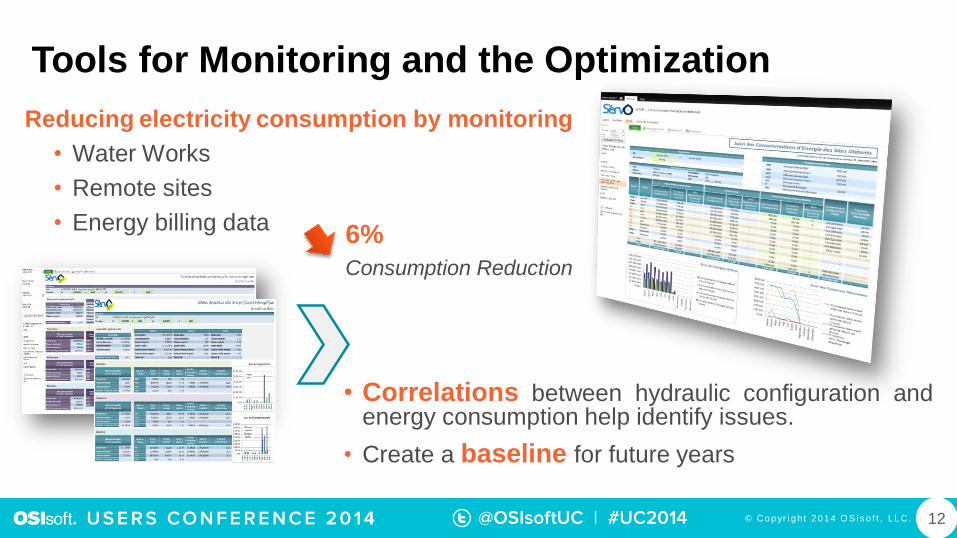
Tools for Monitoring and the Optimization
12
Reducing electricity consumption by monitoring
• Water Works
• Remote sites
• Energy billing data
• Correlations between hydraulic configuration andenergy consumption help identify issues.
• Create a baseline for future years
6%
Consumption Reduction
© Copyr i gh t 2014 O SIs o f t , LLC .
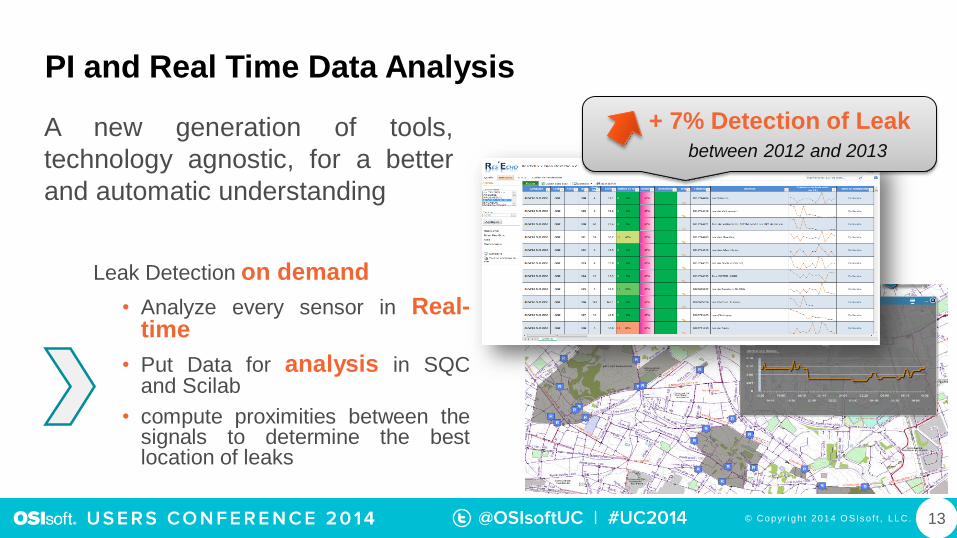
PI and Real Time Data Analysis
13
Leak Detection on demand
• Analyze every sensor in Real-time
• Put Data for analysis in SQCand Scilab
• compute proximities between thesignals to determine the bestlocation of leaks
+ 7% Detection of Leak
between 2012 and 2013 A new generation of tools,
technology agnostic, for a better
and automatic understanding
© Copyr i gh t 2014 O SIs o f t , LLC .
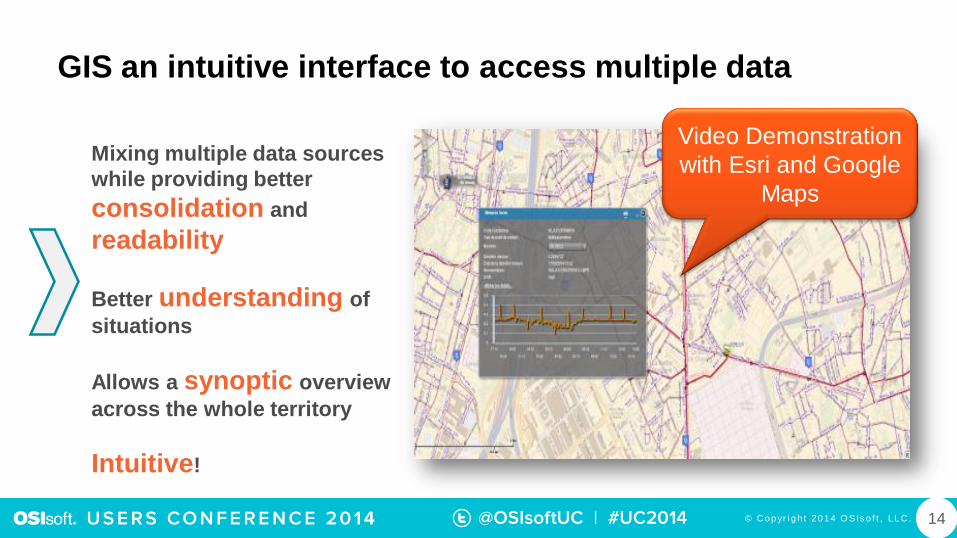
GIS an intuitive interface to access multiple data
14
Mixing multiple data sources
while providing better
consolidation and
readability
Better understanding of
situations
Allows a synoptic overview
across the whole territory
Intuitive!
Video Demonstration
with Esri and Google
Maps
© Copyr i gh t 2014 O SIs o f t , LLC .
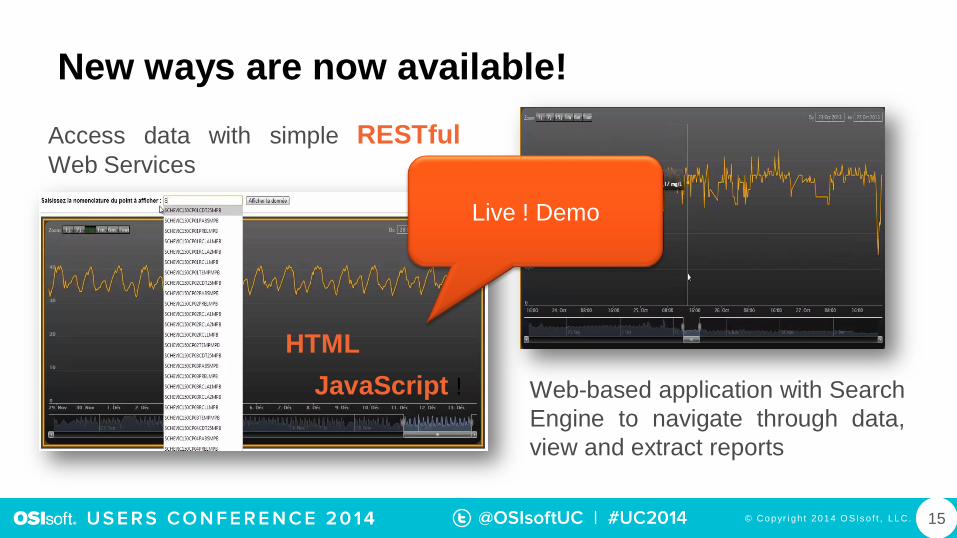
New ways are now available!
15
Access data with simple RESTfulWeb Services
Web-based application with Search
Engine to navigate through data,
view and extract reports
HTML
JavaScript !
Live ! Demo
© Copyr i gh t 2014 O SIs o f t , LLC .
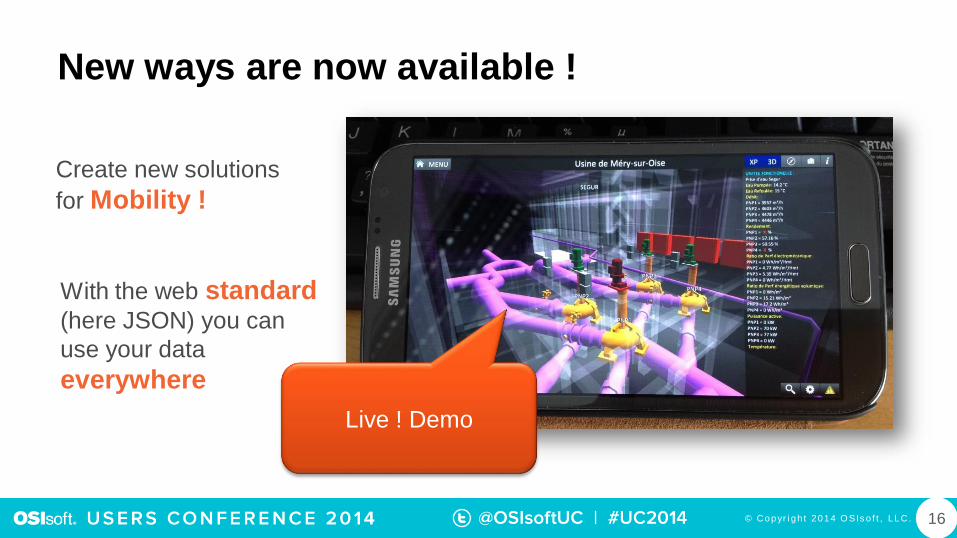
New ways are now available !
16
Create new solutions
for Mobility !
With the web standard(here JSON) you can
use your data
everywhere
Live ! Demo
© Copyr i gh t 2014 O SIs o f t , LLC . 17
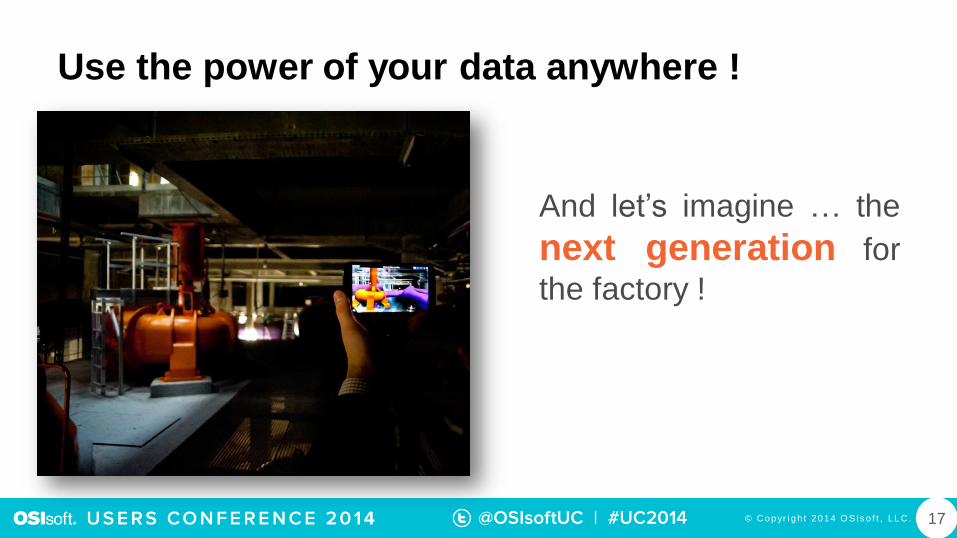
Use the power of your data anywhere !
And let’s imagine … the
next generation for
the factory !
© Copyr i gh t 2014 O SIs o f t , LLC .
Guillaume [email protected]
Veolia Eau d’Ile-de-France
www.veolia.com
Mahyar [email protected]
Ysance
www.ysance.com
18
© Copyr i gh t 2014 O SIs o f t , LLC .
Brought to you by