Embed Size (px)
Citation preview
CONFIDENTIAL AND PROPRIETARYAny use of this material without specific permission of McKinsey & Company is strictly prohibited
Innovations in SME finance
Cairo, March 28, 2010
Marriott Hotel
Antonino GittoPartner at McKinsey & Company Inc. ItalyItalian mobile: +39 348 8952839Egyptian mobile: +20 106 5540501 E-mail: [email protected]
McKinsey & Company 1|
“World’s most powerful and
capable consulting firm – It commands unrivalled respect”
– Fortune
“Distinguished by its excep-
tional people, top manage-ment approach and one-firm principle”
– Business
Week
Long history of working with leading corporations
• Serving 96% of Global 100 and 76% of Global 500
• Across all industries
Broad geographic reach
• Now with 94 offices in 52 countries, including 5 offices in the Middle East (i.e., Bahrain, Doha, Dubai, Riyadh and Abu Dhabi)
• Common philosophy, base of experience, skills and standards
Unrivalled talent pool
• 8,900 consultants from 52 countries
• 4 in 5 possess advanced management degrees
• 3 in 5 have significant managerial experience
Strategy to deliver impact to leading organizations on a global basis through our extensive expertise
• Global reach and best practice learning
• Substantial reinvestment in industry knowledge building
• Depth of specialist support
• Combine industry insight and functional knowledge
“World’s largest strategic management consultant”
– Wall Street Journal
McKinsey & company is the world’s leading management consulting firm
McKinsey & Company 2|
KEY MESSAGES
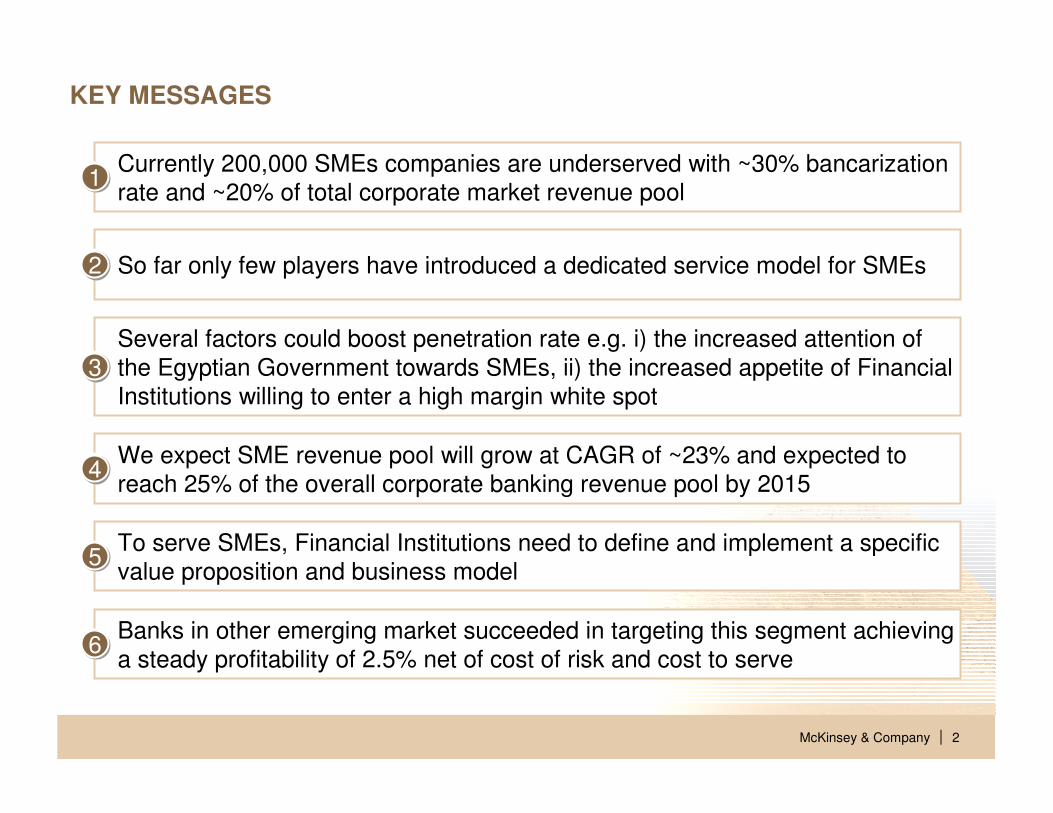
Currently 200,000 SMEs companies are underserved with ~30% bancarization
rate and ~20% of total corporate market revenue pool1
So far only few players have introduced a dedicated service model for SMEs2
Several factors could boost penetration rate e.g. i) the increased attention of
the Egyptian Government towards SMEs, ii) the increased appetite of Financial
Institutions willing to enter a high margin white spot 3
We expect SME revenue pool will grow at CAGR of ~23% and expected to
reach 25% of the overall corporate banking revenue pool by 2015 4
To serve SMEs, Financial Institutions need to define and implement a specific
value proposition and business model5
Banks in other emerging market succeeded in targeting this segment achieving
a steady profitability of 2.5% net of cost of risk and cost to serve6
McKinsey & Company 3|
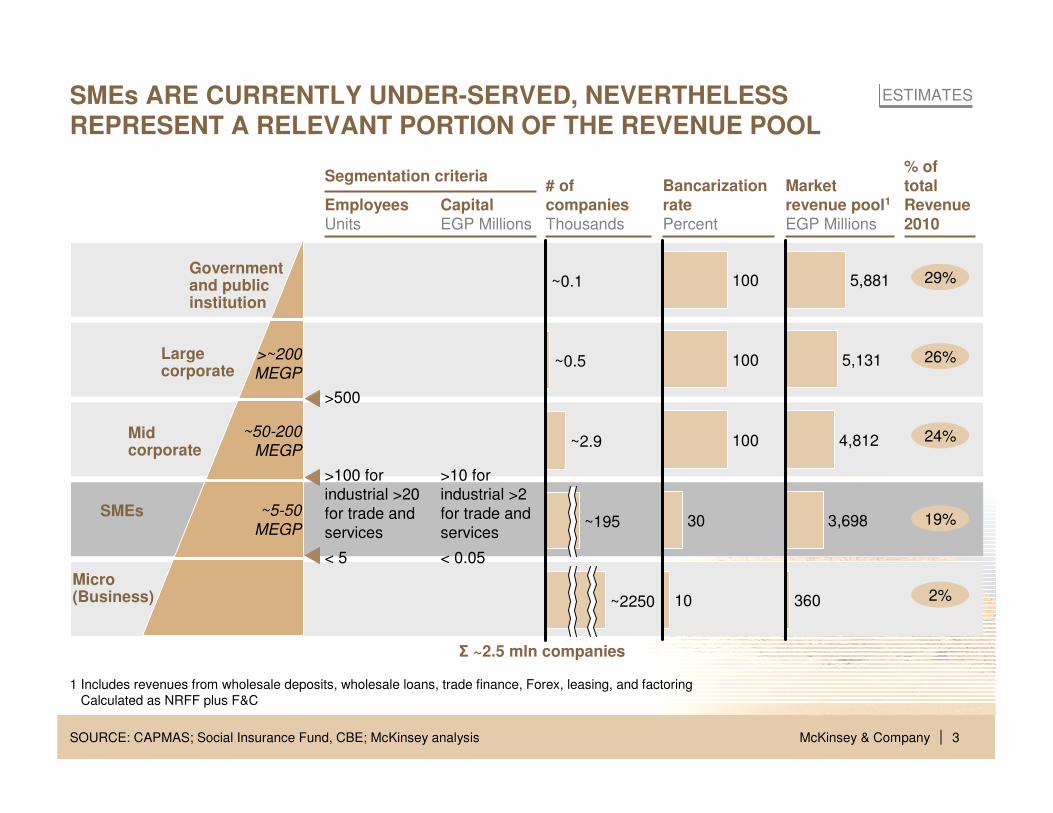
~195
~2250
~2.9
~0.5
~0.1
Σ ~2.5 mln companies
SOURCE: CAPMAS; Social Insurance Fund, CBE; McKinsey analysis
SMEs ARE CURRENTLY UNDER-SERVED, NEVERTHELESS REPRESENT A RELEVANT PORTION OF THE REVENUE POOL
1 Includes revenues from wholesale deposits, wholesale loans, trade finance, Forex, leasing, and factoring
Calculated as NRFF plus F&C
10
30
100
100
100
360
3,698
4,812
5,131
5,881Government and public institution
Large corporate
SMEs
Micro (Business)
Mid corporate
>~200
MEGP
~50-200
MEGP
~5-50
MEGP
ESTIMATES
29%
26%
24%
19%
2%
% of total Revenue 2010
< 5
>100 for industrial >20
for trade and
services
>10 for industrial >2
for trade and
services
< 0.05
>500
# of companiesThousands
Market revenue pool1
EGP Millions
BancarizationratePercent
Segmentation criteria
CapitalEGP Millions
EmployeesUnits
McKinsey & Company 4|
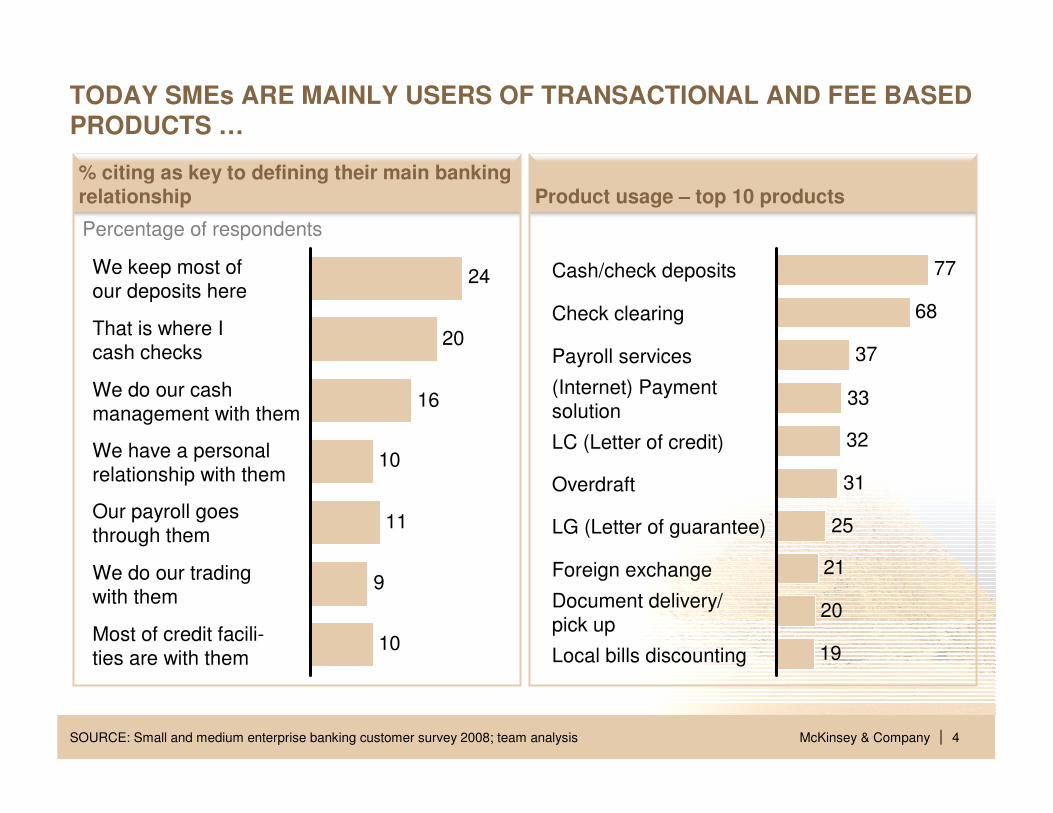
% citing as key to defining their main banking relationship Product usage – top 10 products
TODAY SMEs ARE MAINLY USERS OF TRANSACTIONAL AND FEE BASED PRODUCTS …
Percentage of respondents
10
9
11
10
16
20
24
Most of credit facili-
ties are with them
We do our trading
with them
Our payroll goes
through them
We have a personal
relationship with them
We do our cash
management with them
That is where I
cash checks
We keep most of
our deposits here
19
20
21
25
31
32
33
37
68
77
Local bills discounting
Document delivery/
pick up
Foreign exchange
LG (Letter of guarantee)
Overdraft
LC (Letter of credit)
(Internet) Payment
solution
Payroll services
Check clearing
Cash/check deposits
SOURCE: Small and medium enterprise banking customer survey 2008; team analysis
McKinsey & Company 5|
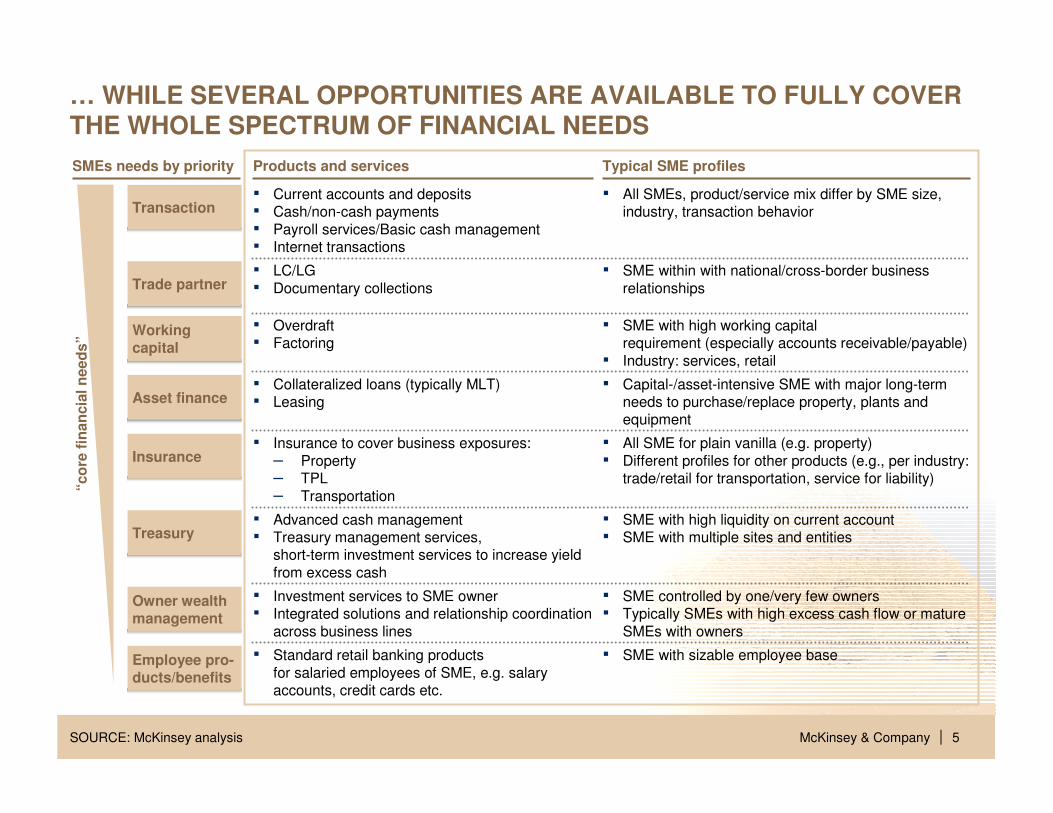
… WHILE SEVERAL OPPORTUNITIES ARE AVAILABLE TO FULLY COVER THE WHOLE SPECTRUM OF FINANCIAL NEEDS
SOURCE: McKinsey analysis
Products and services Typical SME profiles
“co
re f
inan
cia
l n
eed
s”
SMEs needs by priority
Transaction▪ Current accounts and deposits▪ Cash/non-cash payments
▪ Payroll services/Basic cash management▪ Internet transactions
▪ All SMEs, product/service mix differ by SME size, industry, transaction behavior
Treasury▪ Advanced cash management▪ Treasury management services,
short-term investment services to increase yield
from excess cash
▪ SME with high liquidity on current account ▪ SME with multiple sites and entities
Working capital
▪ Overdraft ▪ Factoring
▪ SME with high working capitalrequirement (especially accounts receivable/payable)
▪ Industry: services, retail
Asset finance▪ Collateralized loans (typically MLT) ▪ Leasing
▪ Capital-/asset-intensive SME with major long-term needs to purchase/replace property, plants and equipment
Trade partner▪ LC/LG
▪ Documentary collections
▪ SME within with national/cross-border business
relationships
Insurance▪ Insurance to cover business exposures:
– Property– TPL
– Transportation
▪ All SME for plain vanilla (e.g. property)
▪ Different profiles for other products (e.g., per industry: trade/retail for transportation, service for liability)
Owner wealth management
▪ Investment services to SME owner▪ Integrated solutions and relationship coordination
across business lines
▪ SME controlled by one/very few owners▪ Typically SMEs with high excess cash flow or mature
SMEs with owners
Employee pro-ducts/benefits
▪ Standard retail banking products
for salaried employees of SME, e.g. salary accounts, credit cards etc.
▪ SME with sizable employee base
McKinsey & Company 6|
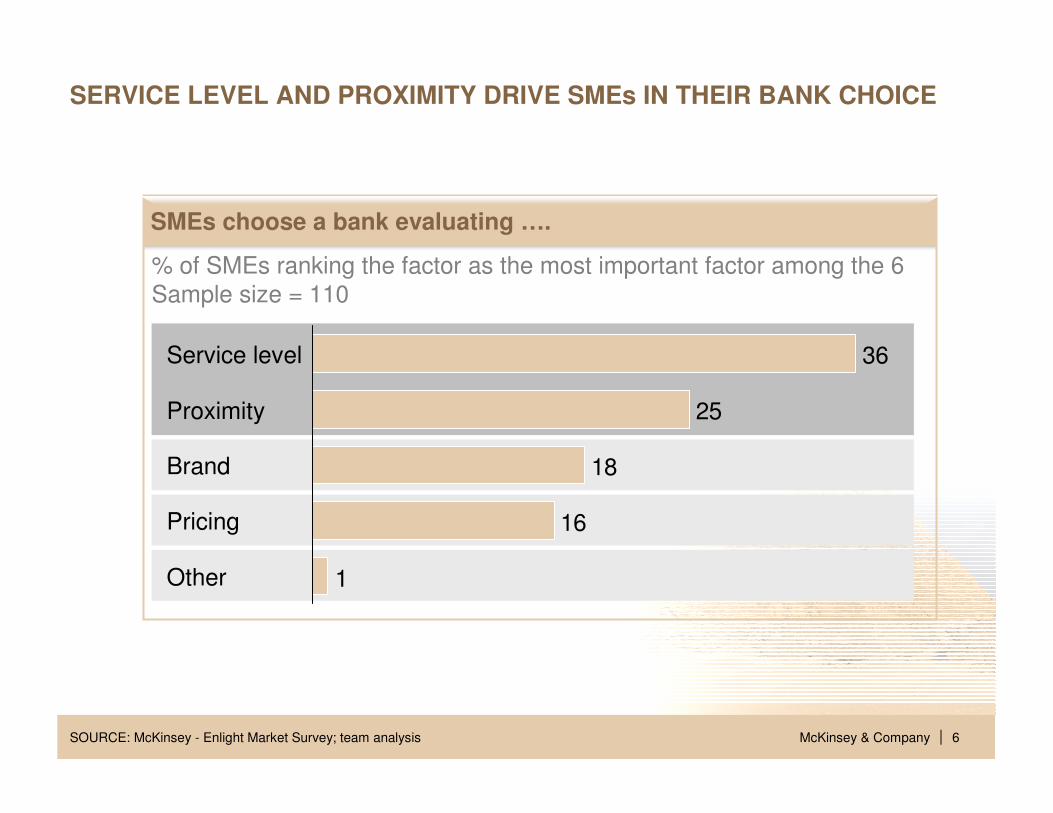
1
16
18
25
36
Other
Pricing
Brand
Proximity
Service level
SMEs choose a bank evaluating ….
% of SMEs ranking the factor as the most important factor among the 6
Sample size = 110
SERVICE LEVEL AND PROXIMITY DRIVE SMEs IN THEIR BANK CHOICE
SOURCE: McKinsey - Enlight Market Survey; team analysis
McKinsey & Company 7|
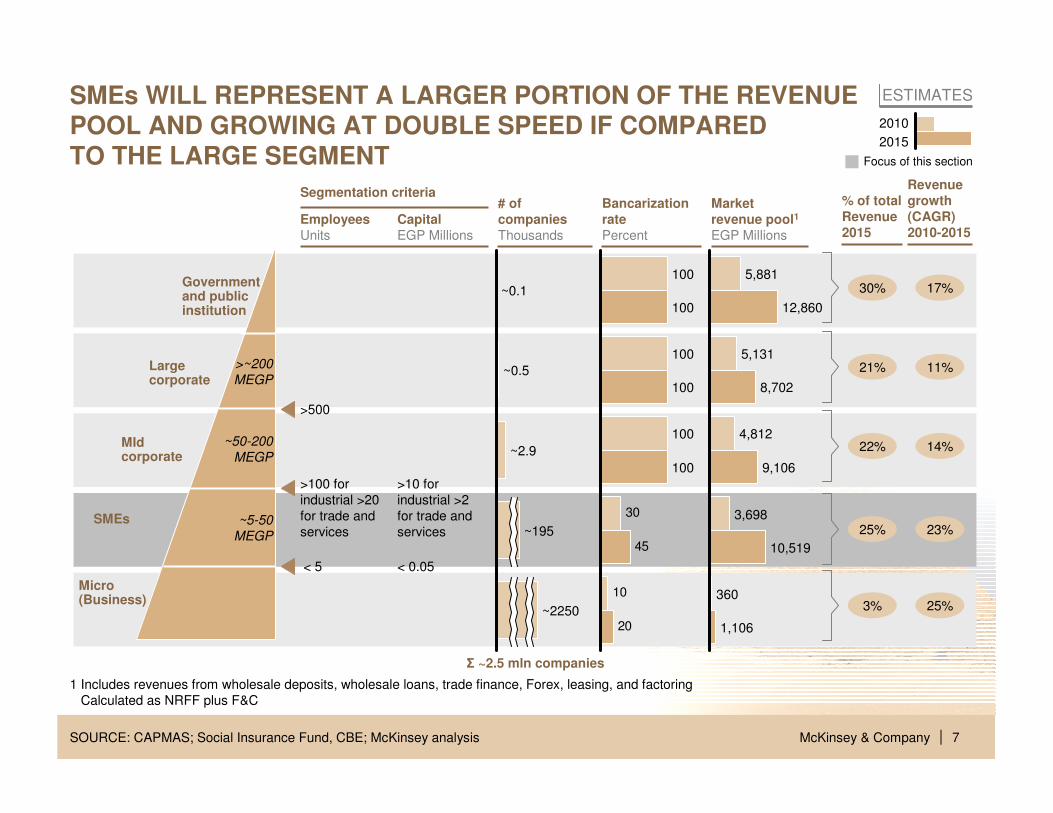
~2250
~195
~2.9
~0.5
~0.1
Σ ~2.5 mln companies
< 5
>100 for
industrial >20
for trade and
services
SOURCE: CAPMAS; Social Insurance Fund, CBE; McKinsey analysis
>10 for
industrial >2
for trade and
services
< 0.05
SMEs WILL REPRESENT A LARGER PORTION OF THE REVENUE POOL AND GROWING AT DOUBLE SPEED IF COMPARED TO THE LARGE SEGMENT
1 Includes revenues from wholesale deposits, wholesale loans, trade finance, Forex, leasing, and factoring
Calculated as NRFF plus F&C
10
30
20
45
100
100
100
100
100
100
1,106
360
10,519
3,698
9,106
4,812
8,702
5,131
12,860
5,881
2010
2015
>500
Government and public institution
Large corporate
SMEs
Micro (Business)
MIdcorporate
>~200
MEGP
~50-200
MEGP
~5-50
MEGP
Focus of this section
17%
11%
14%
23%
25%
30%
21%
22%
25%
3%
ESTIMATES
Revenue growth (CAGR) 2010-2015
% of total Revenue 2015
# of companiesThousands
Market revenue pool1
EGP Millions
BancarizationratePercent
Segmentation criteria
CapitalEGP Millions
EmployeesUnits
McKinsey & Company 8|SOURCE: McKinsey
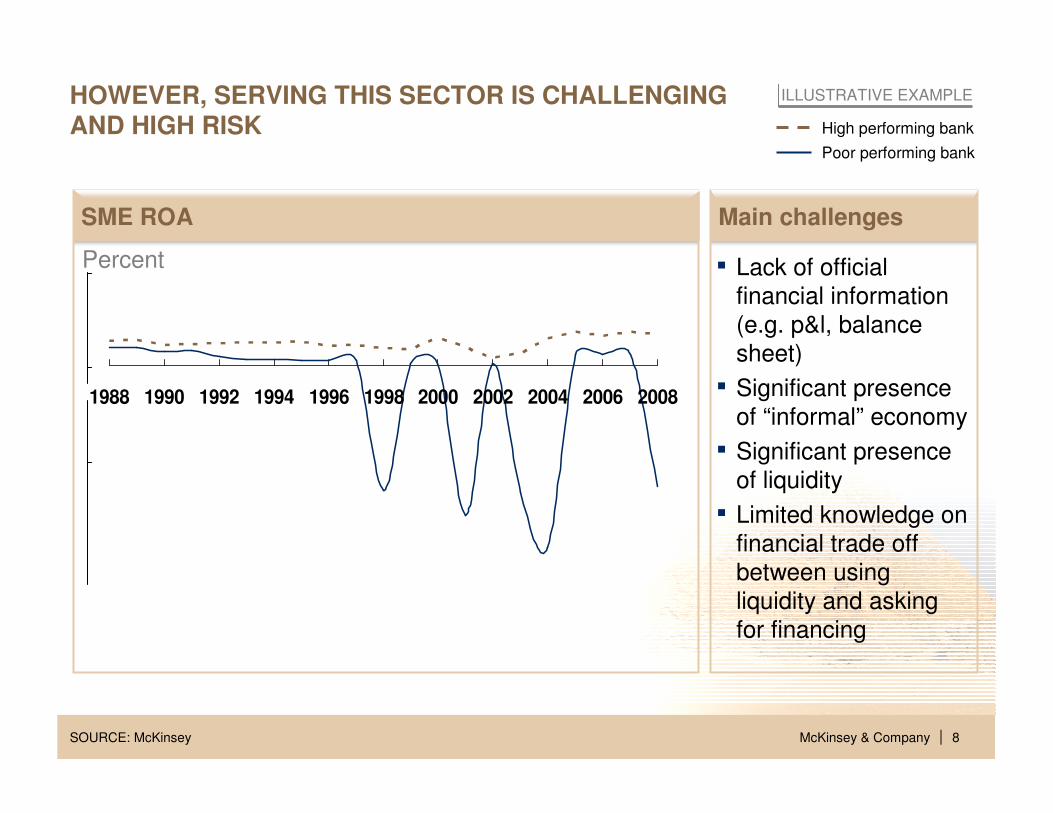
HOWEVER, SERVING THIS SECTOR IS CHALLENGING AND HIGH RISK High performing bank
Poor performing bank
ILLUSTRATIVE EXAMPLE
SME ROA
Percent
1988 1990 1992 1994 1996 1998 2000 2002 2004 2006 2008
Main challenges
▪ Lack of official
financial information
(e.g. p&l, balance
sheet)
▪ Significant presence
of “informal” economy
▪ Significant presence
of liquidity
▪ Limited knowledge on
financial trade off
between using
liquidity and asking
for financing
McKinsey & Company 9|
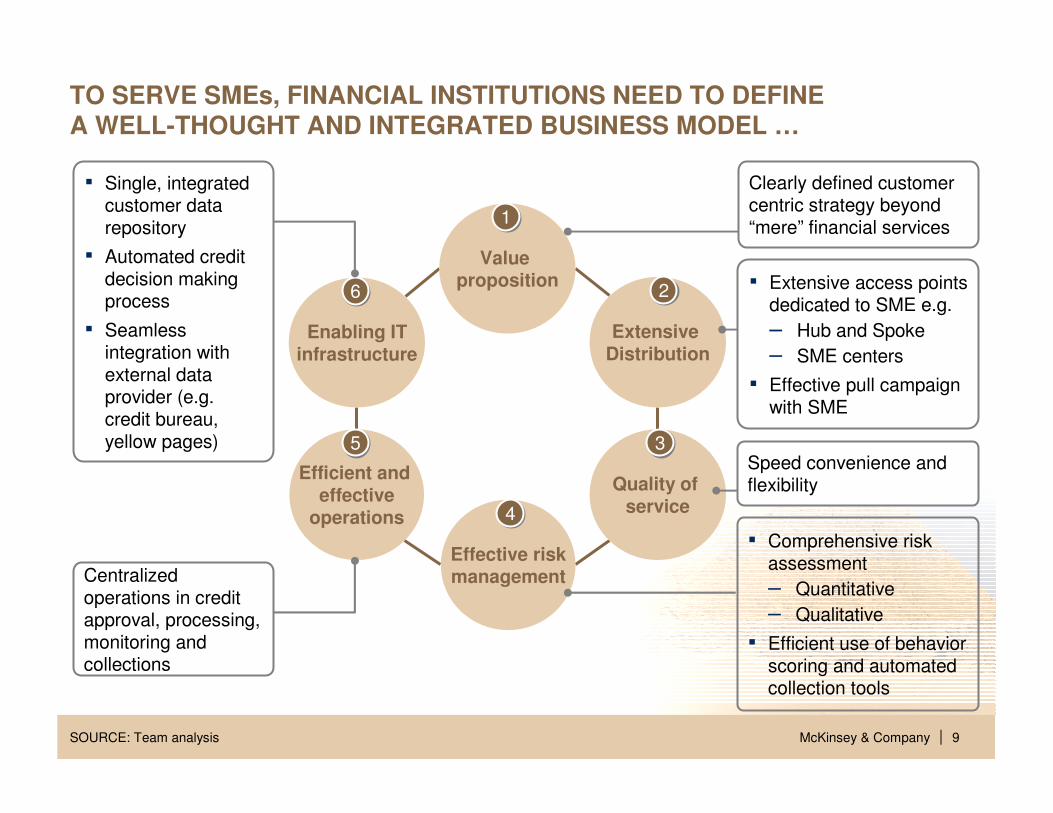
▪ Extensive access points dedicated to SME e.g.
– Hub and Spoke
– SME centers
▪ Effective pull campaign with SME
TO SERVE SMEs, FINANCIAL INSTITUTIONS NEED TO DEFINEA WELL-THOUGHT AND INTEGRATED BUSINESS MODEL …
SOURCE: Team analysis
Value proposition
Effective riskmanagement
Enabling ITinfrastructure
Extensive Distribution
Efficient and effective
operations
Quality of service
11
22
33
44
55
66
Clearly defined customer centric strategy beyond “mere” financial services
Speed convenience and flexibility
Centralized operations in credit approval, processing, monitoring and collections
▪ Single, integrated customer data repository
▪ Automated credit decision making process
▪ Seamless integration with external data provider (e.g. credit bureau, yellow pages)
▪ Comprehensive risk assessment
– Quantitative
– Qualitative
▪ Efficient use of behavior scoring and automated collection tools
McKinsey & Company 10|
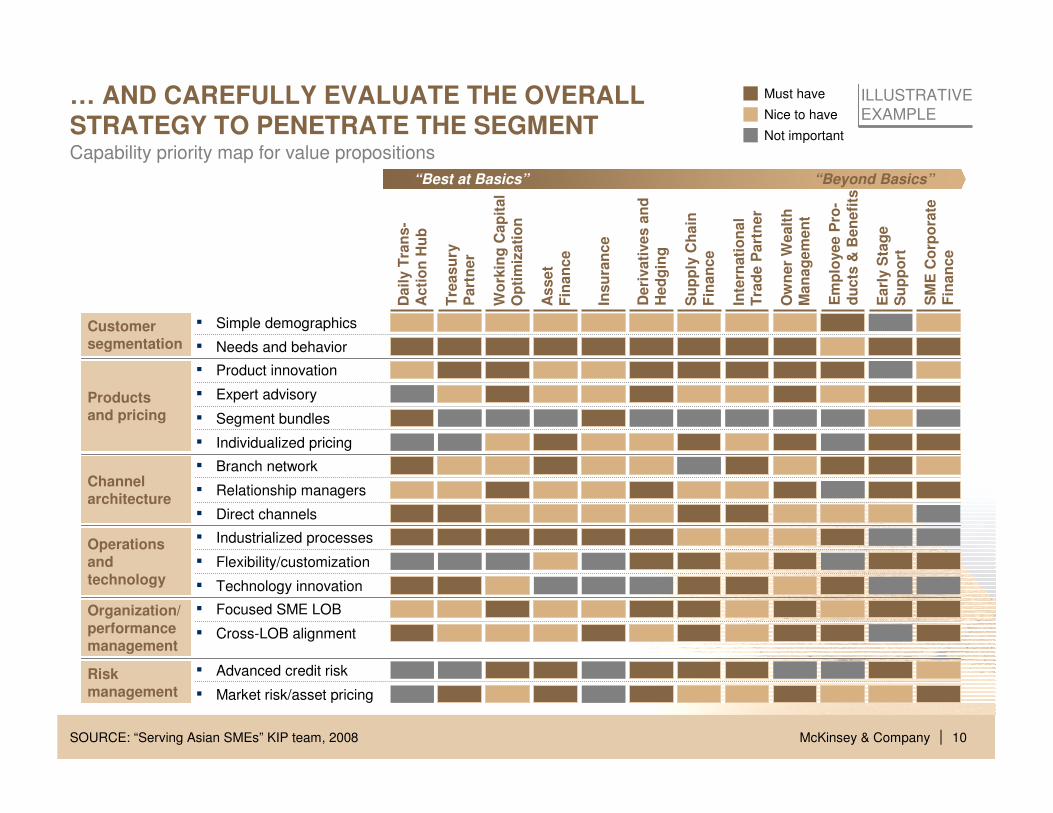
… AND CAREFULLY EVALUATE THE OVERALL STRATEGY TO PENETRATE THE SEGMENT
SOURCE: “Serving Asian SMEs” KIP team, 2008
Capability priority map for value propositions
Must have
Nice to have
Not important
ILLUSTRATIVE
EXAMPLE
Dail
y T
ran
s-
Acti
on
Hu
b
Tre
asu
ry
Part
ner
Wo
rkin
g C
ap
ital
Op
tim
izati
on
As
set
Fin
an
ce
Insu
ran
ce
Inte
rnati
on
al
Tra
de P
art
ner
Ow
ner
Wealt
hM
an
ag
em
en
t
Em
plo
yee P
ro-
du
cts
& B
en
efi
ts
Su
pp
ly C
hain
Fin
an
ce
Earl
y S
tag
eS
up
po
rt
SM
E C
orp
ora
teF
inan
ce
Deri
vati
ves a
nd
H
ed
gin
g
“Best at Basics” “Beyond Basics”
Risk
management
▪ Advanced credit risk
▪ Market risk/asset pricing
Organization/
performancemanagement
▪ Focused SME LOB
▪ Cross-LOB alignment
Operationsand
technology▪ Flexibility/customization
▪ Industrialized processes
▪ Technology innovation
Channel architecture
▪ Relationship managers
▪ Branch network
▪ Direct channels
Productsand pricing
▪ Expert advisory
▪ Segment bundles
▪ Product innovation
▪ Individualized pricing
Customersegmentation
▪ Simple demographics
▪ Needs and behavior
McKinsey & Company 11|
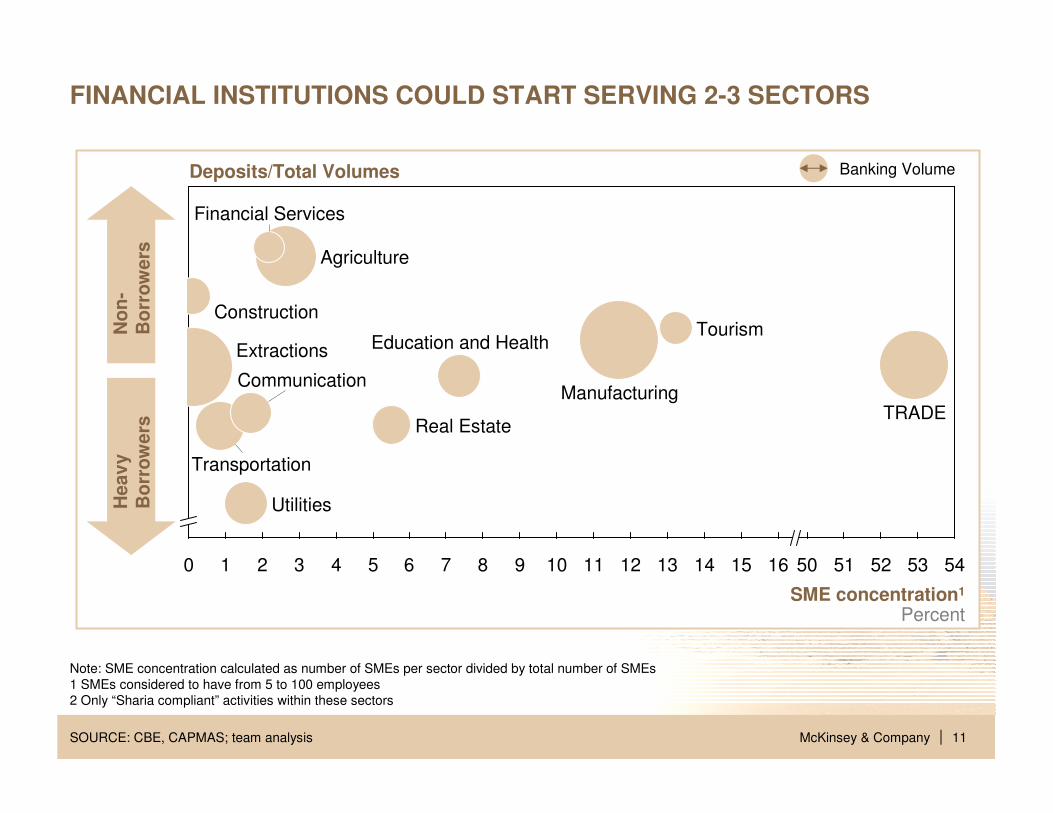
SME concentration1
Percent
5453524 5 6 7 81 10 11 12 13 14 15 16 50 5120
Utilities
Real Estate
Communication
Financial Services
Tourism
9
Education and Health
Construction
TRADE
Extractions
Agriculture
Manufacturing
3
Transportation
SOURCE: CBE, CAPMAS; team analysis
FINANCIAL INSTITUTIONS COULD START SERVING 2-3 SECTORS
Banking Volume
Note: SME concentration calculated as number of SMEs per sector divided by total number of SMEs
1 SMEs considered to have from 5 to 100 employees
2 Only “Sharia compliant” activities within these sectors
No
n-
Bo
rro
wers
Heav
y
Bo
rro
wers
Deposits/Total Volumes
McKinsey & Company 12|
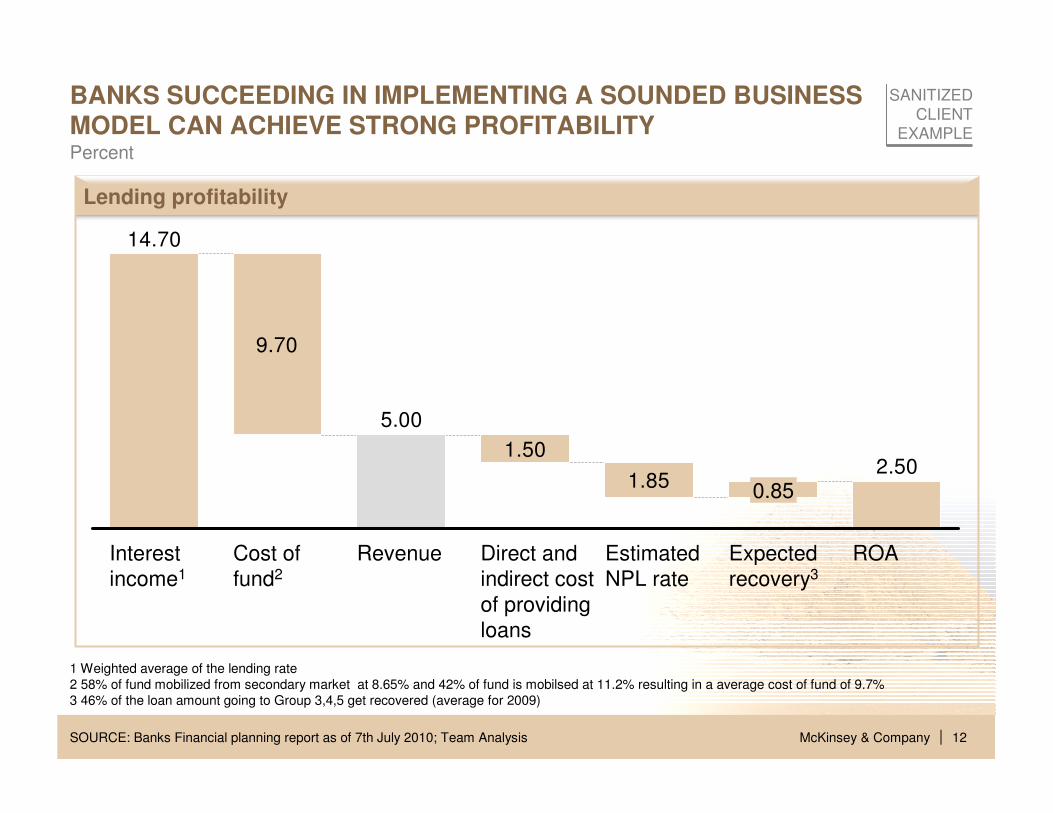
BANKS SUCCEEDING IN IMPLEMENTING A SOUNDED BUSINESS MODEL CAN ACHIEVE STRONG PROFITABILITY
1 Weighted average of the lending rate
2 58% of fund mobilized from secondary market at 8.65% and 42% of fund is mobilsed at 11.2% resulting in a average cost of fund of 9.7%
3 46% of the loan amount going to Group 3,4,5 get recovered (average for 2009)
SOURCE: Banks Financial planning report as of 7th July 2010; Team Analysis
Lending profitability
9.70
1.50
1.852.50
5.00
14.70
ROAExpected
recovery3
0.85
Estimated
NPL rate
Direct and
indirect cost
of providing
loans
RevenueCost of
fund2
Interest
income1
Percent
SANITIZED
CLIENT
EXAMPLE