Embed Size (px)
Citation preview
Innovative propeller thrust measurements – Saving opportunities
Erik van Ballegooijen, VAF Instruments
15 november 2016
2
Contents: 1. Factors influencing the propulsion efficiency 2. Propulsion Efficiencies 3. Working principle Thrust sensor TT-Sense® 4. Example of a +13000 TEU container vessel 5. IVY® Propulsion Performance Management 6. Conclusions
3
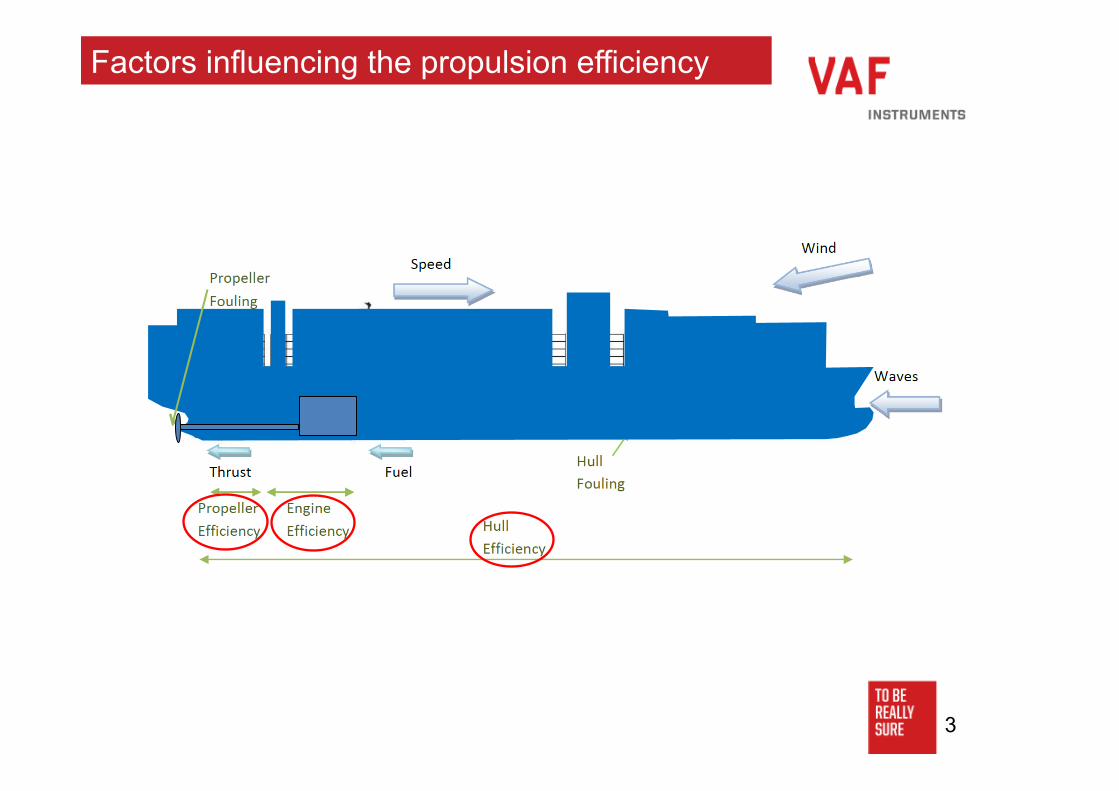
Factors influencing the propulsion efficiency
4
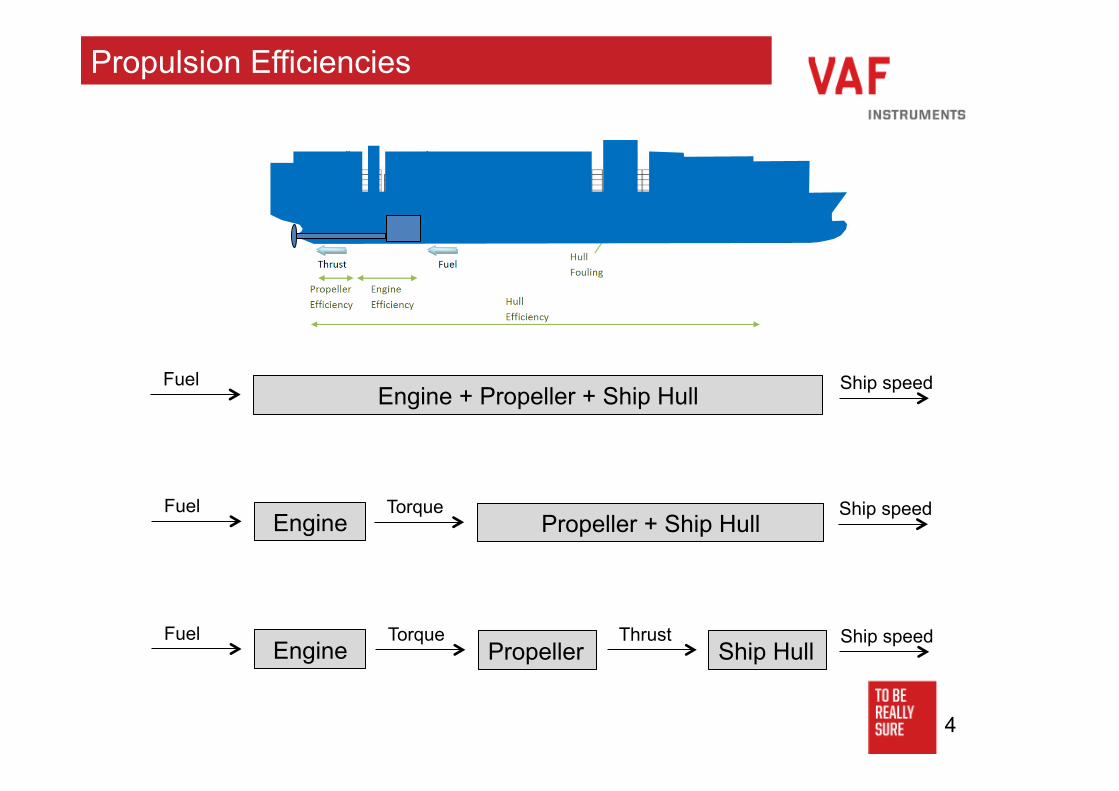
Propulsion Efficiencies
Propeller Ship Hull Torque Ship speed Thrust
Propeller + Ship Hull Torque Ship speed
Engine + Propeller + Ship Hull Fuel Ship speed
Engine Fuel
Engine Fuel
5
Propulsion Efficiencies
Propeller Ship Hull Torque Ship speed Thrust
Engine Fuel
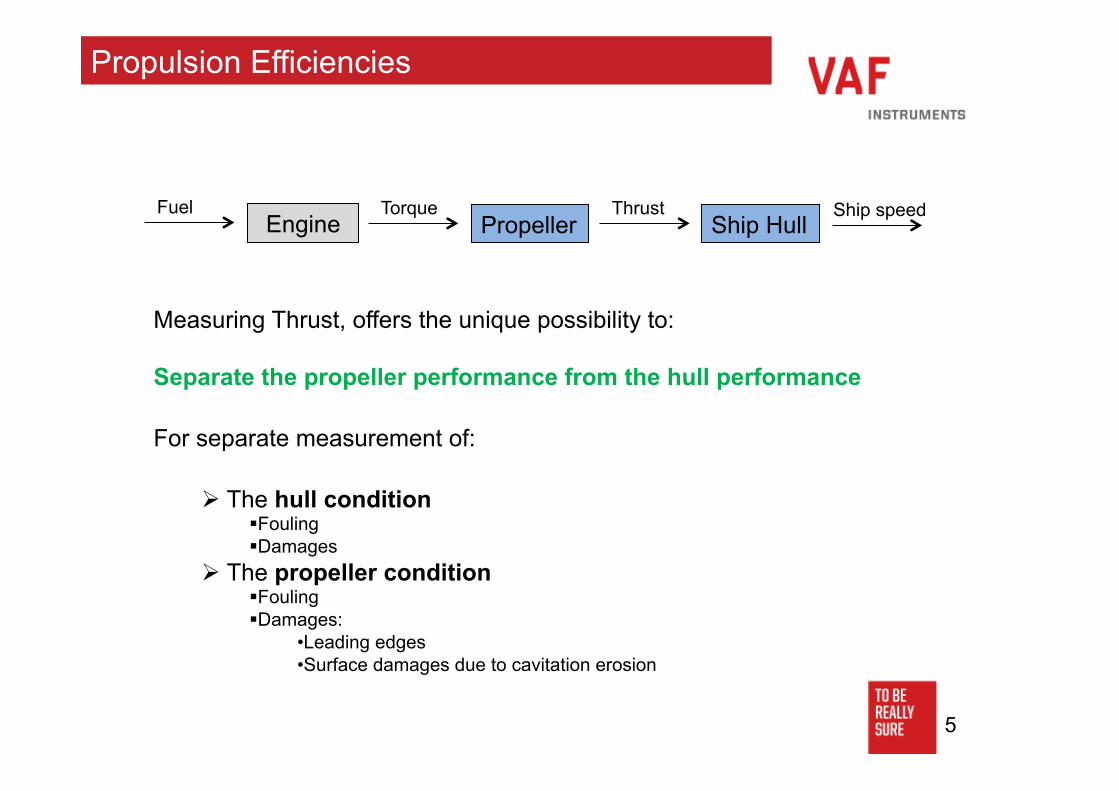
Measuring Thrust, offers the unique possibility to: Separate the propeller performance from the hull performance For separate measurement of:
Ø The hull condition § Fouling § Damages
Ø The propeller condition § Fouling § Damages:
• Leading edges • Surface damages due to cavitation erosion
6
Propulsion Efficiencies
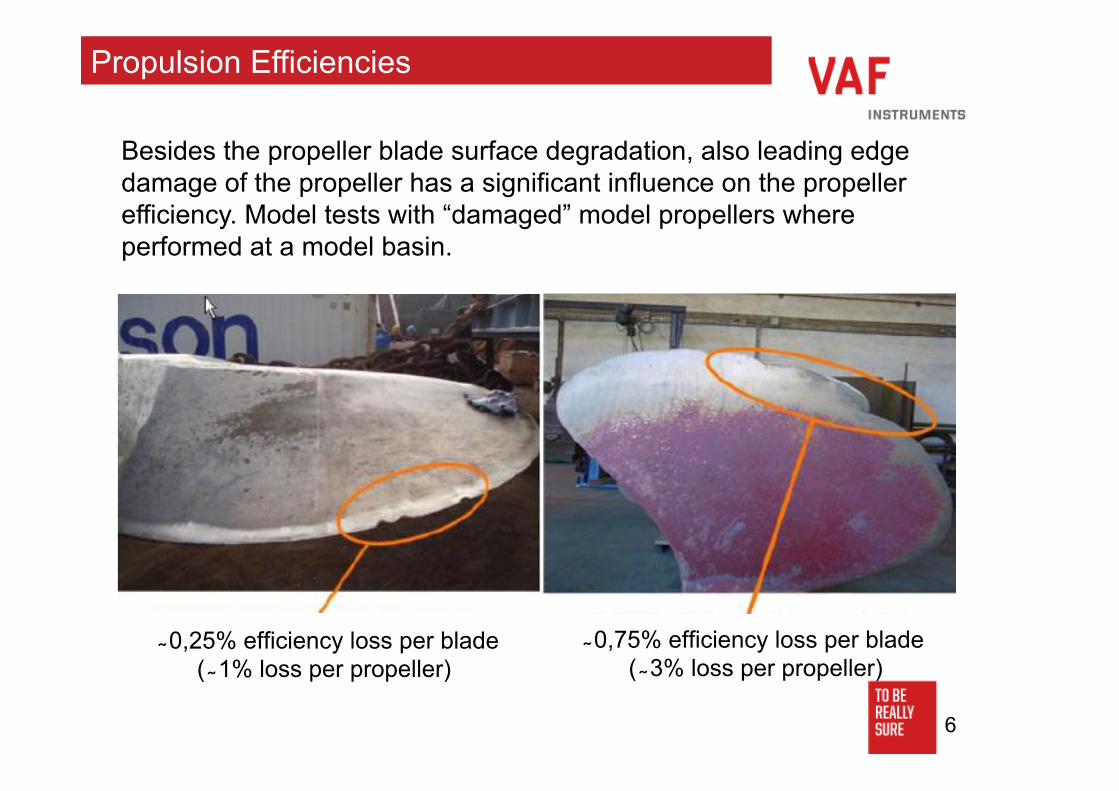
0,25% efficiency loss per blade ( 1% loss per propeller)
Besides the propeller blade surface degradation, also leading edge damage of the propeller has a significant influence on the propeller efficiency. Model tests with “damaged” model propellers where performed at a model basin.
0,75% efficiency loss per blade ( 3% loss per propeller)
7
Working principle Thrust sensor TT-Sense®
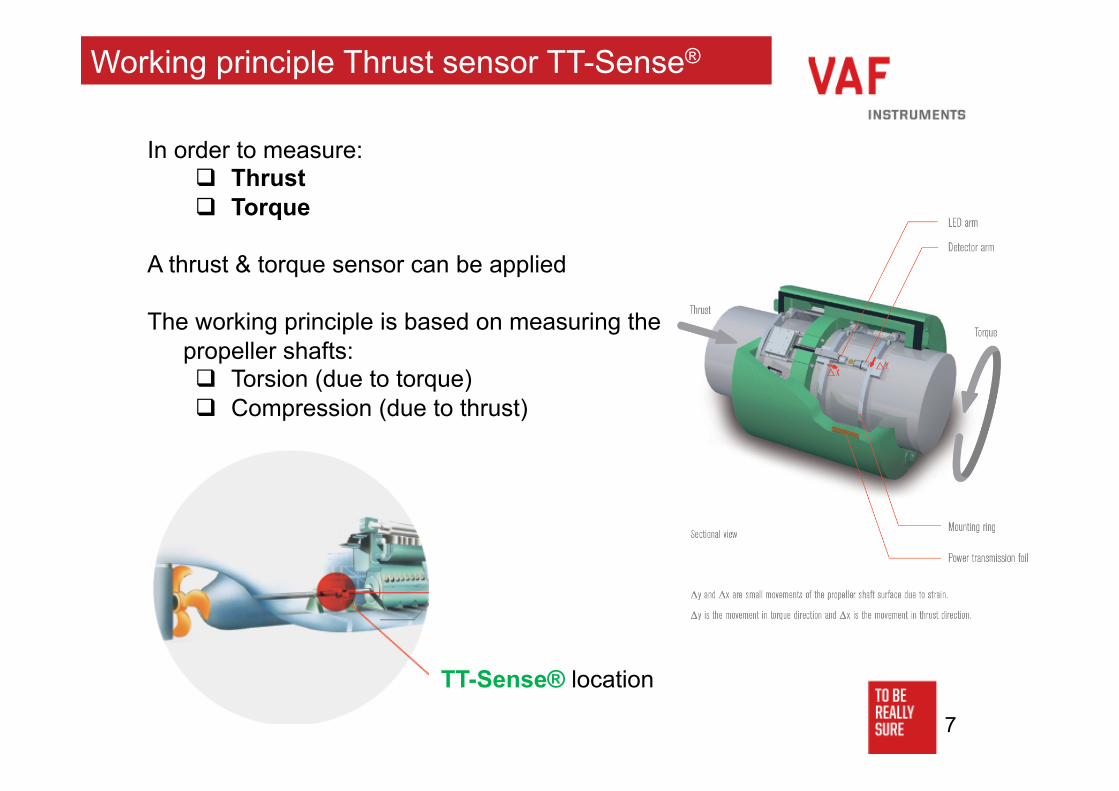
In order to measure: q Thrust q Torque
A thrust & torque sensor can be applied The working principle is based on measuring the
propeller shafts: q Torsion (due to torque) q Compression (due to thrust)
TT-Sense® location
8
Example of a +13000 TEU container vessel
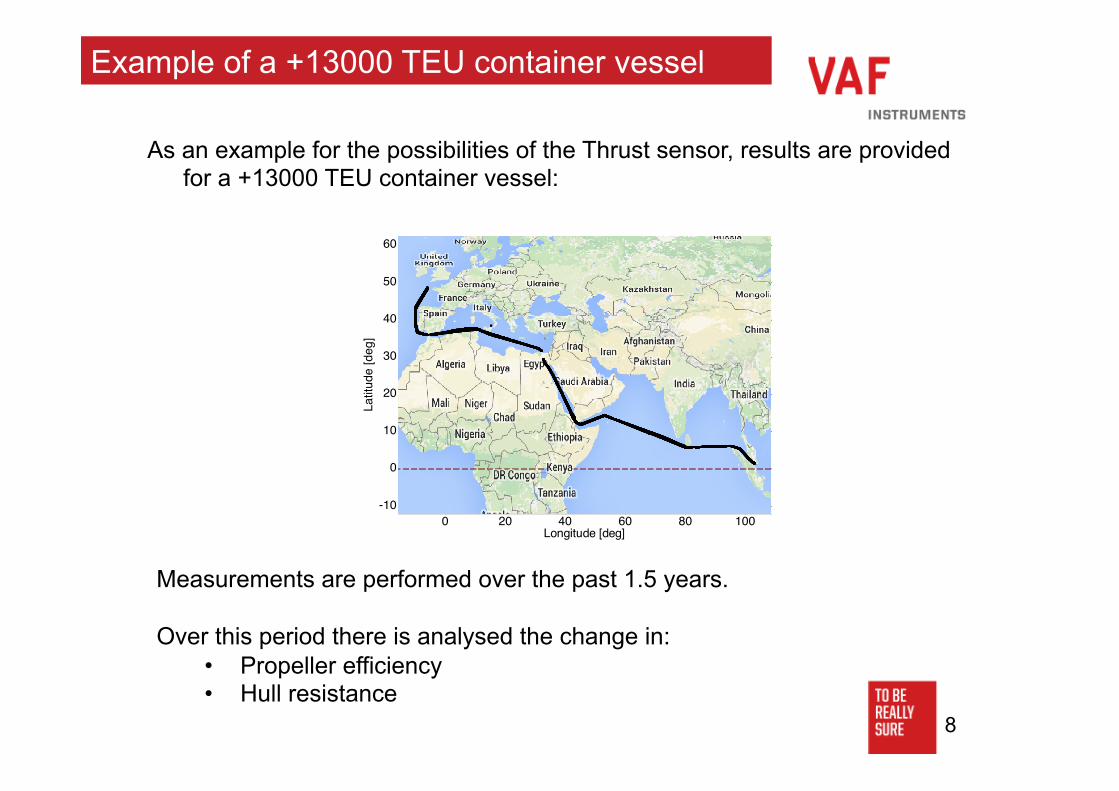
As an example for the possibilities of the Thrust sensor, results are provided for a +13000 TEU container vessel:
Measurements are performed over the past 1.5 years. Over this period there is analysed the change in:
• Propeller efficiency • Hull resistance
0 20 40 60 80 100-10
0
10
20
30
40
50
60
Longitude [deg]
Latit
ude
[deg
]
9
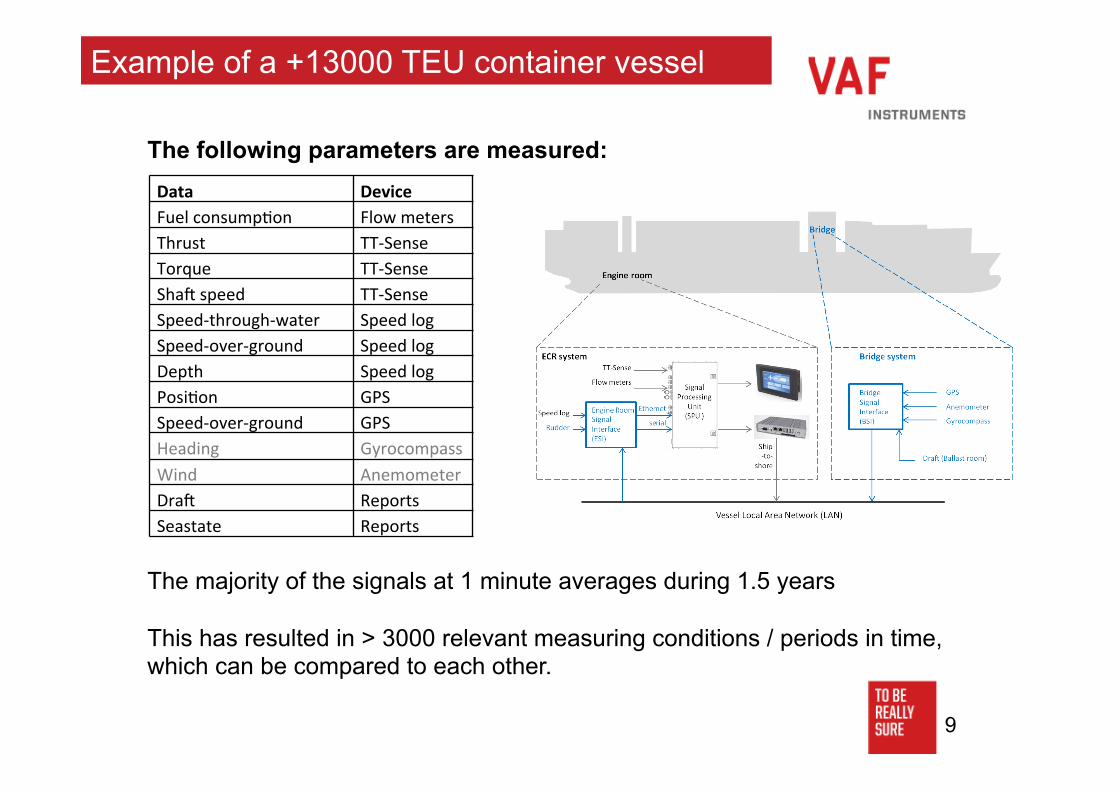
Example of a +13000 TEU container vessel
The following parameters are measured: The majority of the signals at 1 minute averages during 1.5 years This has resulted in > 3000 relevant measuring conditions / periods in time, which can be compared to each other.
Data Device Fuel consump,on Flow meters Thrust TT-‐Sense Torque TT-‐Sense Sha6 speed TT-‐Sense Speed-‐through-‐water Speed log Speed-‐over-‐ground Speed log Depth Speed log Posi,on GPS Speed-‐over-‐ground GPS Heading Gyrocompass Wind Anemometer Dra6 Reports Seastate Reports
10
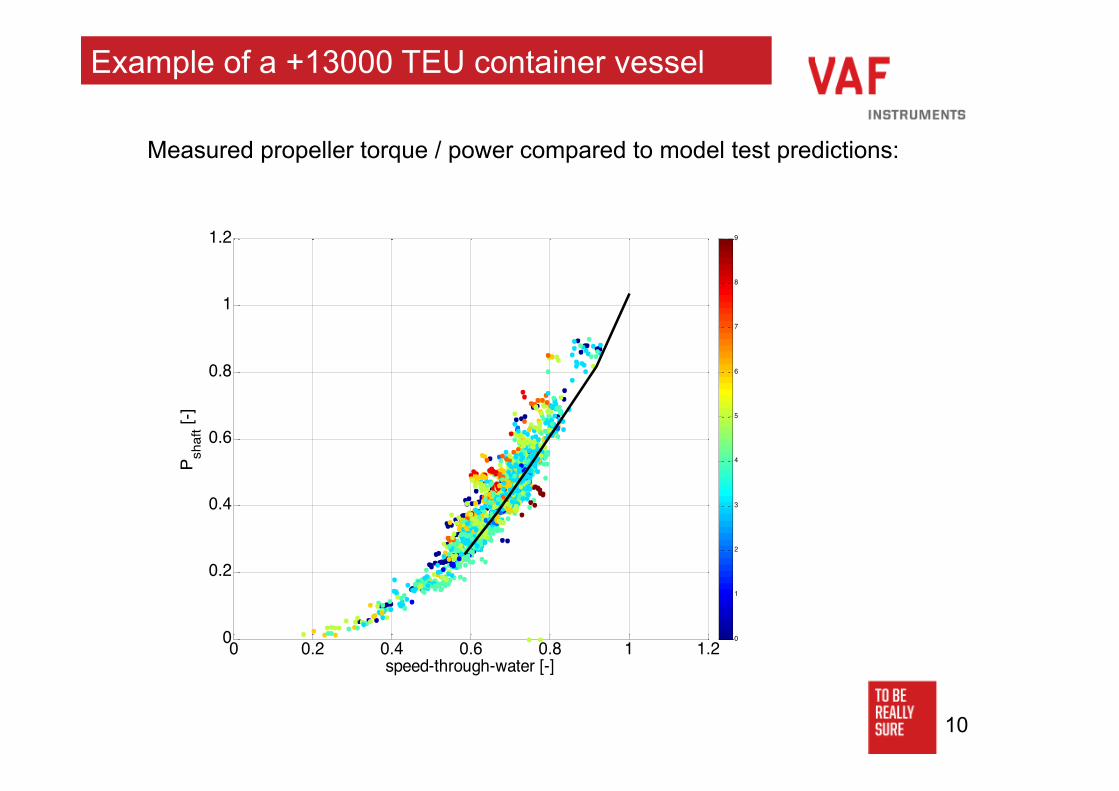
Example of a +13000 TEU container vessel
Measured propeller torque / power compared to model test predictions:
0 0.2 0.4 0.6 0.8 1 1.20
0.2
0.4
0.6
0.8
1
1.2
speed-through-water [-]
P shaf
t [-]
0
1
2
3
4
5
6
7
8
9
11
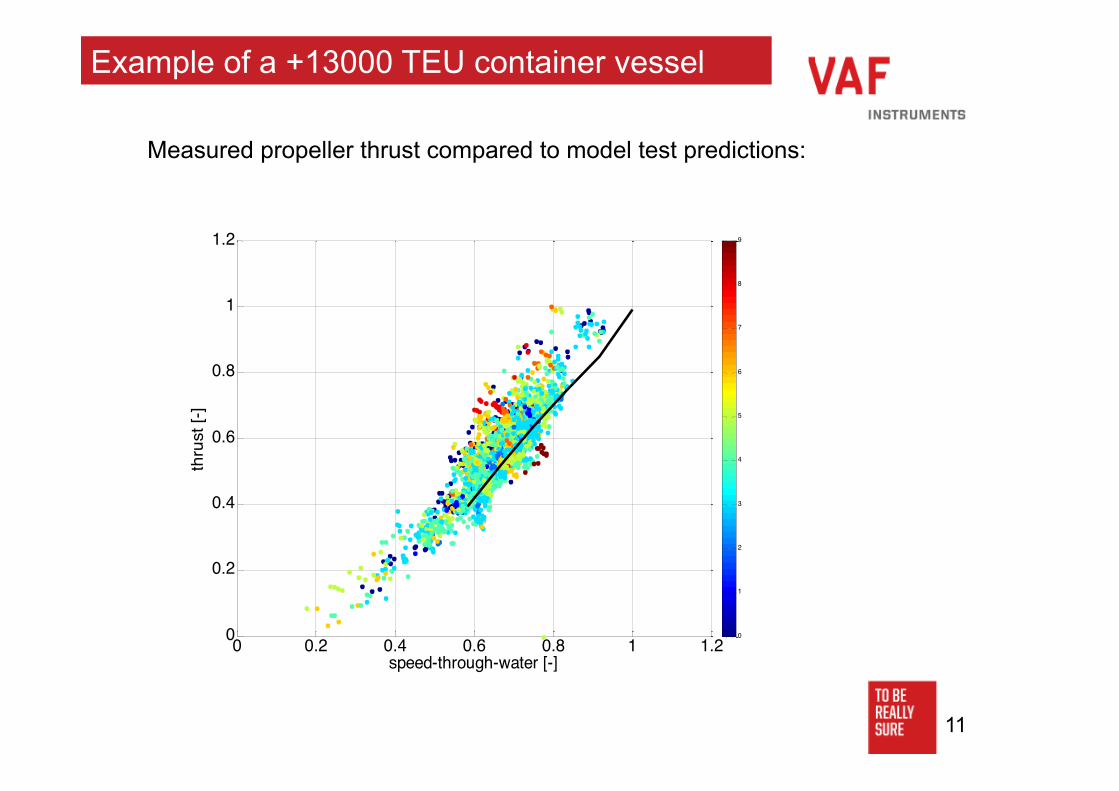
Example of a +13000 TEU container vessel
Measured propeller thrust compared to model test predictions:
0 0.2 0.4 0.6 0.8 1 1.20
0.2
0.4
0.6
0.8
1
1.2
speed-through-water [-]
thru
st [-
]
0
1
2
3
4
5
6
7
8
9
12
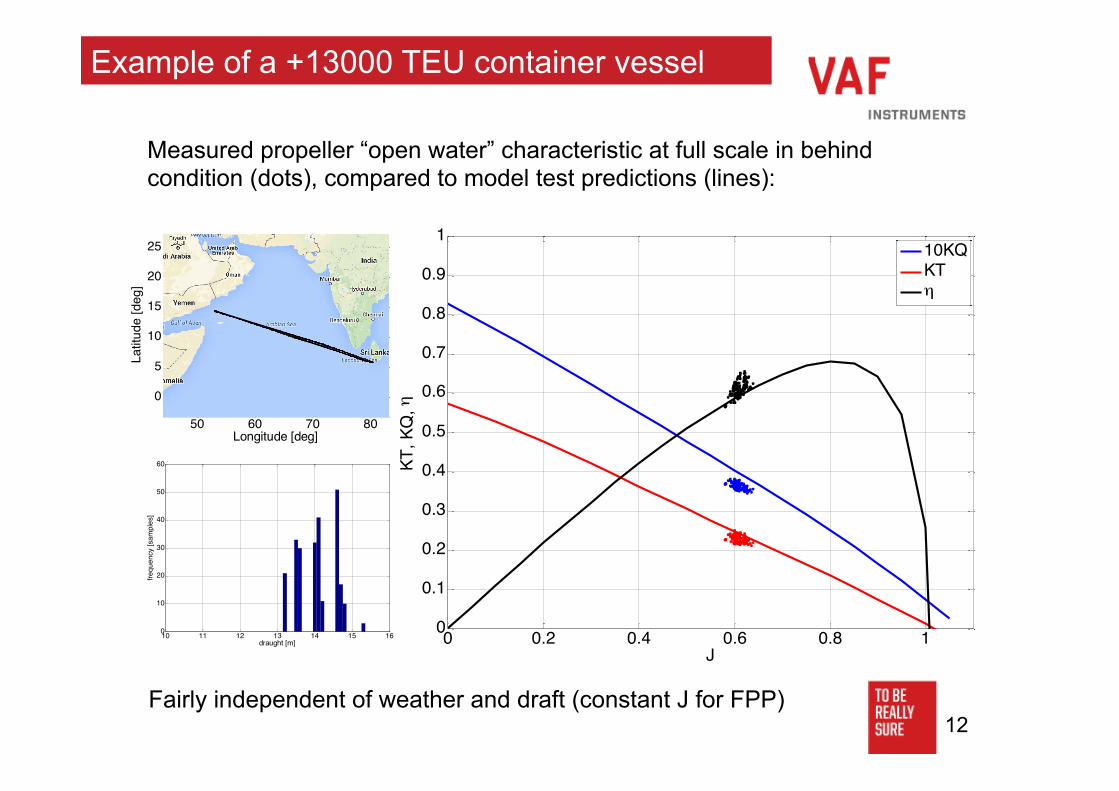
Example of a +13000 TEU container vessel
Measured propeller “open water” characteristic at full scale in behind condition (dots), compared to model test predictions (lines):
50 60 70 80
0
5
10
15
20
25
Longitude [deg]
Latit
ude
[deg
]
0 0.2 0.4 0.6 0.8 10
0.1
0.2
0.3
0.4
0.5
0.6
0.7
0.8
0.9
1
J
KT, K
Q, η
10KQKTη
Fairly independent of weather and draft (constant J for FPP)
10 11 12 13 14 15 160
10
20
30
40
50
60
draught [m]
frequ
ency
[sam
ples
]
13
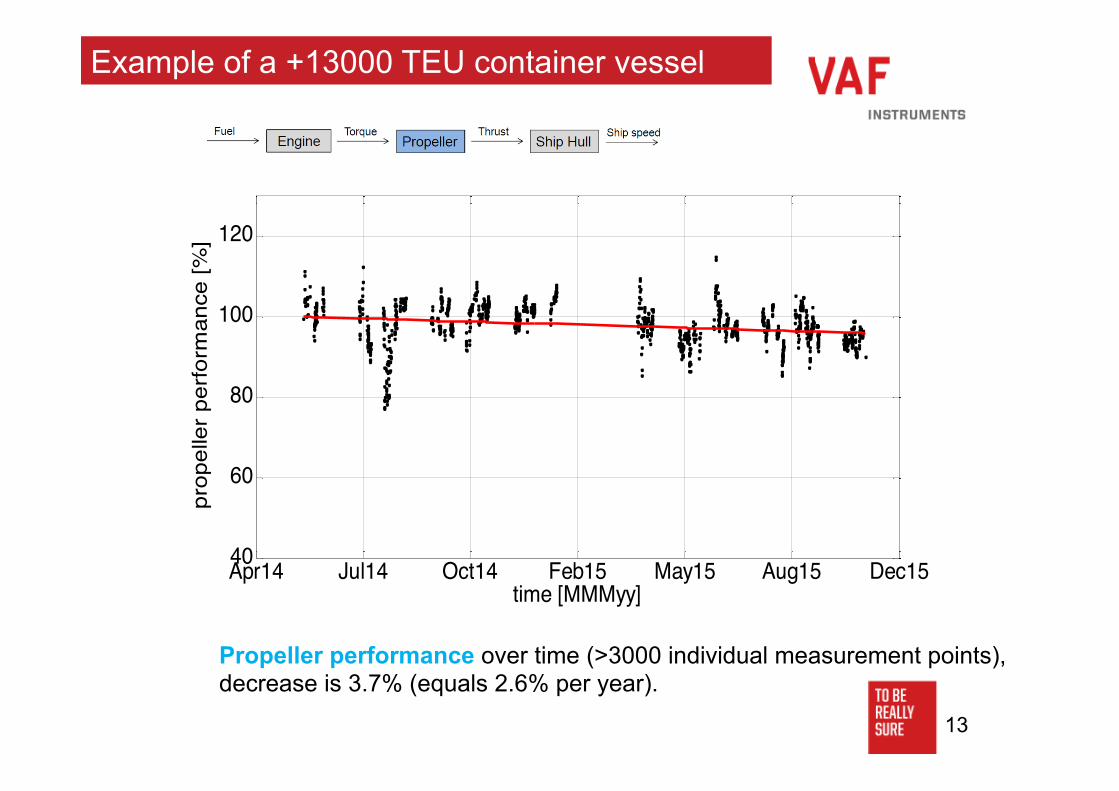
Example of a +13000 TEU container vessel
Propeller performance over time (>3000 individual measurement points), decrease is 3.7% (equals 2.6% per year).
Apr14 Jul14 Oct14 Feb15 May15 Aug15 Dec1540
60
80
100
120
time [MMMyy]
prop
elle
r per
form
ance
[%]
14
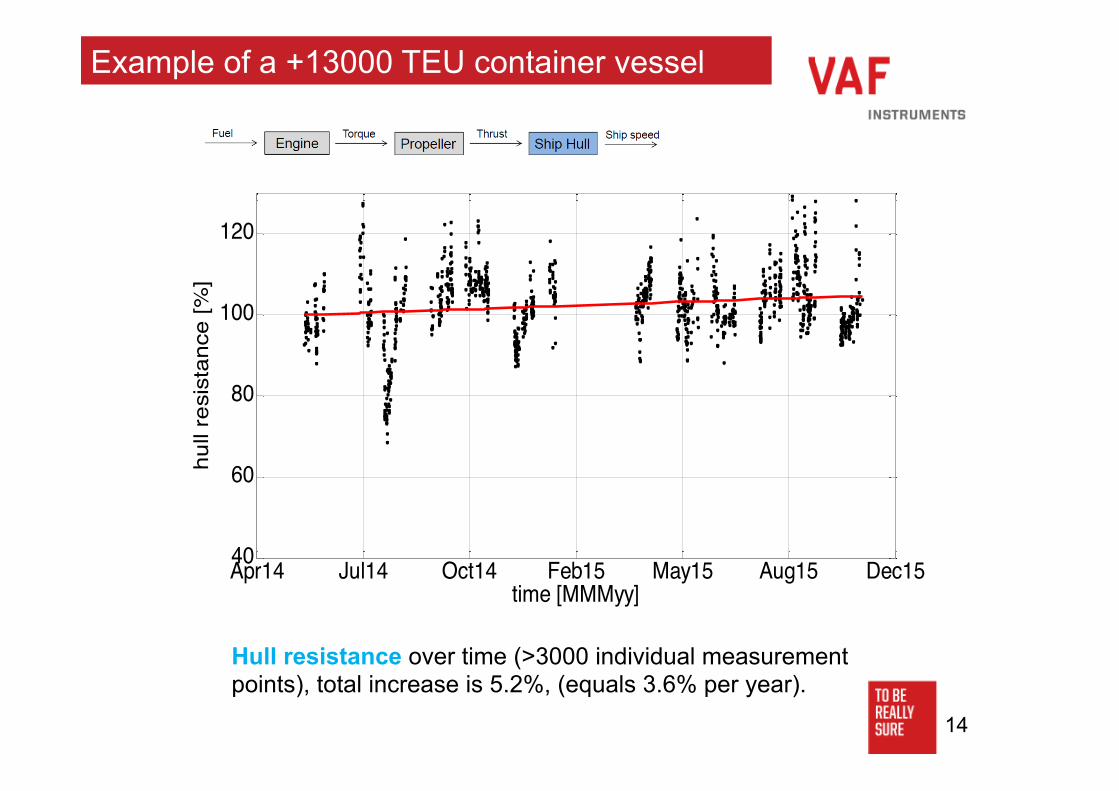
Example of a +13000 TEU container vessel
Hull resistance over time (>3000 individual measurement points), total increase is 5.2%, (equals 3.6% per year).
Apr14 Jul14 Oct14 Feb15 May15 Aug15 Dec1540
60
80
100
120
time [MMMyy]
hull
resi
stan
ce [%
]
15
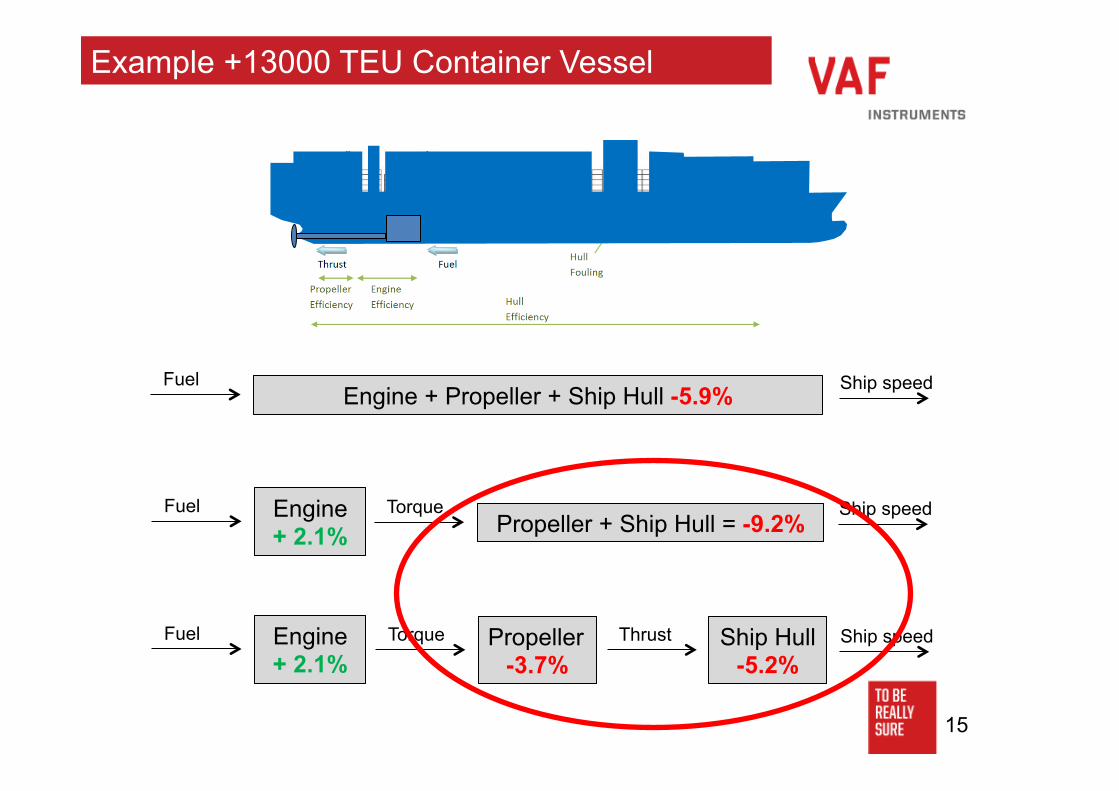
Example +13000 TEU Container Vessel
Propeller -3.7%
Ship Hull -5.2%
Torque Ship speed Thrust
Propeller + Ship Hull = -9.2% Torque Ship speed
Engine + Propeller + Ship Hull -5.9% Fuel Ship speed
Engine + 2.1%
Fuel
Engine + 2.1%
Fuel
16
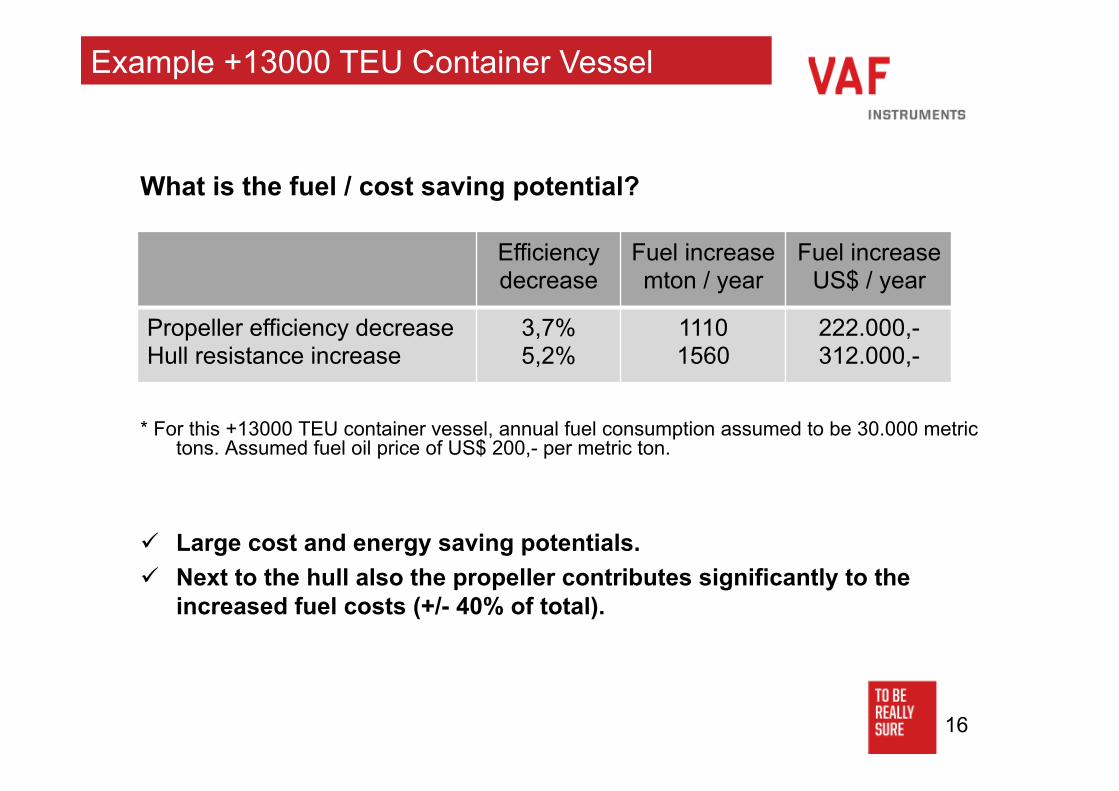
What is the fuel / cost saving potential?
* For this +13000 TEU container vessel, annual fuel consumption assumed to be 30.000 metric
tons. Assumed fuel oil price of US$ 200,- per metric ton.
ü Large cost and energy saving potentials. ü Next to the hull also the propeller contributes significantly to the
increased fuel costs (+/- 40% of total).
Efficiency decrease
Fuel increase mton / year
Fuel increase US$ / year
Propeller efficiency decrease Hull resistance increase
3,7% 5,2%
1110 1560
222.000,- 312.000,-
Example +13000 TEU Container Vessel
17
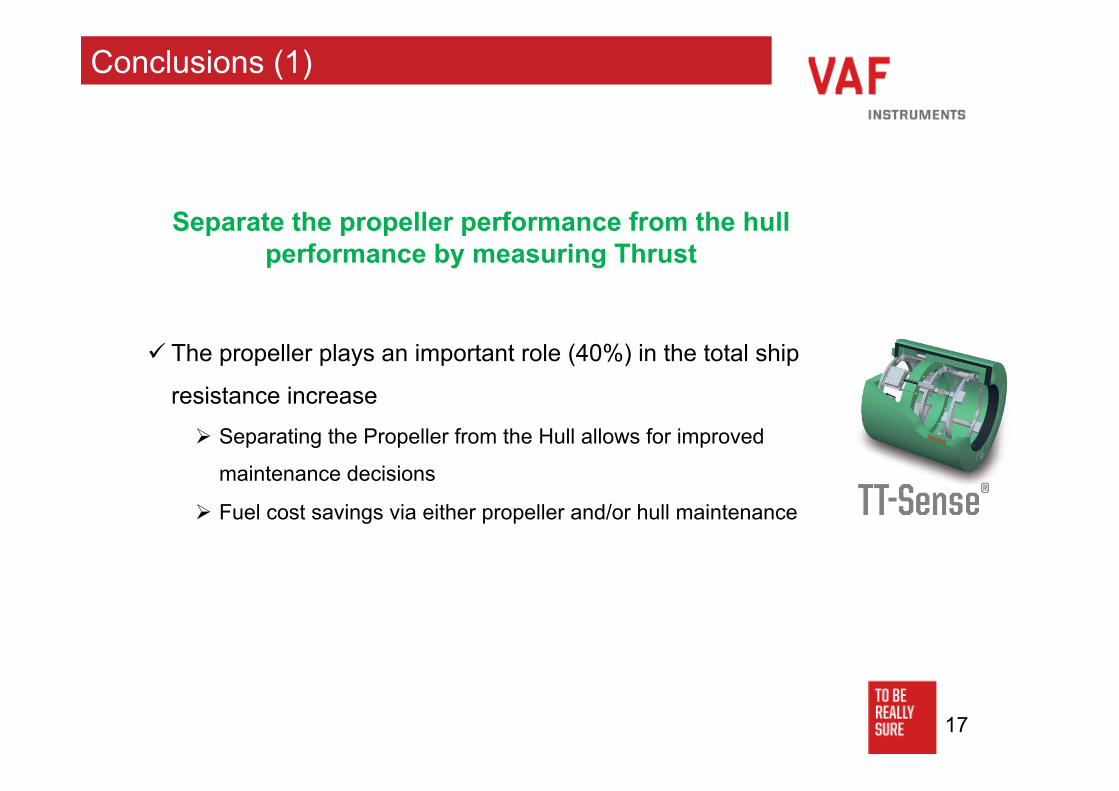
Conclusions (1)
Separate the propeller performance from the hull performance by measuring Thrust
ü The propeller plays an important role (40%) in the total ship
resistance increase
Ø Separating the Propeller from the Hull allows for improved
maintenance decisions
Ø Fuel cost savings via either propeller and/or hull maintenance
18
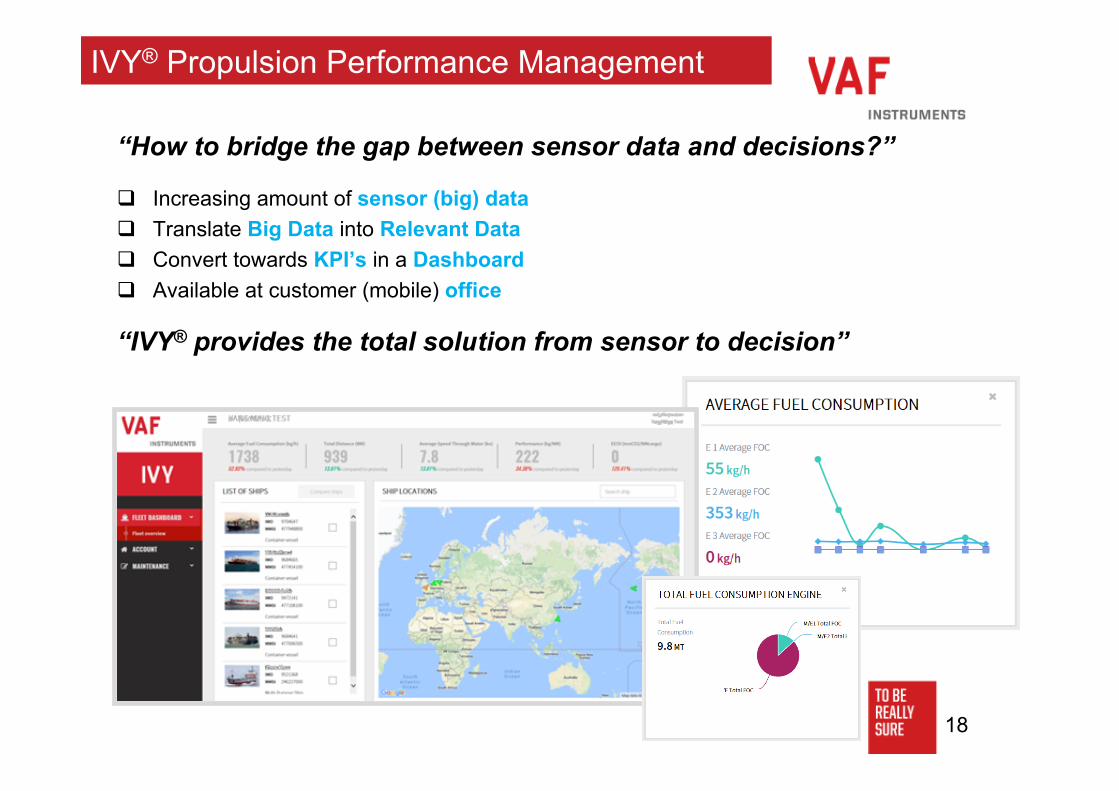
“How to bridge the gap between sensor data and decisions?”
q Increasing amount of sensor (big) data q Translate Big Data into Relevant Data q Convert towards KPI’s in a Dashboard q Available at customer (mobile) office
“IVY® provides the total solution from sensor to decision”
IVY® Propulsion Performance Management
19
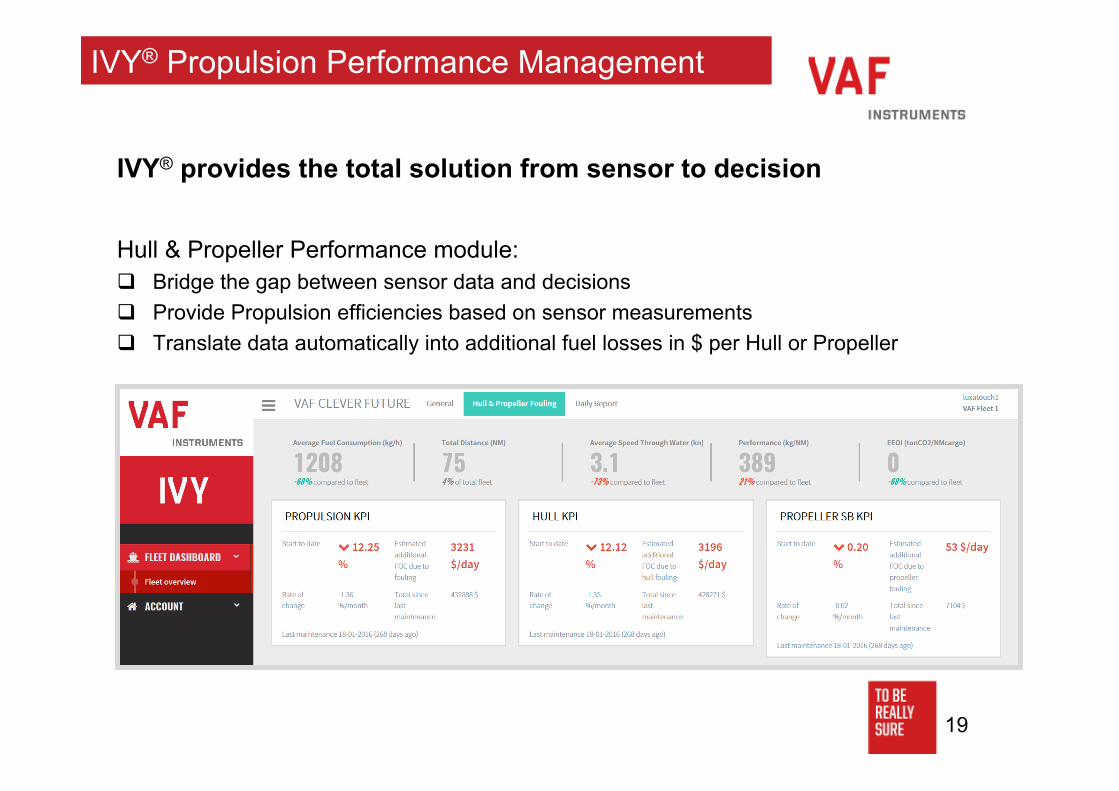
IVY® provides the total solution from sensor to decision Hull & Propeller Performance module: q Bridge the gap between sensor data and decisions q Provide Propulsion efficiencies based on sensor measurements q Translate data automatically into additional fuel losses in $ per Hull or Propeller
IVY® Propulsion Performance Management
20
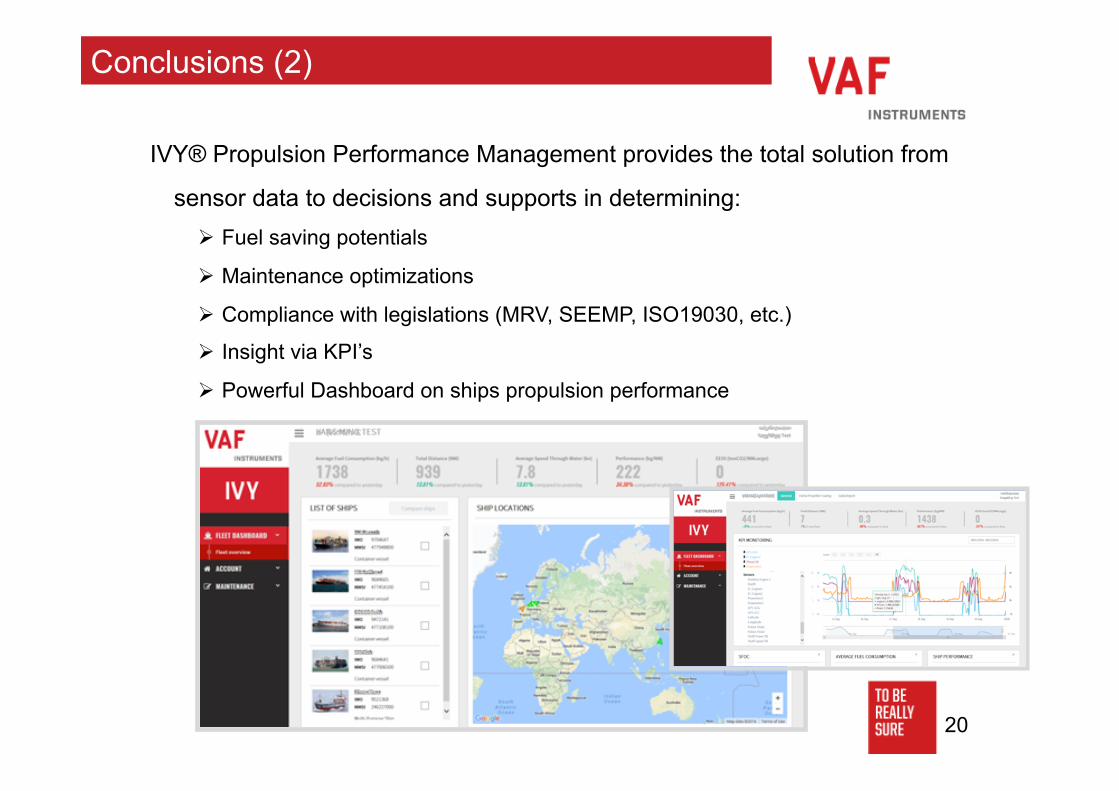
Conclusions (2)
IVY® Propulsion Performance Management provides the total solution from
sensor data to decisions and supports in determining: Ø Fuel saving potentials
Ø Maintenance optimizations
Ø Compliance with legislations (MRV, SEEMP, ISO19030, etc.)
Ø Insight via KPI’s
Ø Powerful Dashboard on ships propulsion performance
21
Thank you for your attention