Embed Size (px)
Citation preview
Innovators in Supply
Chain Security:
Better Security Drives Business Value
July 2006
ANUFACTURINGINSTITUTE
THE
MANUFACTURING MAKES AMERICA STRONG
The Manufacturing Innovation Series
Innovators in Supply
Chain Security:
Better Security Drives Business Value
July 2006
By Barchi Peleg-Gillai, Gauri Bhat and Lesley Sept
Stanford University
The Manufacturing Innovation Series
Table of Contents
Foreword . . . . . . . . . . . . . . . . . . . . . . . . . . . . . . . . . . . . . . . . . . . . . . . . . . . . . . . . . . . . . . . . . . . . 1
Acknowledgements . . . . . . . . . . . . . . . . . . . . . . . . . . . . . . . . . . . . . . . . . . . . . . . . . . . . . . . . . . . . 2
Executive Summary. . . . . . . . . . . . . . . . . . . . . . . . . . . . . . . . . . . . . . . . . . . . . . . . . . . . . . . . . . . . . 3
Introduction . . . . . . . . . . . . . . . . . . . . . . . . . . . . . . . . . . . . . . . . . . . . . . . . . . . . . . . . . . . . . . . . . . 5
Methodology . . . . . . . . . . . . . . . . . . . . . . . . . . . . . . . . . . . . . . . . . . . . . . . . . . . . . . . . . . . . . . . . 11
Manufacturers . . . . . . . . . . . . . . . . . . . . . . . . . . . . . . . . . . . . . . . . . . . . . . . . . . . . . . . . . . . . . . . 13
Overview of Security Initiatives . . . . . . . . . . . . . . . . . . . . . . . . . . . . . . . . . . . . . . . . . . . . . . . . 13
Overview of Collateral Benefits . . . . . . . . . . . . . . . . . . . . . . . . . . . . . . . . . . . . . . . . . . . . . . . . 14
Inventory Management and Customer Service. . . . . . . . . . . . . . . . . . . . . . . . . . . . . . . . . . . 15
Visibility . . . . . . . . . . . . . . . . . . . . . . . . . . . . . . . . . . . . . . . . . . . . . . . . . . . . . . . . . . . . . . . . 17
Efficiency . . . . . . . . . . . . . . . . . . . . . . . . . . . . . . . . . . . . . . . . . . . . . . . . . . . . . . . . . . . . . . . 19
Resilience . . . . . . . . . . . . . . . . . . . . . . . . . . . . . . . . . . . . . . . . . . . . . . . . . . . . . . . . . . . . . . . 21
Customer Relations . . . . . . . . . . . . . . . . . . . . . . . . . . . . . . . . . . . . . . . . . . . . . . . . . . . . . . . 22
Logistics Service Providers . . . . . . . . . . . . . . . . . . . . . . . . . . . . . . . . . . . . . . . . . . . . . . . . . . . . . . . 24
Overview of Security Initiatives . . . . . . . . . . . . . . . . . . . . . . . . . . . . . . . . . . . . . . . . . . . . . . . . 24
Overview of Collateral Benefits . . . . . . . . . . . . . . . . . . . . . . . . . . . . . . . . . . . . . . . . . . . . . . . . 25
Inventory Management and Customer Service. . . . . . . . . . . . . . . . . . . . . . . . . . . . . . . . . . . 25
Visibility . . . . . . . . . . . . . . . . . . . . . . . . . . . . . . . . . . . . . . . . . . . . . . . . . . . . . . . . . . . . . . . . 26
Efficiency . . . . . . . . . . . . . . . . . . . . . . . . . . . . . . . . . . . . . . . . . . . . . . . . . . . . . . . . . . . . . . . 26
Resilience . . . . . . . . . . . . . . . . . . . . . . . . . . . . . . . . . . . . . . . . . . . . . . . . . . . . . . . . . . . . . . . 27
Customer Relations . . . . . . . . . . . . . . . . . . . . . . . . . . . . . . . . . . . . . . . . . . . . . . . . . . . . . . . 27
Summary and Conclusions . . . . . . . . . . . . . . . . . . . . . . . . . . . . . . . . . . . . . . . . . . . . . . . . . . . . . . 29
Appendix: Questionnaire . . . . . . . . . . . . . . . . . . . . . . . . . . . . . . . . . . . . . . . . . . . . . . . . . . . . . . . 31
Foreword
1
On behalf of The Manufacturing Institute (institute)—the research and education arm of theNational Association of Manufacturers (NAM)—and the IBM Corporation, we are pleased topresent this new report, “Innovators in Supply Chain Security: Better Security Drives BusinessValue,” by Barchi Peleg-Gillai, Gauri Bhat and Lesley Sept of Stanford University.
This study is the latest in the institute’s ``Innovation Series” and the third comprehensive report IBMhas sponsored regarding supply chain security. In 2004, IBM partnered with Michigan State Universityto publish “Enhancing Security Throughout the Supply Chain” to help businesses better understandthe threat to supply chains from disruptions. IBM partnered with the Massachusetts Institute ofTechnology (MIT) in 2005 to publish ``Investing in Supply Chain Security: Collateral Benefits” thatidentified collateral, or indirect, benefits that companies may receive from security investments.
Recent global incidents such as acts of terrorism, natural disasters and energy shortages have exposedthe vulnerability of supply chains to disruptions. Governments and many companies are aware of thepotential impact to the global economy that disruptions in supply chains can cause and recognizethe need to invest in security measures that will mitigate the risks to the global supply chain uponwhich business depends.
Companies traditionally find it challenging to justify security-related investments because they focuslargely on the direct expenses and not on the collateral benefits (e.g., supply chain efficiency, improvedcustomer satisfaction, improved inventory management, etc.) that may be realized. Limited researchhas been completed regarding the creation of collateral benefits from security investments. To fill thisgap, the institute and Stanford University have conducted a study to confirm and quantify the magni-tude of collateral benefits received by a select group of companies that are considered ``innovators”in supply chain security in their industries such as chemicals, consumer goods, food, informationtechnology, automotive parts and logistics service providers.
Although the results of this study should not be considered as representative of the industry average,the findings clearly indicate that significant business value accrues from supply chain security invest-ments. The innovative companies participating in this study received the expected security benefitsfrom their investments (e.g., reduced risk, less theft and pilferage, etc.), but also quantified numerouscollateral benefits they received, such as:
• Higher supply chain visibility;• Improved supply chain efficiency;• Better customer satisfaction;• Improved inventory management;• Reduced cycle time and shipping time; and• Cost reduction following the above-mentioned collateral benefits.
Additional work remains to be done, but we trust that the significant and numerous collateral businessbenefits quantified in this study will serve to encourage other companies and their trading partnersto further invest in the security of the global supply chain we share.
Jerry J. Jasinowski Robert W. Moffat, Jr.President Senior Vice President, Integrated OperationsThe Manufacturing Institute IBM Corporation
Acknowledgements
2
The Manufacturing Institute (institute)—the research and education arm of the National Associationof Manufacturers (NAM)—partnered with Stanford University’s Global Supply Chain ManagementForum (Forum) to develop this report. A generous grant from IBM and the active participation ofseveral IBM executives made this insightful report possible.
We first want to thank the Forum team at Stanford which brought together their knowledge of themanufacturing and distribution supply chain to help shape the survey upon which this is based andthen provided the analysis for the report: Director of Research Barchi Peleg-Gillai; Forum Co-DirectorHau Lee; Assistant Director of the Forum Lesley Sept; and their Research Assistant Gauri Bhat. Theirdeep understanding of threats to business supply chains, patience and good judgment made itpossible to proceed with this initiative expeditiously and professionally.
Several IBM executives and their teams gave generously of their time and expertise as well. Specialthanks to Senior Vice President for Integrated Operations Bob Moffat, of IBM and a trustee of theinstitute, who set the gears in motion for developing this report in the first place. We thank himfor his ongoing direction and support.
We also thank the representatives of all participating companies for the hours they spent completingthe survey and providing us with further information regarding security initiatives taken by theirrespective organizations, as well as for providing us with further insights on the topic.
At the institute, we thank President Jerry Jasinowski for seeing the value of this report for all manu-facturers and for encouraging us to pursue it. We also thank Vice President Bill Canis, who broughtthe manufacturing community views to bear in shaping the survey, identifying companies for thesurvey and managing this project at the institute’s end. We are grateful to the institute’s Vice Presidentof Communications Laura Narvaiz for initiating the media program and promoting the reportwidely among the media.
Design kudos go to NAM Production Artist Ronni Hutchason, who designed this report and coor-dinated its printing, and to NAM Associate Director of Corporate Communications Kitty Brims forher many good edits and proofreading.
Executive Summary
3
Following terrorist attacks in recent years, firms have been taking multiple steps—either voluntarilyor to meet mandated government regulations—to ensure safe transit of their goods across inter-national borders. In parallel, natural disasters such as Hurricane Katrina, as well as many other unfore-seen events such as product contamination and adulteration, shortages, border closings and strikesby ports, made firms more aware of the vulnerability of their supply chains, and encouraged themto seek ways to reduce risks of such unforeseeable situations and increase stability along theirsupply chain.
Some of the initiatives taken by the U.S. government to assess and minimize the risk involved ininternational transportation of goods, include, among others, the Container Security Initiative (CSI),the Customs-Trade Partnership Against Terrorism (C-TPAT), the Advanced Manifest Rule (AMR) andthe Free and Secure Trade initiative (FAST). Other initiatives, which took place outside the UnitedStates, include the publication of the ISO/PAS 28000:2005 standard ``Specification for security manage-ment systems for the supply chain” by the International Organization for Standardization (ISO); thedevelopment of the Framework of Standards to Secure and Facilitate Global Trade by members ofthe World Customs Organization (WCO); a series of measures that were presented by the EuropeanCommission to accelerate implementation of the WCO Framework, including the Authorized EconomicOperator (AEO) program; as well as various initiatives that were taken by the World Trade Organization(WTO) to better facilitate trade.
In addition to these government activities, businesses are also proactively seeking ways to mitigatesimilar risks. For example, in order to achieve organizational resilience, some companies choose toincrease flexibility of their operations (e.g., by using interchangeable or generic parts, cross-trainingemployees, postponing differentiating process steps to a later point in the production process, ordiversifying their supplier base and portfolio of locations) and/or to make changes in corporate culture(e.g., encourage continuous communication among informed employees, and empower employeesto take necessary actions in the face of unexpected events). Other companies improve their facilitiesdesign to protect against infrastructure loss and enable faster recovery from natural disasters.
While these and other initiatives allow companies to maintain their level of operations and/or to reducerisks, they require significant levels of investment. Unfortunately, so far many organizations havefound it difficult to provide a business case to justify security investments, and are therefore reluctantto invest in security beyond the minimum necessary. In our opinion, one of the main reasons forthis reluctance is that companies have been focused largely on direct expenses related to securityinitiatives, and not on the collateral benefits that can be realized from such investments, such as:
• Higher supply chain visibility;• Improved supply chain efficiency;• Better customer satisfaction;• Improved inventory management;• Reduced cycle and shipping time; and• Cost reduction following the above-mentioned collateral benefits.
In fact, when properly leveraged, investments in supply chain security may not only be offset tosome extent by benefits such as the ones listed above but, in fact, can be outweighed by suchbenefits, and can overall have a positive impact on a company’s bottom line.
4
To demonstrate this point, the Stanford Global Supply Chain Management Forum, together with TheManufacturing Institute and IBM, conducted the study summarized in this paper. The goal of thestudy was to help companies understand the business value of supply chain security investments byidentifying collateral benefits security initiatives can bring to companies, and whenever possiblequantifying the level of benefits that can be realized.
The study was based on inputs from 11 manufacturers and 3 Logistics Service Providers (LSPs) thatare considered ``innovators” in supply chain security, and clearly demonstrated that investments insupply chain security can provide business value.
Some of the more significant benefits participating manufacturers reported included the following:
• Improved product safety (e.g., 38 percent reduction in theft/loss/pilferage, 37 percent reductionin tampering);
• Improved inventory management (e.g., 14 percent reduction in excess inventory, 12 percentincrease in reported on-time delivery);
• Improved supply chain visibility (e.g., 50 percent increase in access to supply chain data, 30 percentincrease in timeliness of shipping information);
• Improved product handling (e.g., 43 percent increase in automated handling of goods);• Process improvements (e.g., 30 percent reduction in process deviations);• More efficient customs clearance process (e.g., 49 percent reduction in cargo delays, 48 percent
reduction in cargo inspections/examinations);• Speed improvements (e.g., 29 percent reduction in transit time, 28 percent reduction in delivery
time window);• Resilience (e.g., close to 30 percent reduction in problem identification time, response time to
problems, and in problem resolution time); and• Higher customer satisfaction (e.g., 26 percent reduction in customer attrition and 20 percent
increase in number of new customers).
LSPs also reported a variety of collateral benefits they realized in each of the identified areas. For exam-ple, various security initiatives taken in particular lanes resulted in such benefits as 90 percent reductionin theft/loss/pilferage and in tampering, 50 percent reduction in damages, 75 percent reduction ininventory and 90 percent cost savings attributed to improved visibility for those particular lanes.
While the results of this study should not be considered as any type of industry average, they clearlydemonstrate that in addition to lower risk and higher security, investments in supply chain securitycan provide significant business value to organizations by helping them to improve internal operations,strengthen relationship with their customers and increase their profitability. Therefore, we stronglyurge companies not to consider security investments as a financial burden, but rather as investmentsthat can have business justification, that can result in operational improvements, and that ultimatelymay promote cost reduction, higher revenue and growth.
It is important to remember that such benefits are not realized automatically. Companies need to becreative in determining ways—often times in collaboration with their business partners—to gainthe most benefits from their security investments.
5
The term `supply chain’ describes an overall process that results in goods being transported from thepoint of origin to their final destination and includes the movement of the goods, the shipping dataand the associated processes as well as a series of dynamic relationships. International supply chainscan involve many entities such as producers of the goods, logistics management firms, consolidators,truckers, railroads, air carriers, marine terminal operators, ocean carriers, cargo/mode/customs agents,financial and information services and buyers of the goods being shipped. If the imported goods areused for production, the associated supply chain may include—in addition to the purchase of goodsand their transportation from the point of origin to the production facilities—the use of the goodsin the production/assembly process, storage and shipment of the final products to distribution centersand ultimately to customers and end consumers.
Though `supply chain disruptions’ bring to mind man-made disasters like the terrorist attacks of 9/11and natural disasters like Hurricane Katrina, these events seem to be only the tip of the iceberg.Supply chain disasters come in various forms—product contamination and adulteration, shortages,border closings, strikes by ports and a host of other problems that can cause disruptions in the supplychain. Adequately preparing for, and taking steps to minimize the impact of such unforeseeablesituations is clearly important to the stability and well being of countries and businesses alike.
Terrorist attacks have revolutionized the way we trade. International trade is no longer just aboutmoving goods quickly and cheaply. In this age of global terrorism, there is a third element: it’s aboutmoving goods quickly, efficiently and securely.1 Firms are incurring new costs and adapting new tech-nologies to ensure safe transit of their products across international borders. Some of the implicationsof the 9/11 events include an increase of 15 percent in airfreight costs2, and an increase of 20 percentin the costs of commercial insurance premiums to about $30 billion per year3. U.S. Customs and BorderProtection (CBP) now requires a more detailed disclosure of information, sometimes well in advance ofthe goods entering the United States, and companies are required to make significant investmentsto enhance security throughout their supply chains in order to reduce screening of their imported cargo.
Similarly, Hurricane Katrina not only left thousands of people suffering, but also affected many firmsfinancially, even those that did not have operations in the areas where the hurricane struck. The Gulfof Mexico region is an important energy hub and normally makes up a quarter of U.S. oil and gasproduction. However, due to damage to rigs and refineries caused by the hurricane, more than91 percent of oil production and 83 percent of gas production in the region was shut down, andwas not completely restored six months after Katrina: As of Feb. 28, 2006, daily gas production inthe Gulf of Mexico has been restored to 85 percent and daily oil production has been restored to76 percent4. These interruptions in production resulted in unprecedented spikes in prices for oil andnatural gas. The soaring fuel prices had a substantial financial impact on the airline industry, whichalso suffered from significant loss of revenue due to the collapse of New Orleans’ tourism and thecancellation of hundreds of daily flights to the area. Furthermore, Katrina laid waste the vital GulfCoast ports, which are major gateways for U.S. agricultural exports, as well as for imports of such
Introduction
1 Bonner, Robert C. (2005), Supply Chain Security in a New Business Environment Conference, Miami, Fla., April 2005.2 Chandler, Charles (2002), ``After 9/11: Supply Chain Implications in International Trade for U.S. Firms,” globalEDGE, February 2002.
http://globaledge.msu.edu/NewsAndViews/views/papers/supply_chain_implications_International_trade.pdf3 UBS Warburg, 2001.4 Department of Homeland Security Web site; http://www.dhs.gov/interweb/assetlibrary/katrina.htm.
6
goods as steel, rubber, coffee and fresh fruit. Freight transport companies were estimated to be losing$3 million to $4 million a day while the ports were closed, and manufacturers who increasingly relyon the ``just in time” provision of components saw disruption to their assembly lines5. In addition,Katrina caused an estimated $38 billion to $50 billion in private insured losses 6. And so althoughsuch events seem impossible to predict and have a low likelihood of occurrence, given their significantimpact on many sectors of the U.S. economy, ignoring them may be too high a risk to take.
The security challenges facing companies become apparent as global trade expands. More than 200million containers are shipped between the world’s seaports annually 7, with the United States receivingapproximately 17,000 containers per day 8. With increasing security concerns since 9/11 came therealization that physical inspection of all imported goods is untenable. In fact, as of 2004 only 6 percentof the containers imported to the U.S. were physically inspected9. Most companies and the governmentrecognize the need to implement comprehensive and integrated end-to-end security that extendsbeyond asset protection. This has led to several initiatives on the part of the U.S. government toassess and minimize the risk involved in the transportation of goods. They include:
• The Advanced Manifest Rule (AMR)/Advance Cargo Information (ACI), instituted by U.S. CBP inconjunction with the Trade Act of 2002, and fully implemented in 99 percent of the ports byJanuary 2005. It requires detailed cargo data for all modes to be submitted to U.S. CBP prior toarrival. An ocean container is allowed into the United States only if detailed contents informationhas been provided electronically to Customs at least 24 hours before the container is loaded onthe ship at the foreign port of origin. The information is useful for pre-screening questionablecontainers prior to arrival to U.S. ports and for selecting containers for inspection at ports ofdeparture and entry10.
• The Container Security Initiative (CSI). With the CSI, the U.S. government and more than 25 tradingpartner governments are pursuing supply chain security by pushing inspections and screeningupstream to originating ports11. This calls for pre-screening of containers coupled with fast trackingwhen the cargo reaches the U.S.12.
• The Customs-Trade Partnership Against Terrorism (C-TPAT). C-TPAT was launched in November 2001with the guiding principles of voluntary participation and jointly developed security criteria, bestpractices and implementation procedures. In exchange for the security investments they had made,C-TPAT partners receive ``…reduced inspections at the port of arrival, expedited processing at theborder, and other significant benefits, such as ‘front of line’ inspections and penalty mitigation.”13
5 Plummer, Robert (2005), ``U.S. Counting the Cost of Katrina,” BBC News, September 1, 2005.
http://news.bbc.co.uk/1/hi/business/4204900.stm6 Hsu, Spencer S. (2006), ``Insurers Retreat from Coasts,” Washingtonpost.com, April 30, 2006.
http://www.washingtonpost.com/wp-dyn/content/article/2006/04/29/AR2006042901364.html7 Closs, David J.; McGarrell, Edmund (2004), ``Enhancing Security Throughout the Supply Chain,” IBM Center for Business of
Government, April 2004.8 Lee, Hau L. and S. Whang (2005), ``Higher Supply Chain Security with Lower Cost: Lessons from Total Quality Management,”
Int. Journal of Production Economics, Vol. 96, no. 3, pp. 289-300, June 2005. 9 U.S. Customs and Border Protection Web site (2004), ``Cargo Container Security—U.S. Customs and Border Protection Reality,”
October 2004.10 Lee, Hau L. (2004), ``Supply Chain Security—Are you Ready?”, Stanford Global Supply Chain Management Forum, GSCMF-W1-2004,
September 2004.11 Ibid.12 Closs, David J.; McGarrell, Edmund (2004), ``Enhancing Security Throughout the Supply Chain,” IBM Center for Business of
Government, April 2004.13 U.S. Customs and Border Protection (2006), ``Supply Chain Security Best Practices Catalog,” pp. iii, January 2006.
7
• The Emergency Planning and Community Right-to-know Act (EPCRA). EPCRA was passed by theU.S. Congress in response to concerns regarding the environmental and safety hazards posed bythe storage and handling of toxic chemicals14. Among other things, it requires detailed informationregarding hazardous materials to be given to the people in the community 15.
• The Free and Secure Trade (FAST) initiative. It allows low-risk goods transported by trusted driversvia trusted carriers for trusted firms to pass rapidly through border crossings while reservinginspection resources for unknown or high-risk shipments.
• The Smart and Secure Trade-lanes (SST) program. This initiative was established in October 2002by the container shipping industry to ensure the security of cargo containers globally. SST’s objectiveis to rapidly deploy a baseline infrastructure that provides real-time visibility, physical security throughnon-intrusive, automated inspection and detection alerts, as well as a complete audit trail of acontainer’s journey from origin to final destination16. In May 2003, the International Organizationfor Standardization (ISO) formally became involved with the SST program to gain insight to setinternational supply chain security and visibility standards.
Multiple security initiatives are also taking place outside the U.S. One of them is the publication in2005 of the ISO/PAS 28000:2005 standard, ``Specification for security management systems for thesupply chain” by the ISO. The standard outlines the requirements to enable an organization to establish,implement, maintain and improve a security management system, including those aspects criticalto security assurance of the supply chain. These aspects include, but are not limited to, financing,manufacturing, information management and the facilities for packing, storing and transferringgoods between modes of transport and locations17. In addition, the World Trade Organization (WTO)seeks to facilitate trade by moving controls and inspection to the export stage and through thesharing of uniform information among government agencies, firms, suppliers, carriers and customers.
The World Customs Organization (WCO), a Brussels-based consortium of 169 customs administrations,which represent 99 percent of global trade, promotes trade facilitation by developing and promotingguidelines to help customs administrations work together to promote rapid clearance of low-riskcross-border shipments, and has also been developing standard sets of customs data elements andguidelines for member countries to enable advanced electronic transmission of such data18. Specifically,WCO members have developed the Framework of Standards to Secure and Facilitate Global Trade(SAFE Framework), which outlines a strategy that aims to secure the movement of global trade ina way that does not impede but rather facilitates the movement of that trade19. By June 2006, a totalof 135 countries have expressed their intention to implement the WCO SAFE Framework, including 25member states in the European Union (E.U.)20. In 2003, the E.U. launched a reform package forcustoms controls, which is designed, among other things, to ensure higher standards of security
14 U.S. Environmental Protection Agency Web site, ``EPCRA Overview,” February 2006.
http://www.cbp.gov/linkhandler/cgov/import/commercial_enforcement/ctpat/ctpat_best_practices.ctt/ctpat_best_practices.pdf15 Sheffi, Yossi (2001), ``Supply Chain Management under the Threat of International Terrorism,” International Journal of Logistics
Management, Vol. 12, No. 2, 2001.16 Hudson, Scott (2006), ``Smart and Secure Tradelanes (SST),” Supply Chain Resource Consortium, February 21, 2006.
http://scm.ncsu.edu/public/security/sec060221.html17 ISO Web site, http://www.iso.org/iso/en/CatalogueDetailPage.CatalogueDetail?CSNUMBER=41921 18 Gillis, C. (2002), ``Customs Agencies Turn Attention to Exports,” American Shipper, pp. 10-13, August 2002. 19 World Customs Organization (2005), ``Framework of Standards to Secure and Facilitate Global Trade,” June 2005.
http://www.wcoomd.org/ie/en/press/wco%20-%20framework%20final%20en%2023-8.pdf. 20 WCO Web site, http://www.scoomd.org/ie/En/en.html, under ``List of Members who have indicated their intention to implement
the SAFE Framework of Standards.”
8
while trying to ease import and export flows. As part of this initiative, the European Commissionpresented a series of measures to accelerate implementation of the WCO SAFE Framework security-related provisions, including the Authorized Economic Operator (AEO) program. The implementingprovisions for this program are expected to be approved in 2006.
In addition to these government initiatives, businesses have also proactively been seeking ways tomitigate supply chain risks, where risk can be viewed as the frequency of a disaster happening timesits consequence21,22. To achieve organizational resilience—the ability to successfully confront the unfore-seen and quickly bounce back from a large disruption—some companies took steps to increase flexi-bility of their operations, and/or made changes in corporate culture 23. Means to increase flexibilityinclude the use of interchangeable and generic parts in many products, relying on similar or identicalplant design and processes across the company, and postponement of differentiating process stepsand cross-training employees. Keeping products in semi-finished ``vanilla” form provides flexibilityto move products from surplus to deficit areas, and to better fill customer demand. To avoid potentialdisruptions in the flow of incoming goods, some companies modified their procurement strategy.The preferred solution, however, differs from company to company—some companies prefer to relyon a small group of key suppliers and develop an intimate relationship with each of them, in orderto better detect potential problems; while others prefer to diversify their supplier base to distributethe risk. In addition to diversified supplier base, companies are trying to gain flexibility by diversifyingtheir portfolio of locations 24 and distribution systems.
Corporate culture is a key factor in determining the duration and costs associated with a recoveryafter a major supply chain disruption25. Some key ingredients of successful corporate cultures includecontinuous communication among informed employees—which helps employees make betterdecisions in the face of unforeseen disruptions; distributed power, so that teams and individuals areempowered to take necessary actions; and passion for work, based on employees’ understandingof the importance of their work, which encourages them to be creative in finding ways to overcomeunexpected disruptions. Various managerial articles point out the shared cultural traits betweenresilient organizations such as Dell and UPS26, and the importance of management commitmentto security measures 27.
In addition to increasing flexibility and changing corporate culture, companies have also been improvingtheir facilities design to protect against infrastructure loss and enable faster recovery from naturaldisasters 28. Another way that companies have thought to improve their freight security is throughthe establishment of the Technology Asset Protection Association (TAPA), which was founded in theUnited States in 1997 and now has chapters in Europe and the Asia Pacific. TAPA was formed byseveral high-technology companies that sought to establish consistent Freight Security Requirements(FSRs) that could be implemented across the industry. Today, TAPA also provides its members a common,centrally located and continually updated pool of information related to criminal activities.
21 Stauffer, David (2003), ``Supply Chain Risk: Deal With It,” Harvard Business School Working Knowledge Newsletter, April 2003,
http://hbswk.hbs.edu/pubitem.jhtml?id=3442&t=operations22 Stauffer, David (2003), ``Risk: The Weak Link in Your Supply Chain,” Harvard Management Update.23 Sheffi, Yossi (2005), ``Building a Resilient Supply Chain,” Harvard Business Review, Vol. 1, No. 8, October 2005.24 Bovet, David (2005), ``Balancing Global Risk and Return,” Supply Chain Strategy, Vol. 1, No. 3, August 2005. 25 Sheffi, Yossi (2005). 26 Byrnes, Jonathan (2005), ``Learning to Manage Complexity,” Harvard Business School Working Knowledge Newsletter, November
2005. http://hbswk.hbs.edu/item.jhtml?id=5079&t=dispatch27 Case, John (2002), ``Supply Chains are Tighter but There’s Still Too Much Slack,” Harvard Management Update, April 1, 2002. 28 Harrison, Keith and Cath Malseed (2006), ``Forces of Business or Forces of Nature: Building an Agile Supply Network,” AMR Supply
Chain Executive Conference, June 1, 2006.
9
Another source of risk for companies, especially those that make extensive use of global sourcing,are longer lead times and extended delays due to tighter security procedures for imported goods.While they have little control on the actual duration of such delays, companies can prepare for thesedelays by incorporating them into their forecasting cycles. For example, when GM experienced anincrease in the average delay time from one hour to three hours for parts that arrive from its Canadianplants, it factored this change into its forecasts.
With intensifying competition in the marketplace and continuous pressure from shareholders tomaintain profitability, companies now cannot afford to miss a single product cycle and blunt theircompetitive edge. The overarching concern to maintain production capabilities and be able to meetcustomer needs in the face of disasters drives investments in security measures. A private-sectoranalysis conducted by the International Monetary Fund (IMF) estimates the increase to business costsdue to higher security costs at $1.6 billion per year, the extra financing burden of carrying 10 percenthigher inventories at $7.5 billion per year 29. Another study estimates an increase in commercialinsurance premiums of 20 percent at about $30 billion per year30. New security measures following9/11 are estimated to cost the U.S. economy alone more than $150 billion, of which $65 billionis for changes in supply chains31,32. Companies differ greatly in their expectations of returns on theirinvestments in new security technologies, from 100 percent incremental in one year to 100 percentin three years33. In general, there has been no consensus on the returns and how to quantify them,making it more difficult to formulate a business case for such investments. To date no formal studythat we are aware of has been conducted to quantify these returns.
Based on inputs provided to us by companies that participated in the study summarized in this paper,it can be concluded that companies have been investing more in security in recent years, either tocomply with trade initiatives mandated by the government, or in an effort to reduce risk throughvoluntary initiatives. While these initiatives allow companies to maintain their level of operationsand/or to reduce risks, they require significant levels of investments. Unfortunately, so far manyorganizations have found it difficult to provide a business case to justify the required levels ofinvestment. One of the main reasons for this reluctance to invest in security is that companies havebeen focused largely on direct expenses related to security initiatives, and not on the collateralbenefits that can be realized from investments, such as:
• Higher supply chain visibility;• Improved supply chain efficiency;• Better customer satisfaction;• Improved inventory management;• Reduced cycle and shipping time; and• Cost reduction related to the above-mentioned collateral benefits.
Most of the existing literature and studies conducted to date have not been very helpful in explainingand quantifying the potential positive impact of security investments on business performance.
29 IMF Web site, ``World Economic Outlook: The Global Economy After September 11,” December 2001.
http://www.imf.org/external/pubs/ft/weo/2001/0330 UBS Warburg, 2001.31 Bernasek, A. (2002), ``The friction economy: American businesses just got the bill for the terrorist attacks: $151 billion a year,”
Fortune, Vol. 145, No. 4, pp. 104-110.32 Damas, P. (2001), ``Supply Chains at War,” American Shipper, November 2001, pp. 17-18.33 Lee, Hau L. (2004), ``Supply Chain Security—Are you Ready?,” Standford Global Supply Chain Management Forum, GSCMF-W1-
2004, September 2004.
10
A report completed recently by Rice and Spayd 34 discusses security initiatives such as collaborationamong supply chain parties, building organizational awareness and proactively investing in technology,that have shown promise to create collateral benefits. This report highlighted the need for additionalresearch to quantify the relationship between investments in security and improved business perform-ance. Our study, summarized in this paper, aims to close this gap, identify collateral benefits companiescan potentially realize, and whenever possible, quantify the level of benefits that can be realizedbased on the experience of leading organizations in the industry.
The remainder of the paper is organized as follows. The Methodology section provides an overviewof how we developed the study. Sections on Manufacturers and Logistics Service Providers summarizethe findings of our study. They describe the type of security initiatives taken by these industries,as well as the collateral benefits they have realized as a result. Finally, there is a Summary andConclusions section.
34 Rice, James B. and Philip W. Spayd (2005), ``Investing in supply chain security: collateral benefits,” IBM Center for The Business of
Government, Special report series, May 2005. http://www-03.ibm.com/industries/government/doc/content/bin/RiceReport.pdf
Methodology
11
As a first step, the areas that organizations can expect to be improved once enhanced supply chainsecurity initiatives are put in place were identified, based on information available in the literaturecombined with the knowledge and experience of the team members. Five such areas of improvementwere identified:
• Inventory Management and Customer Service;• Visibility;• Efficiency;• Resilience; and • Customer Relationships.
Next, we constructed a detailed list of potential benefits for each of the identified areas of improve-ment. For example, under Inventory Management and Customer Service, such benefits as reductionin incorrect quantity received, reduction in excess inventory, reduction in defective products delivered,reduction in counterfeiting and reduction in theft/loss/pilferage were included. Based on the list ofpotential benefits, a questionnaire was prepared, which lists all the identified potential benefits andasks respondents to state for each of these benefits whether their company has realized such abenefit following their supply chain security investments, and if so, what magnitude of improvementthey experienced. In addition, respondents were asked to describe the supply chain security initiativesthat their company has implemented over the years. For a copy of the questionnaire and a completelist of all identified benefits, please see the Appendix.
In parallel to developing the questionnaire, the project team selected a small number of companiesthat are considered ``innovators” in the efforts they are making to strengthen the security of theirown supply chain to participate in the study. Our hope was that based on the experience of theseinnovative companies, the study would demonstrate the potential business benefits of securityinvestments, and in doing so would help other companies to identify ways in which they can usetheir security investments to improve their business performance.
We set a goal of recruiting a total of 10-15 companies to take part in the study. Such a number wassufficiently small to allow us to study in detail each of the companies’ security initiatives and thebenefits they have realized, but at the same time was large enough so that we could still obtain arelatively wide range of responses. We were successful in recruiting 11 manufacturers and 3 oceancarriers/logistics service providers.
The participating manufacturers came from a wide variety of industries, including chemicals, consumerelectronics, consumer goods, engines and motors, food, information technology, semiconductors,software, toys, automotive parts, and industrial and commercial process controls. Each of the partic-ipating companies received a copy of the questionnaire, which they were asked to complete andreturn. Once the written responses were received, we conducted a follow-up phone interview with eachcompany, to discuss in detail their responses, and to gain a better understanding of the relationshipbetween the security initiatives that were taken and the benefits that were realized.
The next step in the study was analysis of the data collected from the participating companies. Weconducted both a quantitative and a qualitative analysis, to determine the most common types ofbenefits realized by companies, their magnitude, and if possible—which of the security initiativescontributed to the realized benefits. The quantitative analysis focused on the percent improvement

12
rather than on the dollar value of the benefits realized. There were two reasons for this approach;first, companies in general are reluctant to disclose the dollar value of any investments and costsavings realized. A second, and more important reason, is that we felt that presenting the improve-ments as a percentage will be of more value to other organizations—which may vary greatly in theirsize and business volume—when trying to estimate the business value of security initiatives for theircompanies based on the findings of this study. It is important to note that due to the relatively smallnumber of companies that participated in the study, and due to the wide range of industries theyrepresent, the results should not be considered as representative of a ``typical company” or as anindustry average. The information received from the participating companies, as well as the resultsof the data analysis, is summarized in the Manufacturers and Logistics Service Providers sections.
Manufacturers
13
Overview of Security Initiatives
The participating manufacturers consisted of a wide variety of companies, each of which had differentmotives for implementing supply chain security measures. Many of the companies interviewed werepioneers in supply chain management within their respective industries and had already implementedvarious initiatives that strengthened the security of their supply chains for a long time.
Some of these companies implemented those initiatives specifically to strengthen the security of theirsupply chains. For example, companies that operate in the high-tech industry often times manufacturegoods characterized by a small size and high value. Such goods are a likely target for theft, and soit has traditionally been essential for these companies to secure the goods to prevent theft andconsequent sale in the black market, as well as to prevent diversion of products to the gray market.
Similarly, software companies are likely to face a problem of piracy. To mitigate this problem, one ofthe participating companies has been taking multiple steps that focus on identifying bogus productsand protecting genuine products, such as the development and deployment of built-in anti-piracyfeatures and activation procedures for new software owners. In addition, they reassessed their vendorsto ensure their reliability and that they are not taking advantage of their access to the company’ssoftware products to resell them in the black market.
Other frequent targets of theft are fast-moving consumer goods manufacturers. Hence, one of theparticipating companies has had in place for many years various physical site security mechanisms,such as fencing, ID badges, access limitations, etc. For different reasons, chemicals companies—especially those that deal with hazardous and flammable materials, also invest heavily in physicalsite security, personnel security, as well as cargo and transportation equipment security controls.
Other companies implemented various measures that were intended to improve their businessperformance and only later realized that as a byproduct the security of their supply chain had beenimproved as well. For example, one company told us that because of the large number of carriersthey have been working with, they decided to implement a track and trace tool, to provide themwith more visibility about their goods while in transport. While the motivation for putting this toolin place was to gain such benefits as reduced inventories, improved on-time deliveries and fewerincidents of stockouts, as a byproduct, the track and trace capabilities also improved the securityof their supply chain.
All the companies that participated in the study took further security-related initiatives following 9/11.These initiatives included measures that were taken to comply with government regulations (suchas various security and safety regulations imposed by the U.S. Department of Transportation), andparticipation in voluntary government and industry security initiatives, such as the U.S. C-TPAT andthe Canada Partners in Protection (PIP) security initiative. Complying with such voluntary initiativeswas important for the manufacturing companies in order to prevent delays due to higher inspectionrates and to speed up the clearance process for imported goods at the ports of entry, as pointedout by many of the companies that participated in this study.
In addition, many companies decided in the last few years to take voluntary steps to enhance securitywithin the four walls of their organizations. The companies that participated in our study mentioneda variety of such initiatives, ranging from personnel background checks and advanced training programs
14
for all employees, to changes made to the packaging of the products and the implementation ofcontainer sealing standard procedures to ensure lesser instances of break-ins. One company mentionedthe development and deployment of a Risk Assessment tool to quantify and address unacceptablerisks in the supply chain, as well as an Expected Loss forecast tool that analyzes historic losses andpredicts future losses, so as to help the company to set realistic goals to mitigate risk. Anothercompany started to attend various conferences to learn about best practices related to security,and figure out how their own security practices can be improved.
To minimize disruptions along the supply chain, in addition to security initiatives taken within the fourwalls of the organizations, companies have also been working with their business partners to improvethe security of their operations. For example, one of the participating companies mentioned thatthey now place more explicit requirements on their suppliers, and list those requirements in detailin their contracts. Another company has adopted the TAPA freight security requirements as minimumsecurity standards in supplier contracts. Yet other companies mentioned development and usage ofa risk assessment model to select, qualify and evaluate their suppliers. As for downstream security,a certain chemicals manufacturer mentioned the development and adoption of a customer screeningand qualification process for security-sensitive products.
In terms of internal organization, several companies decided to form special security teams to identifyways to address current and future supply chain vulnerabilities, and to set up security standards forinternal operations as well as for co-manufacturers, suppliers and logistics service providers. Thosestandards could be procedural, physical security standards, or contractual language that holds thesuppliers to a standard. Often times, the security teams were established as a central operationsorganization, which is chartered to work across all regions and all lines of business. However, inlarge and diverse organizations it is likely that different divisions may also initiate independentlyseparate security projects and procedures.
Several companies mentioned other government acts such as Sarbanes-Oxley, which are not directlysupply chain-related, but require companies to be more vigilant in those matters.
As for the costs associated with supply chain security measures, some companies explained that giventhe numerous security initiatives that they have taken over the years, they were required later to makeonly a few changes to their security practices in order to comply with post-9/11 regulations andvoluntary security initiatives such as those mentioned earlier. In contrast, other companies reportedthat they still had to significantly increase their security-related expenditures in recent years. Thesecompanies cited an increase in annual security-related expenditures of up to 50 percent comparedto five years ago, and are expecting this level of investment to be maintained or to further increasein the near future.
Overview of Collateral Benefits
This section summarizes the collateral benefits—that is, other benefits in addition to improvedsecurity—participating manufacturers derived from their security investments. While the majorityof the companies reported a wide range of benefits, three of the participating companies explainedthat since they already had robust security systems in place for many years, and/or have taken overthe years numerous steps to improve the efficiency of their internal operations, they could reportvery few collateral benefits following the adoption in recent years of government regulations orvoluntary initiatives.
15
One of these companies already had a robust security system in place for at least 10 years, and sohasn’t experienced any fundamental shift in its security practices or in the impact they had on itsbusiness following 9/11. The major benefits they could report as a result of their C-TPAT certificationwere fewer and less intrusive inspections at the ports, which also provided less opportunity for damageto the imported goods. Two other companies pointed out that most of the benefit areas investigatedin the study have been a subject of long-established company practice for efficient business processes.Therefore, obtaining the C-TPAT certification did not result in sizable cost savings because most ofthe major process obstacles had already been improved by that time. The benefits they have citedare ``Front of Line” priority inspection, as well as the ability to join the FAST program, where C-TPATis a prerequisite. In addition, one of these two companies mentioned that they expect the C-TPATimplementation to heighten security awareness throughout the company, and to consequently resultin a better terrorist security incident reporting.
The remainder of this section describes the benefits reported by the other eight participating manu-facturers. The discussion is organized by the five benefits sections in the questionnaire.
Inventory Management and Customer Service
Participating companies reported a number of improvements in their inventory management prac-tices due to their security investments, which also had a positive impact on the service provided totheir customers:
• INTERNAL INVENTORY MANAGEMENT OPERATIONS: In the receiving process of incoming material, 38 per-cent of companies reported a reduction in incorrect quantity received. In addition, 38 percentof companies were able to reduce their inventory levels, and all of these companies expect tosee further reduction in inventory in the future.
• PRODUCT SAFETY/GENUINENESS: Better security practices allowed the companies to be more successfulin protecting their products; 75 percent of companies reported a reduction in theft/loss/pilferage;50 percent of companies saw a reduction in tampering; and 25 percent of companies were ableto reduce the magnitude of damage to their goods. Furthermore, 38 percent of companies weresuccessful in reducing the magnitude of fraud, while 25 percent were successful in reducing themagnitude of counterfeiting.
• CUSTOMER SERVICE: Service level to customers was improved in a number of ways; 38 percent ofcompanies improved their reported on-time deliveries. In addition, 13 percent of companiesreported an increase in item fill-rate and a reduction in each of the following areas:
– the number of back-orders; – the frequency of cancelled orders; and – defective products delivered.
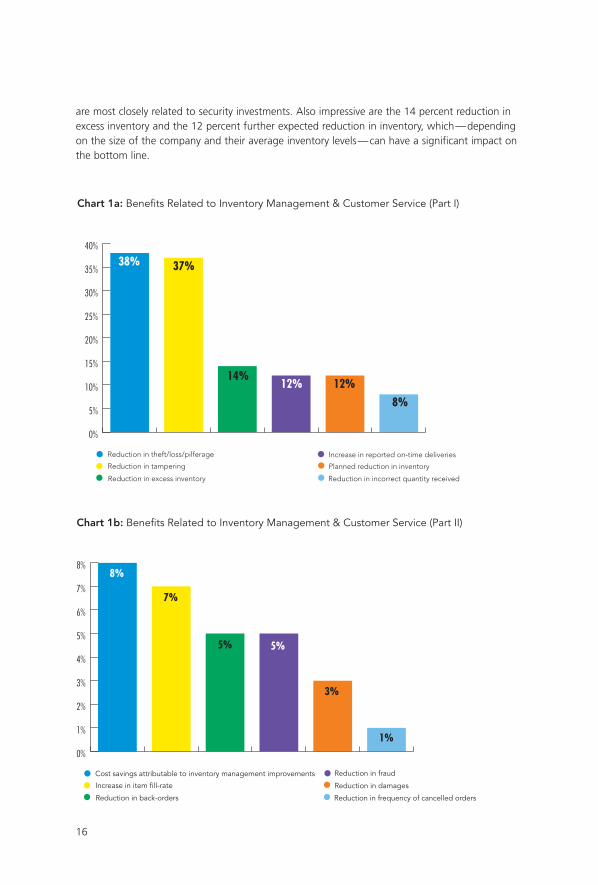
• COST SAVINGS: 38 percent of companies reported cost savings associated with improved inventorymanagement, but only one of them was able to quantify those benefits, and estimated a 5-10percent cost savings.
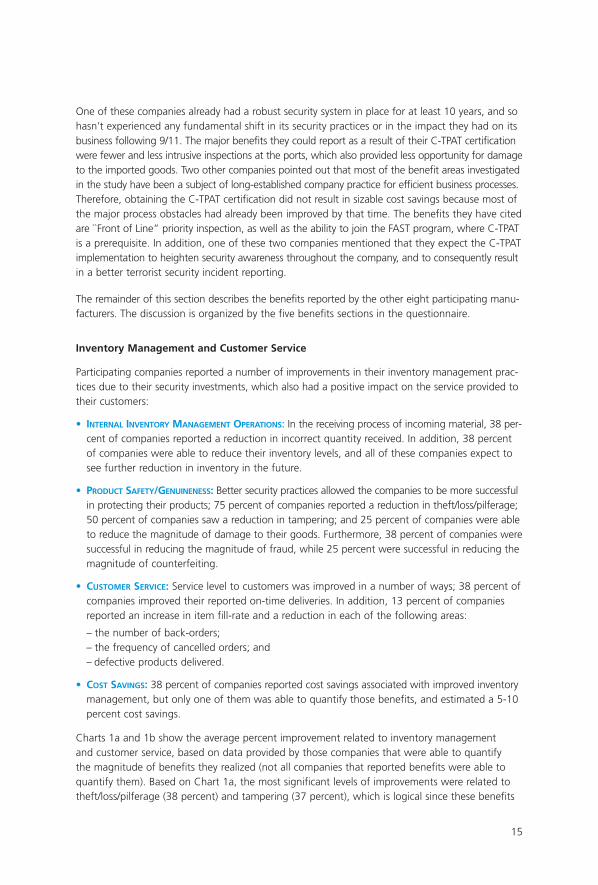
Charts 1a and 1b show the average percent improvement related to inventory management and customer service, based on data provided by those companies that were able to quantify the magnitude of benefits they realized (not all companies that reported benefits were able toquantify them). Based on Chart 1a, the most significant levels of improvements were related totheft/loss/pilferage (38 percent) and tampering (37 percent), which is logical since these benefits
16
0%
5%
10%
15%
20%
25%
30%
35%
40%
Chart 1a: Benefits Related to Inventory Management & Customer Service (Part I)
Reduction in theft/loss/pilferage
Reduction in tampering
Reduction in excess inventory
Increase in reported on-time deliveries
Planned reduction in inventory
Reduction in incorrect quantity received
38% 37%
14%12% 12%
8%
0%
1%
2%
3%
4%
5%
6%
7%
8%
Chart 1b: Benefits Related to Inventory Management & Customer Service (Part II)
Cost savings attributable to inventory management improvements
Increase in item fill-rate
Reduction in back-orders
Reduction in fraud
Reduction in damages
Reduction in frequency of cancelled orders
8%
7%
5% 5%
3%
1%
are most closely related to security investments. Also impressive are the 14 percent reduction inexcess inventory and the 12 percent further expected reduction in inventory, which—dependingon the size of the company and their average inventory levels—can have a significant impact onthe bottom line.
17
There are various ways in which companies were able to realize the benefits summarized earlier.For example, with the security standards one of the companies put in place they now receive inadvance for most of the raw material arriving at their production facilities such information as itsexpected time of arrival, expected quantity and ordering party. This information allows them tocontrol the ordering and receiving processes more tightly, and to better manage their inventory.In addition, this company keeps track of the materials until they are used in the production process,which helps them to ensure that the materials cannot be tampered with or changed. A few companieshave set up standards for inspection of security and integrity of the material when it arrives at theirfacilities, before use, which help reduce fraud and tampering.
Another company experienced hijacking of high-value products, which were later sold in the blackmarket. To counter this problem, the company made a number of investments in security, such asthe use of Global Positioning System (GPS) and Radio Frequency Identification (RFID) to keep trackof containers and trucks, use of locks and high-security bolt seals on containers, driver backgroundchecks, use of driver teams rather than a single driver and use of two-way cellular/satellite commu-nications. These investments were extremely successful, resulting in complete elimination (100 percentdecrease) of theft.
A software manufacturer has set up hotlines to keep track of customers calling in about counterfeiting,which helps it get some intelligence about errant suppliers. Its Web site also has a link about howto tell if your product is genuine or not.
One of the other participating companies mentioned that by having a more robust process for trans-ferring product through land ports, and by following their container consolidation program, theywere able to solidify the process and gain more consistency, which resulted in significant reductionin inventory.
Nearly all the companies interviewed faced a problem of tampering, and pointed out that it was labor intensive to inspect every container. Of the companies surveyed, 50 percent sawimprovements after taking measures such as replacing tamper-evident seals with very stronghigh-security cable seals that require a special tool for removal. Certain companies changed thepackaging to avoid misuse of the contents, and to also deter the introduction of unauthorizedobjects into the package.
Visibility
Following their investments in supply chain security, all interviewed companies were able to improvetheir visibility to the location and condition of their goods as they move along the supply chain. Inparticular, the following benefits were reported:
• ACCESS TO DATA: 75 percent of companies improved their accessibility to supply chain data.
• TIMELINESS OF DATA: 100 percent of companies reported an improvement in the timeliness ofshipping information.
• DATA ACCURACY: 63 percent of companies reduced inaccuracies in shipping information.
• COST SAVINGS: 75 percent of companies realized cost savings that they can attribute toimproved supply chain visibility. Two of these companies were able to quantify these savings,and reported an average savings of 7 percent.
18
Several companies cited the 24-hour advance manifest regulation, which was instituted by U.S. CBPin conjunction with the Trade Act of 2002 and requires transmission of certain cargo data to U.S. CBP24 hours before the cargo is laden aboard a ship bound for the United States at a foreign port,as one of the drivers for improved timeliness of shipping information. For example, one of theparticipants said that in the past they were lucky if all documentation arrived at the docks two daysahead of time. Now all documentation arrives five days before a ship docks, thus resulting in morethan a 50 percent increase in timeliness of information. Another company was able to gain 5-10 per-cent improvement in both timeliness and accuracy of shipping information following their joiningthe C-TPAT program.
In addition to government initiatives, other voluntary steps taken by different companies helped themto improve visibility. One company has implemented RFID and/or GPS systems to keep track of rail-cars, truck and container locations. The information is updated hourly, resulting in a 90-100 percentimprovement in both access to supply chain data and in timeliness of shipping information.
A second company implemented an Information Technology (IT) visibility tool, which allows them toshare information electronically with their third-party logistics providers and suppliers. With this tool,the company was able to tremendously improve its visibility and the timeliness of the informationit receives. In addition, it helped them to detect data inaccuracies earlier in the process. Once thissolution is implemented across all divisions of the company, they expect total ocean shipping coststo drop by 30-50 percent.
A third company put together a design and transportation security team, which is concerned, amongother things, with improving accessibility to information. Consequently, this company was able to gainsignificant improvements in all the visibility areas listed in our questionnaire.
0%
10%
20%
30%
40%
50%
Chart 2: Benefits Related to Visibility
Increase in access to supply chain data
Increase in timeliness of shipping information
Reduction in inaccurate shipping information
Cost-savings attributable to improved supply chain visibility
50%
30% 5%
9%7%
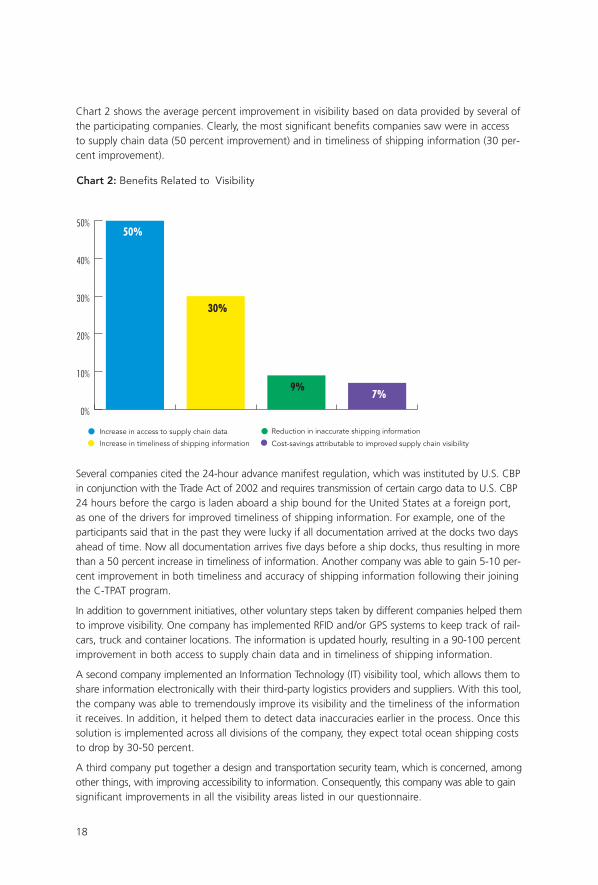
Chart 2 shows the average percent improvement in visibility based on data provided by several ofthe participating companies. Clearly, the most significant benefits companies saw were in access to supply chain data (50 percent improvement) and in timeliness of shipping information (30 per-cent improvement).
19
A track and trace system implemented by another company provided them with complete visibility tothe location of ocean containers. This capability is viewed as a significant plus, as it allows the companyto know its containers are not sitting in unsecured areas, are not ``off course,” are moving withoutunexplained delays, etc. With these capabilities they were able to achieve more ``bottom-line” results,in addition to ensuring a secure supply chain.
Efficiency
The Efficiency section in the survey focused on both process improvements as well as improvements intransportation and in the customs clearance process. Participating companies reported the followingefficiency-related improvements as a result of their security investments:
• IMPROVED PRODUCT HANDLING: 38 percent of companies increased automated product handling, while25 percent of companies reduced the number of times a product is handled. Such improvementsare likely to lower the number of working hours required for these activities, and to reduce thechances for errors in the process or damage to the goods.
• PROCESS IMPROVEMENTS: Companies reported multiple improvements in their processes. 75 percentof companies increased process compliance, 50 percent were able to reduce process deviations,and 25 percent saw an increase in process predictability. Furthermore, 50 percent of companiesreduced the number of steps in their supply chain process, while 38 percent of companies wereable to reduce cycle time (measured as the time from order receipt until it is shipped), which islikely to result in higher customer satisfaction in addition to internal benefits.
• REQUIRED PERSONNEL: 25 percent of companies reported a reduction in required personnel.
• COST SAVINGS: 38 percent of companies reported cost savings that can be attributed to processimprovements. One of these companies was able to quantify them, and reported 5-10 percentcost savings.
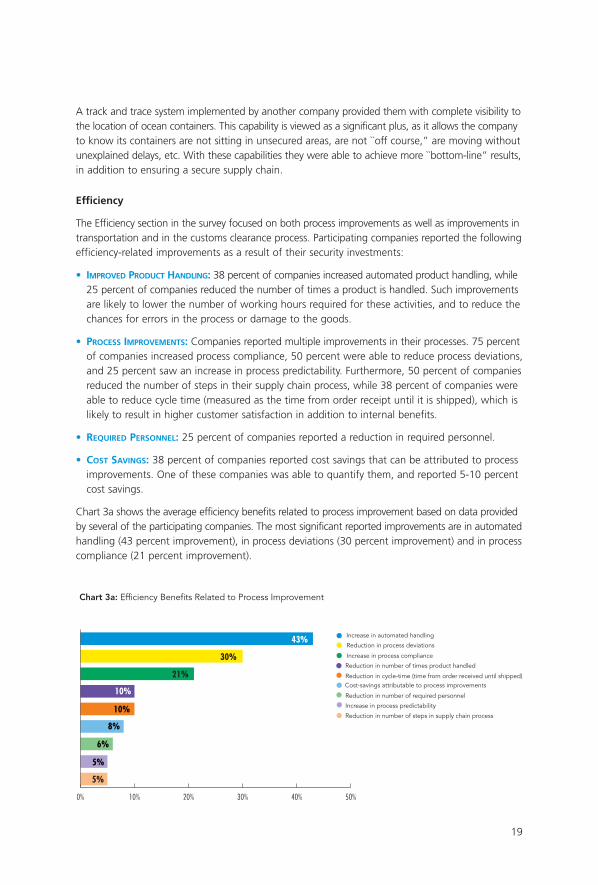
Chart 3a shows the average efficiency benefits related to process improvement based on data providedby several of the participating companies. The most significant reported improvements are in automatedhandling (43 percent improvement), in process deviations (30 percent improvement) and in processcompliance (21 percent improvement).
0% 10% 20% 30% 40% 50%
Chart 3a: Efficiency Benefits Related to Process Improvement
Increase in automated handling
Reduction in process deviations
Increase in process compliance
Reduction in number of times product handled
Reduction in cycle-time (time from order received until shipped)
Increase in process predictability8%
43%
30%
10%
21%
5%
10%
10%
8%
6%
5%
Cost-savings attributable to process improvements
Reduction in number of required personnel
Reduction in number of steps in supply chain process
20
One of the most significant improvements in this area was realized by a company that adopted anRFID solution to track cargo container export shipments and railcar shipments within the UnitedStates. With this solution in place, the company was able to automate a process that was previouslyextremely labor intensive, thus increasing automated data handling by 80 percent. Consequently,human data entry errors were eliminated, which significantly reduced process deviations and increasedprocess compliance.
Similarly, another participating company pointed out that security technology they brought intotheir production and distribution processes, such as RFID tagging and certain anti-counterfeitingmeasures they put into their products and packaging, helped them to improve their internal processesin a number of ways, increase automation, and reduce the number of required personnel. Theseimprovements also resulted in quantifiable cost-savings.
Other companies were able to reduce process deviations and increase process compliance by estab-lishing global testing practices to ensure compliance to global requirements, and by working moreclosely with their suppliers on these issues.
As for efficiency improvements related to transportation and the customs clearance process, thefollowing benefits were mentioned by the companies that took part in our study:
• CARGO INSPECTION AND CUSTOMS CLEARANCE: Most companies saw improvements in this area, withsome of these improvements reaching very significant levels. 88 percent of companies saw areduction in cargo inspection, while 63 percent experienced a reduction in inspection delaysand 38 percent of companies improved the predictability of these inspections. In addition tofewer inspections, the ones that took place seemed to be less extensive, which is one of thereasons for the reduction in time it takes to clear customs reported by 63 percent of companies.
• SPEED IMPROVEMENT: 50 percent of companies reduced the delivery time window, and/or saw areduction in the duration and/or variance of transit time, while 38 percent of companies experiencedfewer shipping delays. In addition, 13 percent of companies reported a reduction in lead-time,from activity initiation to completion.
• COST SAVINGS: 50 percent of companies reported cost savings that they could attribute to speedimprovement at the ports of entry and in transportation. One of the companies was able to quantifythese benefits, and provided an estimate of 10 percent cost reduction.
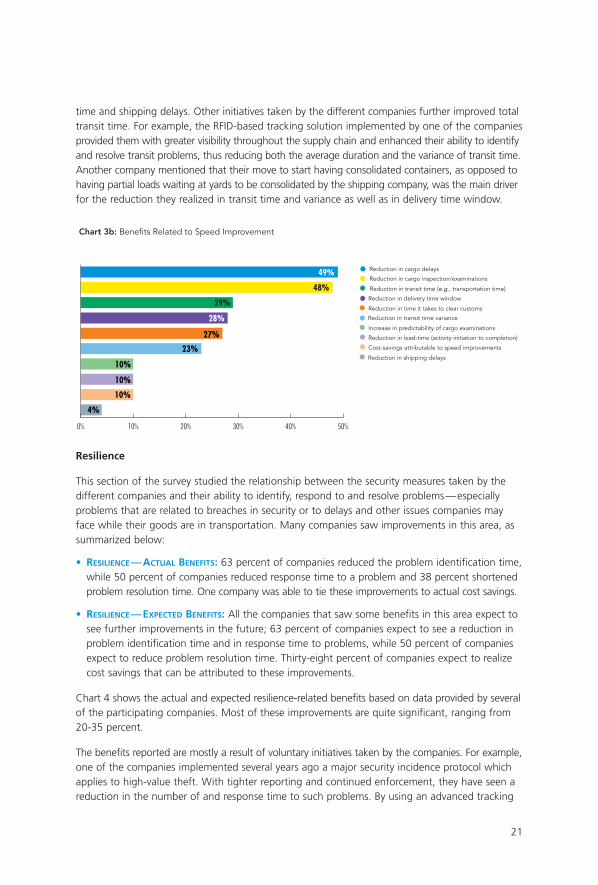
Chart 3b shows the average efficiency benefits related to speed improvement based on data pro-vided by participating companies. The most significant improvements were in the number of cargoinspections and the level of delays associated with these inspections (48 percent and 49 percentimprovement, respectively).
Following their participation in the C-TPAT program, nearly all companies experienced a reductionin the total number of cargo inspections, and in the number of intrusive/intensive inspections. Inaddition, for some of these companies it became easier to predict the number of inspected con-tainers. The level of these improvements, however, varied widely: some companies saw the numberof inspections drop in 2005 by 85-90 percent, and one company even reported zero inspectionsin that year, while other companies reported only a 5-10 percent reduction in the number ofinspections. These differences may be explained, among other things, by such factors as the type and origin of the imported goods, and different status of the importing companies (some of them have a low-risk importer status).
The improvements in the number and intensity of cargo inspections, combined with the qualificationmany of the companies have received for the FAST program, also had a positive impact on transit
21
time and shipping delays. Other initiatives taken by the different companies further improved totaltransit time. For example, the RFID-based tracking solution implemented by one of the companiesprovided them with greater visibility throughout the supply chain and enhanced their ability to identifyand resolve transit problems, thus reducing both the average duration and the variance of transit time.Another company mentioned that their move to start having consolidated containers, as opposed tohaving partial loads waiting at yards to be consolidated by the shipping company, was the main driverfor the reduction they realized in transit time and variance as well as in delivery time window.
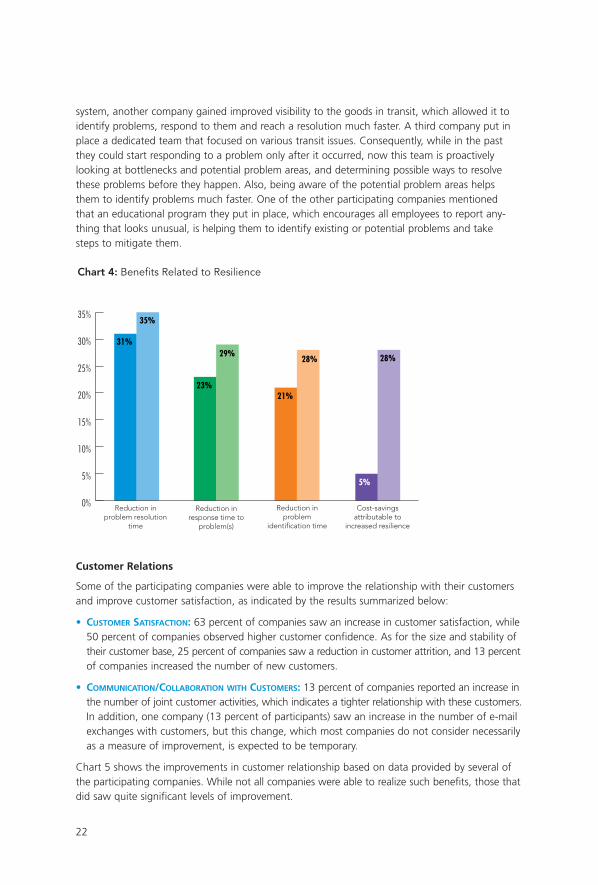
Resilience
This section of the survey studied the relationship between the security measures taken by thedifferent companies and their ability to identify, respond to and resolve problems—especiallyproblems that are related to breaches in security or to delays and other issues companies mayface while their goods are in transportation. Many companies saw improvements in this area, assummarized below:
• RESILIENCE—ACTUAL BENEFITS: 63 percent of companies reduced the problem identification time,while 50 percent of companies reduced response time to a problem and 38 percent shortenedproblem resolution time. One company was able to tie these improvements to actual cost savings.
• RESILIENCE—EXPECTED BENEFITS: All the companies that saw some benefits in this area expect tosee further improvements in the future; 63 percent of companies expect to see a reduction inproblem identification time and in response time to problems, while 50 percent of companiesexpect to reduce problem resolution time. Thirty-eight percent of companies expect to realizecost savings that can be attributed to these improvements.
Chart 4 shows the actual and expected resilience-related benefits based on data provided by severalof the participating companies. Most of these improvements are quite significant, ranging from20-35 percent.
The benefits reported are mostly a result of voluntary initiatives taken by the companies. For example,one of the companies implemented several years ago a major security incidence protocol whichapplies to high-value theft. With tighter reporting and continued enforcement, they have seen areduction in the number of and response time to such problems. By using an advanced tracking
0% 10% 20% 30% 40% 50%
Chart 3b: Benefits Related to Speed Improvement
Reduction in cargo delays
Reduction in cargo inspection/examinations
Reduction in transit time (e.g., transportation time)
Reduction in delivery time window
Reduction in time it takes to clear customs
Reduction in lead-time (activity initiation to completion)
10%
49%
48%
5%
29%
28%
27%
23%
10%
10%
Reduction in transit time variance
Increase in predictability of cargo examinations
Cost-savings attributable to speed improvements
4%
Reduction in shipping delays
22
system, another company gained improved visibility to the goods in transit, which allowed it toidentify problems, respond to them and reach a resolution much faster. A third company put inplace a dedicated team that focused on various transit issues. Consequently, while in the pastthey could start responding to a problem only after it occurred, now this team is proactively looking at bottlenecks and potential problem areas, and determining possible ways to resolvethese problems before they happen. Also, being aware of the potential problem areas helps them to identify problems much faster. One of the other participating companies mentioned that an educational program they put in place, which encourages all employees to report any-thing that looks unusual, is helping them to identify existing or potential problems and take steps to mitigate them.
Customer Relations
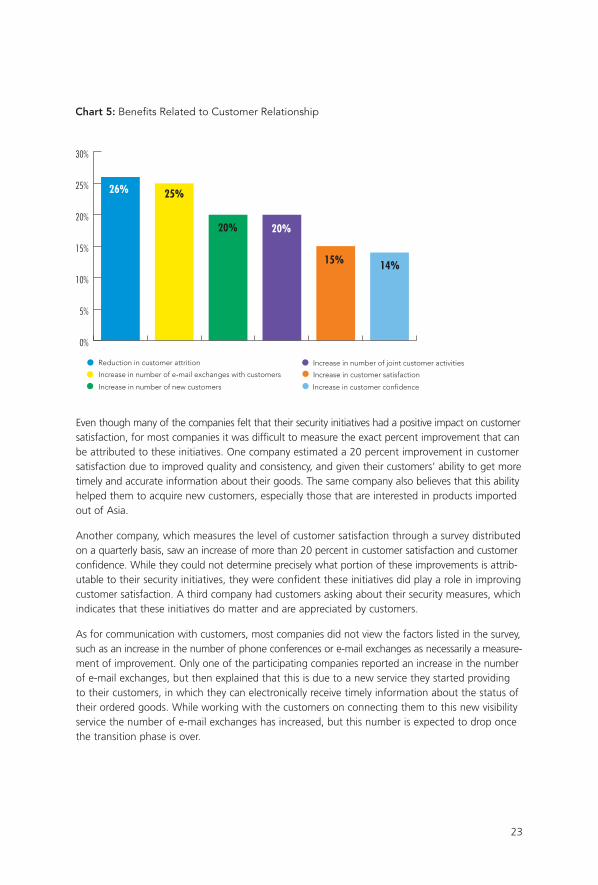
Some of the participating companies were able to improve the relationship with their customersand improve customer satisfaction, as indicated by the results summarized below:
• CUSTOMER SATISFACTION: 63 percent of companies saw an increase in customer satisfaction, while50 percent of companies observed higher customer confidence. As for the size and stability oftheir customer base, 25 percent of companies saw a reduction in customer attrition, and 13 percentof companies increased the number of new customers.
• COMMUNICATION/COLLABORATION WITH CUSTOMERS: 13 percent of companies reported an increase inthe number of joint customer activities, which indicates a tighter relationship with these customers.In addition, one company (13 percent of participants) saw an increase in the number of e-mailexchanges with customers, but this change, which most companies do not consider necessarilyas a measure of improvement, is expected to be temporary.
Chart 5 shows the improvements in customer relationship based on data provided by several ofthe participating companies. While not all companies were able to realize such benefits, those thatdid saw quite significant levels of improvement.
0%
5%
10%
15%
20%
25%
30%
35%
Chart 4: Benefits Related to Resilience
Reduction inproblem resolution
time
Reduction inresponse time to
problem(s)
Reduction inproblem
identification time
Cost-savingsattributable to
increased resilience
31%
35%
23%
29%
21%
28%
5%
28%
23
Even though many of the companies felt that their security initiatives had a positive impact on customersatisfaction, for most companies it was difficult to measure the exact percent improvement that canbe attributed to these initiatives. One company estimated a 20 percent improvement in customersatisfaction due to improved quality and consistency, and given their customers’ ability to get moretimely and accurate information about their goods. The same company also believes that this abilityhelped them to acquire new customers, especially those that are interested in products importedout of Asia.
Another company, which measures the level of customer satisfaction through a survey distributedon a quarterly basis, saw an increase of more than 20 percent in customer satisfaction and customerconfidence. While they could not determine precisely what portion of these improvements is attrib-utable to their security initiatives, they were confident these initiatives did play a role in improvingcustomer satisfaction. A third company had customers asking about their security measures, whichindicates that these initiatives do matter and are appreciated by customers.
As for communication with customers, most companies did not view the factors listed in the survey,such as an increase in the number of phone conferences or e-mail exchanges as necessarily a measure-ment of improvement. Only one of the participating companies reported an increase in the numberof e-mail exchanges, but then explained that this is due to a new service they started providingto their customers, in which they can electronically receive timely information about the status oftheir ordered goods. While working with the customers on connecting them to this new visibilityservice the number of e-mail exchanges has increased, but this number is expected to drop oncethe transition phase is over.
0%
5%
10%
15%
20%
25%
30%
Chart 5: Benefits Related to Customer Relationship
Reduction in customer attrition
Increase in number of e-mail exchanges with customers
Increase in number of new customers
Increase in number of joint customer activities
Increase in customer satisfaction
Increase in customer confidence
26% 25%
20% 20%
15% 14%
Logistics Service Providers
24
Overview of Security Initiatives
Because of the nature of their business, all of the ocean carriers and Logistics Service Providers (LSPs)interviewed had advanced security measures in place for many years. These security measures helpedthem to keep track of and protect their clients’ products as they moved through their system, whichis a necessity for service providers in this industry. In addition, ocean carriers and marine operatorshave been regulated for many years, and so were always required to have certain security practicesin place.
Still, all the companies that participated in our study took further security initiatives after 9/11. Someof these initiatives were taken to comply with mandatory regulatory requirements, such as the Inter-national Ship and Port Facility Security (ISPS) code, pre-notification of import and export freight tocustoms, cross-border protocols that specified the way for notifying customs whenever goods weretransferred across the border, employee background checks and additional physical security. Complyingwith these regulatory requirements required, among other things, investment in IT systems andchanges in working procedures.
In addition, the LSPs and ocean carriers decided to take part in voluntary programs like C-TPAT orTAPA. However, at least some of the companies we interviewed explained that such security measureswere adopted more as a ``business imperative” rather than purely to enhance security. For example,many of the large customers of the participating companies required them to become C-TPATcompliant in order to maintain their business, and compliance has often times been a prerequisitefor participation in new bids.
Ocean carriers and LSPs also invested in security as a means to help them fulfill commitments theyhad made to their customers, and maintain their reputation as a premium service provider. For example,after 9/11 the time to cross the borders had gone up significantly. While not required by law, the LSPsdecided to make such investments as joining the FAST program, certifying their drivers and equipment,etc., in order to shorten inspection time, and ultimately be in a position to better serve their customers.
Apart from external triggers, all participating LSPs and ocean carriers began voluntary initiatives toimprove, or better control supply chain security. One area in which all companies invested in recentyears is human resources. Some of the examples provided by the participating companies includean assignment of security officers to all ships and terminals, posting of additional security guardsat warehouses, assignment of two drivers rather than one to high-value transportation lanes andan overall increase of security personnel.
In addition, companies developed special training programs; some for all employees while others weretailored for specific job functions (such as security officers, drivers, or marine terminal employees).These programs did not focus only on one-time training, but rather included on-going training to allemployees about specific security-related topics, such as suspicious people, information security, etc.
Some of the companies also expanded their knowledge about security through an Internet site theydeveloped, which covers a variety of security-related issues and can be accessed both by internalemployees as well as the general public. To improve security at their facilities, companies increasedthe use of access controls, alarms, close-circuit televisions and other physical security devices. Betterlocking and sealing procedures and mechanisms enhanced security of goods in transport.
25
Similarly to manufacturers, LSPs and ocean carriers did not limit themselves only to initiatives takenwithin the four walls of their organizations, but rather expanded this activity to their business partners.For example, two of the LSPs we interviewed developed security evaluation and validation systemsfor subcontractors and vendors, and updated contracting requirements accordingly. Another companyplans to expand its security-awareness training program to include external contractors with whomthey have long-term relationships.
Overview of Collateral Benefits
This section summarizes the collateral benefits participating LSPs and ocean carriers derived fromtheir security investments. It is important to note that while the same questionnaire was used forboth manufacturers and LSPs, because of the nature of their business not all benefits listed in thequestionnaire were relevant for the LSPs and ocean carriers.
The remainder of this section describes the benefits realized by the three participating LSPs and oceancarriers following the adoption of mandatory and/or voluntary security initiatives. The benefits aredivided into five categories, based on the five sections in the questionnaire. Due to the limitedamount of quantitative data available to us regarding the magnitude of the benefits realized, thefollowing discussion will be mostly qualitative, with numerical data provided whenever available.
Inventory Management and Customer Service
Participating companies reported a number of improvements in this area, mainly ones that are relatedto keeping the goods safe and free of damage. While none of the interviewed companies couldspecify any cost savings attributed directly to these improvements, given their liability for any losseswhile the goods are in transport, it is clear that these measures can potentially have a positive impacton related costs. Below is a summary of the improvements realized by the participating companies:
• PRODUCT SAFETY: Product safety is a serious concern for LSPs because on many occasions theyare held liable for damages or losses that occur while the goods are in their responsibility. Theimprovements reported by the participating companies include reductions in tampering (reportedby 67 percent of companies), in theft/loss/pilferage (reported by 67 percent of companies), infraud (reported by 33 percent of companies), in damages (reported by 33 percent of companies),and in defective products delivered (reported by 33 percent of companies).
• CUSTOMER SERVICE: One company (33 percent of participants) saw an increase in reported on-timedelivery as a result of improving compliance programs and information flow to customs, anddue to heavy investment in IT systems.
• REDUCTION IN INVENTORY: Contrary to popular belief, many of the instances of theft or damagesto cargo take place in the warehouse and not in transit. Hence in this industry, freight at rest isconsidered freight at risk. One company (33 percent of participants) was able to reduce inventorylevels held at its warehouses for certain customers by about 75 percent by changing deliveryprocedures to these customers (for example, not limiting themselves to making deliveries onlyduring regular business hours).
Companies took various measures that led to these benefits. One company worked in collaborationwith one of its large customers to change the packaging material of goods from cardboard to woodto make them more secure. The harder-to-penetrate packaging resulted in fewer defects and refusedcargo, and when combined with added security forces on the ground it completely eliminated theft
26
and concealed losses35, which were a common problem in some lanes. Another company was ableto reduce theft and tampering by investing in various security measures such as fencing and guardsat their warehouses. By assigning two drivers instead of one to trucks in vulnerable lanes, and ensuringthat at least one driver stays in the truck/trailer at all times, one of the participating companies wasable to completely eliminate theft, pilferage and tampering in these lanes.
Visibility
Two of the participants explained that they always had good track and trace capabilities, whichprovided them with good visibility to the location of the goods for which they are responsible—whether they are in containers on a ship, on a train, or on pallets on trucks. Consequently, theywere not able to see any improvements in visibility following their investments in security measuresin recent years.
With recent changes in its working procedures for high-value cargo, a third LSP was able to increasethe volume of supply chain data that they share by 25 percent. With this change in place, the port-of-origin (where the goods are loaded) now has to pre-advise the destination port of the exact contentsof a shipment, whereas in the past, many times this information was not available until the cargo wasunloaded. Sometimes the people at the port-of-origin are even required to take pictures of the cargoand send them to the destination port, so that the recipient knows what cargo to expect. In additionto the increase in access to supply chain data, this change also made it much easier for that LSP,which is non-asset based, to file claims with the shipping airline in case the goods were damagedwhile on the plane. This led to cost savings of up to 90 percent for these particular shipments.
Efficiency
With regards to process improvements, participating companies were able to realize the followingefficiency-related improvements:
• IMPROVED PRODUCT HANDLING & REDUCED STEPS IN PROCESSES: The 24-hour rule mandates that com-panies provide cargo information prior to loading on ocean vessels. This information has helpedone of the LSPs (33 percent of participants) to plan for more efficient loading, better managementof space and also cross docking—all of which has reduced handling by up to 20 percent (in someinstances). Consequently, the number of steps in its supply chain processes was also reduced byabout 20 percent.
• PROCESS IMPROVEMENTS: 67 percent of participating companies were able to reduce process deviations,increase process compliance, and increase process predictability.
• REQUIRED PERSONNEL: One of the participants (33 percent of participants) reported a reduction in thenumber of required personnel by up to 50 percent in some traffic lanes, following the implemen-tation of such devices as electronic locks. The electronic lock creates a record whenever it is openedor closed, which eliminated the need for employees to escort the shipments, providing a positivereturn-on-investment (ROI) within less than one month!
• COST SAVINGS: 67 percent of companies realized some cost savings that can be attributable toprocess improvements.
35 Concealed losses are damage, loss, or shortage of goods within a package, which is not apparent from its exterior condition
(as defined by TechMeFinance.com).
27
One of the LSPs was able to improve process predictability and reduce deviations by about 20 percentby holding employees accountable for any deviations from the standard operating procedures.Another company took some steps such as joining FAST and certifying their drivers and equipment,in order to shorten the time it takes to cross the border. With these new initiatives in place, theygained about 5 percent increase in process compliance and process predictability, and 5 percentreduction in process deviations. These improvements also resulted in some cost savings for border-crossing shipments.
As for efficiency improvements related to transportation and the custom clearance process, partici-pating companies reported several improvements, all of them related to increased speed:
• SPEED IMPROVEMENTS: 33 percent of companies reported a reduction in time it takes to clear customs,in the duration or variance of transit time and in shipping delays.
• COST SAVINGS: One of the LSPs (33 percent of participants) realized cost savings that can be attributedto speed improvements at the port of entry and in transportation.
One of the companies interviewed saw a reduction in transit time variance after adding security guardsat the gates of their warehouses. The guards help direct traffic, which reduces the variance of truckertransit time and wait time at the warehouses. Another company reported a reduction in time ittakes to clear customs, which also had a positive impact on total shipping time and shipping delays,following various initiatives they had taken to shorten time spent at the border. Still, this and othercompanies mentioned that even though C-TPAT compliance reduced time spent at the border after9/11, this time remains longer compared to the average time spent at the border prior to 9/11. Inaddition, all participants concurred that customs continued to conduct random inspection in orderto maintain some unpredictability of their security protocol.
Resilience
All the LSPs interviewed felt that due to a long-standing good visibility and active recovery processes,there were not many improvements in resilience they realized in recent years due to supply chainsecurity measures. In fact, only one of the participating LSPs reported an improvement in resiliencein response to our survey. Because of more awareness and fast escalation of security-related problemsto higher levels, the LSP reduced by 50 percent the time to identify a problem. Consequently, it waspossible for this LSP to notify customers about a problem sooner than usual, while the goods werestill in transit. This made it easier for both the LSP and its customers to better prepare for thesechanges in plans. In addition, it was easier for the LSP to investigate the causes for the problemearlier in time, while people’s memories were still fresh. Satisfied with the success of this approach,this LSP plans to further emphasize among its employees the importance of awareness to security,and expects to see a further 50 percent reduction in problem identification time and in problemresolution time.
As for the other LSPs, one of them explained that while receiving data sooner helps them to identifypotential problems earlier, it does not translate to shorter response time or help problem resolution.As a ground carrier, a second LSP had long ago established multiple delivery paths that can be takento ensure that goods are delivered on time even in the case of a problem.
Customer Relations
Improved customer relationship seems to be one of the more significant benefit areas, as all partici-pating companies reported an improvement in the relationship with their customers following theirinvestments in security measures:

28
• CUSTOMER SATISFACTION: 100 percent of companies realized an increase in customer confidence,while 67 percent of companies reported an increase in customer satisfaction. This also had apositive impact on the LSPs’ customer base: 67 percent of companies saw an increase in thenumber of new customers and a reduction in customer attrition.
• COMMUNICATION/COLLABORATION WITH CUSTOMERS: 67 percent of companies saw an increase in thenumber of phone conferences with customers and in the number of joint customer activities. Oneof these companies (33 percent of participants) also experienced an increase in the number ofe-mail exchanges with customers and in the number of face-to-face meetings with customers.
In recent years, as customers—especially the larger ones—became more aware of the importanceof having appropriate security measures in place, they started asking their LSPs about security and/orrequired them to meet C-TPAT security criteria. This applies both to existing customers and to newones, which now include in their Request for Quotes (RFQs) specific questions related to security.Therefore, it has become essential for LSPs to have various security measures in place, and in partic-ular be C-TPAT certified, in order to retain their current customer base and acquire new customers.Moreover, one of the participating LSPs mentioned that the C-TPAT program has indirectly helpedit to increase the volume of business with some of its existing customers. As part of the C-TPATvalidation process of an importer, its senior corporate officers visit the LSP together with customsofficers, to verify that the LSP’s operations meet customs requirements. In the case of that particularLSP, some of these senior officers (who usually do not visit the LSPs’ facilities) were so impressedwith its consolidation operations that they decided to give that LSP more business. Thus, even thoughadvantages related to improved customer relationship are difficult to quantify, they are no doubtimportant for LSPs.
As for collaboration/communication with customers, since security seems to be on everybody’s mindthese days, some of the participating LSPs saw an increase in the level of communication with custo-mers. One of the LSPs reported a 50 percent increase in phone conferences, and a 75 percent increasein e-mail exchanges. These phone calls and e-mail exchanges tend to focus on process improvements,routing and other security-related matters. In addition, that LSP estimated a 25 percent increasein the number of face-to-face meetings and joint customer activities, including such activities assharing of data, which was previously considered sensitive, and comparing problems, issues andbest practices.
Summary and Conclusions
29
Given the potentially huge financial ramifications of supply chain disruptions, many companies findthat they cannot ignore these risks and must take preventive steps to increase the security of theirsupply chains. In addition, government authorities require importers and other companies involvedin global trading such as carriers and Logistics Service Providers (LSPs) to comply with some securityregulations. Failure to comply with these regulations might result in imported goods not beingallowed into the country. All these mandatory and voluntary initiatives put a significant financialburden on companies, and many of them find it difficult to provide a business case to financiallyjustify these investments.
The goals of this study were to demonstrate that investments in supply chain security can improveorganizations’ business performance and whenever possible to quantify those improvements. Wefocused on collateral benefits of security investments to manufacturers and LSPs/ocean carriers. Fivemajor areas of improvement were identified:
• Inventory management and customer service;• Visibility;• Efficiency; • Resilience; and • Customer relations.
We received inputs from 11 manufacturers from a variety of industries and three LSPs/ocean carriers,all considered in our opinion to be innovators in the area of supply chain security. The vast majorityof companies were able to realize many benefits from their security investments, with some of themreaching very significant levels. Based on these inputs, we can conclude that investments in supplychain security can help organizations to improve internal operations, strengthen relationships withtheir customers, and overall increase their profitability. Therefore, such investments in security shouldnot be considered as a financial burden that should be kept to the minimum level necessary, butrather as an opportunity for improving business performance and profitability.
Furthermore, despite the diverse types of companies that took part in our study, almost all of themrealized benefits in each of the five areas identified initially by the project team. We therefore recom-mend to other companies that are seeking ways to determine a business case for their securityinvestments to focus on these five benefit areas identified, as it is likely that their organizationsmay be able to experience similar types of benefits.
Our understanding is that there exists a general concern among those interested in supply chainsecurity policy that the benefits of increased investment in supply chain security do not necessarilyflow back in direct proportion to the entity making the investment (e.g., shippers often benefit fromthe investments made by LSPs but the reverse is seldom true). This concern impacts the willingnessof some in the private sector to make security-related investments. However, the results of our studyclearly demonstrate that such claims are not totally accurate when all collateral benefits associatedwith security investments are considered.
In particular, while it is true that shippers are likely to benefit from investments made by LSPs, our studydemonstrates that the LSPs are likely to also realize multiple direct benefits from their security invest-ments. Furthermore, those initiatives, and the resulting benefits they provide to shippers, are likelyto strengthen the relationship between LSPs and shippers and improve customer satisfaction, whichwill ultimately have a positive impact on the size and stability of the LSPs’ customer base.
30
While the data provided in this paper should not be considered as any type of an industry average,it clearly demonstrates that security investments can be beneficial, and that these benefits can bequantified. We therefore recommend that companies not consider such investments solely as expensesthat are required to meet government regulations and mitigate risk, but rather as investments thatcan have business justification, result in operational improvements, and ultimately may promote costreduction, higher revenues and growth leading to positive ROI.
It is important to remember, however, that these benefits are not realized automatically. Companiesshould be creative in determining ways—often times in collaboration with their business partners—to gain the most benefits from their security investments.
The paper demonstrates the benefits of security investments. One must remember though that terroristsor criminal groups may try to exploit for their own advantage the various security measures taken byorganizations. For example, companies that participate in voluntary supply chain security programsare likely to have fewer and less intrusive inspections at the ports of entry. Terrorists that are tryingto bring explosives into the country or drug dealers that are trying to smuggle drugs into the countryare likely to try and smuggle them in shipments with goods that belong to security program participants.
Another example is related to security measures that provide track and trace capabilities and addedvisibility regarding the location of goods while in transit. If such information leaks out to other peoplethat are not meant to see it, they may take advantage of this information to identify places and timeswhere they can, for example, steal the goods. Therefore, it is highly recommended that companiestake appropriate steps to ensure that their cargo and sensitive information are appropriately secured.
We would also like to point out that some of the participating companies reported that since late 2005they have been experiencing a significant increase in customs cargo examinations, despite participatingin government-initiated supply chain security programs. Since it should be in the best interest ofgovernment authorities to encourage companies to participate in such programs and to take othervoluntary initiatives to increase the security of their supply chain, it is recommended that governmentauthorities take steps to ensure that investing in such security measures will indeed provide benefitsto companies.
Another concern expressed by some of the participating companies is that voluntary government/industry initiatives seem to target mostly large organizations that can comply and that have alreadyproactively taken voluntary steps to secure their supply chains, while in fact much of the vulnerabilitycomes from small-business supply chains. Given that there are hundreds of thousands of such smallbusinesses in the global supply chain, upon which so many companies and governments depend,it is extremely challenging to register them, identify which of them represent the highest risk andhave the capability to inspect the high-risk goods they import.
Therefore, government authorities need to continually re-evaluate the effectiveness of their securityinitiatives, to ensure that they do reach their goal of protecting their countries and that in parallelthey provide meaningful benefits to participating companies.
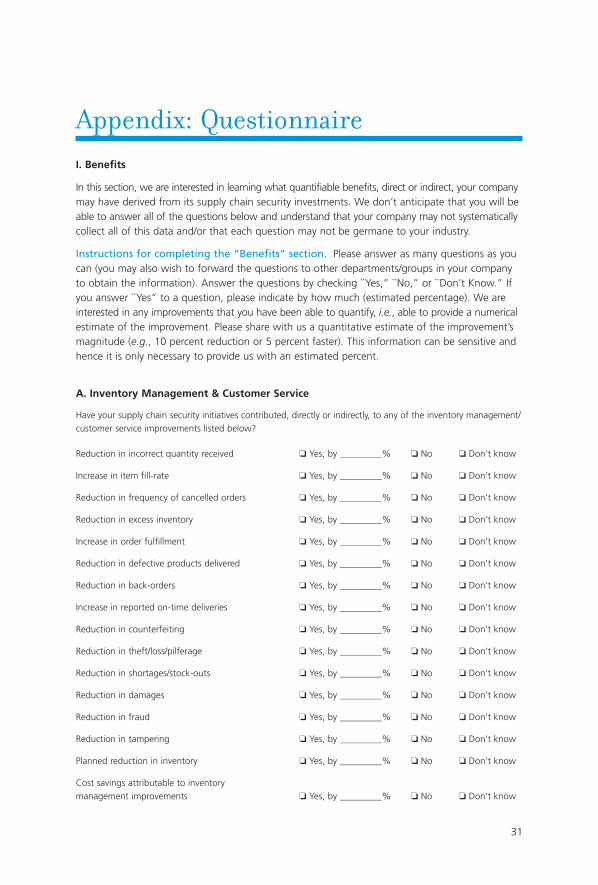
Appendix: Questionnaire
31
I. Benefits
In this section, we are interested in learning what quantifiable benefits, direct or indirect, your companymay have derived from its supply chain security investments. We don’t anticipate that you will beable to answer all of the questions below and understand that your company may not systematicallycollect all of this data and/or that each question may not be germane to your industry.
Instructions for completing the “Benefits” section. Please answer as many questions as youcan (you may also wish to forward the questions to other departments/groups in your companyto obtain the information). Answer the questions by checking ``Yes,” ``No,” or ``Don’t Know.” Ifyou answer ``Yes” to a question, please indicate by how much (estimated percentage). We areinterested in any improvements that you have been able to quantify, i.e., able to provide a numericalestimate of the improvement. Please share with us a quantitative estimate of the improvement’smagnitude (e.g., 10 percent reduction or 5 percent faster). This information can be sensitive andhence it is only necessary to provide us with an estimated percent.
A. Inventory Management & Customer Service
Have your supply chain security initiatives contributed, directly or indirectly, to any of the inventory management/customer service improvements listed below?
Reduction in incorrect quantity received ❏ Yes, by _________% ❏ No ❏ Don’t know
Increase in item fill-rate ❏ Yes, by _________% ❏ No ❏ Don’t know
Reduction in frequency of cancelled orders ❏ Yes, by _________% ❏ No ❏ Don’t know
Reduction in excess inventory ❏ Yes, by _________% ❏ No ❏ Don’t know
Increase in order fulfillment ❏ Yes, by _________% ❏ No ❏ Don’t know
Reduction in defective products delivered ❏ Yes, by _________% ❏ No ❏ Don’t know
Reduction in back-orders ❏ Yes, by _________% ❏ No ❏ Don’t know
Increase in reported on-time deliveries ❏ Yes, by _________% ❏ No ❏ Don’t know
Reduction in counterfeiting ❏ Yes, by _________% ❏ No ❏ Don’t know
Reduction in theft/loss/pilferage ❏ Yes, by _________% ❏ No ❏ Don’t know
Reduction in shortages/stock-outs ❏ Yes, by _________% ❏ No ❏ Don’t know
Reduction in damages ❏ Yes, by _________% ❏ No ❏ Don’t know
Reduction in fraud ❏ Yes, by _________% ❏ No ❏ Don’t know
Reduction in tampering ❏ Yes, by _________% ❏ No ❏ Don’t know
Planned reduction in inventory ❏ Yes, by _________% ❏ No ❏ Don’t know
Cost savings attributable to inventory management improvements ❏ Yes, by _________% ❏ No ❏ Don’t know
32
B. Visibility
Have your supply chain security initiatives contributed, directly or indirectly, to any of the visibility/transparencyimprovements listed below?
Increase in access to supply chain data ❏ Yes, by _________% ❏ No ❏ Don’t know
Increase in timeliness of shipping information ❏ Yes, by _________% ❏ No ❏ Don’t know
Reduction in inaccurate shipping information ❏ Yes, by _________% ❏ No ❏ Don’t know
Cost-savings attributable to improved supply chain visibility ❏ Yes, by _________% ❏ No ❏ Don’t know
C. Efficiency
Have your supply chain security initiatives contributed, directly or indirectly, to any of the efficiency improvementslisted below?
Reduction in number of times product handled ❏ Yes, by _________% ❏ No ❏ Don’t know
Increase in automated handling ❏ Yes, by _________% ❏ No ❏ Don’t know
Reduction in process deviations ❏ Yes, by _________% ❏ No ❏ Don’t know
Increase in process compliance ❏ Yes, by _________% ❏ No ❏ Don’t know
Increase in process predictability ❏ Yes, by _________% ❏ No ❏ Don’t know
Reduction in cycle-time (time from order received until shipped) ❏ Yes, by _________% ❏ No ❏ Don’t know
Reduction in number of steps in supply chain process ❏ Yes, by _________% ❏ No ❏ Don’t know
Reduction in number of required personnel ❏ Yes, by _________% ❏ No ❏ Don’t know
Cost-savings attributable to process improvements ❏ Yes, by _________% ❏ No ❏ Don’t know
Reduction in cargo inspections/examinations ❏ Yes, by _________% ❏ No ❏ Don’t know
Increase in predictability of cargo examinations ❏ Yes, by _________% ❏ No ❏ Don’t know
Reduction in delivery time window ❏ Yes, by _________% ❏ No ❏ Don’t know
Reduction in time it takes to clear customs ❏ Yes, by _________% ❏ No ❏ Don’t know
Reduction in transit time (e.g., transportation time) ❏ Yes, by _________% ❏ No ❏ Don’t know
Reduction in transit time variance ❏ Yes, by _________% ❏ No ❏ Don’t know
Reduction in shipping delays ❏ Yes, by _________% ❏ No ❏ Don’t know
Reduction in lead-time (activity initiation to completion) ❏ Yes, by _________% ❏ No ❏ Don’t know
Reduction in lead-time variance ❏ Yes, by _________% ❏ No ❏ Don’t know
Reduction in inspection delays ❏ Yes, by _________% ❏ No ❏ Don’t know
Cost-savings attributable to speed improvements ❏ Yes, by _________% ❏ No ❏ Don’t know
D. Resilience
Have your supply chain security initiatives contributed, directly or indirectly, to any of the resilience improvementslisted below?
Actual
Reduction in response time to problem(s) ❏ Yes, by _________% ❏ No ❏ Don’t know
Reduction in time it took to identify a problem(s) ❏ Yes, by _________% ❏ No ❏ Don’t know
33
Reduction in problem resolution time ❏ Yes, by _________% ❏ No ❏ Don’t know
Cost-savings attributable to increased resilience ❏ Yes, by _________% ❏ No ❏ Don’t know
Expected
Expected reduction in response time to problems ❏ Yes, by _________% ❏ No ❏ Don’t know
Expected reduction in problem identification time ❏ Yes, by _________% ❏ No ❏ Don’t know
Expected reduction in problem resolution time ❏ Yes, by _________% ❏ No ❏ Don’t know
Expected cost-savings attributable to resilience improvements ❏ Yes, by _________% ❏ No ❏ Don’t know
E. Customer Relationship
Have your supply chain security initiatives contributed, directly or indirectly, to any of the customer relationshipimprovements listed below?
Increase in customer satisfaction ❏ Yes, by _________% ❏ No ❏ Don’t know
Increase in customer confidence ❏ Yes, by _________% ❏ No ❏ Don’t know
Increase in number of new customers ❏ Yes, by _________% ❏ No ❏ Don’t know
Reduction in customer attrition ❏ Yes, by _________% ❏ No ❏ Don’t know
Communication/Collaboration with Customers
Increase in number of phone conferences with customers ❏ Yes, by _________% ❏ No ❏ Don’t know
Increase in number of joint customer activities ❏ Yes, by _________% ❏ No ❏ Don’t know
Increase in number of e-mail exchanges with customers ❏ Yes, by _________% ❏ No ❏ Don’t know
Increase in face-to-face meeting with customers ❏ Yes, by _________% ❏ No ❏ Don’t know
Are there any other improvements that you attribute to your supply chain security initiatives? If yes, please listand provide magnitude (estimated percent): ________________________________________________________
II. Supply Chain Security (SCS) Measures
In order for us to fully understand the benefits that you have derived, we are interested in learningmore about the supply chain security initiatives that your company has implemented. Please describeand/or list the initiatives with which you are familiar (you may also wish to forward the survey toother departments/groups in your company for this information). Instructions for completing the``SCS Measures” section of the survey: You may submit your response to this question using whateverformat is easiest for you such as e-mail ([email protected]), writing on a hard copy ofthe survey, using a separate sheet of paper, etc., and faxing (650) 723-4487 or mailing (Lesley Sept,Stanford University, 518 Memorial Way, Room 398, Stanford, CA 94305).
III. Submitting Your Completed Survey
You may submit your completed survey via e-mail ([email protected]), fax (650) 723-4487,or mail (Lesley Sept, Stanford University, 518 Memorial Way, Room 398, Stanford, CA 94305).

34
0606-17-MI

1331 Pennsylvania Avenue, NW • Washington, DC 20004-1790 • www.nam.org/institute