Embed Size (px)
Citation preview
Inorganic materials chemistry
and functional materials
Helmer Fjellvåg and Anja Olafsen Sjåstad
Lectures at CUTN spring 2016
X-ray diffraction and structure analysis
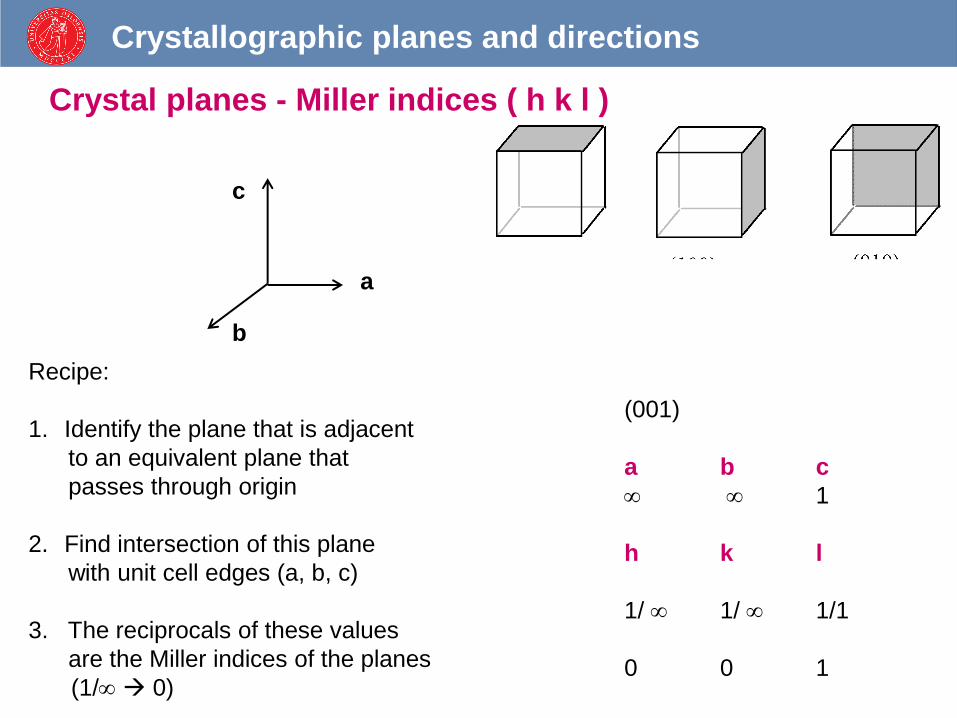
Crystal planes - Miller indices ( h k l )
Recipe:
1. Identify the plane that is adjacent
to an equivalent plane that
passes through origin
2. Find intersection of this plane
with unit cell edges (a, b, c)
3. The reciprocals of these values
are the Miller indices of the planes
(1/ 0)
c
a
b
h
(001)
a b c
1
h k l
1/ 1/ 1/1
0 0 1
Crystallographic planes and directions
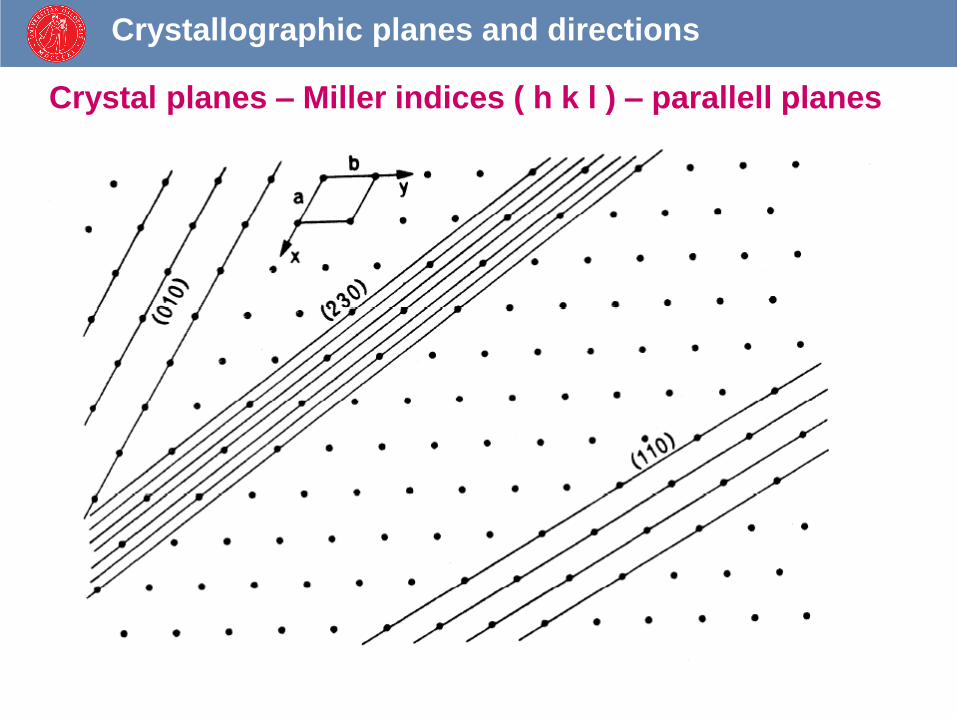
Crystal planes – Miller indices ( h k l ) – parallell planes
Crystallographic planes and directions
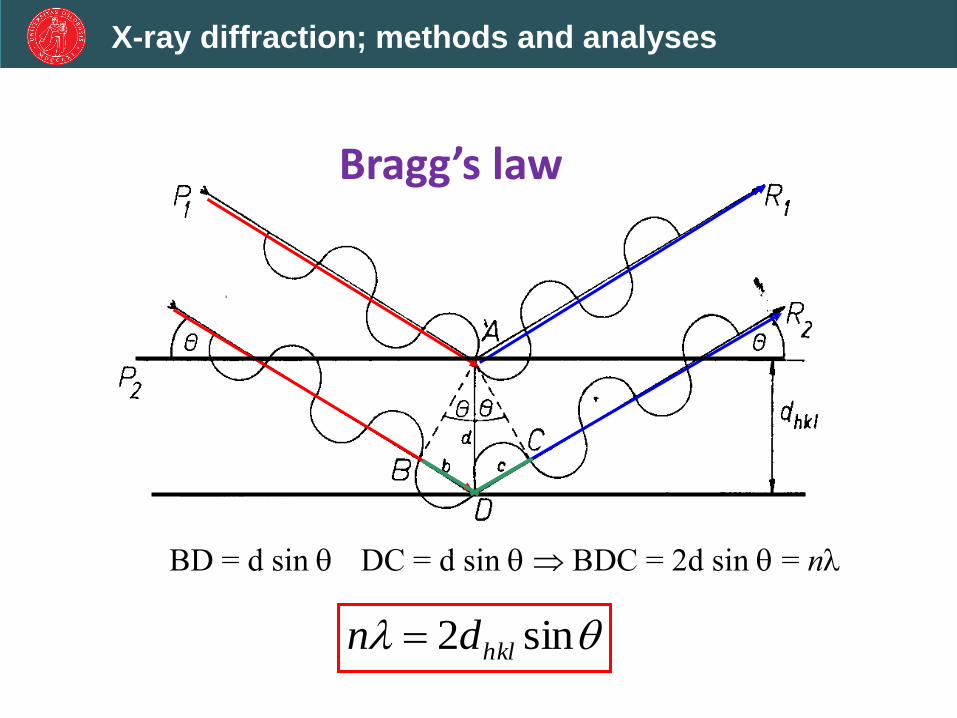
sin2 hkldn
BD = d sin DC = d sin BDC = 2d sin = n
X-ray diffraction; methods and analyses
Bragg’s law
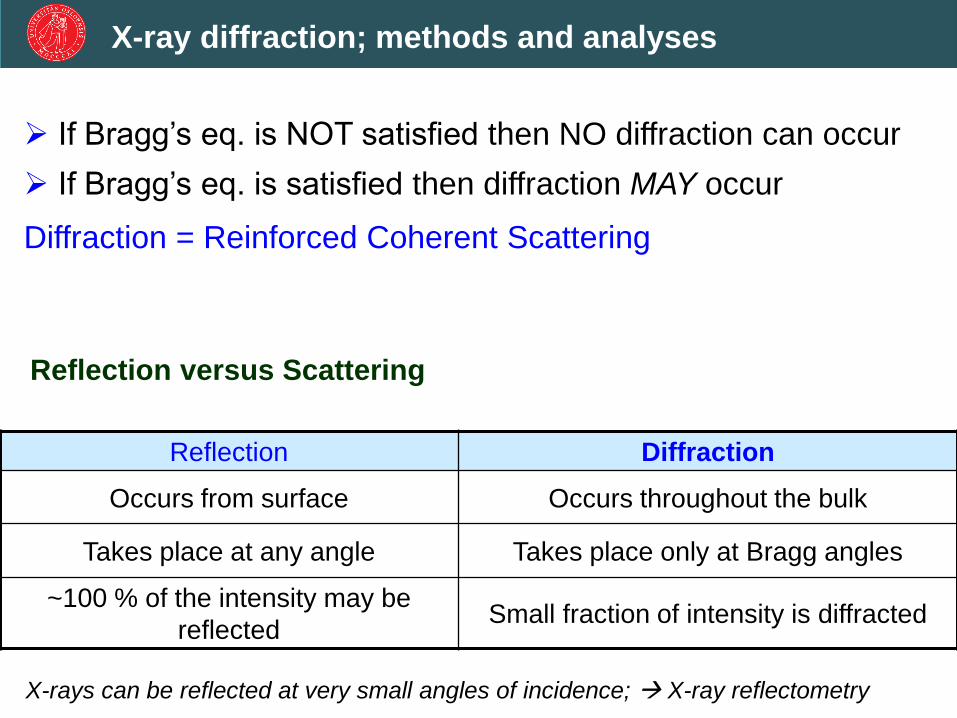
If Bragg’s eq. is NOT satisfied then NO diffraction can occur
If Bragg’s eq. is satisfied then diffraction MAY occur
Diffraction = Reinforced Coherent Scattering
Reflection versus Scattering
Reflection Diffraction
Occurs from surface Occurs throughout the bulk
Takes place at any angle Takes place only at Bragg angles
~100 % of the intensity may be
reflected Small fraction of intensity is diffracted
X-rays can be reflected at very small angles of incidence; X-ray reflectometry
X-ray diffraction; methods and analyses
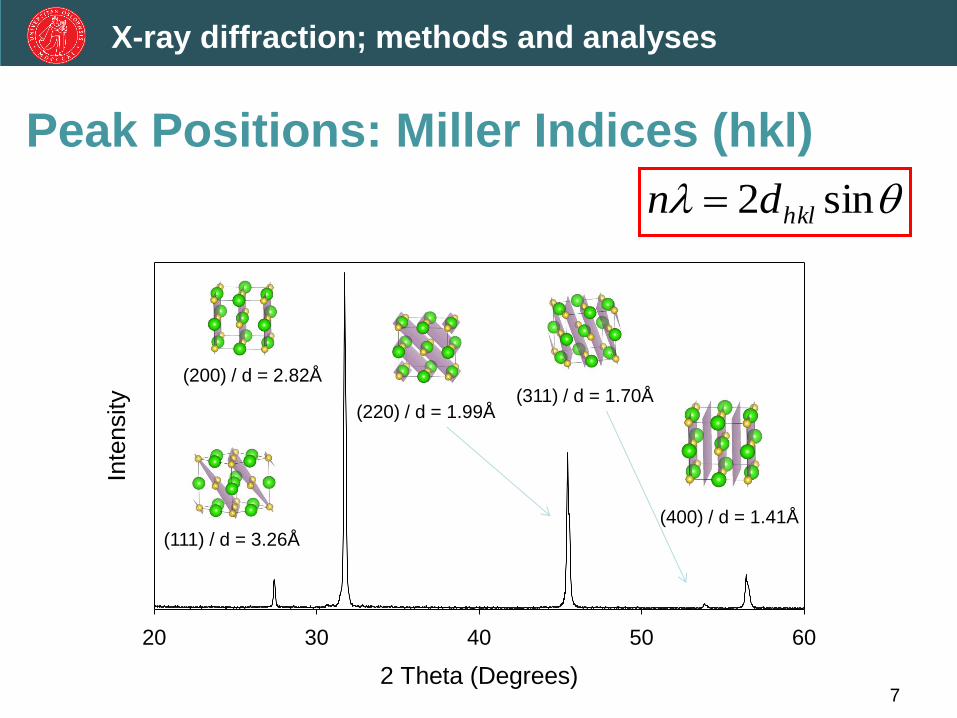
Peak Positions: Miller Indices (hkl)
2 Theta (Degrees)
20 30 40 50 60
Inte
nsity
(111) / d = 3.26Å
(200) / d = 2.82Å
(220) / d = 1.99Å
(400) / d = 1.41Å
(311) / d = 1.70Å
7
X-ray diffraction; methods and analyses
sin2 hkldn

Lin
(C
ou
nts
)
0
1000
2000
3000
4000
5000
6000
7000
8000
9000
10000
11000
12000
13000
14000
15000
16000
17000
18000
19000
2-Theta - Scale
10 20 30 40 50 60 70 80 90
The powder X-ray diffraction pattern
Diffraction peak
Intensity (relative)
Position (2Q, d)
Peak profile (width)
background
X-ray diffraction; methods and analyses

Characteristic features of the pattern
Diffraction peaks
• Intensities
• Position (2theta d-values; Braggs law)
• Profile (width FWHM; Gaussian & Lorentzian contributions)
• Due to ONE or MORE crystalline phases
Background
• Caused by diffuse scattering etc.
• Caused by fluorescence
• Caused by sample holder (capillary); sample prep..
• Caused by amorphous impurities
X-ray diffraction; methods and analyses
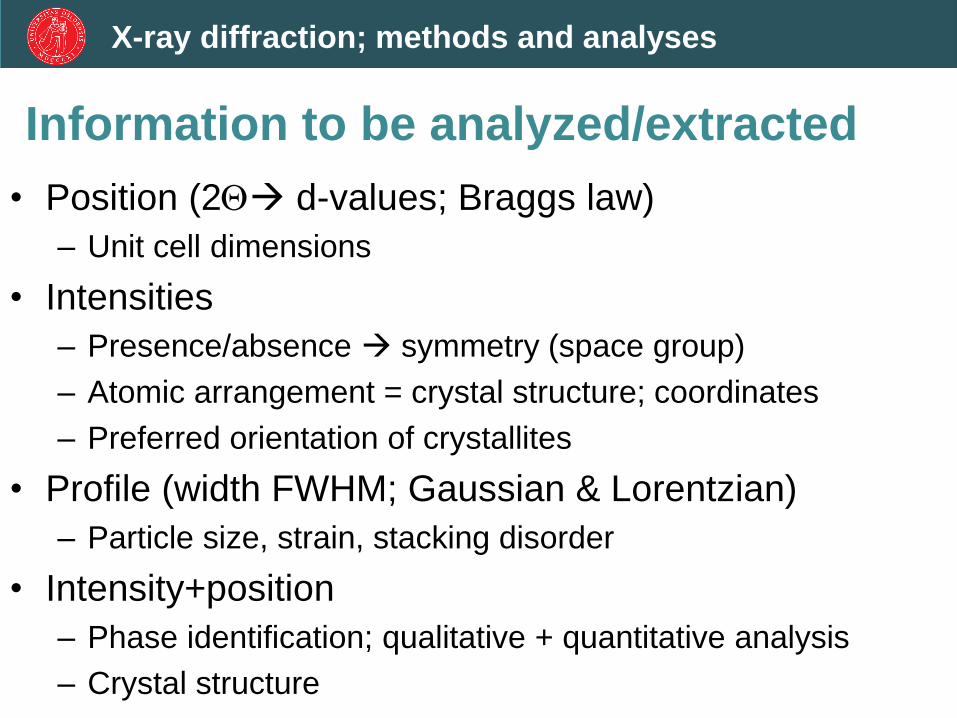
Information to be analyzed/extracted
• Position (2Q d-values; Braggs law)
– Unit cell dimensions
• Intensities
– Presence/absence symmetry (space group)
– Atomic arrangement = crystal structure; coordinates
– Preferred orientation of crystallites
• Profile (width FWHM; Gaussian & Lorentzian)
– Particle size, strain, stacking disorder
• Intensity+position
– Phase identification; qualitative + quantitative analysis
– Crystal structure
X-ray diffraction; methods and analyses
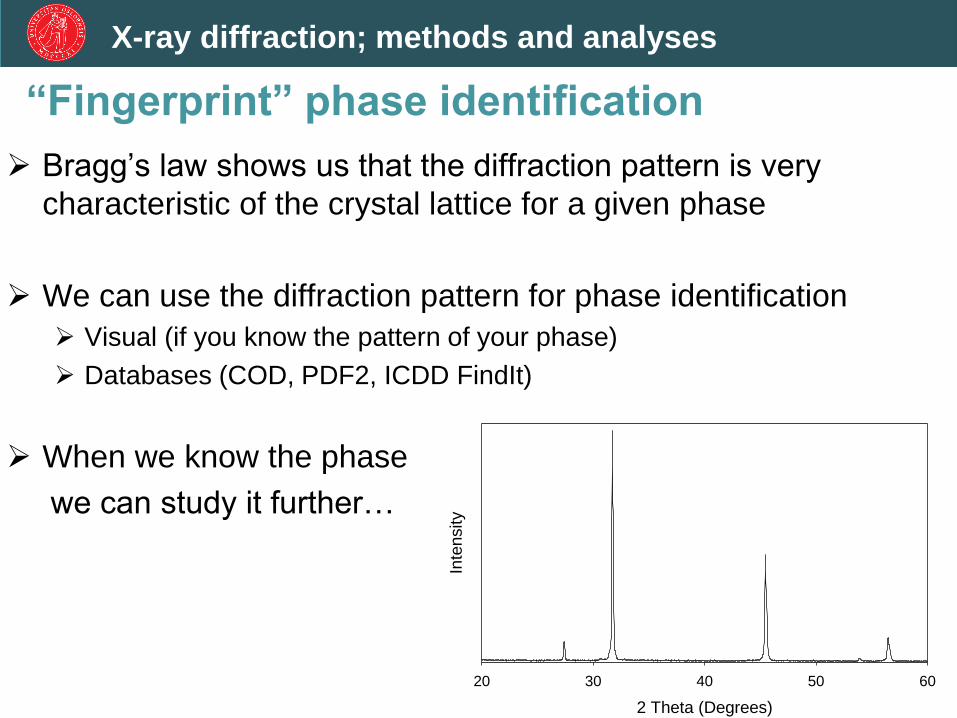
“Fingerprint” phase identification
Bragg’s law shows us that the diffraction pattern is very
characteristic of the crystal lattice for a given phase
We can use the diffraction pattern for phase identification
Visual (if you know the pattern of your phase)
Databases (COD, PDF2, ICDD FindIt)
When we know the phase
we can study it further…
11
X-ray diffraction; methods and analyses
2 Theta (Degrees)
20 30 40 50 60
Inte
nsity
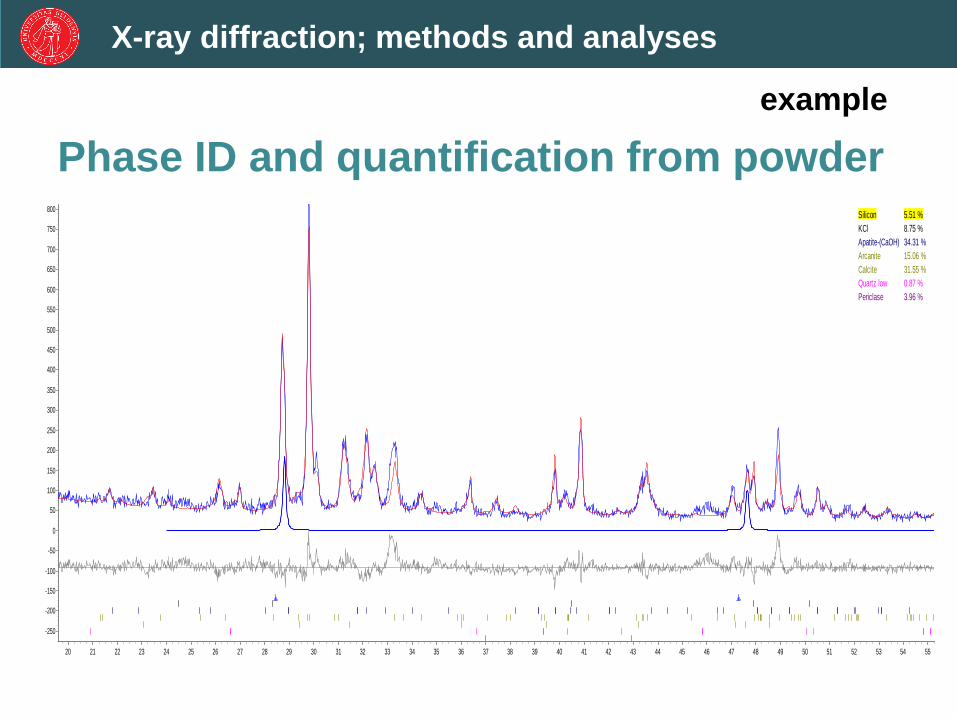
Phase ID and quantification from powder
555453525150494847464544434241403938373635343332313029282726252423222120
800
750
700
650
600
550
500
450
400
350
300
250
200
150
100
50
0
-50
-100
-150
-200
-250
Silicon 5.51 %
KCl 8.75 %
Apatite-(CaOH) 34.31 %
Arcanite 15.06 %
Calcite 31.55 %
Quartz low 0.87 %
Periclase 3.96 %
example
X-ray diffraction; methods and analyses

State of the sample ?
• Amorphous
• Crystalline (repeating atomic arrangement in 3D)
(inorganic, organic, biomaterials,…..)
• Single crystals
• Powder samples (micron sized particles)
• Nanomaterials (particles, colloids,…)
• Thin films (multilayers, heterostructures)
• Multiphased (composites)
• ...........
X-ray diffraction; methods and analyses
0 1 2 3 4 5 60
10
20
Fre
que
ncy %
dimameter / nm
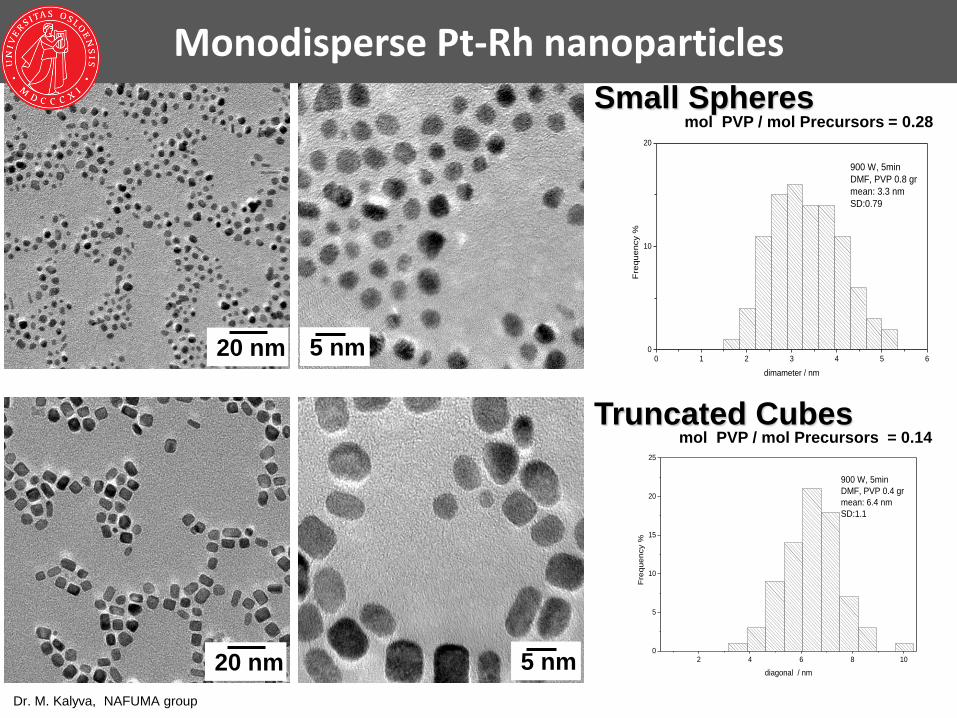
900 W, 5min
DMF, PVP 0.8 gr
mean: 3.3 nm
SD:0.79
Small Spheres mol PVP / mol Precursors = 0.28
2 4 6 8 100
5
10
15
20
25
Fre
qu
en
cy %
diagonal / nm
900 W, 5min
DMF, PVP 0.4 gr
mean: 6.4 nm
SD:1.1
Truncated Cubes mol PVP / mol Precursors = 0.14
Monodisperse Pt-Rh nanoparticles
20 nm
20 nm
5 nm
5 nm
Dr. M. Kalyva, NAFUMA group
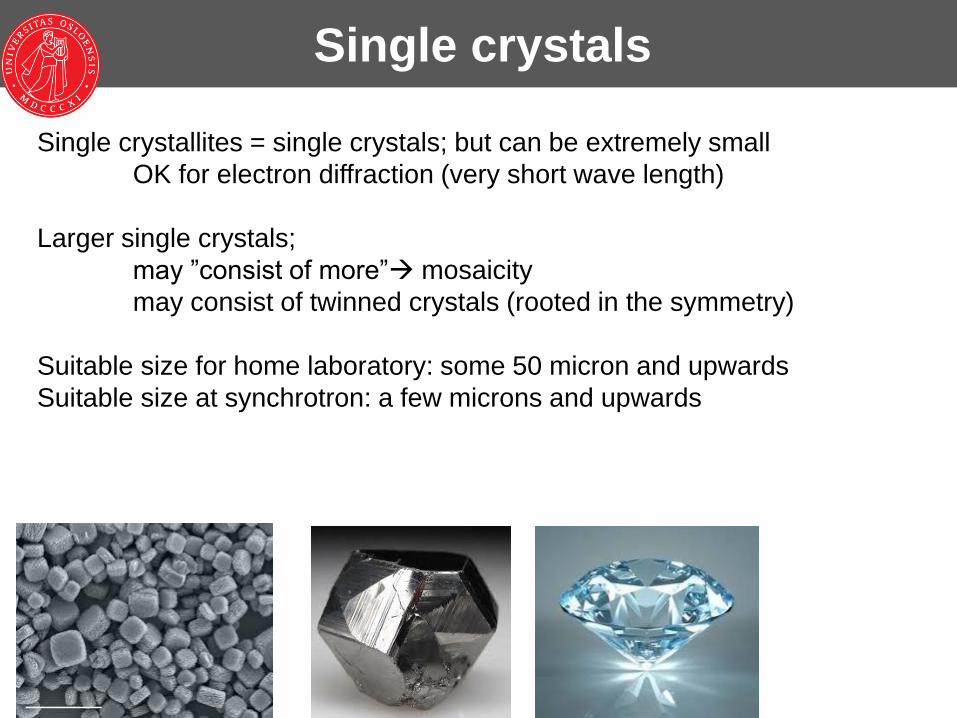
Utstyr og brukere Single crystals
Single crystallites = single crystals; but can be extremely small
OK for electron diffraction (very short wave length)
Larger single crystals;
may ”consist of more” mosaicity
may consist of twinned crystals (rooted in the symmetry)
Suitable size for home laboratory: some 50 micron and upwards
Suitable size at synchrotron: a few microns and upwards

Fe Ti
Ni
BF image
EFTEM images
Si substrate
JB1044
NAFUMA @ SMN / KI / UiO
Activities: thematic overview Thin films and multilayers
sin2 hkldn
Lin
(C
ounts
)
0
1000
2000
3000
4000
5000
6000
7000
8000
9000
10000
11000
12000
13000
14000
15000
16000
17000
18000
19000
2-Theta - Scale
10 20 30 40 50 60 70 80 90
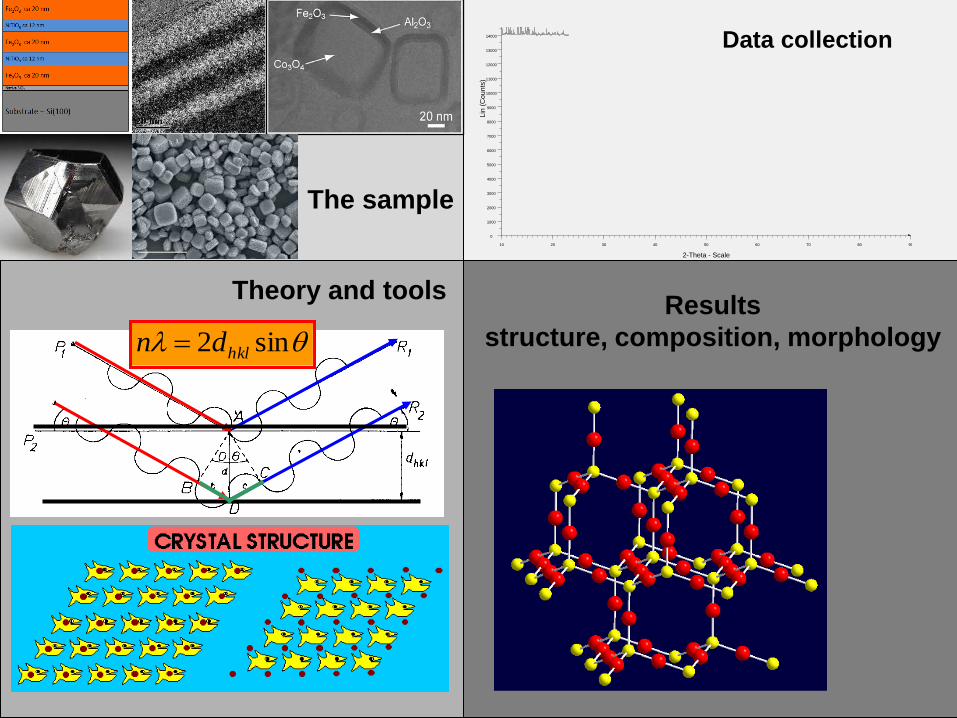
The sample
Data collection
Theory and tools Results
structure, composition, morphology
X-ray diffraction; methods and analyses
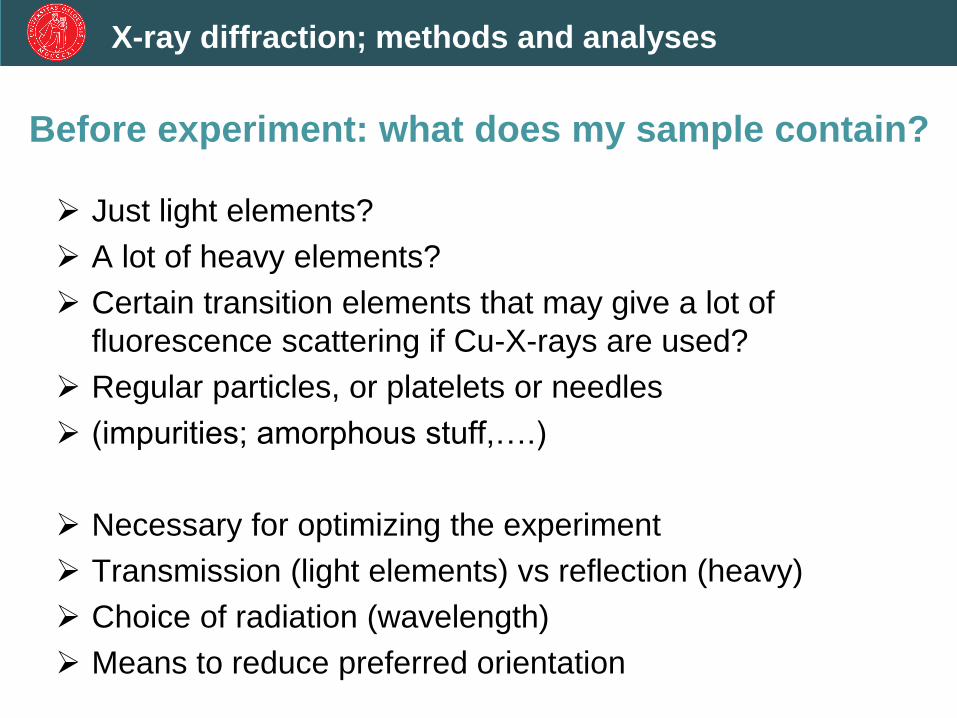
Before experiment: what does my sample contain?
Just light elements?
A lot of heavy elements?
Certain transition elements that may give a lot of
fluorescence scattering if Cu-X-rays are used?
Regular particles, or platelets or needles
(impurities; amorphous stuff,….)
Necessary for optimizing the experiment
Transmission (light elements) vs reflection (heavy)
Choice of radiation (wavelength)
Means to reduce preferred orientation
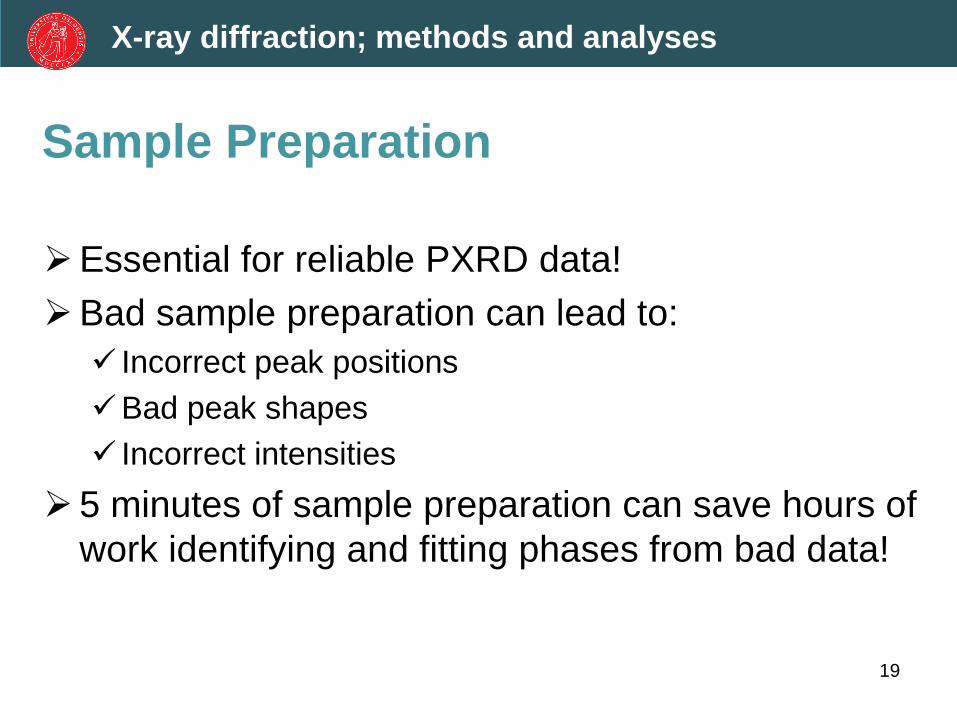
Sample Preparation
Essential for reliable PXRD data!
Bad sample preparation can lead to:
Incorrect peak positions
Bad peak shapes
Incorrect intensities
5 minutes of sample preparation can save hours of
work identifying and fitting phases from bad data!
19
X-ray diffraction; methods and analyses

Sample Preparation Sample holder must be full, with powder homogeneously packed
Top of sample must be flat and level with sample holder
“Powder mountain” – Wrong peak positions
– Wrong peak intensities
– Wrong peak shapes
“Powder Valley” – Wrong peak positions
– Wrong peak intensities
– Broad/double peaks
Correct preparation Correct peak positions
Correct peak intensities
Sharp peaks
X-ray diffraction; methods and analyses

Sample preparation
2 Theta
30 31 32 33 34 35 36
Correct
2 Theta
20 30 40 50 60 70 80
Powder
valley
Powder
mountain
X-ray diffraction; methods and analyses
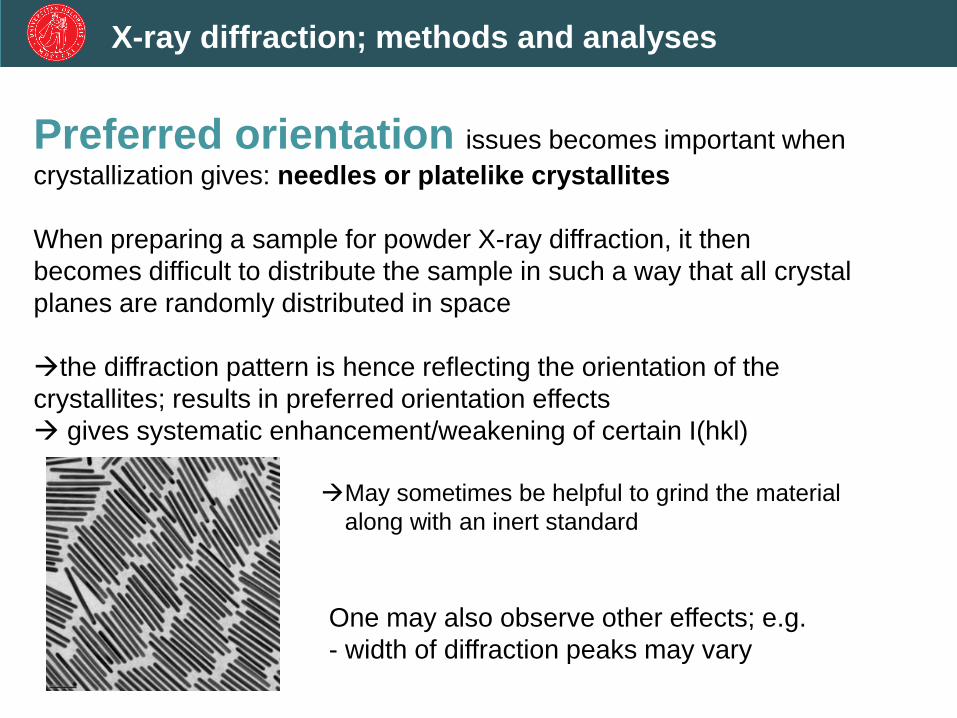
Preferred orientation issues becomes important when
crystallization gives: needles or platelike crystallites
When preparing a sample for powder X-ray diffraction, it then
becomes difficult to distribute the sample in such a way that all crystal
planes are randomly distributed in space
the diffraction pattern is hence reflecting the orientation of the
crystallites; results in preferred orientation effects
gives systematic enhancement/weakening of certain I(hkl)
May sometimes be helpful to grind the material
along with an inert standard
One may also observe other effects; e.g.
- width of diffraction peaks may vary
X-ray diffraction; methods and analyses

Peak Intensity: Preferred Orientation
E.g. mica flakes; tend to lie flat on plate sample holders
23
X-ray diffraction; methods and analyses
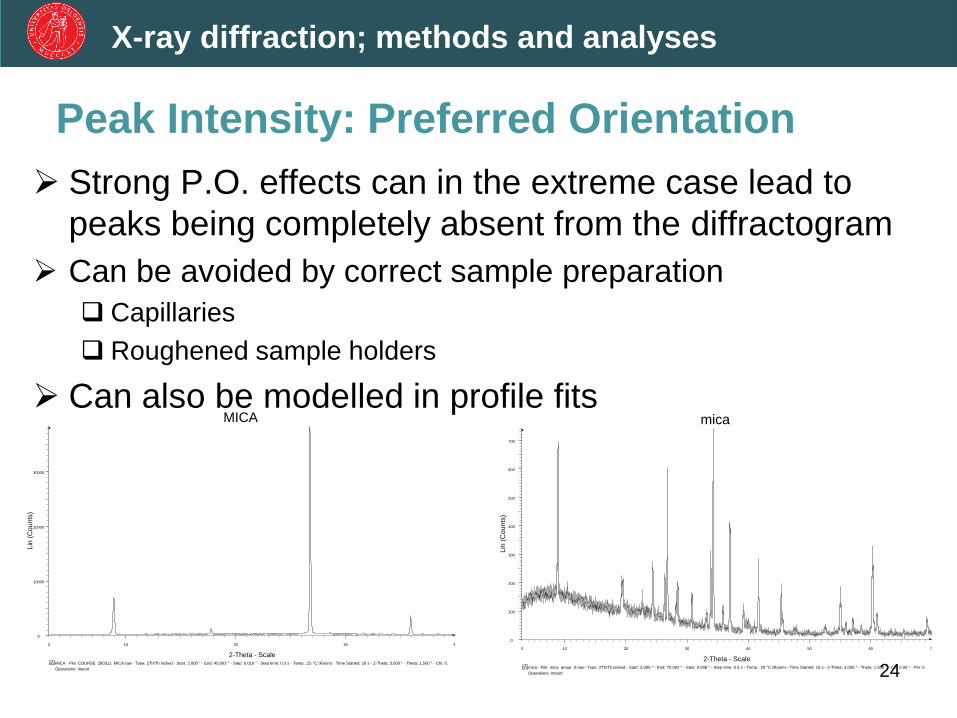
Peak Intensity: Preferred Orientation
Strong P.O. effects can in the extreme case lead to
peaks being completely absent from the diffractogram
Can be avoided by correct sample preparation
Capillaries
Roughened sample holders
Can also be modelled in profile fits
24
MICA
Operations: Import
MICA - File: COURSE_280311_MICA.raw - Type: 2Th/Th locked - Start: 3.000 ° - End: 40.003 ° - Step: 0.016 ° - Step time: 0.3 s - Temp.: 25 °C (Room) - Time Started: 16 s - 2-Theta: 3.000 ° - Theta: 1.500 ° - Chi: 0.
Lin
(C
ounts
)
0
10000
20000
30000
2-Theta - Scale
3 10 20 30 40
mica
Operations: Import
mica - File: mica_group_II.raw - Type: 2Th/Th locked - Start: 3.000 ° - End: 70.002 ° - Step: 0.008 ° - Step time: 0.5 s - Temp.: 25 °C (Room) - Time Started: 15 s - 2-Theta: 3.000 ° - Theta: 1.500 ° - Chi: 0.00 ° - Phi: 0
Lin
(C
ounts
)
0
100
200
300
400
500
600
700
2-Theta - Scale
3 10 20 30 40 50 60 70
X-ray diffraction; methods and analyses
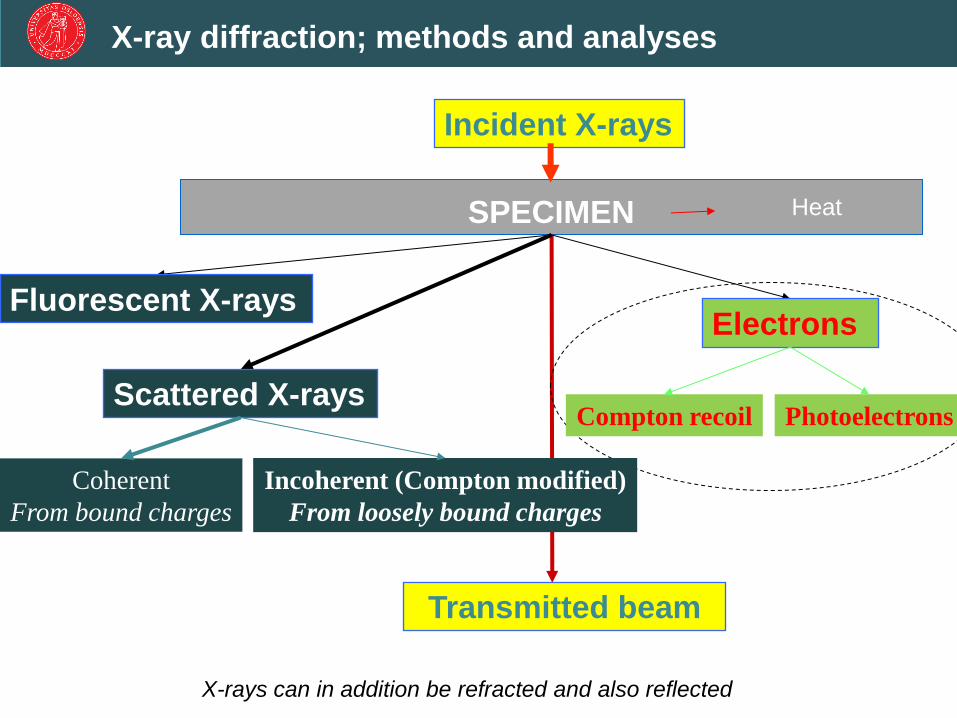
Heat
Incident X-rays
SPECIMEN
Transmitted beam
Fluorescent X-rays Electrons
Compton recoil Photoelectrons Scattered X-rays
Coherent
From bound charges
Incoherent (Compton modified)
From loosely bound charges
X-rays can in addition be refracted and also reflected
X-ray diffraction; methods and analyses
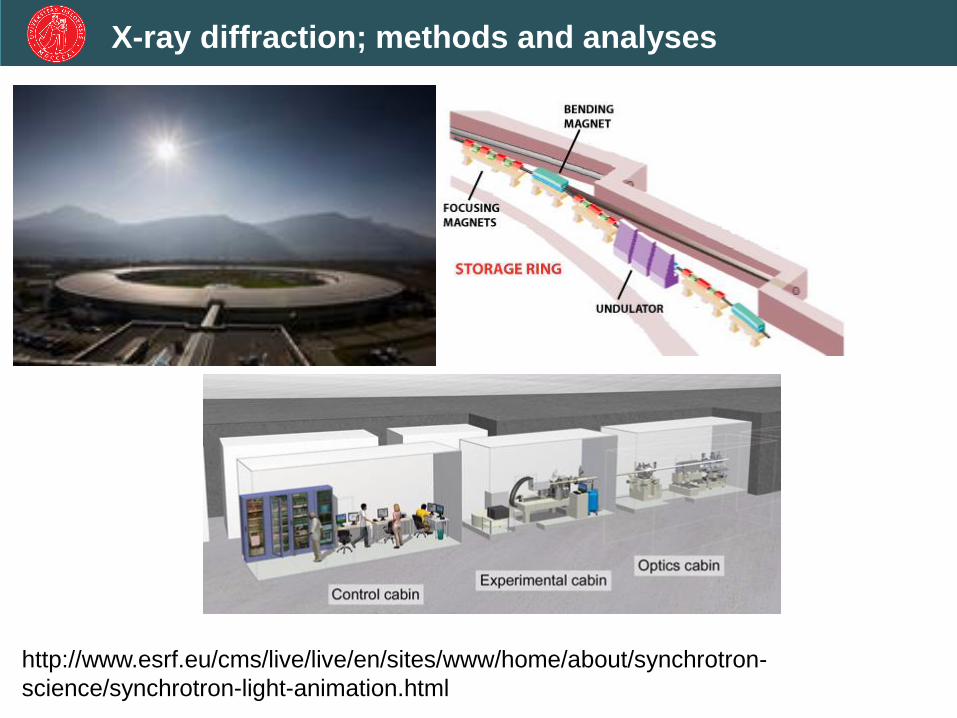
http://www.esrf.eu/cms/live/live/en/sites/www/home/about/synchrotron-
science/synchrotron-light-animation.html
X-ray diffraction; methods and analyses
X-ray diffraction; methods and analyses
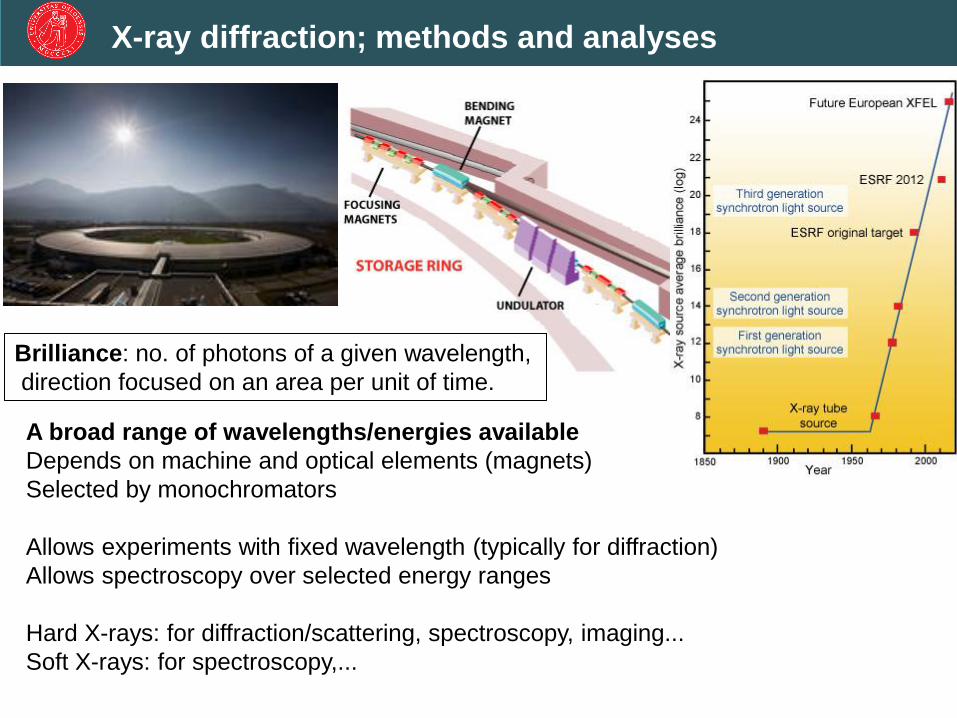
A broad range of wavelengths/energies available
Depends on machine and optical elements (magnets)
Selected by monochromators
Allows experiments with fixed wavelength (typically for diffraction)
Allows spectroscopy over selected energy ranges
Hard X-rays: for diffraction/scattering, spectroscopy, imaging...
Soft X-rays: for spectroscopy,...
Brilliance: no. of photons of a given wavelength,
direction focused on an area per unit of time.

X-ray diffraction; methods and analyses
Principle of X-ray tube (home lab)
• Electrons are emitted
by heated cathode and
accelerated towards
anode.
• They hit the anode
which leads to – Creation of white radiation
(Bremsstrahlung).
– Emission of characteristic
radiation (cf anode material)
– Heat evolution (98-99% of
the total energy!).
– Hence; cooling by water….
+-
6 V
³15 kV
e-
Emission window (Be)
Anode
Heated cathode
Vacuum
IKa1
KbKa2
Typical anode materials:
Cu, Mo, Cr, Co, Ag
X-ray diffraction; methods and analyses
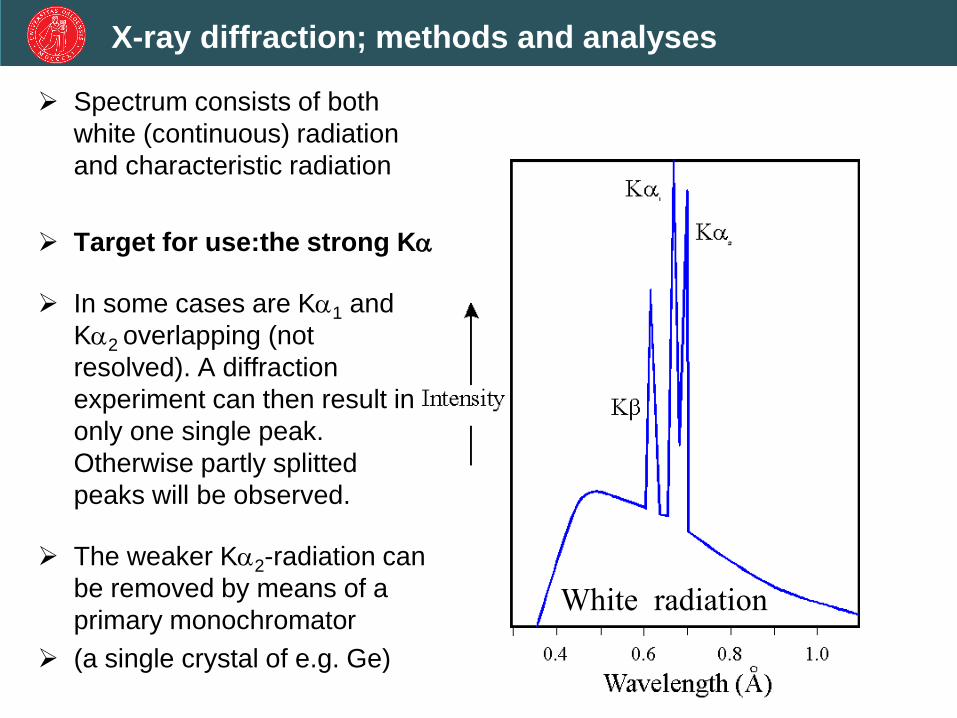
Spectrum consists of both
white (continuous) radiation
and characteristic radiation
Target for use:the strong Ka
In some cases are Ka1 and
Ka2 overlapping (not
resolved). A diffraction
experiment can then result in
only one single peak.
Otherwise partly splitted
peaks will be observed.
The weaker Ka2-radiation can
be removed by means of a
primary monochromator
(a single crystal of e.g. Ge)
White radiation
X-ray diffraction; methods and analyses
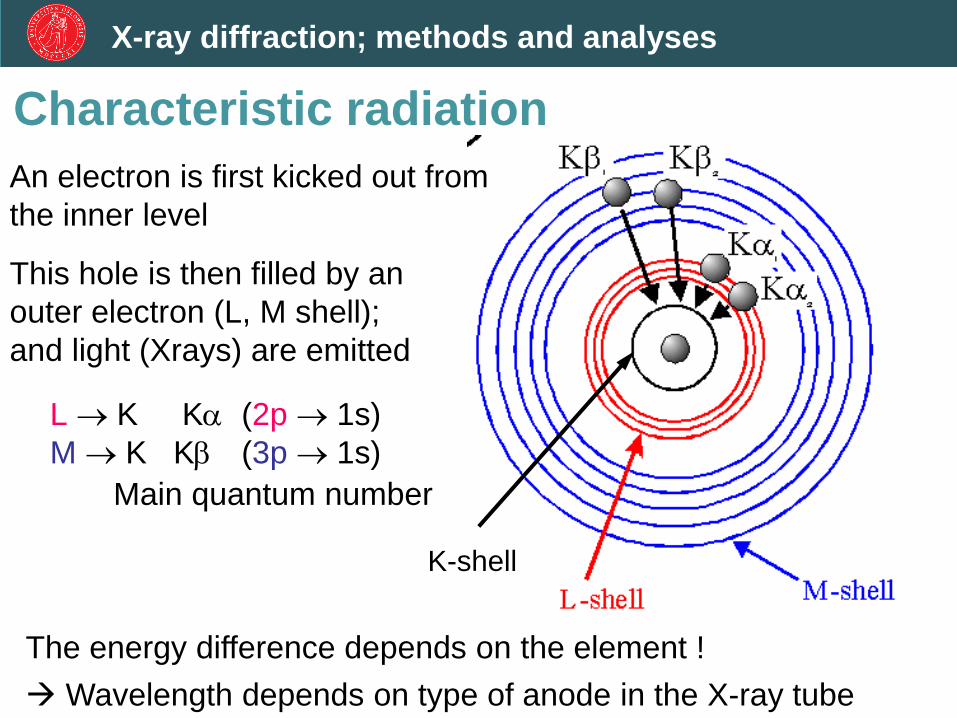
L K Ka (2p 1s)
M K Kb (3p 1s)
K-shell
Characteristic radiation
The energy difference depends on the element !
Wavelength depends on type of anode in the X-ray tube
Main quantum number
An electron is first kicked out from
the inner level
This hole is then filled by an
outer electron (L, M shell);
and light (Xrays) are emitted
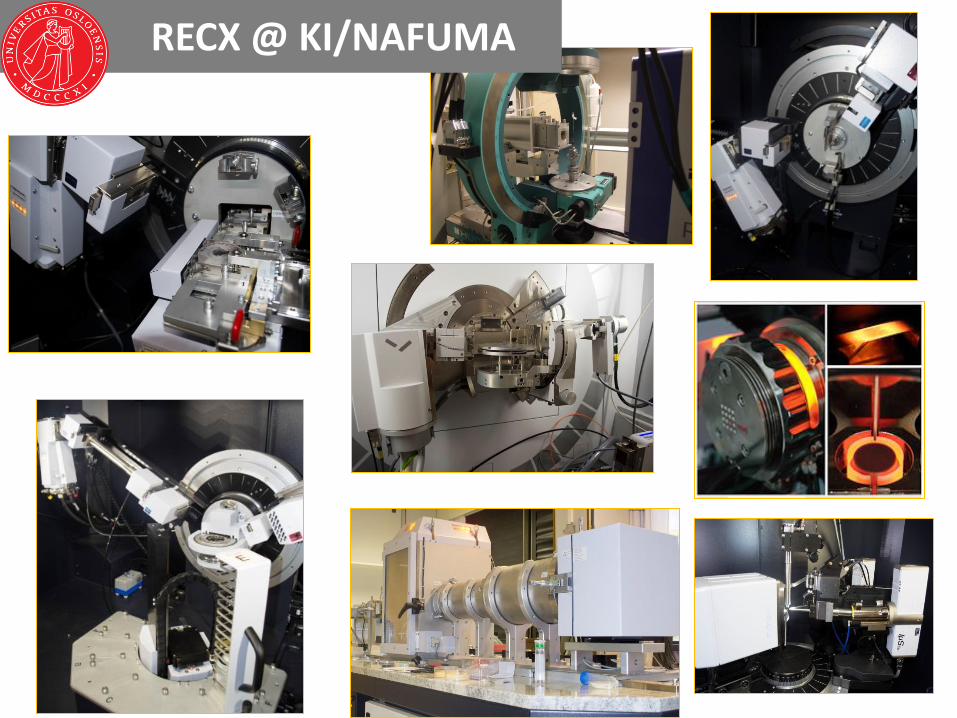
Instrumentation RECX @ KI/NAFUMA
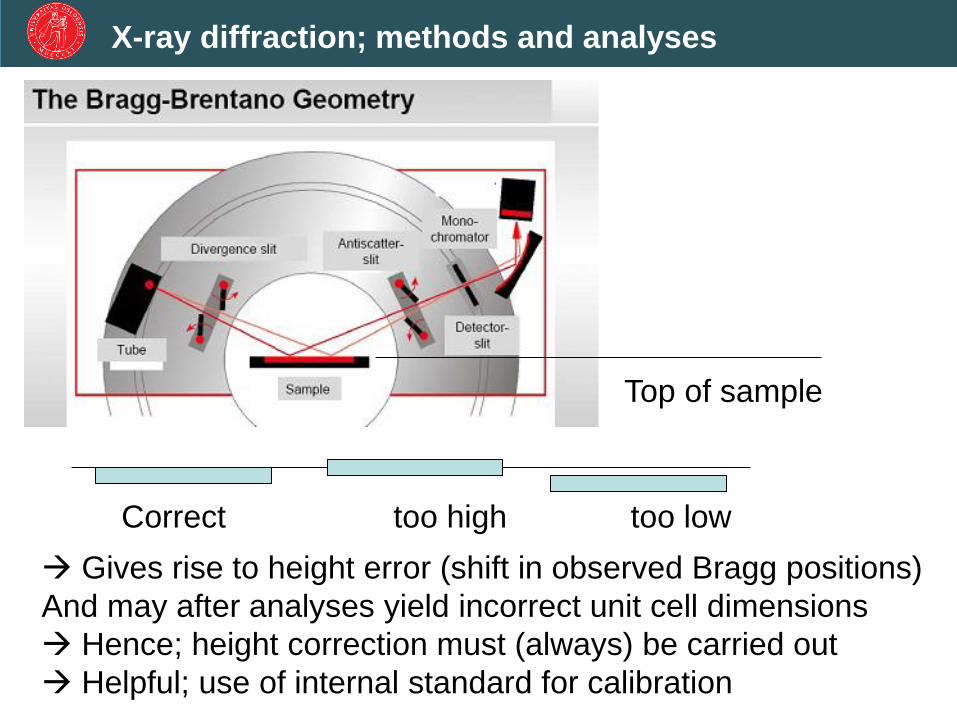
Top of sample
Correct too high too low
Gives rise to height error (shift in observed Bragg positions)
And may after analyses yield incorrect unit cell dimensions
Hence; height correction must (always) be carried out
Helpful; use of internal standard for calibration
X-ray diffraction; methods and analyses
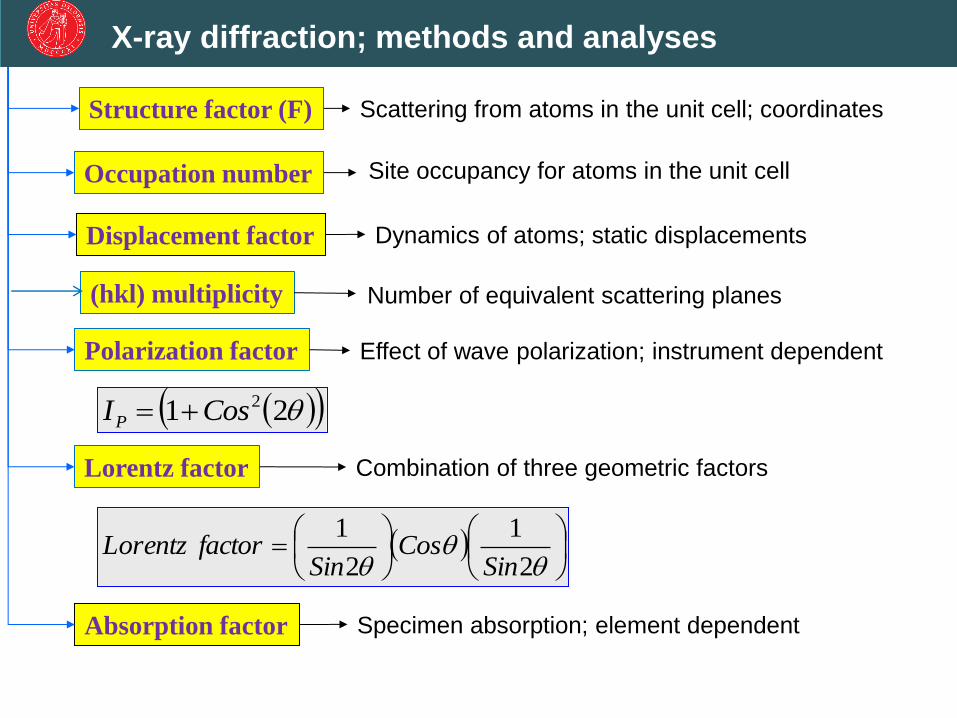
Structure factor (F)
Occupation number
Polarization factor
Lorentz factor
Absorption factor
Displacement factor
Scattering from atoms in the unit cell; coordinates
Number of equivalent scattering planes
Effect of wave polarization; instrument dependent
Combination of three geometric factors
Specimen absorption; element dependent
Dynamics of atoms; static displacements
2
1
2
1
SinCos
SinfactorLorentz
21 2CosIP
(hkl) multiplicity
Site occupancy for atoms in the unit cell
X-ray diffraction; methods and analyses

Absorption Intensity loss due to sample absorbing the x-ray beam
Wavelength dependent
Sample and geometry dependent
For flat plate absorption is a linear function
For cylindrical sample/Debye-Scherrer transmission geometry
there is angular dependence
For transmission geometry: the absorption should be
calculated prior to data collection, and if needed, the
sample should be diluted
34
X-ray diffraction; methods and analyses
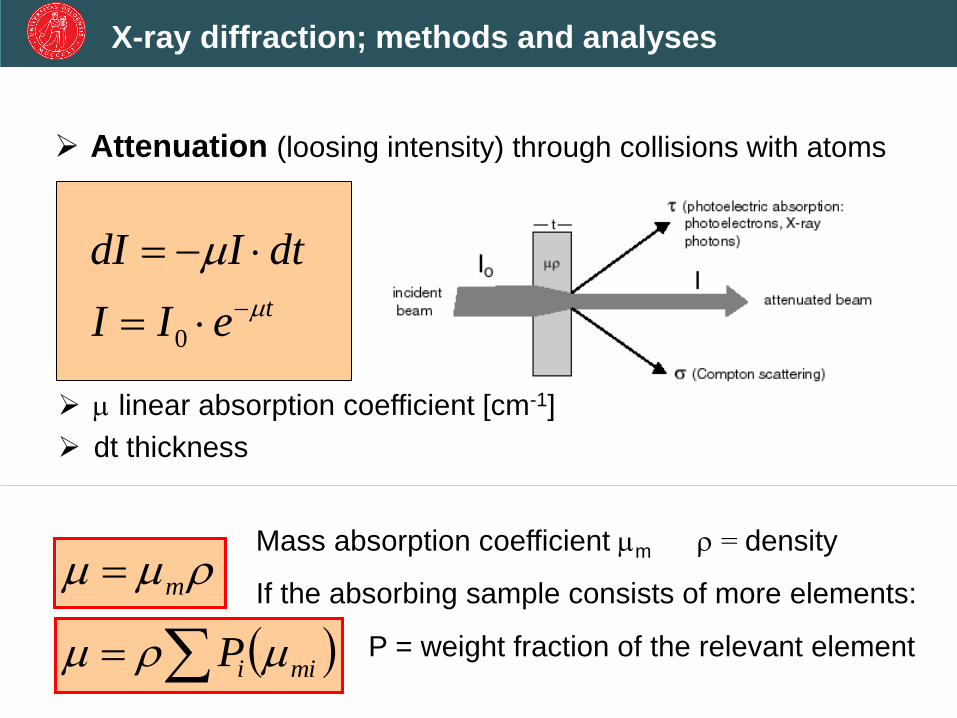
linear absorption coefficient [cm-1]
dt thickness
Attenuation (loosing intensity) through collisions with atoms
teII
dtIdI
0
X-ray diffraction; methods and analyses
m
miiP
Mass absorption coefficient m = density
If the absorbing sample consists of more elements:
P = weight fraction of the relevant element
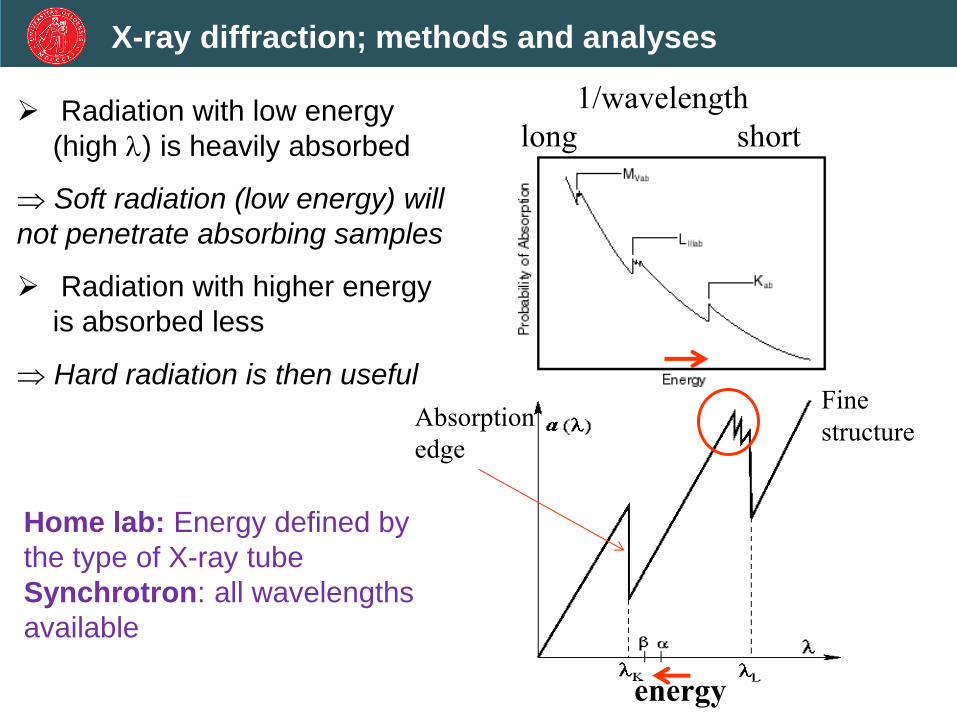
Radiation with low energy
(high ) is heavily absorbed
Soft radiation (low energy) will
not penetrate absorbing samples
Radiation with higher energy
is absorbed less
Hard radiation is then useful
1/wavelength
long short
Home lab: Energy defined by
the type of X-ray tube
Synchrotron: all wavelengths
available
X-ray diffraction; methods and analyses
energy
Absorption
edge
Fine
structure

X-ray diffraction; methods and analyses
L K Ka (2p 1s)
M K Kb (3p 1s)
K-shell
Characteristic radiation
The energy difference depends on the element !
Wavelength depends on type of anode in the X-ray tube
Main quantum number
An electron is first kicked out from
the inner level
This hole is then filled by an
outer electron (L, M shell);
and light (Xrays) are emitted
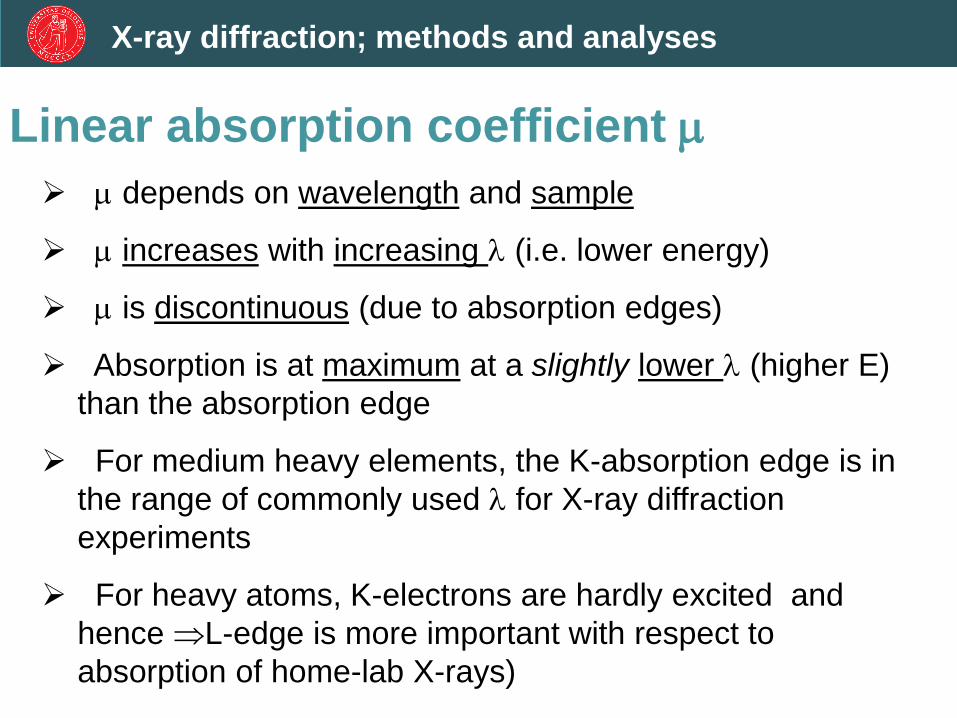
Linear absorption coefficient
depends on wavelength and sample
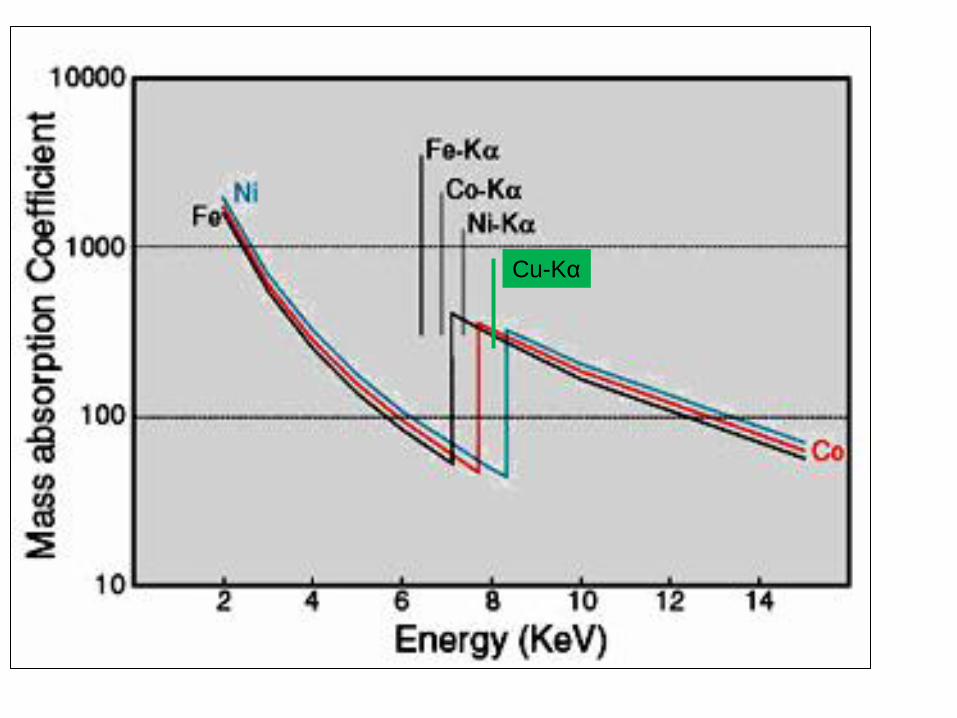
increases with increasing (i.e. lower energy)
is discontinuous (due to absorption edges)
Absorption is at maximum at a slightly lower (higher E)
than the absorption edge
For medium heavy elements, the K-absorption edge is in
the range of commonly used for X-ray diffraction
experiments
For heavy atoms, K-electrons are hardly excited and
hence L-edge is more important with respect to
absorption of home-lab X-rays)
X-ray diffraction; methods and analyses
X-ray diffraction; methods and analyses
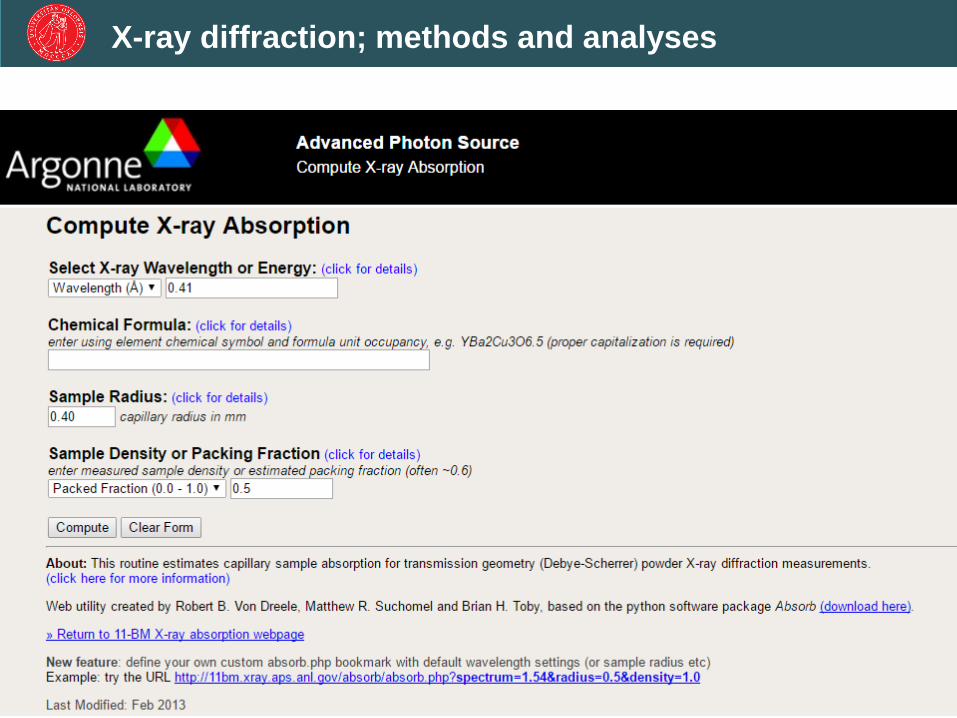
Argonne web-page; help to calculate absorption and
dilution of sample with an inert
How to reduce absorption (in transmission geometry):
Sample dilution by mixing in:
Silica (will enhance amorphous background)
MgO; a few additional peaks; well-defined, easy to analyse
KCl: a few additional peaks + increased absorption
Just use a smaller capillary; ...?
Uneven particle distribution
Poor capillary filling
X-ray diffraction; methods and analyses
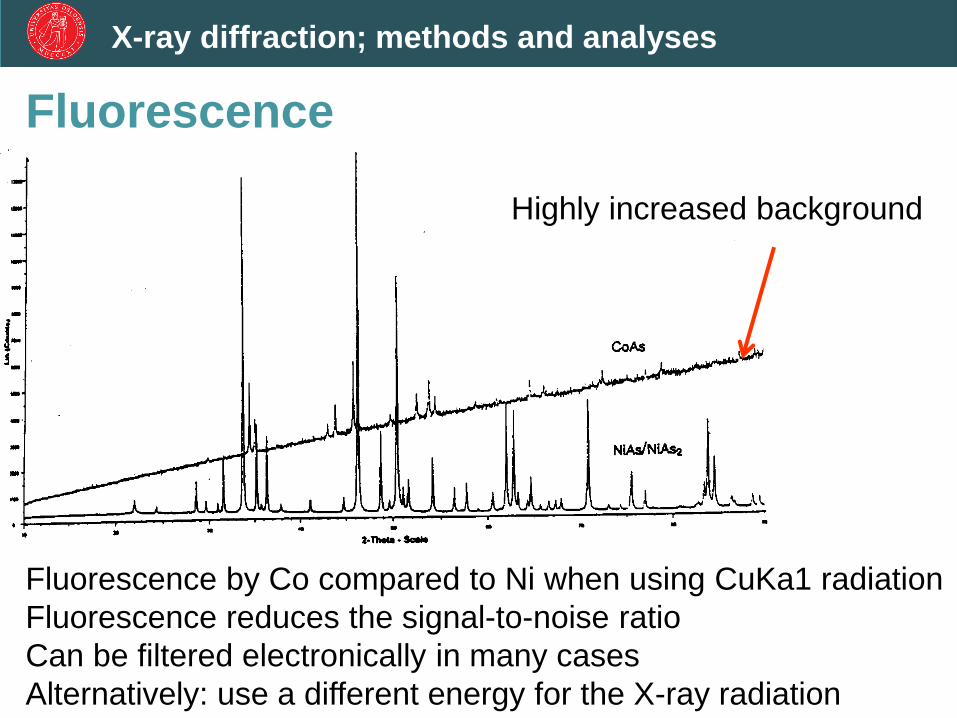
Fluorescence
Fluorescence by Co compared to Ni when using CuKa1 radiation
Fluorescence reduces the signal-to-noise ratio
Can be filtered electronically in many cases
Alternatively: use a different energy for the X-ray radiation
Highly increased background
X-ray diffraction; methods and analyses
Cu-Kα
Vacuum level
Energy
levels
KE
1LE
2LE
3LE
K
1L
2L
3L
Emission of
characteristic fluorescent x-rays
Emitted in all directions
Electron kicked out
from inner shell
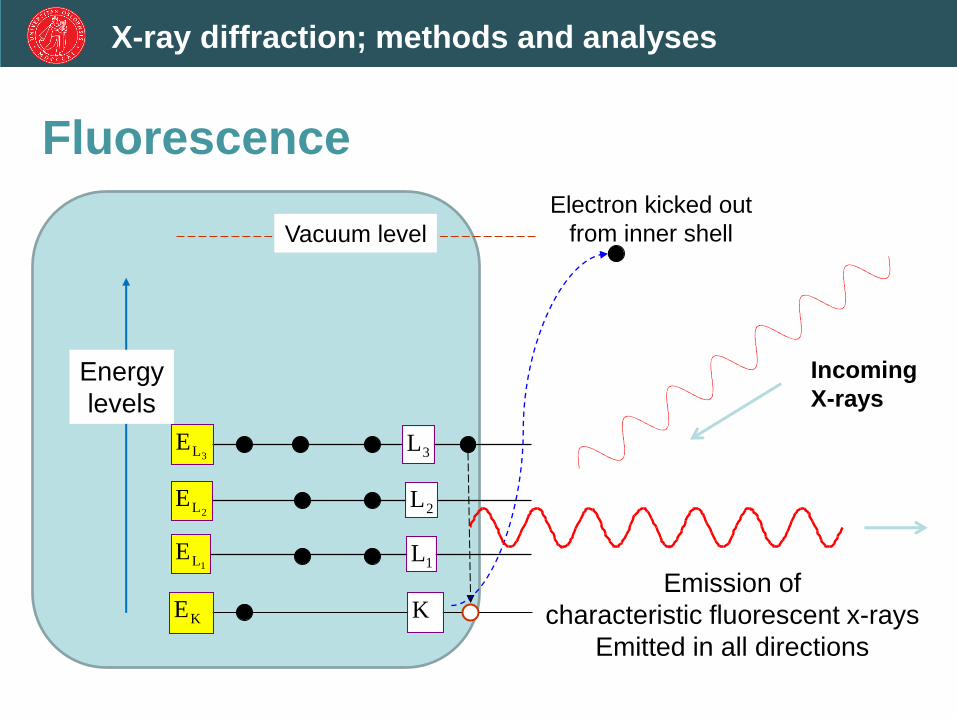
X-ray diffraction; methods and analyses
Fluorescence
Incoming
X-rays

X-ray diffraction; methods and analyses
Atoms in an excited state generated by absorption of X-rays, may emit characteristic radiation by outer electrons falling into vacant inner orbitals
Fluorescence has always lower energy (longer wavelength) than the exciting (incoming) X-ray radiation
Atoms are excited more strongly by radiation with wavelength close to the absorption edge
Fluorescence radiation is the basis for X-ray fluorescence spectrometry (XRF)
NB! For X-ray diffraction fluorescence is a nuisance and
experimental conditions should be selected so as to
minimize its impact
Fluorescence