Embed Size (px)
Citation preview

INSECURITY, INEQUALITY AND THE LABOUR MARKET
PRESENTATION TO JOBS AUSTRALIA CONFERENCE
HOTEL GRAND CHANCELLOR, HOBART – 2ND NOVEMBER 2017

It’s widely believed that robots, artificial intelligence, ‘big data’, machine learning etc will lead to mass unemployment
2
Carl B. Frey
Michael Osborne
One very widely-quoted study seeks to estimate the probability of each of 702 different
occupations being replaced by computers, robots or algorithms based on an
assessment of the capacity for the tasks undertaken by each occupation ‘to be
performed by state-of-the-art computer-controlled equipment’, and the existence or
otherwise of ‘bottlenecks’ to computerization
(social perceptiveness,negotiation, persuasion, assisting & caring for others)
(originality, fine arts)
(finger dexterity, manual dexterity, working in cramped spaces or awkward positions)
Source: Carl Frey & Michael Osborne, The Future of Employment: How Susceptible are Jobs to Computerization, Oxford Martin School,
University of Oxford, September 2013.

One widely-quoted study suggests 47% of US employees are working in jobs that could be done by computers or algorithms within 10-20 years
3
Source: Carl Frey & Michael Osborne, The Future of Employment: How Susceptible are Jobs to Computerization, Oxford Martin School,
University of Oxford, September 2013.
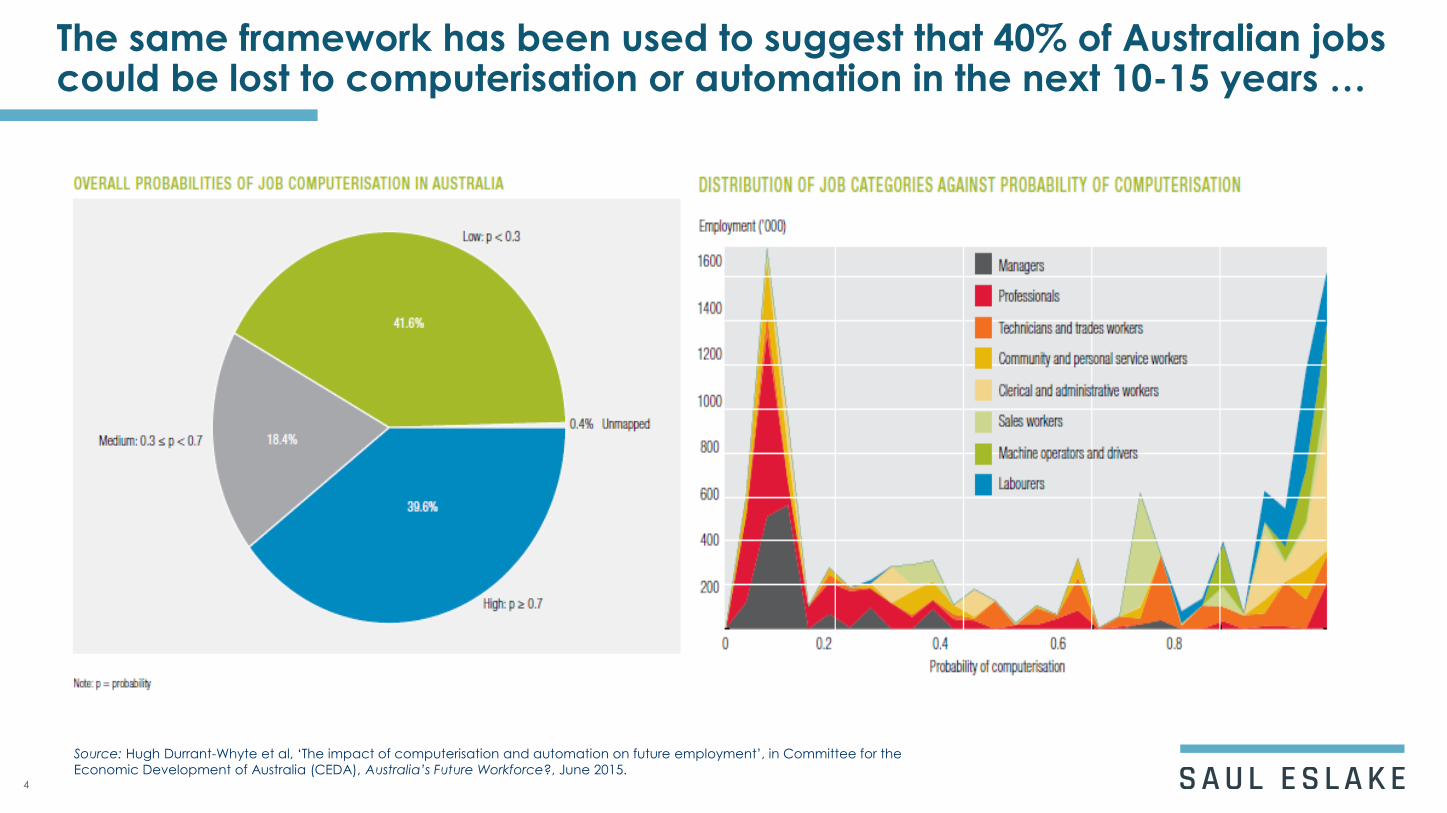
The same framework has been used to suggest that 40% of Australian jobs could be lost to computerisation or automation in the next 10-15 years …
4
Source: Hugh Durrant-Whyte et al, ‘The impact of computerisation and automation on future employment’, in Committee for the
Economic Development of Australia (CEDA), Australia’s Future Workforce?, June 2015.
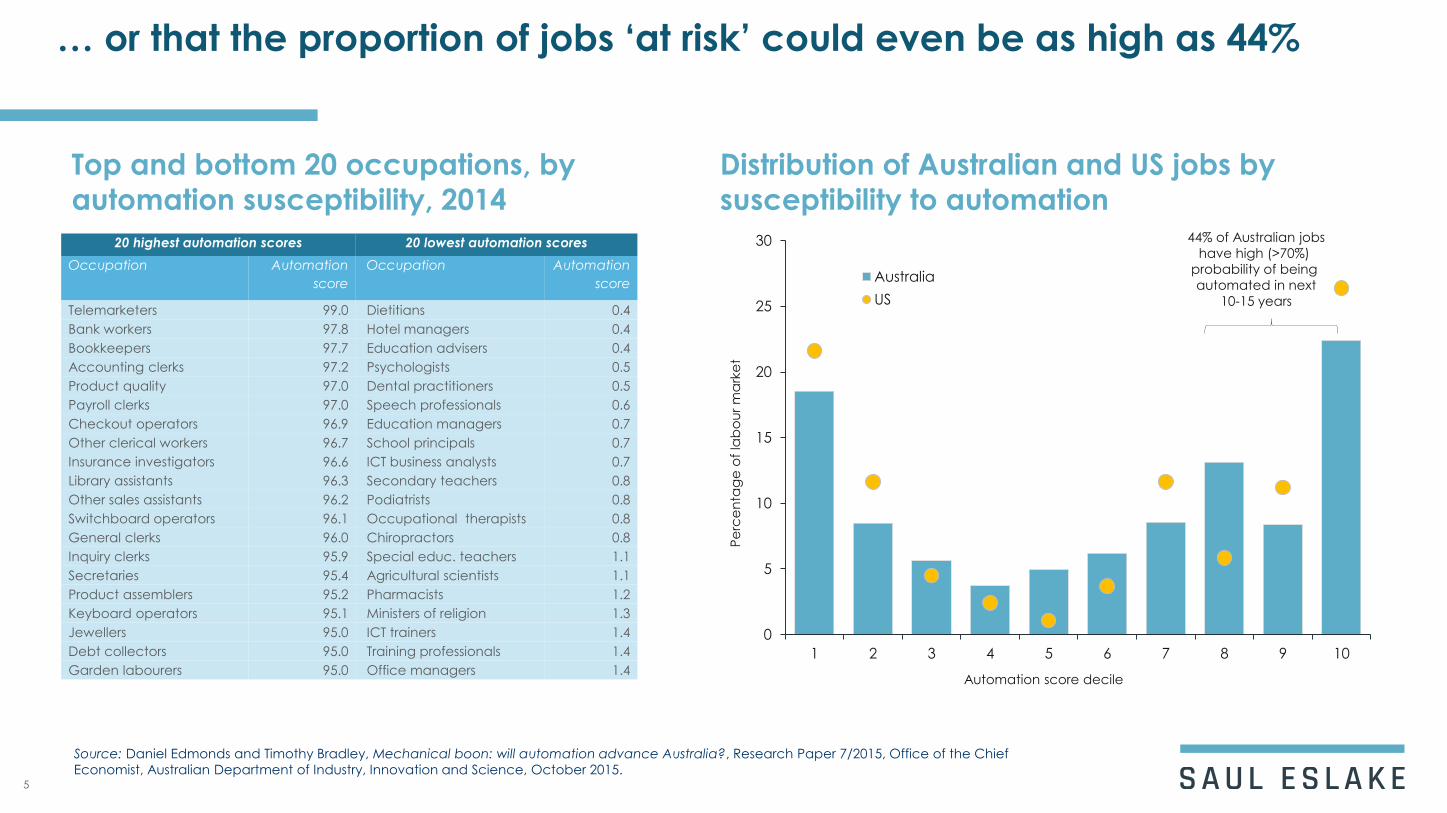
… or that the proportion of jobs ‘at risk’ could even be as high as 44%
5
Source: Daniel Edmonds and Timothy Bradley, Mechanical boon: will automation advance Australia?, Research Paper 7/2015, Office of the Chief
Economist, Australian Department of Industry, Innovation and Science, October 2015.
20 highest automation scores 20 lowest automation scores
Occupation Automation
score
Occupation Automation
score
Telemarketers 99.0 Dietitians 0.4
Bank workers 97.8 Hotel managers 0.4
Bookkeepers 97.7 Education advisers 0.4
Accounting clerks 97.2 Psychologists 0.5
Product quality 97.0 Dental practitioners 0.5
Payroll clerks 97.0 Speech professionals 0.6
Checkout operators 96.9 Education managers 0.7
Other clerical workers 96.7 School principals 0.7
Insurance investigators 96.6 ICT business analysts 0.7
Library assistants 96.3 Secondary teachers 0.8
Other sales assistants 96.2 Podiatrists 0.8
Switchboard operators 96.1 Occupational therapists 0.8
General clerks 96.0 Chiropractors 0.8
Inquiry clerks 95.9 Special educ. teachers 1.1
Secretaries 95.4 Agricultural scientists 1.1
Product assemblers 95.2 Pharmacists 1.2
Keyboard operators 95.1 Ministers of religion 1.3
Jewellers 95.0 ICT trainers 1.4
Debt collectors 95.0 Training professionals 1.4
Garden labourers 95.0 Office managers 1.4
0
5
10
15
20
25
30
1 2 3 4 5 6 7 8 9 10
Pe
rce
nta
ge
of
lab
ou
r m
ark
et
Automation score decile
Australia
US
Top and bottom 20 occupations, by
automation susceptibility, 2014
Distribution of Australian and US jobs by
susceptibility to automation 44% of Australian jobs
have high (>70%)
probability of being
automated in next
10-15 years
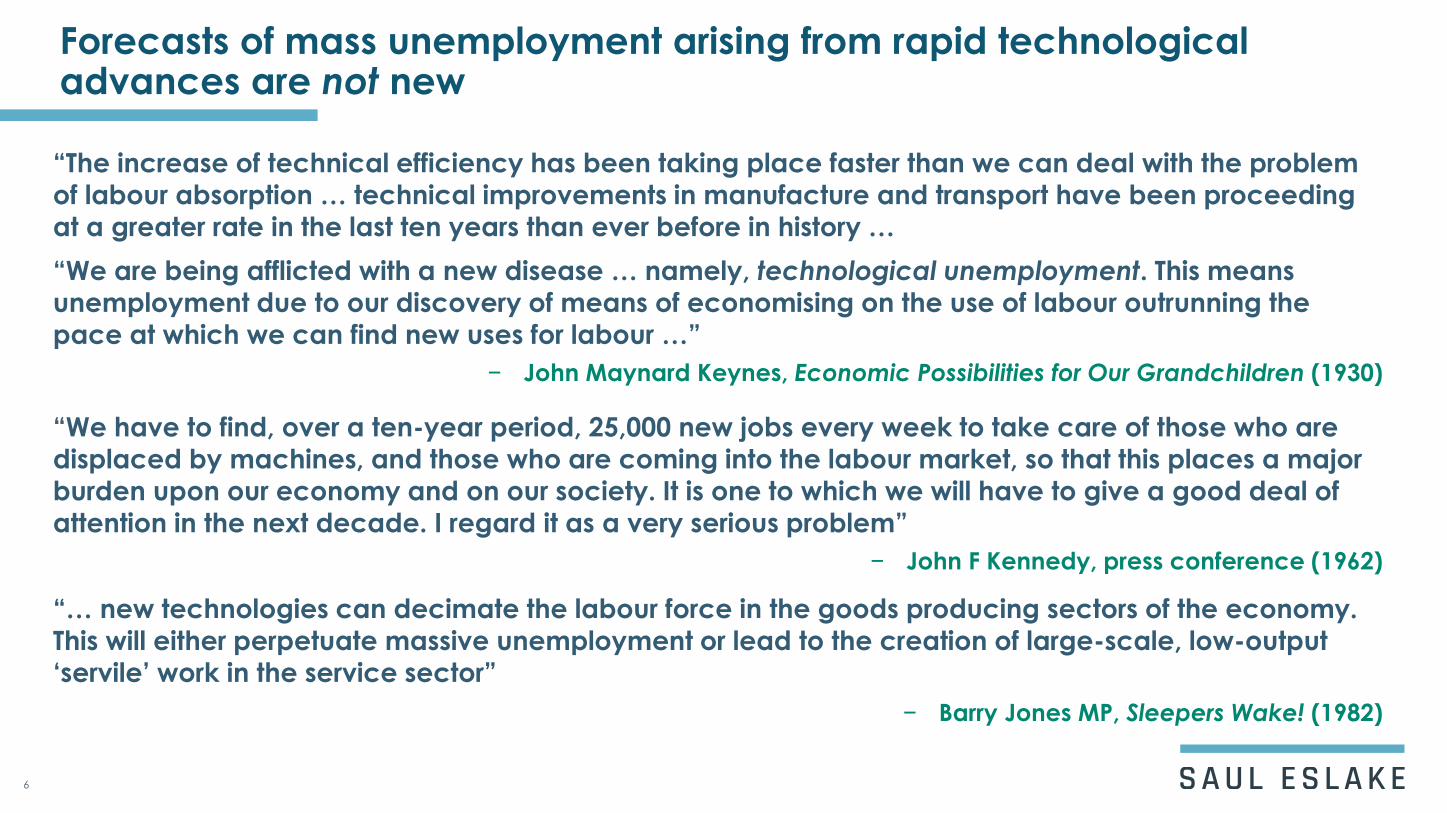
Forecasts of mass unemployment arising from rapid technological advances are not new
6
“The increase of technical efficiency has been taking place faster than we can deal with the problem
of labour absorption … technical improvements in manufacture and transport have been proceeding
at a greater rate in the last ten years than ever before in history …
“We are being afflicted with a new disease … namely, technological unemployment. This means
unemployment due to our discovery of means of economising on the use of labour outrunning the
pace at which we can find new uses for labour …”
− John Maynard Keynes, Economic Possibilities for Our Grandchildren (1930)
“We have to find, over a ten-year period, 25,000 new jobs every week to take care of those who are
displaced by machines, and those who are coming into the labour market, so that this places a major
burden upon our economy and on our society. It is one to which we will have to give a good deal of attention in the next decade. I regard it as a very serious problem”
− John F Kennedy, press conference (1962)
“… new technologies can decimate the labour force in the goods producing sectors of the economy.
This will either perpetuate massive unemployment or lead to the creation of large-scale, low-output
‘servile’ work in the service sector”
− Barry Jones MP, Sleepers Wake! (1982)
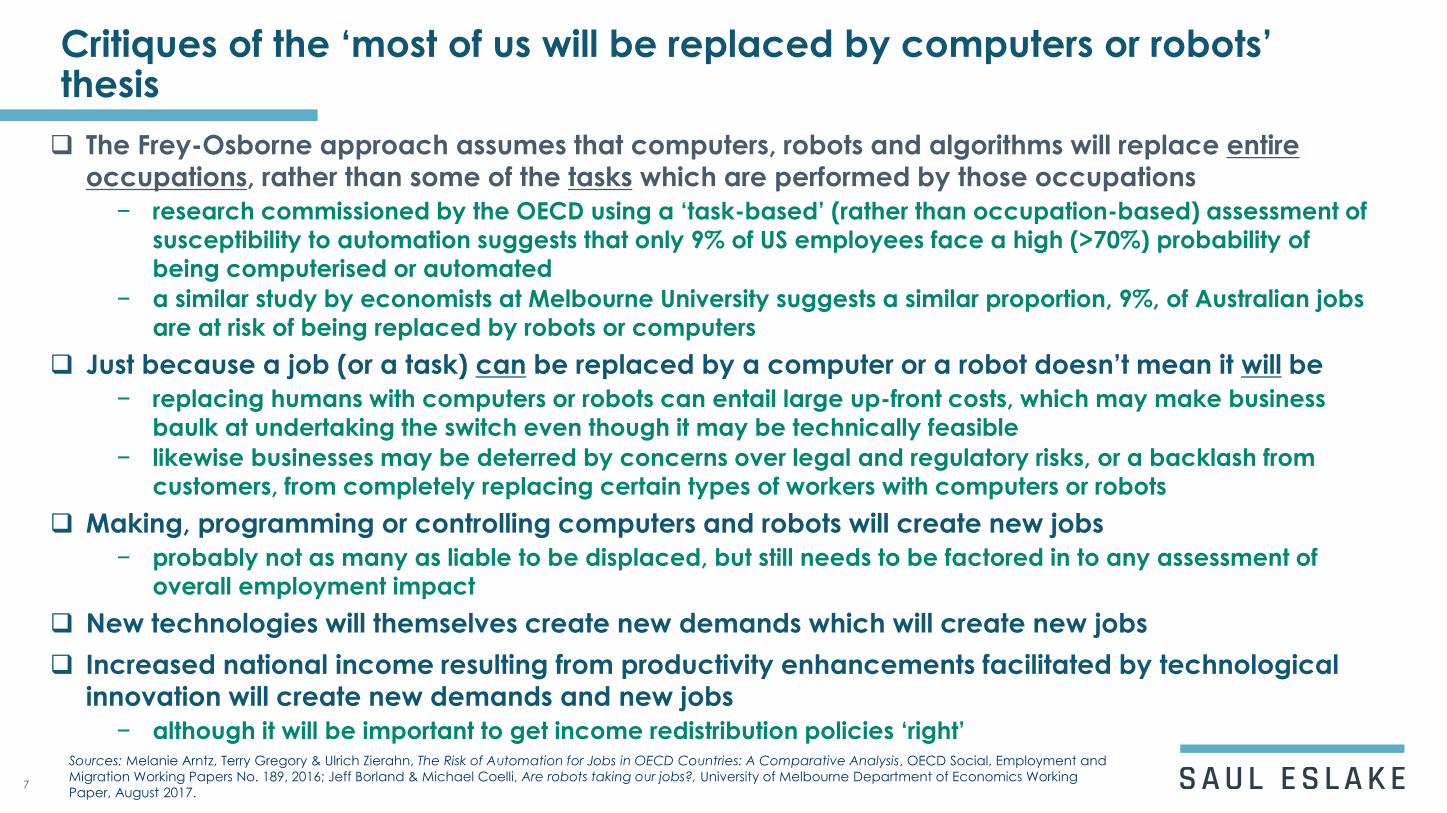
Critiques of the ‘most of us will be replaced by computers or robots’ thesis
7
The Frey-Osborne approach assumes that computers, robots and algorithms will replace entire
occupations, rather than some of the tasks which are performed by those occupations
− research commissioned by the OECD using a ‘task-based’ (rather than occupation-based) assessment of
susceptibility to automation suggests that only 9% of US employees face a high (>70%) probability of
being computerised or automated
− a similar study by economists at Melbourne University suggests a similar proportion, 9%, of Australian jobs
are at risk of being replaced by robots or computers
Just because a job (or a task) can be replaced by a computer or a robot doesn’t mean it will be
− replacing humans with computers or robots can entail large up-front costs, which may make business
baulk at undertaking the switch even though it may be technically feasible
− likewise businesses may be deterred by concerns over legal and regulatory risks, or a backlash from
customers, from completely replacing certain types of workers with computers or robots
Making, programming or controlling computers and robots will create new jobs
− probably not as many as liable to be displaced, but still needs to be factored in to any assessment of
overall employment impact
New technologies will themselves create new demands which will create new jobs
Increased national income resulting from productivity enhancements facilitated by technological
innovation will create new demands and new jobs
− although it will be important to get income redistribution policies ‘right’Sources: Melanie Arntz, Terry Gregory & Ulrich Zierahn, The Risk of Automation for Jobs in OECD Countries: A Comparative Analysis, OECD Social, Employment and
Migration Working Papers No. 189, 2016; Jeff Borland & Michael Coelli, Are robots taking our jobs?, University of Melbourne Department of Economics Working
Paper, August 2017.
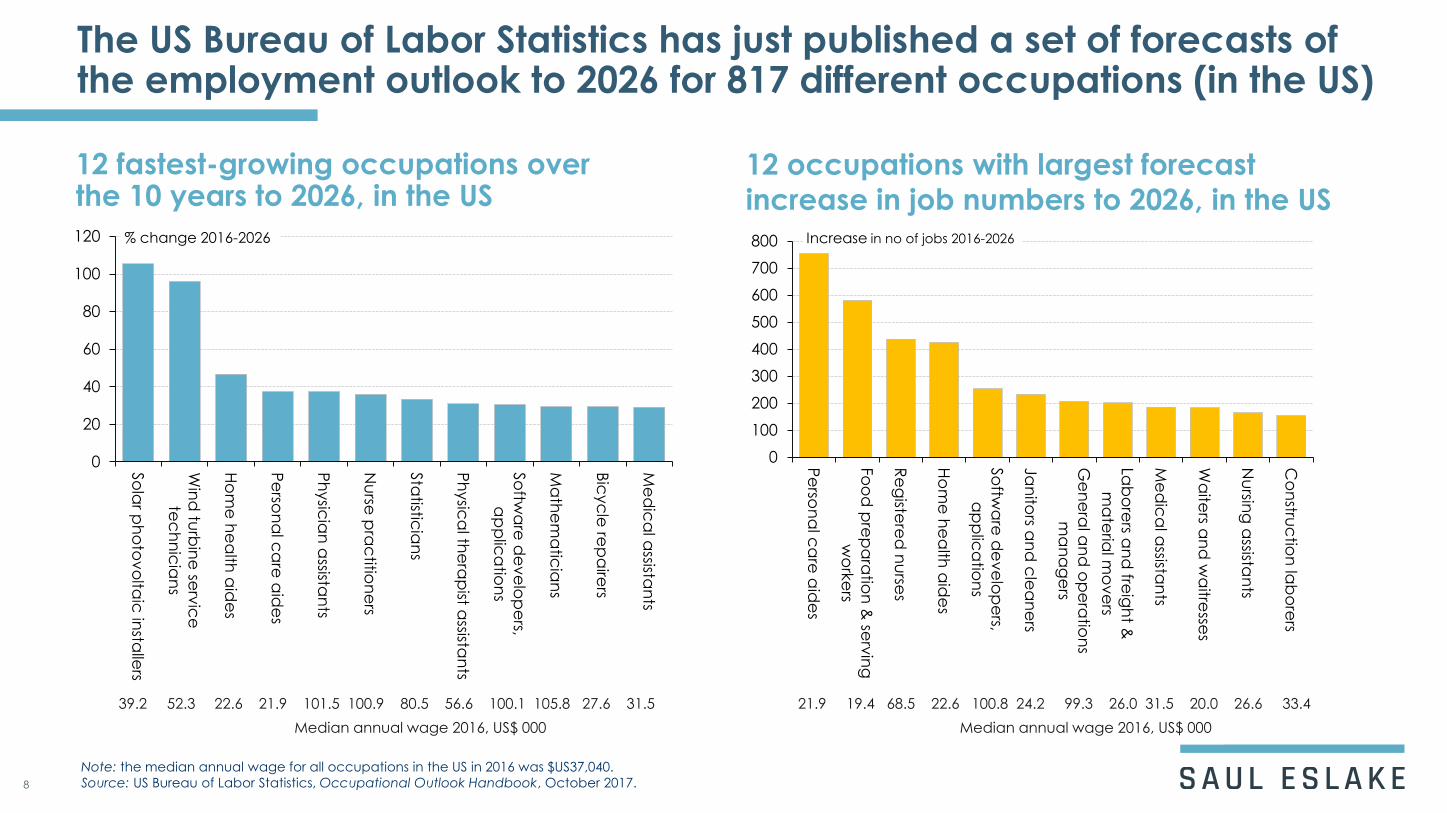
The US Bureau of Labor Statistics has just published a set of forecasts of the employment outlook to 2026 for 817 different occupations (in the US)
12 fastest-growing occupations over the 10 years to 2026, in the US
12 occupations with largest forecast
increase in job numbers to 2026, in the US
Note: the median annual wage for all occupations in the US in 2016 was $US37,040.
Source: US Bureau of Labor Statistics, Occupational Outlook Handbook, October 2017. 8
0
20
40
60
80
100
120
So
lar p
ho
tov
olta
ic in
stalle
rs
Win
d tu
rbin
e se
rvic
e
tec
hn
icia
ns
Ho
me
he
alth
aid
es
Pe
rson
al c
are
aid
es
Ph
ysic
ian
assista
nts
Nu
rse p
rac
tition
ers
Sta
tisticia
ns
Ph
ysic
al th
era
pist a
ssistan
ts
So
ftwa
re d
ev
elo
pe
rs,
ap
plic
atio
ns
Ma
the
ma
ticia
ns
Bic
yc
le re
pa
irers
Me
dic
al a
ssistan
ts
% change 2016-2026
39.2 52.3 22.6 21.9 101.5 100.9 80.5 56.6 100.1 105.8 27.6 31.5
Median annual wage 2016, US$ 000
0
100
200
300
400
500
600
700
800
Pe
rson
al c
are
aid
es
Fo
od
pre
pa
ratio
n &
serv
ing
wo
rke
rs
Re
giste
red
nu
rses
Ho
me
he
alth
aid
es
So
ftwa
re d
ev
elo
pe
rs,
ap
plic
atio
ns
Ja
nito
rs an
d c
lea
ne
rs
Ge
ne
ral a
nd
op
era
tion
s
ma
na
ge
rs
Lab
ore
rs an
d fre
igh
t &
ma
teria
l mo
ve
rs
Me
dic
al a
ssistan
ts
Wa
iters a
nd
wa
itresse
s
Nu
rsing
assista
nts
Co
nstru
ctio
n la
bo
rers
Increase in no of jobs 2016-2026
21.9 19.4 68.5 22.6 100.8 24.2 99.3 26.0 31.5 20.0 26.6 33.4
Median annual wage 2016, US$ 000

The US Bureau of Labor Statistics has just published a set of forecasts of the employment outlook to 2026 for 817 different occupations (in the US)
12 fastest-declining occupations over the 10 years to 2026, in the US
12 occupations with largest forecast
decline in job numbers to 2026, in the US
Note: the median annual wage for all occupations in the US in 2016 was $US37,040.
Source: US Bureau of Labor Statistics, Occupational Outlook Handbook, October 2017. 9
58.2 49.8 38.0 38.7 36.7 32.2 34.8 36.2 42.3 37.0 56.5 33.4
Median annual wage 2016, US$ 000
-90
-80
-70
-60
-50
-40
-30
-20
-10
0
Loc
om
otiv
e fire
rs
Re
spira
tory
the
rap
y
tec
hn
icia
ns
Pa
rkin
g e
nfo
rce
me
nt
wo
rke
rs
Wo
rd p
roc
esso
rs & ty
pists
Wa
tch
rep
aire
rs
MV
ele
ctro
nic
eq
uip
me
nt
insta
llers &
rep
aire
rs
Fo
un
dry
mo
uld
&
co
rem
ake
rs
Me
tal p
ou
rrs & c
aste
rs
Co
mp
ute
r op
era
tors
Tele
ph
on
e o
pe
rato
rs
Min
e sh
uttle
ca
r op
era
tors
Ele
ctro
me
ch
an
ica
l
eq
uip
me
nt a
ssem
ble
rs
% change 2016-2026
34.8 30.1 55.9 36.8 31.3 30.1 27.3 58.1 44.2 42.8 28.9 30.6
Median annual wage 2016, US$ 000
-180
-160
-140
-120
-100
-80
-60
-40
-20
0
Se
cre
tarie
s & a
dm
in a
sstnts
(exc
leg
al, m
ed
ica
l & e
xe
c)
Tea
m a
ssem
ble
rs
Exe
cu
tive
sec
reta
ries &
exe
cu
tive
ad
min
assista
nts
Insp
ec
tors, te
sters, so
rters,
sam
ple
rs, an
d w
eig
he
rs
Ele
ctric
al &
ele
ctro
nic
eq
uip
me
nt a
ssem
ble
rs
Da
ta e
ntry
ke
ye
rs
Telle
rs
Po
stal se
rvic
e m
ail c
arrie
rs
Leg
al se
cre
tarie
s
Co
rrec
tion
al o
ffice
rs & ja
ilers
Asse
mb
lers &
fab
rica
tors
Ge
ne
ral o
ffice
cle
rks
Decrease in no of jobs 2016-2026
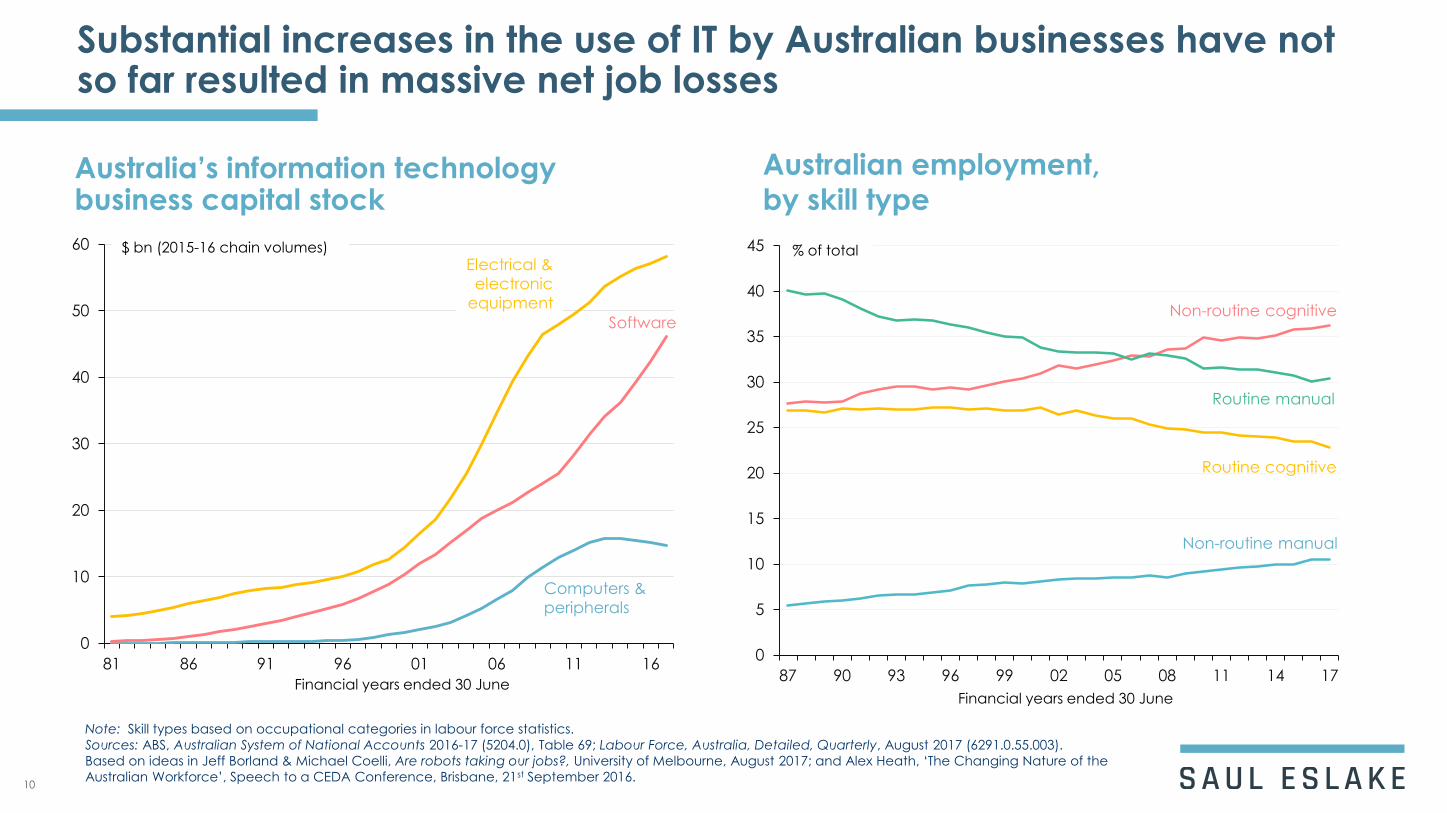
Substantial increases in the use of IT by Australian businesses have not so far resulted in massive net job losses
Australia’s information technology business capital stock
Australian employment,
by skill type
Note: Skill types based on occupational categories in labour force statistics.
Sources: ABS, Australian System of National Accounts 2016-17 (5204.0), Table 69; Labour Force, Australia, Detailed, Quarterly, August 2017 (6291.0.55.003).
Based on ideas in Jeff Borland & Michael Coelli, Are robots taking our jobs?, University of Melbourne, August 2017; and Alex Heath, ‘The Changing Nature of the
Australian Workforce’, Speech to a CEDA Conference, Brisbane, 21st September 2016. 10
0
5
10
15
20
25
30
35
40
45
87 90 93 96 99 02 05 08 11 14 17
% of total
Non-routine cognitive
Non-routine manual
Routine cognitive
Routine manual
Financial years ended 30 June
0
10
20
30
40
50
60
81 86 91 96 01 06 11 16
$ bn (2015-16 chain volumes)
Financial years ended 30 June
Computers &
peripherals
Software
Electrical &
electronic
equipment
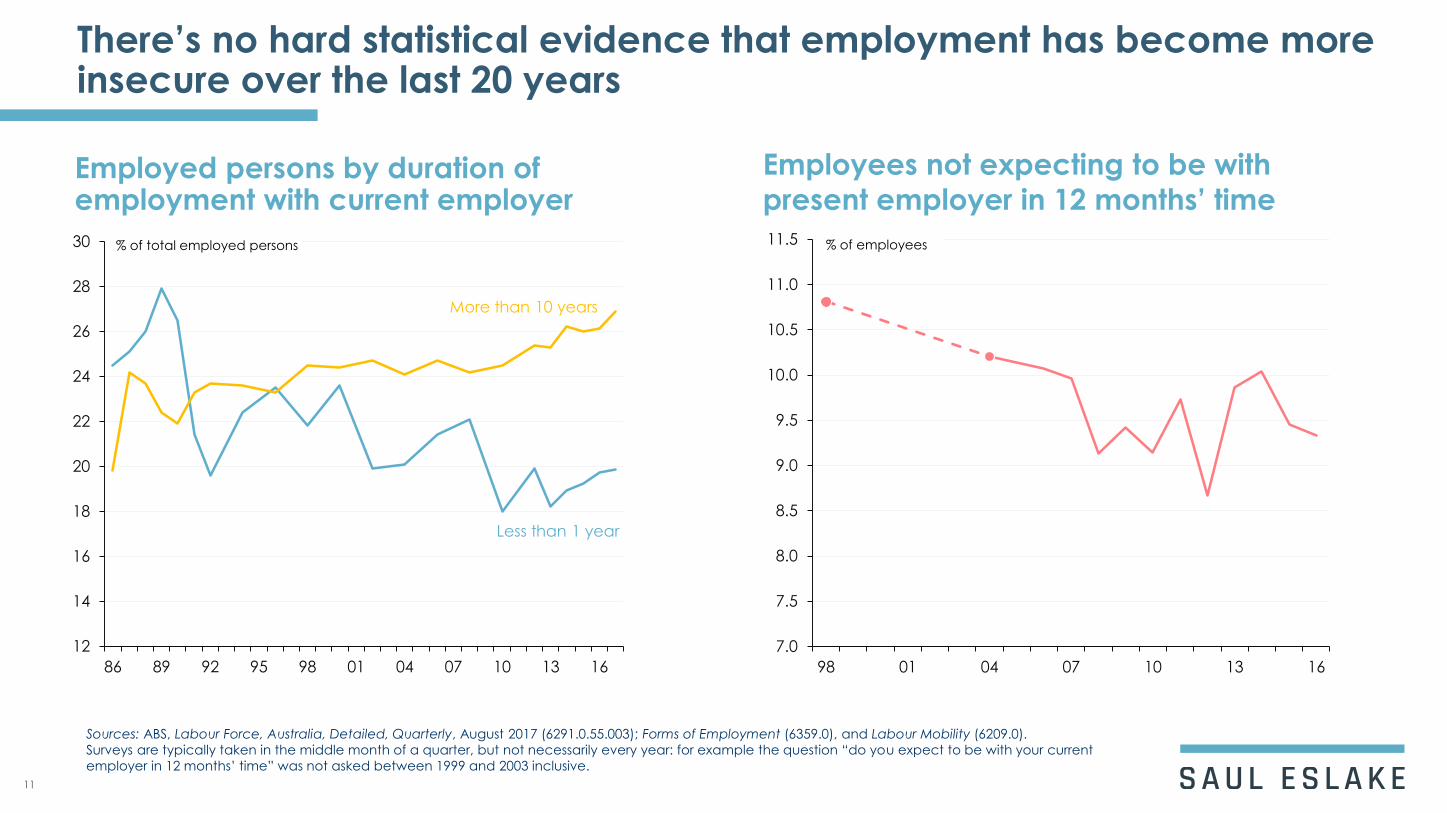
There’s no hard statistical evidence that employment has become more insecure over the last 20 years
Employed persons by duration of employment with current employer
Employees not expecting to be with
present employer in 12 months’ time
Sources: ABS, Labour Force, Australia, Detailed, Quarterly, August 2017 (6291.0.55.003); Forms of Employment (6359.0), and Labour Mobility (6209.0).
Surveys are typically taken in the middle month of a quarter, but not necessarily every year: for example the question “do you expect to be with your current
employer in 12 months’ time” was not asked between 1999 and 2003 inclusive.
11
12
14
16
18
20
22
24
26
28
30
86 89 92 95 98 01 04 07 10 13 16
% of total employed persons
Less than 1 year
More than 10 years
7.0
7.5
8.0
8.5
9.0
9.5
10.0
10.5
11.0
11.5
98 01 04 07 10 13 16
% of employees

Casual employment is becoming more commonplace, but not as dramatically as is widely believed
Employees with and without paid leave entitlements
Employees with paid leave entitlements,
by gender
Note: The ABS uses 'employees without paid leave entitlements' as the primary measure of casual employment. This is an objective measure that can be collected
consistently. An employee with paid leave entitlements has access to either paid holiday leave or paid sick leave, or both. Sources: ABS, Characteristics of
Employment, August 2016 (6333.0) and Australian Labour Market Statistics, July 2013 (6105.0). Surveys are in either August or November of each year. 12
20
21
22
23
24
25
26
27
73
74
75
76
77
78
79
92 95 98 01 04 07 10 13 16
% of total
With paid leave
(left scale)
Without paid leave
(right scale)
68
70
72
74
76
78
80
82
84
86
88
92 95 98 01 04 07 10 13 16
% of total
Females
Males
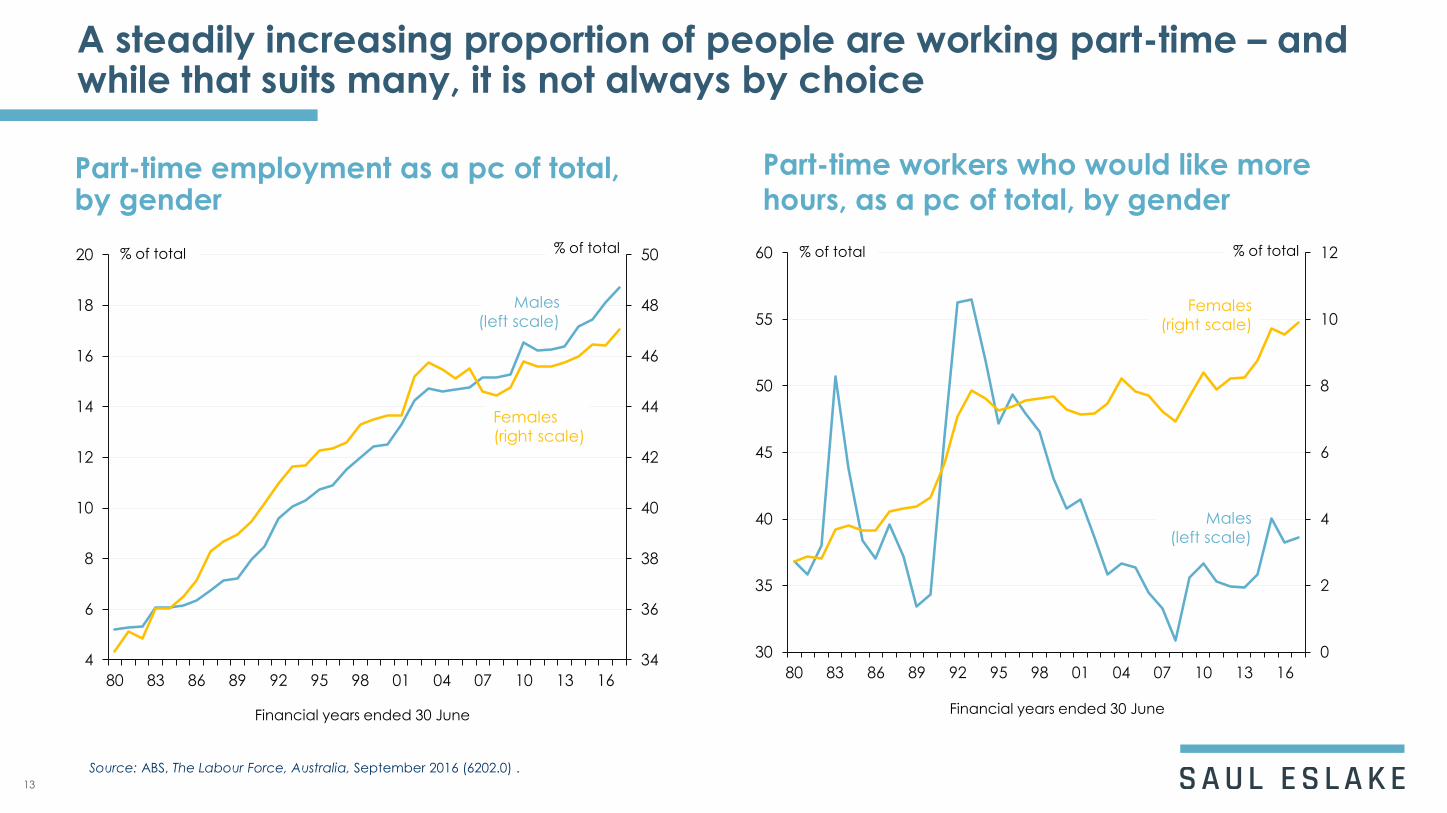
A steadily increasing proportion of people are working part-time – and while that suits many, it is not always by choice
Part-time employment as a pc of total, by gender
Part-time workers who would like more
hours, as a pc of total, by gender
Source: ABS, The Labour Force, Australia, September 2016 (6202.0) .
13
34
36
38
40
42
44
46
48
50
4
6
8
10
12
14
16
18
20
80 83 86 89 92 95 98 01 04 07 10 13 16
% of total
Males
(left scale)
Females
(right scale)
% of total
Financial years ended 30 June
0
2
4
6
8
10
12
30
35
40
45
50
55
60
80 83 86 89 92 95 98 01 04 07 10 13 16
% of total
Males
(left scale)
Females
(right scale)
% of total
Financial years ended 30 June

There is thus more ‘spare capacity’ in the labour market than suggested by the conventional unemployment rate
‘Heads-based’ alternative measures of ‘spare capacity’ in the labour market
‘Hours-based’ alternative measures of
‘spare capacity’ in the labour market
Sources: ABS, The Labour Force, Australia, September 2016 (6202.0)14
0
2
4
6
8
10
12
14
16
18
20
80 83 86 89 92 95 98 01 04 07 10 13 16
% of the labour force
'Under-utilization' rate
Unemployment rate
'Under-
employment'
rate
Note: The ‘under-employment’ rate is the number of people working part-time who are willing and able to work more hours (including those who normally work full-
time but are working part-time for ‘economic reasons’) as a percentage of the labour force. The ‘under-utilization’ rate is the number of unemployed and under-
employed as a percentage of the labour force. The ‘heads-based’ measures take no account of the number of additional hours ‘under-employed’ people would
like to work, nor of whether they have been ‘actively looking’ for additional hours (as is required of people not working in order to be counted as ‘unemployed’.
; Reserve Bank of Australia, Statement on Monetary Policy, February 2017, Box B.
0
1
2
3
4
5
6
7
8
9
04 05 06 07 08 09 10 11 12 13 14 15 16
'Under-utilization' rate
Unemployment rate
'Under-employment‘ rate
% of the labour force
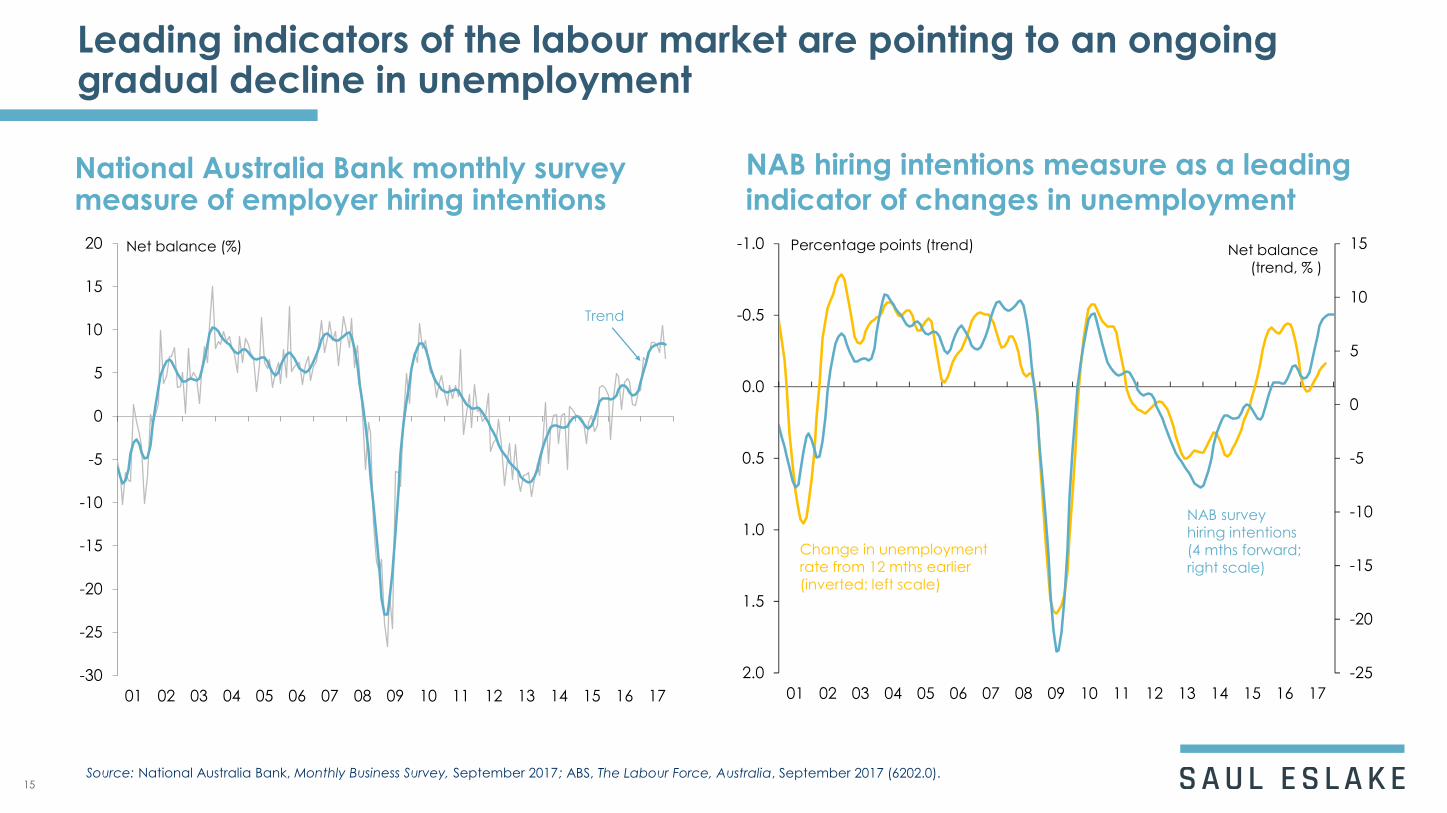
Leading indicators of the labour market are pointing to an ongoing gradual decline in unemployment
National Australia Bank monthly survey measure of employer hiring intentions
NAB hiring intentions measure as a leading
indicator of changes in unemployment
Source: National Australia Bank, Monthly Business Survey, September 201715
; ABS, The Labour Force, Australia, September 2017 (6202.0).
-30
-25
-20
-15
-10
-5
0
5
10
15
20
01 02 03 04 05 06 07 08 09 10 11 12 13 14 15 16 17
Net balance (%)
Trend
-25
-20
-15
-10
-5
0
5
10
15-1.0
-0.5
0.0
0.5
1.0
1.5
2.0
01 02 03 04 05 06 07 08 09 10 11 12 13 14 15 16 17
Percentage points (trend)
Change in unemploymentrate from 12 mths earlier(inverted; left scale)
NAB surveyhiring intentions(4 mths forward;right scale)
Net balance (trend, % )
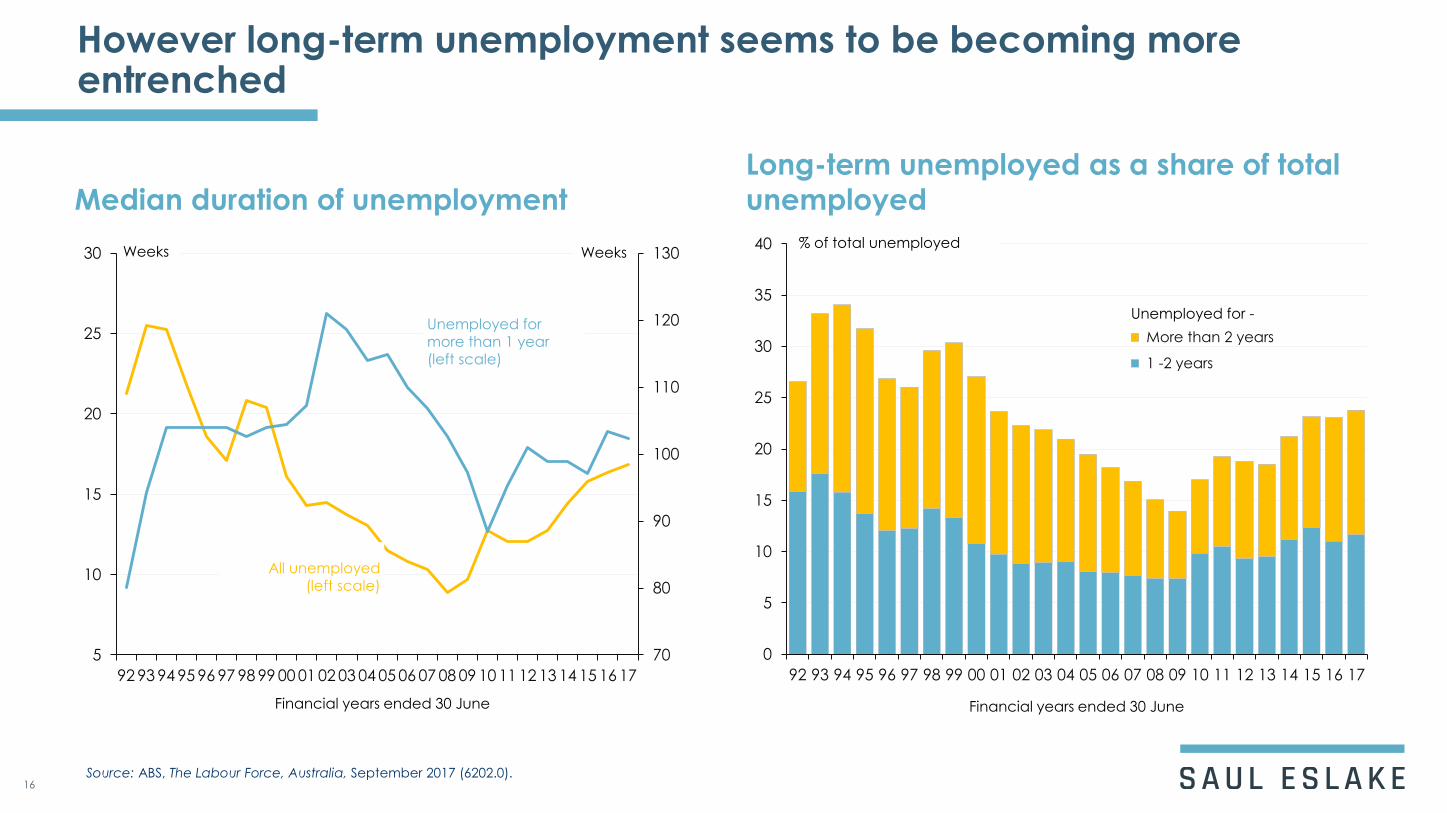
However long-term unemployment seems to be becoming more entrenched
Median duration of unemployment
Long-term unemployed as a share of total
unemployed
Source: ABS, The Labour Force, Australia, September 2017 (6202.0).16
70
80
90
100
110
120
130
5
10
15
20
25
30
92 93 94 95 96 97 98 99 00 01 02 03 04 05 06 07 08 09 10 11 12 13 14 15 16 17
Weeks
All unemployed(left scale)
Financial years ended 30 June
Weeks
Unemployed for more than 1 year(left scale)
0
5
10
15
20
25
30
35
40
92 93 94 95 96 97 98 99 00 01 02 03 04 05 06 07 08 09 10 11 12 13 14 15 16 17
More than 2 years
1 -2 years
% of total unemployed
Financial years ended 30 June
Unemployed for -
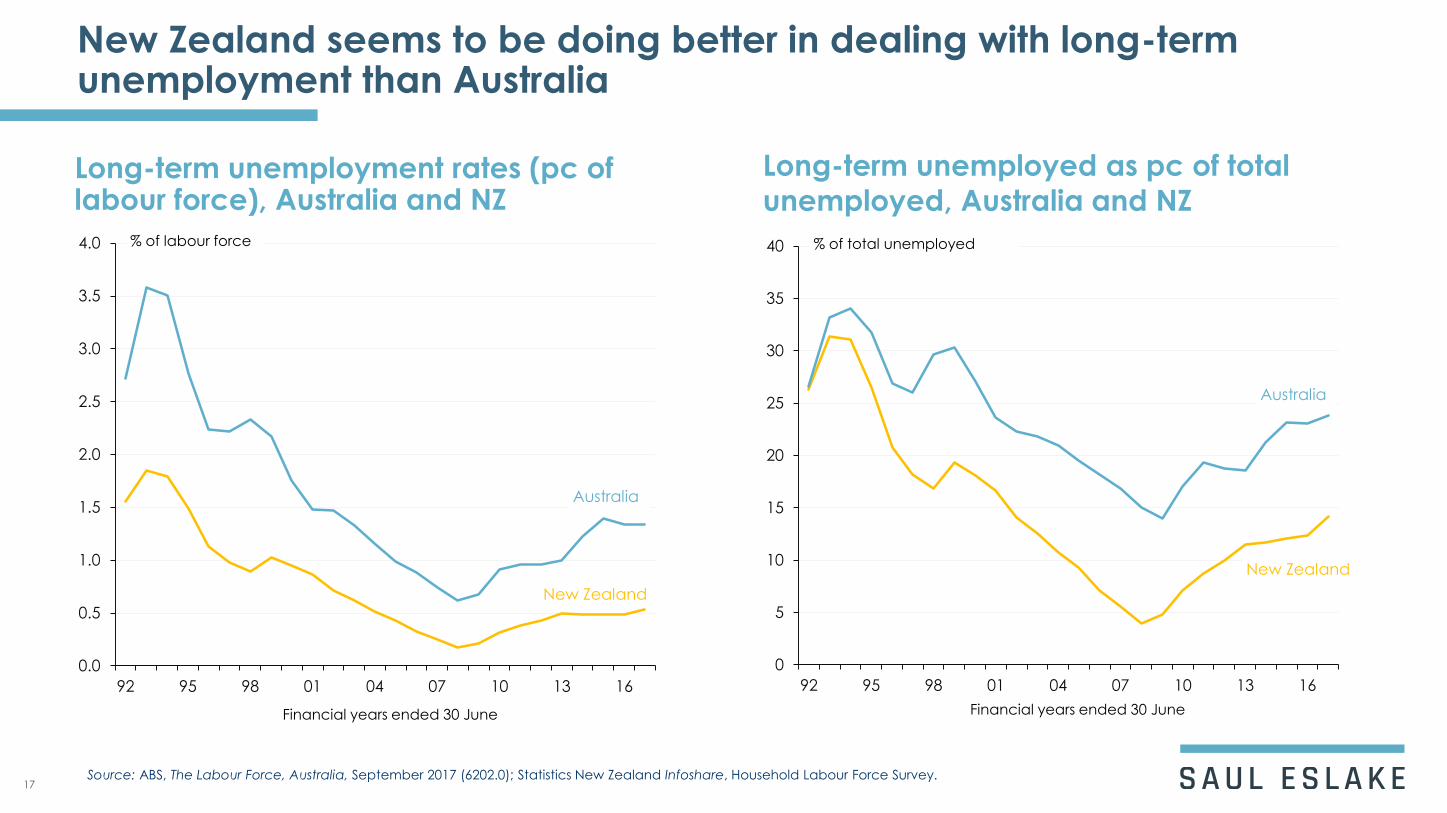
New Zealand seems to be doing better in dealing with long-term unemployment than Australia
Long-term unemployment rates (pc of labour force), Australia and NZ
Long-term unemployed as pc of total
unemployed, Australia and NZ
Source: ABS, The Labour Force, Australia, September 2017 (6202.0); Statistics New Zealand Infoshare, Household Labour Force Survey.17
0.0
0.5
1.0
1.5
2.0
2.5
3.0
3.5
4.0
92 95 98 01 04 07 10 13 16
% of labour force
New Zealand
Financial years ended 30 June
Australia
0
5
10
15
20
25
30
35
40
92 95 98 01 04 07 10 13 16
% of total unemployed
New Zealand
Financial years ended 30 June
Australia
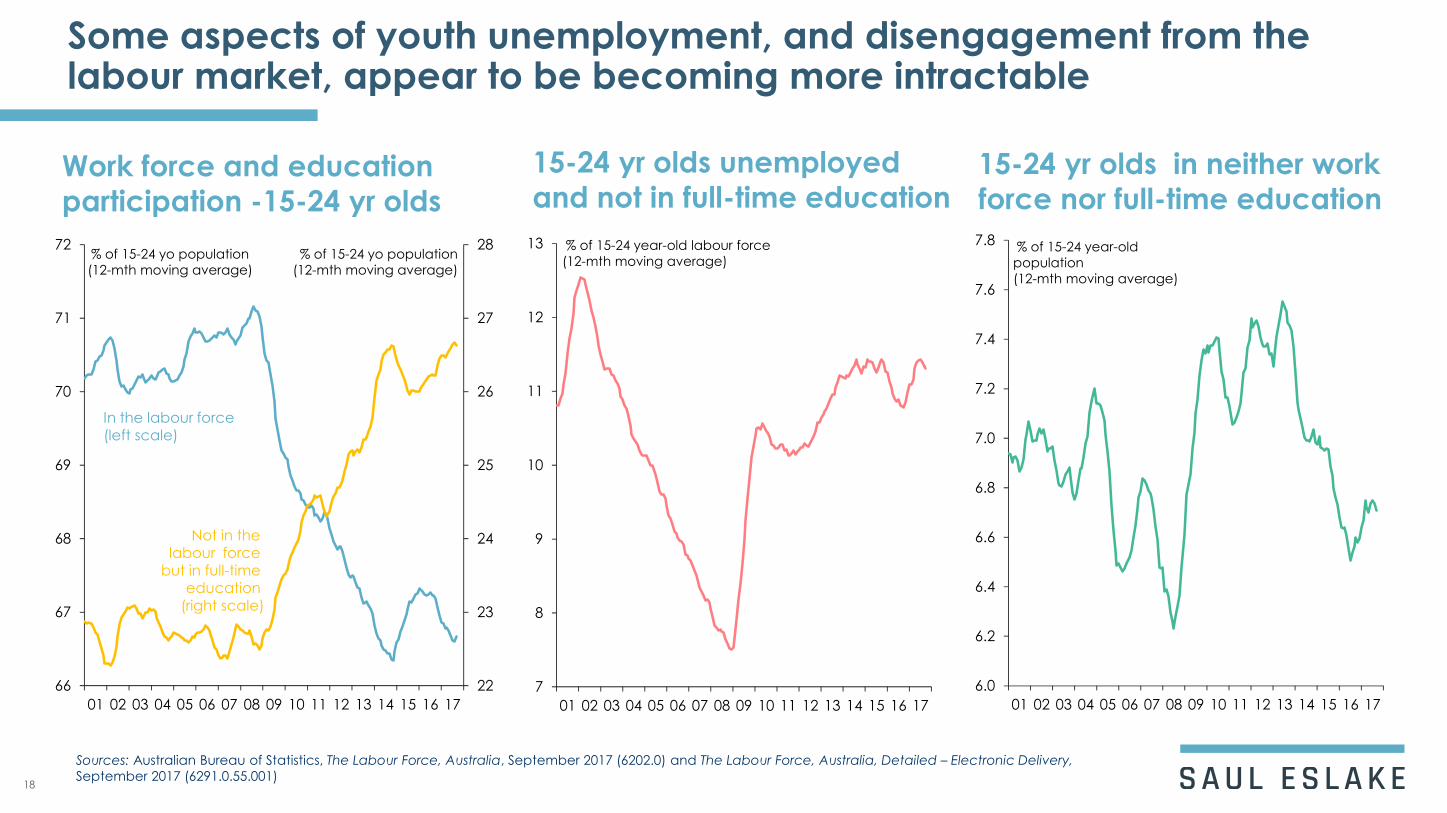
Some aspects of youth unemployment, and disengagement from the labour market, appear to be becoming more intractable
15-24 yr olds unemployed
and not in full-time education
Sources: Australian Bureau of Statistics, The Labour Force, Australia, September 2017 (6202.0) and The Labour Force, Australia, Detailed – Electronic Delivery,
September 2017 (6291.0.55.001)
15-24 yr olds in neither work
force nor full-time educationWork force and education
participation -15-24 yr olds
18
22
23
24
25
26
27
28
66
67
68
69
70
71
72
01 02 03 04 05 06 07 08 09 10 11 12 13 14 15 16 17
% of 15-24 yo population
(12-mth moving average)
In the labour force(left scale)
Not in the labour force
but in full-time education
(right scale)
% of 15-24 yo population
(12-mth moving average)
7
8
9
10
11
12
13
01 02 03 04 05 06 07 08 09 10 11 12 13 14 15 16 17
% of 15-24 year-old labour force
(12-mth moving average)
6.0
6.2
6.4
6.6
6.8
7.0
7.2
7.4
7.6
7.8
01 02 03 04 05 06 07 08 09 10 11 12 13 14 15 16 17
% of 15-24 year-old
population
(12-mth moving average)
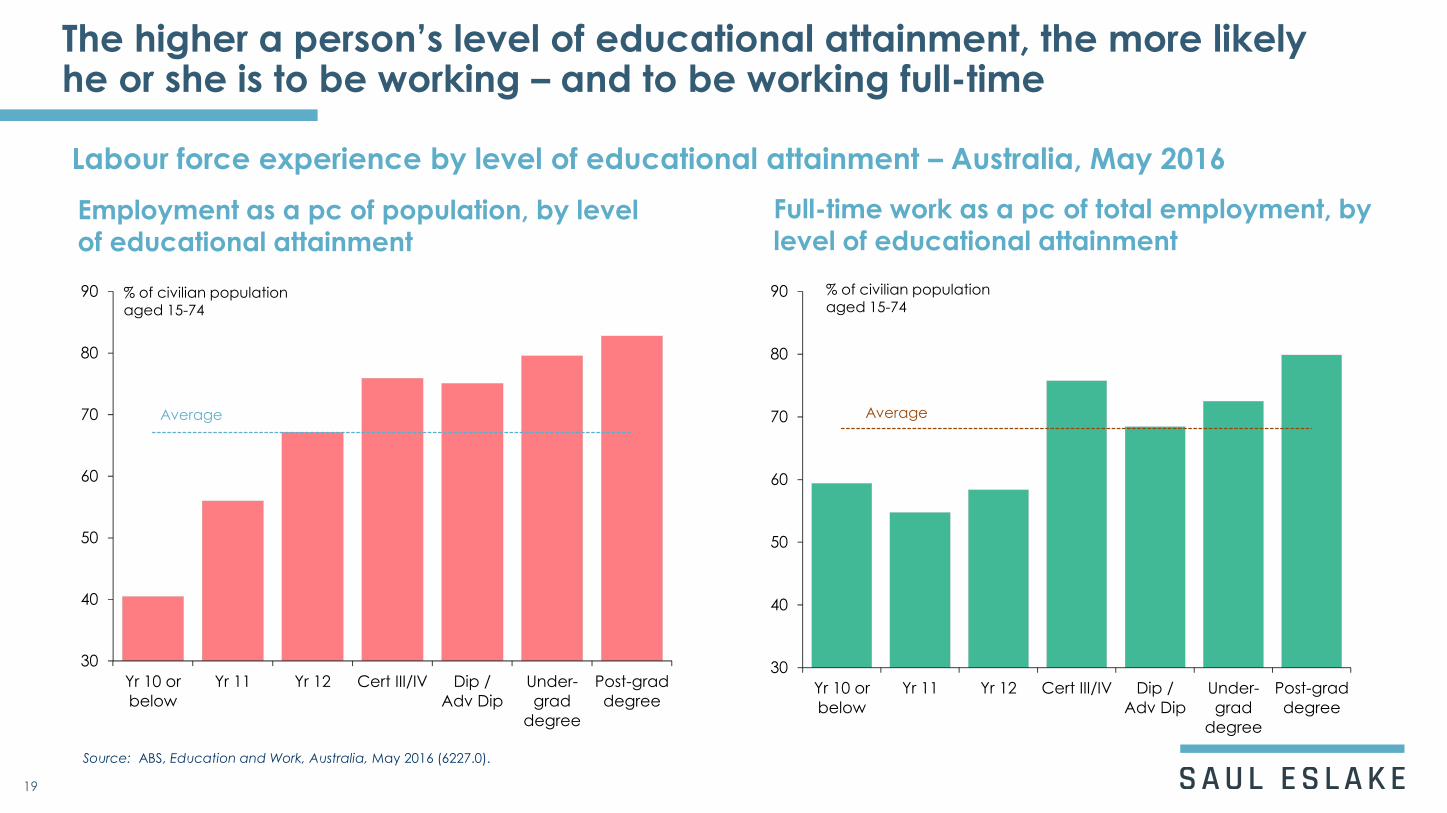
The higher a person’s level of educational attainment, the more likely he or she is to be working – and to be working full-time
Employment as a pc of population, by level
of educational attainment
Full-time work as a pc of total employment, by
level of educational attainment
Source: ABS, Education and Work, Australia, May 2016 (6227.0).
19
Labour force experience by level of educational attainment – Australia, May 2016
30
40
50
60
70
80
90
Yr 10 or
below
Yr 11 Yr 12 Cert III/IV Dip /
Adv Dip
Under-
grad
degree
Post-grad
degree
% of civilian populationaged 15-74
Average
30
40
50
60
70
80
90
Yr 10 or
below
Yr 11 Yr 12 Cert III/IV Dip /
Adv Dip
Under-
grad
degree
Post-grad
degree
% of civilian populationaged 15-74
Average
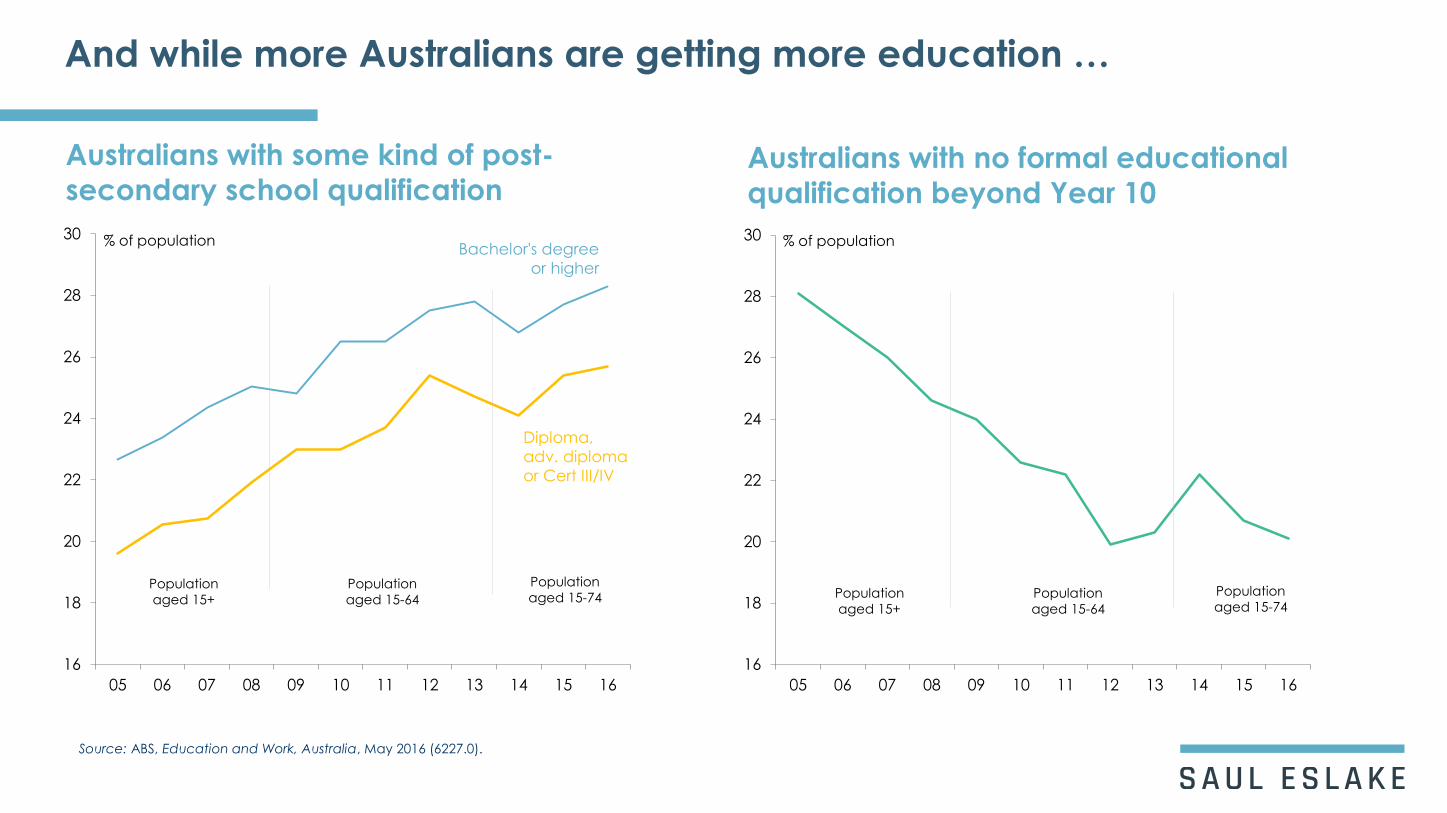
And while more Australians are getting more education …
Australians with some kind of post-
secondary school qualificationAustralians with no formal educational
qualification beyond Year 10
Source: ABS, Education and Work, Australia, May 2016 (6227.0).
16
18
20
22
24
26
28
30
05 06 07 08 09 10 11 12 13 14 15 16
% of population
Diploma,
adv. diploma
or Cert III/IV
Bachelor's degree
or higher
Population
aged 15+
Population
aged 15-64
Population
aged 15-74
16
18
20
22
24
26
28
30
05 06 07 08 09 10 11 12 13 14 15 16
% of population
Population
aged 15+
Population
aged 15-64
Population
aged 15-74
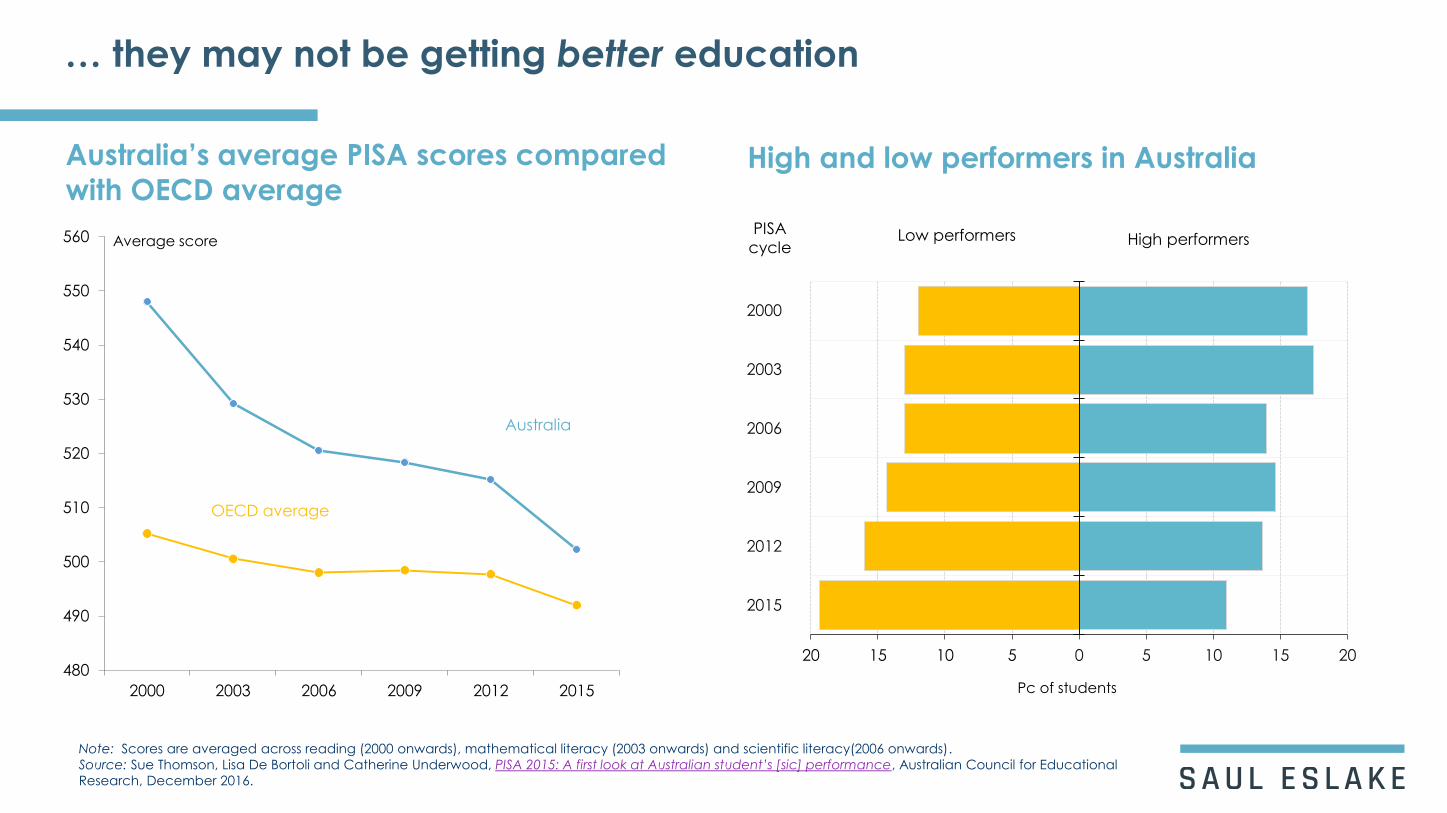
… they may not be getting better education
Australia’s average PISA scores compared
with OECD averageHigh and low performers in Australia
Note: Scores are averaged across reading (2000 onwards), mathematical literacy (2003 onwards) and scientific literacy(2006 onwards).
Source: Sue Thomson, Lisa De Bortoli and Catherine Underwood, PISA 2015: A first look at Australian student’s [sic] performance, Australian Council for Educational
Research, December 2016.
480
490
500
510
520
530
540
550
560
2000 2003 2006 2009 2012 2015
Average score
OECD average
Australia
20 15 10 5 0 5 10 15 20
2000
2003
2006
2009
2012
2015
Pc of students
PISA
cycleLow performers High performers

Wages growth is now slower than at any time since the early 1990s
Measures of growth in wages
Employment by industry, according to
average earnings
Sources: ABS, Wage Price Index, June quarter 2017 (6345.0); Average Weekly Earnings, May 2017 (6302.0)
22
0
1
2
3
4
5
6
7
8
91 92 93 94 95 96 97 98 99 00 01 02 03 04 05 06 07 08 09 10 11 12 13 14 15 16 17
% change from year earlier
Average weekly ordinary time earnings (AWOTE) - full timeadult employees (4-qtr moving average)
Wage price index (WPI)
(excl. bonuses)
75
85
95
105
115
125
135
01 02 03 04 05 06 07 08 09 10 11 12 13 14 15 16 17
Level of employmentin 2007-08 = 100
Sectors with ‘average’earnings (± 15% of all-
Industry average)
Sectors with ‘below-average’earnings (<85% of national average)
Sectors with ‘above-average’earnings (>115% of national average)
− but not because jobs growth has been concentrated in low-paying sectors
; The Labour Force, Australia, Detailed, Quarterly, August
2017 (6291.0.55.003).
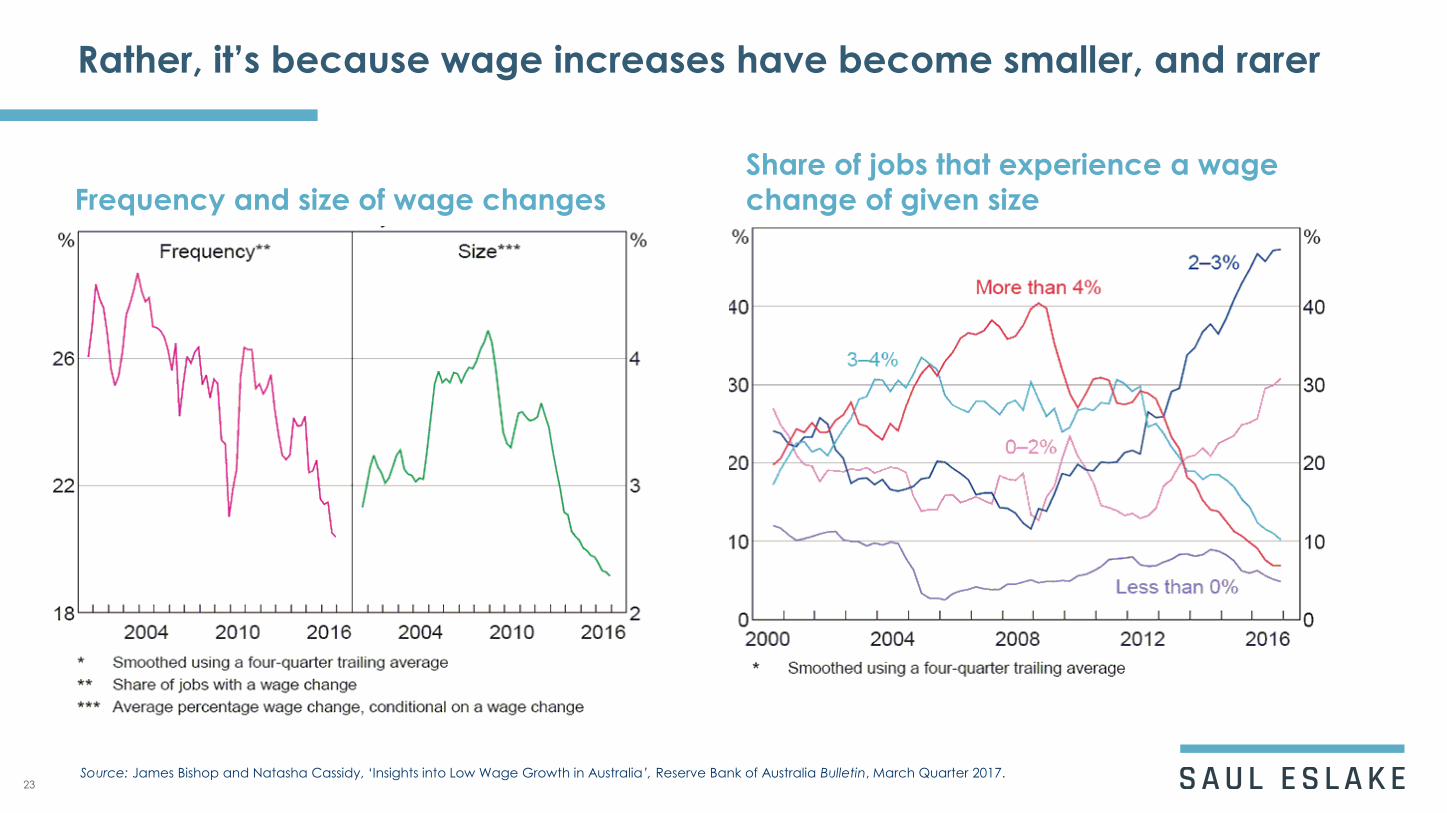
Rather, it’s because wage increases have become smaller, and rarer
Frequency and size of wage changes
Share of jobs that experience a wage
change of given size
Source: James Bishop and Natasha Cassidy, ‘Insights into Low Wage Growth in Australia’, Reserve Bank of Australia Bulletin, March Quarter 2017.23
0
0.5
1
1.5
2
2.5
3
3.5
4
4.5
4.0 5.0 6.0 7.0 8.0 9.0
Q1 1992 -
Q2 2008
Unemployment rate lagged 2 quarters
Wa
ge
s gro
wth
%
% change fromyear earlier
Q3 2008 -
Q1 2017
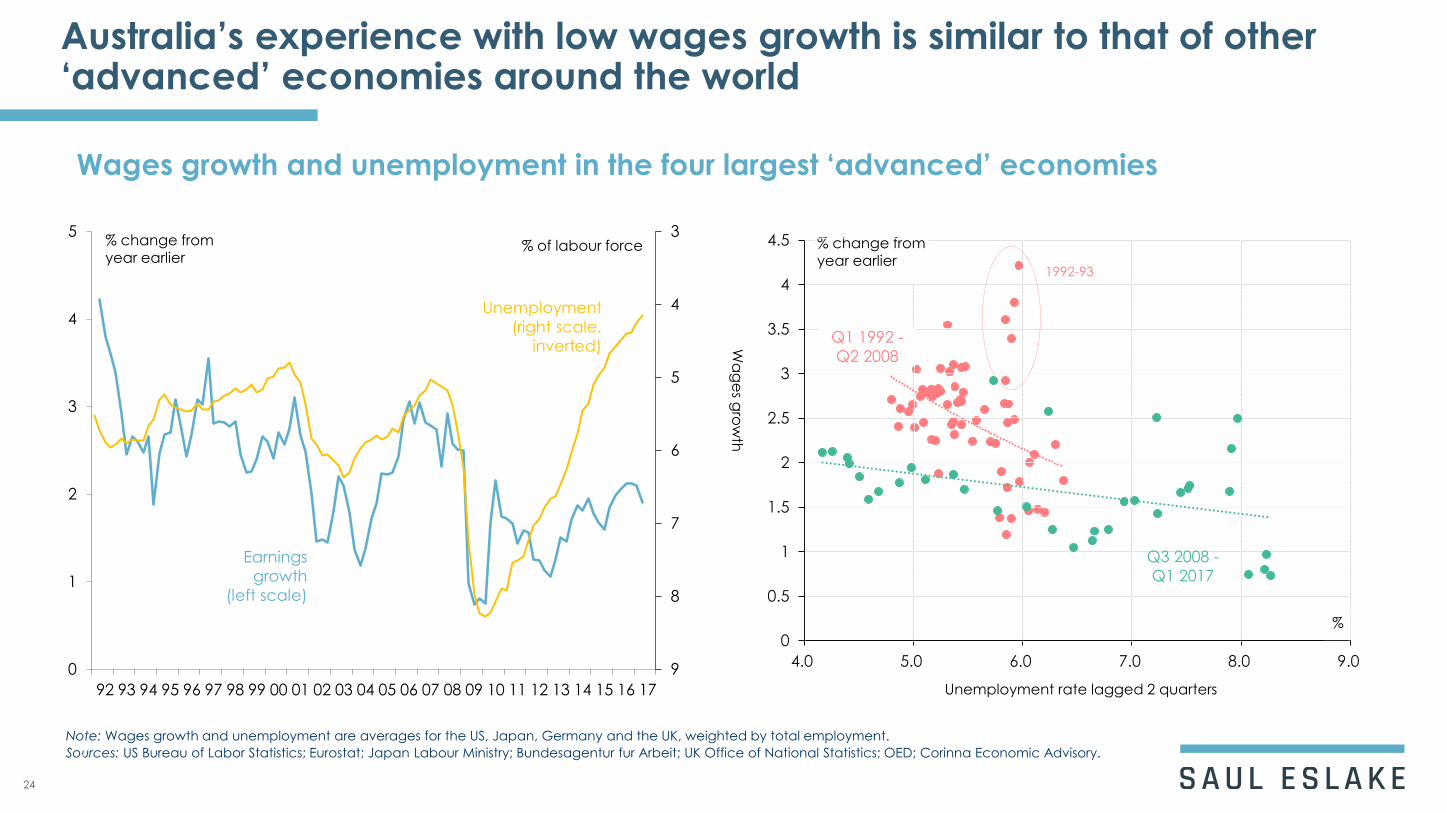
Australia’s experience with low wages growth is similar to that of other ‘advanced’ economies around the world
Wages growth and unemployment in the four largest ‘advanced’ economies
Note: Wages growth and unemployment are averages for the US, Japan, Germany and the UK, weighted by total employment.
24
Sources: US Bureau of Labor Statistics; Eurostat; Japan Labour Ministry; Bundesagentur fur Arbeit; UK Office of National Statistics; OED; Corinna Economic Advisory.
3
4
5
6
7
8
90
1
2
3
4
5
92 93 94 95 96 97 98 99 00 01 02 03 04 05 06 07 08 09 10 11 12 13 14 15 16 17
Earnings
growth
(left scale)
Unemployment
(right scale,
inverted)
% change from year earlier
% of labour force
1992-93
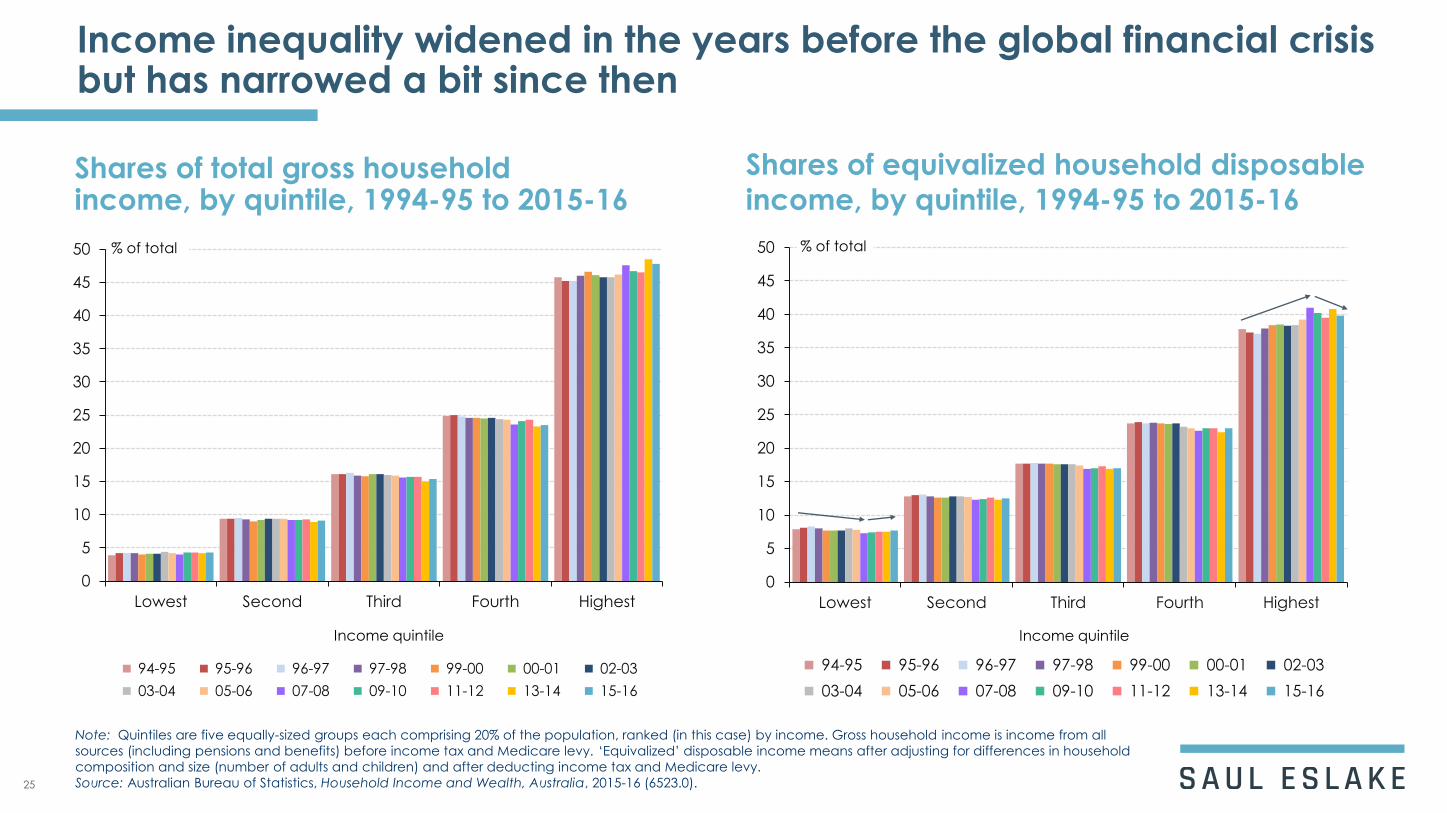
Income inequality widened in the years before the global financial crisis but has narrowed a bit since then
Shares of total gross household income, by quintile, 1994-95 to 2015-16
Shares of equivalized household disposable
income, by quintile, 1994-95 to 2015-16
Note: Quintiles are five equally-sized groups each comprising 20% of the population, ranked (in this case) by income. Gross household income is income from all
sources (including pensions and benefits) before income tax and Medicare levy.
25
0
5
10
15
20
25
30
35
40
45
50
Lowest Second Third Fourth Highest
94-95 95-96 96-97 97-98 99-00 00-01 02-03
03-04 05-06 07-08 09-10 11-12 13-14 15-16
% of total
Income quintile
0
5
10
15
20
25
30
35
40
45
50
Lowest Second Third Fourth Highest
94-95 95-96 96-97 97-98 99-00 00-01 02-03
03-04 05-06 07-08 09-10 11-12 13-14 15-16
% of total
Income quintile
‘Equivalized’ disposable income means after adjusting for differences in household
composition and size (number of adults and children) and after deducting income tax and Medicare levy.
Source: Australian Bureau of Statistics, Household Income and Wealth, Australia, 2015-16 (6523.0).
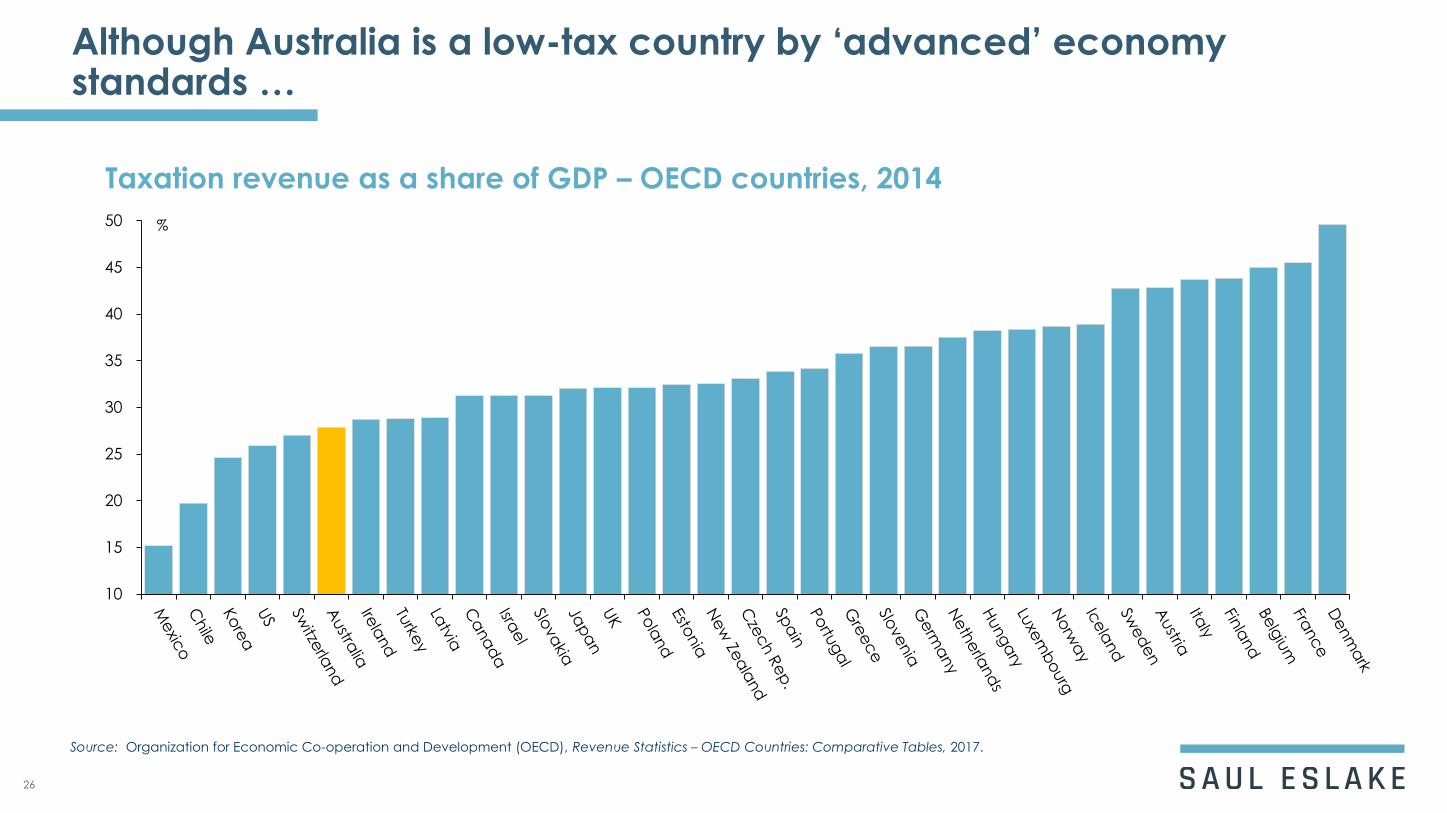
Although Australia is a low-tax country by ‘advanced’ economy standards …
Source: Organization for Economic Co-operation and Development (OECD), Revenue Statistics – OECD Countries: Comparative Tables, 2017.
Taxation revenue as a share of GDP – OECD countries, 2014
26
10
15
20
25
30
35
40
45
50 %
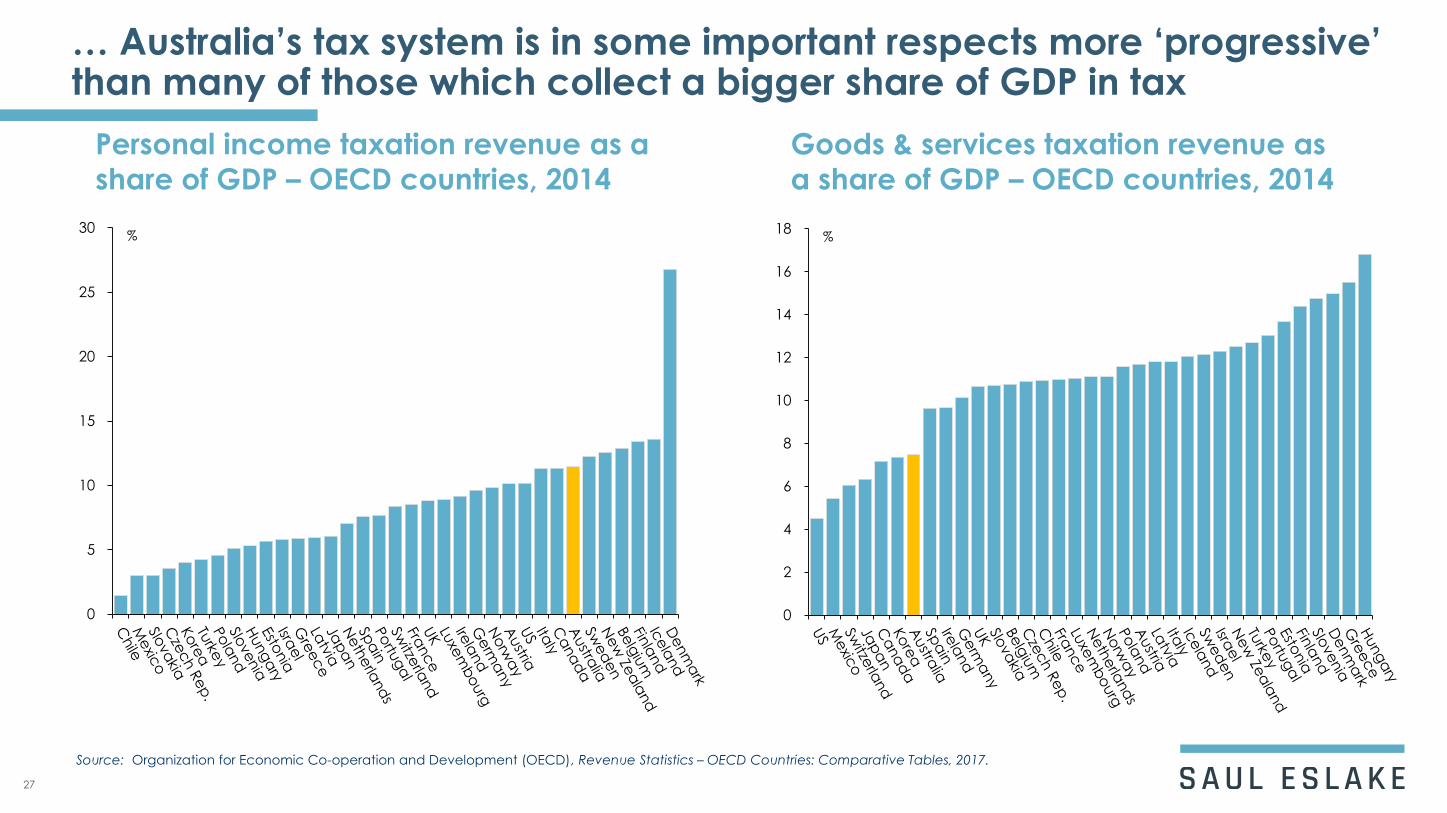
… Australia’s tax system is in some important respects more ‘progressive’ than many of those which collect a bigger share of GDP in tax
Source: Organization for Economic Co-operation and Development (OECD), Revenue Statistics – OECD Countries: Comparative Tables, 2017.
Personal income taxation revenue as a
share of GDP – OECD countries, 2014
27
0
5
10
15
20
25
30%
Goods & services taxation revenue as
a share of GDP – OECD countries, 2014
0
2
4
6
8
10
12
14
16
18%
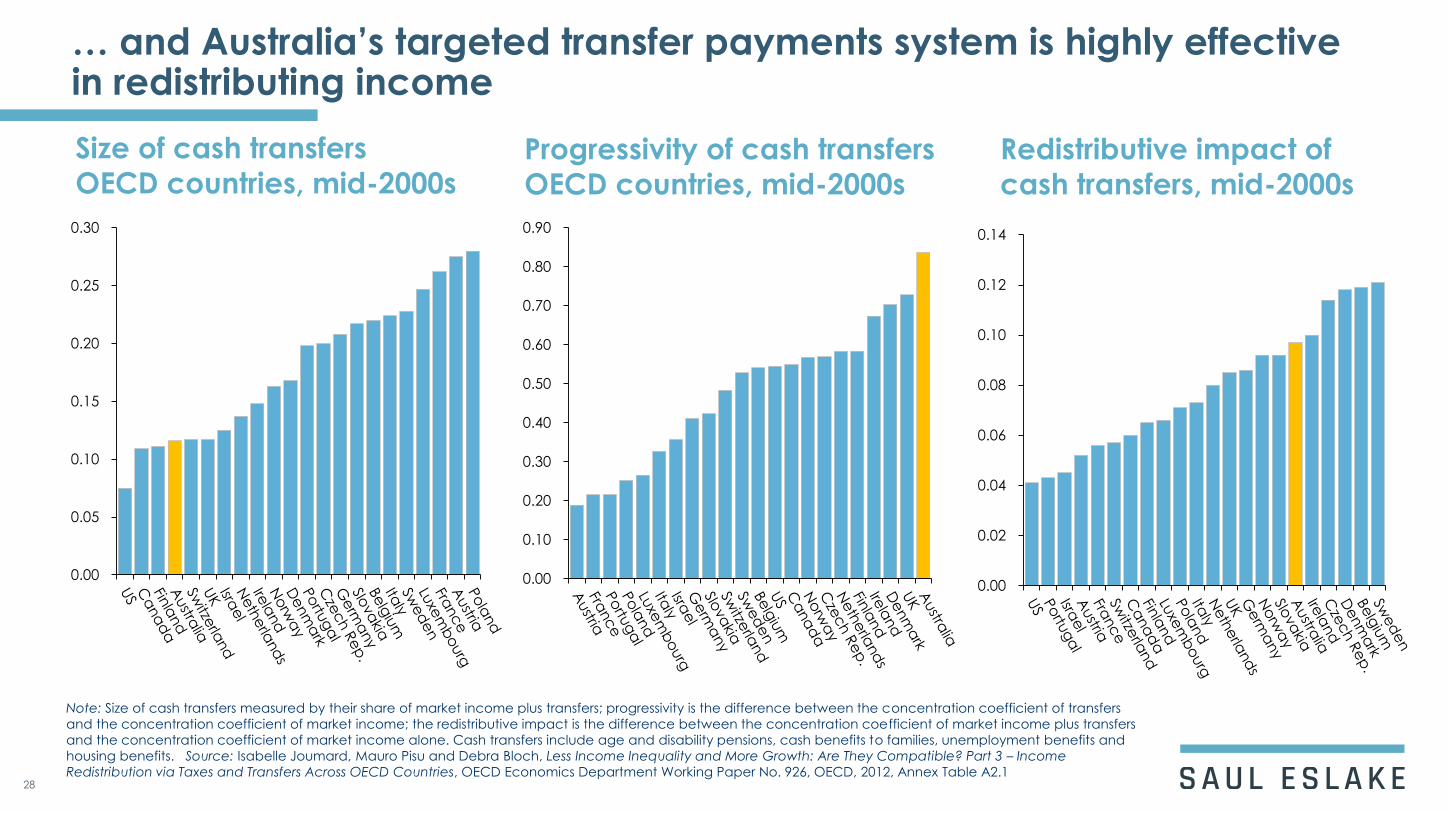
… and Australia’s targeted transfer payments system is highly effective in redistributing income
Note: Size of cash transfers measured by their share of market income plus transfers; progressivity is the difference between the concentration coefficient of transfers
and the concentration coefficient of market income; the redistributive impact is the difference between the concentration coefficient of market income plus transfers
and the concentration coefficient of market income alone. Cash transfers include age and disability pensions, cash benefits to families, unemployment benefits and
housing benefits. Source: Isabelle Joumard, Mauro Pisu and Debra Bloch, Less Income Inequality and More Growth: Are They Compatible? Part 3 – Income
Redistribution via Taxes and Transfers Across OECD Countries, OECD Economics Department Working Paper No. 926, OECD, 2012, Annex Table A2.1
Size of cash transfers
OECD countries, mid-2000s
28
0.00
0.05
0.10
0.15
0.20
0.25
0.30
Progressivity of cash transfers
OECD countries, mid-2000s
0.00
0.10
0.20
0.30
0.40
0.50
0.60
0.70
0.80
0.90
Redistributive impact of
cash transfers, mid-2000s
0.00
0.02
0.04
0.06
0.08
0.10
0.12
0.14
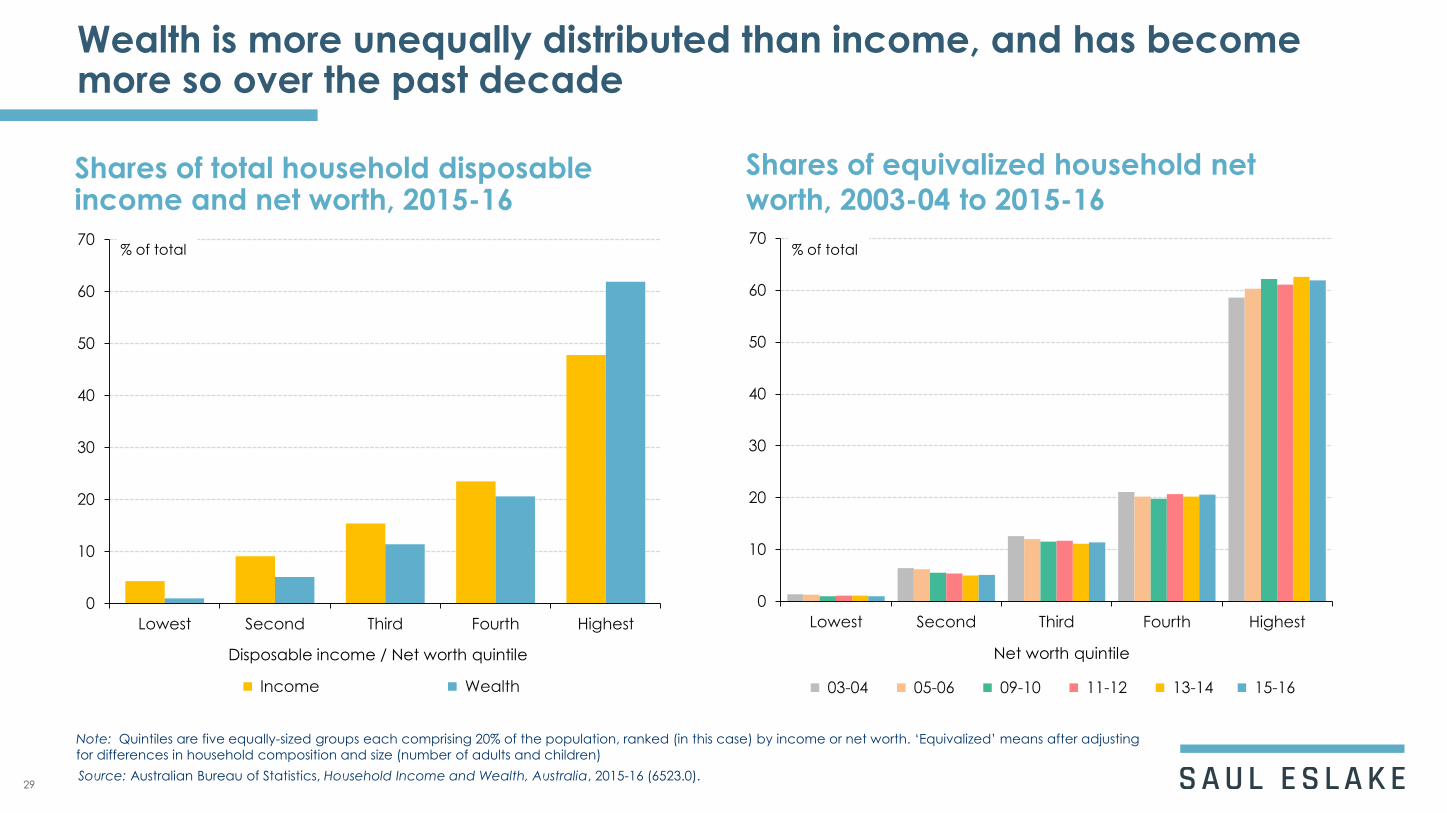
Wealth is more unequally distributed than income, and has become more so over the past decade
Shares of total household disposable income and net worth, 2015-16
Shares of equivalized household net
worth, 2003-04 to 2015-16
Note: Quintiles are five equally-sized groups each comprising 20% of the population, ranked (in this case) by income or net worth. ‘Equivalized’ means after adjusting
for differences in household composition and size (number of adults and children)
29Source: Australian Bureau of Statistics, Household Income and Wealth, Australia, 2015-16 (6523.0).
0
10
20
30
40
50
60
70
Lowest Second Third Fourth Highest
Income Wealth
% of total
Disposable income / Net worth quintile
0
10
20
30
40
50
60
70
Lowest Second Third Fourth Highest
03-04 05-06 09-10 11-12 13-14 15-16
% of total
Net worth quintile
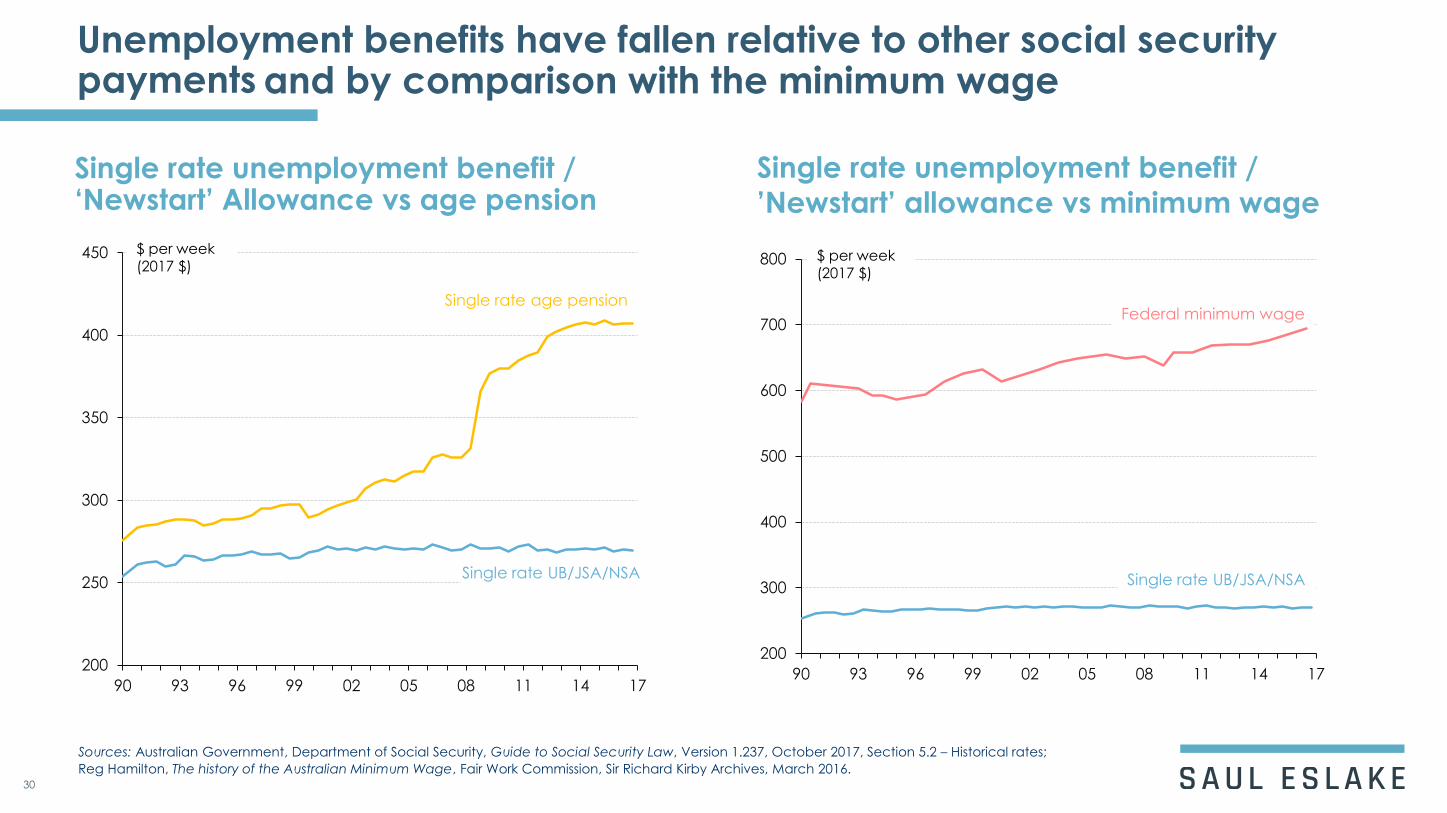
Unemployment benefits have fallen relative to other social security payments
Single rate unemployment benefit / ‘Newstart’ Allowance vs age pension
Single rate unemployment benefit /
’Newstart’ allowance vs minimum wage
30
Sources: Australian Government, Department of Social Security, Guide to Social Security Law, Version 1.237, October 2017, Section 5.2 – Historical rates;
200
250
300
350
400
450
90 93 96 99 02 05 08 11 14 17
$ per week (2017 $)
Single rate age pension
Single rate UB/JSA/NSA
200
300
400
500
600
700
800
90 93 96 99 02 05 08 11 14 17
$ per week (2017 $)
Single rate UB/JSA/NSA
Federal minimum wage
Reg Hamilton, The history of the Australian Minimum Wage, Fair Work Commission, Sir Richard Kirby Archives, March 2016.
and by comparison with the minimum wage
Some concluding suggestions
31
Don’t set too much store by exaggerated claims regarding the impact of technology on jobs
− yes, advances in information technology, ‘big data’, machine learning, etc. will lead to a range of tasks
(and some jobs) disappearing
− but those and other advances, demographic and other changes, will also create new tasks and new jobs
− as has always been the case, down the ages
Continue to emphasize the importance of education to improving employment outcomes
− and, in particular, in improving educational participation and attainment of people from lower-income
and otherwise socio-economically disadvantaged backgrounds
Challenge the notions that there is something inherently more noble or worthy about manufacturing
jobs than other areas of employment, and that services jobs are all about “flipping hamburgers” or
“taking in each others’ laundry”
− and similarly challenge traditional gendered views about “men’s” and “women’s” work
Consider how the New Zealand ‘investment’ approach to long-term unemployment can be adapted
to Australian circumstances
Give consideration to ways in which the Government might more directly address the problem of
stagnant wages growth
− for example in its submissions to FWC minimum wage cases
Continue to advocate for increases in the level of Newstart Allowances

And so to your question …
32
What strategies will you use to counter the challenges and
changes in the availability of work for you, your organisation and
the people you work with?