Embed Size (px)
Citation preview

Schooling inequality, higher education and the labour market: evidence from a graduate tracer
study in the Eastern Cape, South Africa
Michael Rogan and John Reynolds
International Council on Education for Teaching (ICET)
59th World Assembly
‘Challenging Disparities in Education’
Tokushima, Japan
June 19-22, 2015

More information:
http://www.lmip.org.za/
http://www.ru.ac.za/nalsu/
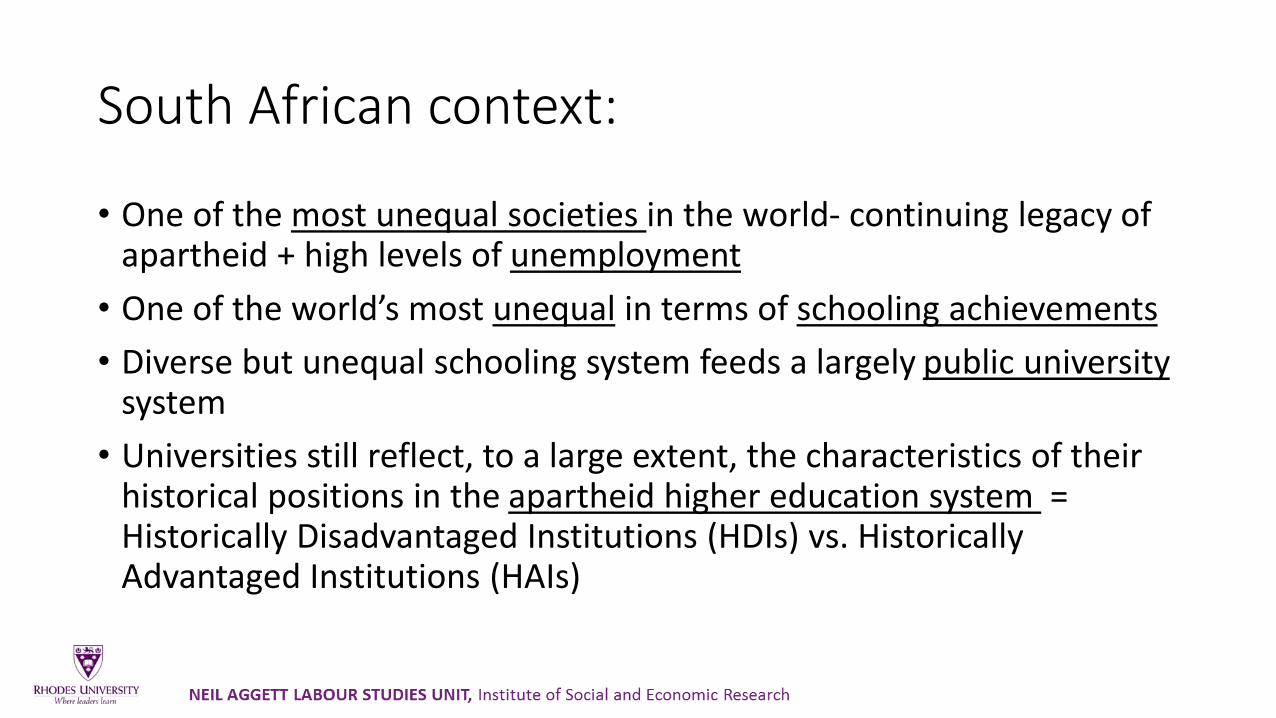
South African context:
• One of the most unequal societies in the world- continuing legacy of apartheid + high levels of unemployment
• One of the world’s most unequal in terms of schooling achievements
• Diverse but unequal schooling system feeds a largely public university system
• Universities still reflect, to a large extent, the characteristics of their historical positions in the apartheid higher education system = Historically Disadvantaged Institutions (HDIs) vs. Historically Advantaged Institutions (HAIs)

Policy:
National Development Plan:
• Increase of gross enrolments from 950,000 in 2010 to 1,6 million in 2030, a 70% increase
• Increase graduation rates to 25% (of total enrolment)
• University science, engineering and technology (SET) entrants to increase three-fold by 2030
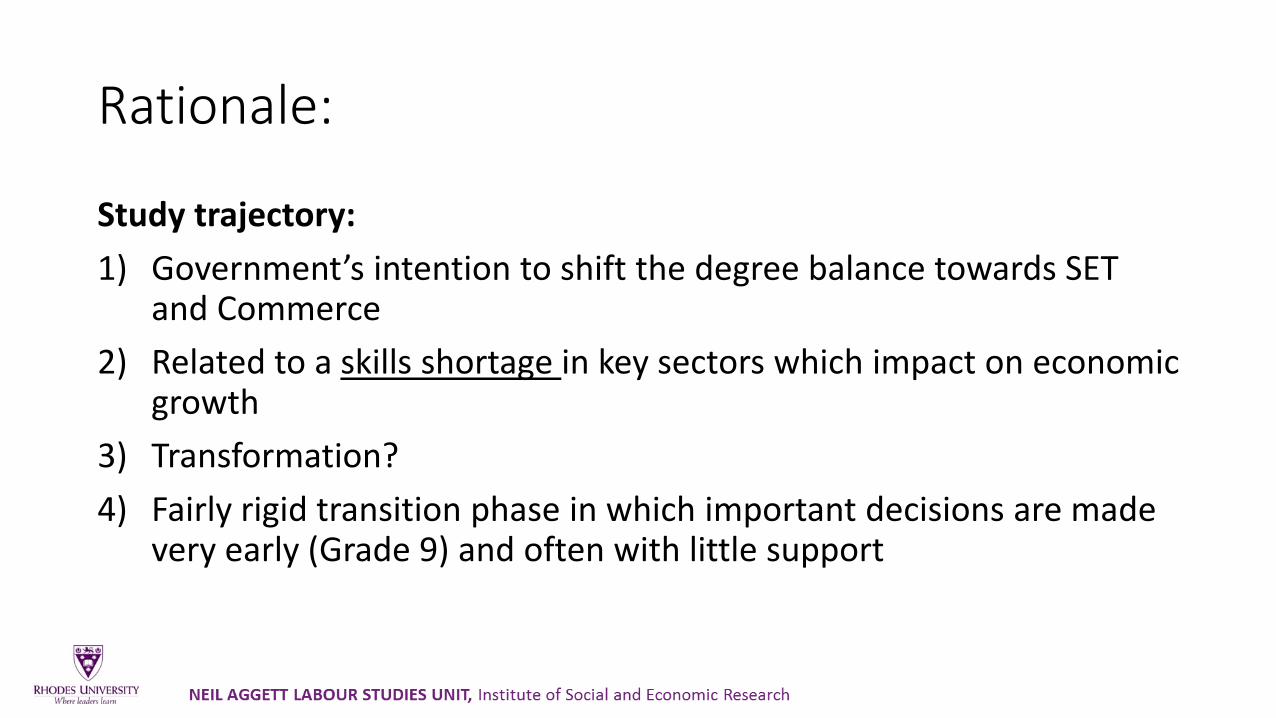
Rationale:
Study trajectory:
1) Government’s intention to shift the degree balance towards SET and Commerce
2) Related to a skills shortage in key sectors which impact on economic growth
3) Transformation?
4) Fairly rigid transition phase in which important decisions are made very early (Grade 9) and often with little support
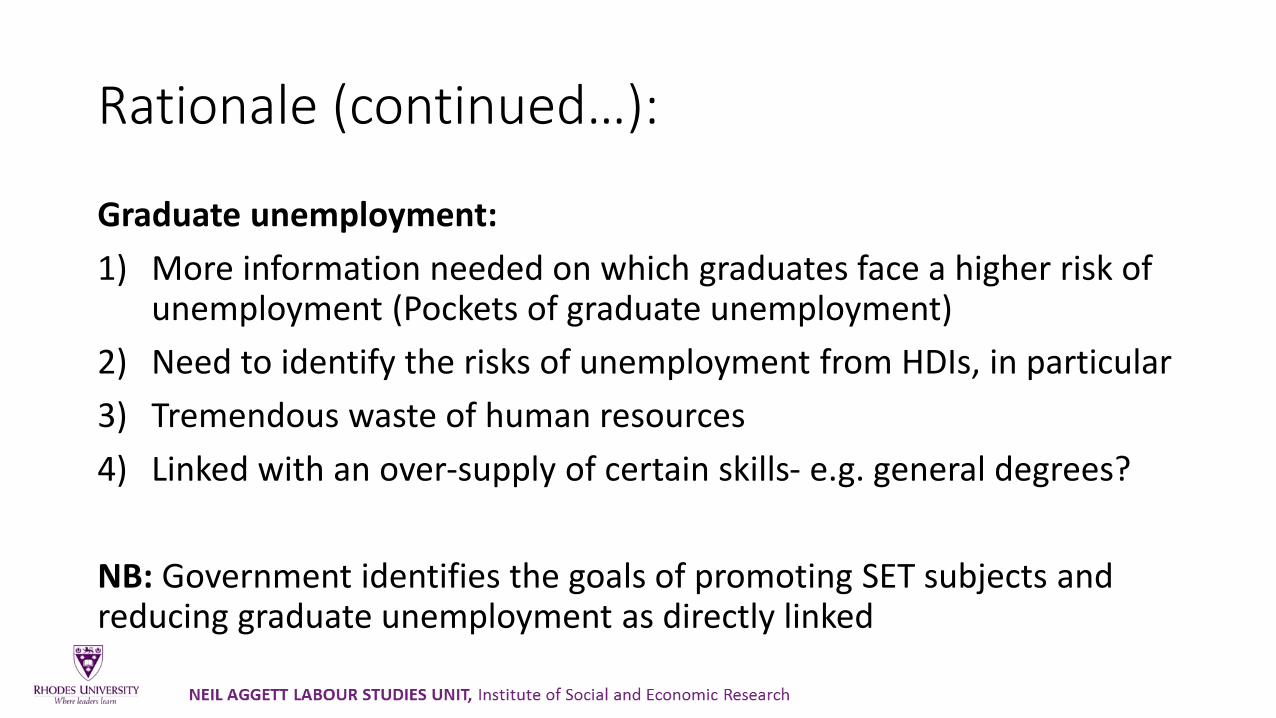
Rationale (continued…):
Graduate unemployment:
1) More information needed on which graduates face a higher risk of unemployment (Pockets of graduate unemployment)
2) Need to identify the risks of unemployment from HDIs, in particular
3) Tremendous waste of human resources
4) Linked with an over-supply of certain skills- e.g. general degrees?
NB: Government identifies the goals of promoting SET subjects and reducing graduate unemployment as directly linked
Objectives:
1) Study trajectory:
- Linked with ‘pre-higher education’ factors?
- Or changing preferences?
2) Graduate unemployment:
- Linked with study choices?
- Or with ‘non-HE’ factors such as social networks, schooling disadvantages, institutional signalling, information asymmetries, or discrimination?

Literature: study trajectories
• Graduates often do not complete (or even enrol in) their intended degrees
• Big differences both by race and field of study (particularly for SET intentions)
• Poor academic performance during the last year of schooling = gap between programme intentions and enrolment
• However, programme preferences also change considerably after enrolment

Literature: graduate unemployment
• Higher for Humanities and Arts graduates (but contested)
• Gendered and racial differences in the risk of unemployment among graduates
• Higher rates of unemployment among HDIs (e.g. van Broekhuizen 2013):
1) Field of study?
2) A problem of matching? (Altman 2007)
3) A ‘signalling’ problem? (Pauw et al. 2006)
4) Poor social networks in the private sector (Kraak 2010)

Eastern Cape context:
• Historically the poorest province in the country
• Higher education in the Eastern Cape is a microcosm of the country as a whole
Rhodes University (HAI): Formerly ‘Whites only’ university, high research output, world class infrastructure, students come from a middle-class and high income background
University of Fort Hare (HDI): Formerly a ‘Black’ university, low research output, poor infrastructure, students come from a poor background

Methods and data:
• Tracer study of the 2010 and 2011 cohorts from the University of Fort Hare (HDI)and Rhodes University (HAI) who graduated with a Bachelor’s degree
• Stratified (by subjects and institution) probability sample of 1,211 graduates representing the total population of 4,927 graduates
• Response rates of 39% and 47% per cent, respectively
• Fieldwork = online survey and telephonic interviews

Findings: Study trajectories

Findings: study trajectories
Rhodes University
Black African Coloured Indian or Asian White Total
SET 21.72
(3.70)
1.92
(1.96)
40.66
(10.24)
19.16
(2.21)
20.60
(1.91)
Business/ Commerce 34.98
(4.41)
19.23
(11.91)
23.08
(7.67)
21.08
(2.37)
26.05
(2.18)
Education 1.69
(0.97)
3.85
(2.82)
0.00
(0.00)
0.44
(0.22)
0.95
(0.37)
Humanities 41.61
(4.19)
75.00
(12.06)
36.26
(10.10)
59.32
(2.86)
52.40
(2.38)
Total 100.00 100.00 100.00 100.00 100.00
University of Fort Hare
SET 18.54
(1.47)
8.20
(5.87)
0.00
(0.00)
0.00
(0.00)
17.43
(1.38)
Business/ Commerce 24.45
(1.58)
26.23
(12.73)
46.15
(29.15)
39.06
(8.18)
25.23
(1.54)
Education 9.27
(1.40)
11.48
(7.80)
0.00
(0.00)
25.00
(8.08)
9.97
(1.36)
Humanities 47.73
(1.94)
54.10
(13.76)
53.85
(29.15)
35.94
(9.40)
47.37
(1.88)
Total 100.00 100.00 100.00 100.00 100.00
Table 1: Field of study, by university and population group
Notes: The data are weighted. Standard errors are in brackets.

Figure 1: Graduation in intended field of study, by first choice field of study
Notes: The data are weighted.
0
10
20
30
40
50
60
70
80
90
100
SET Business/Commerce
Education Humanities
%
Rhodes University University of Fort Hare

Rhodes University University of Fort Hare Total
Lack of jobs in SA 2.79
(1.13)
7.36
(1.43)
5.74
(1.01)
No scholarship 5.79
(1.74)
14.24
(2.07)
11.25
(1.49)
Marks not good enough 23.29
(3.13)
31.64
(2.55)
28.68
(2.00)
No places available 9.81
(2.25)
24.32
(2.41)
19.19
(1.78)
Started but couldn’t continue 13.37
(2.42)
5.42
(1.32)
8.23
(1.21)
Lost interest 48.11
(3.62)
20.47
(2.14)
30.25
(1.97)
Table 2: Reasons for not completing intended course of study
Notes: The data are weighted. Standard errors are in brackets.
Pooled Rhodes Forth Hare
(1) (2) (3) (4) (5) (6)
UFH 0.007
(0.213)
0.928**
(0.389) --- --- --- ---
Female -0.162
(0.133)
0.191
(0.241)
0.0176
(0.227)
0.104
(0.274)
-0.263
(0.171)
0.805
(0.726)
Black -0.340*
(0.196)
0.230
(0.287)
-0.141
(0.243)
-0.035
(0.392)
-1.074***
(0.366)
-0.379
(0.515)
Matric
Math or science higher grade -0.191
(0.184)
-0.205
(0.183)
-0.418
(0.258)
-0.445*
(0.259)
-0.100
(0.281)
-0.142
(0.287)
English higher grade -0.072
(0.150)
-0.056
(0.151)
0.282
(0.325)
0.287
(0.330)
-0.217
(0.174)
-0.222
(0.174)
Math upper class pass -0.003
(0.197)
-0.044
(0.198)
-0.475*
(0.247)
-0.481*
(0.247)
0.786**
(0.330)
0.758**
(0.334)
Science upper class pass 0.101
(0.254)
0.130
(0.254)
0.407
(0.308)
0.445
(0.313)
-0.302
(0.473)
-0.255
(0.487)
Low quintile school -0.492***
(0.143)
-0.220
(0.301)
-0.462*
(0.279)
0.021
(0.421)
-0.452***
(0.172)
-0.248
(0.255)
Ambitions
SET_matric -1.296***
(0.165)
-1.092***
(0.205)
-1.196***
(0.262)
-1.057***
(0.279)
-1.375***
(0.224)
-1.154***
(0.320)
Comm_matric -0.560***
(0.159)
-0.315
(0.221)
-0.753***
(0.289)
-0.510
(0.319)
-0.528***
(0.197)
-0.198
(0.330)
Edu_matric 0.343
(0.443)
-0.750
(0.678)
-2.438**
(1.035)
-3.178***
(1.183)
0.497
(0.485)
-0.132
(0.762)
Interactions
Black*UFH -1.142***
(0.423)
Black*female -0.492*
(0.287)
-0.164
(0.478)
-1.109
(0.748)
_cons 5.546***
(1.394)
5.006***
(1.408)
6.277
(4.371)
1.787
(5.808)
5.886***
(1.671)
5.145***
(1.736)
N 1156 1156 445 444 711 711
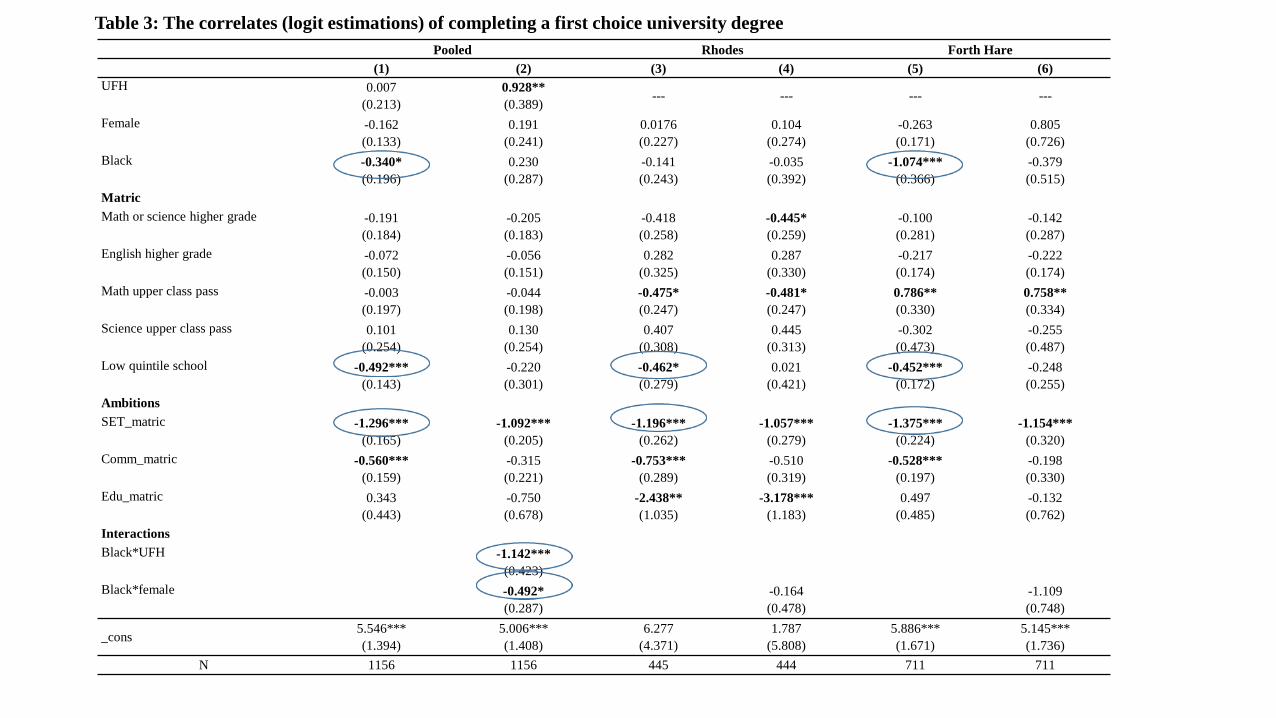
Table 3: The correlates (logit estimations) of completing a first choice university degree

Findings: Graduate unemployment

Findings: graduate unemployment
Figure 2: Broad unemployment rates (as of March 1st), by field of study
0.0
5.0
10.0
15.0
20.0
25.0
SET Business/ Commerce Education Humanities Total
4.6 4.2
0.0
9.0
6.8
24.5
18.3
8.8
22.5
20.4
%
Rhodes University University of Fort Hare
Notes: The data are weighted.
Rhodes University SET Business/ Commerce Education Humanities Total
Employment agency 13.16
(4.06)
12.73
(3.58)
0.00
(0.00)
7.25
(1.87)
9.84
(1.61)
Relatives 6.04
(2.66)
5.15
(2.12)
0.00
(0.00)
7.75
(1.92)
6.59
(1.27)
Linked to bursary 1.55
(1.54)
4.43
(2.27)
0.00
(0.00)
2.10
(1.04)
2.63
(0.89)
Social media 4.96
(2.46)
15.08
(3.97)
21.05
(18.05)
11.82
(2.32)
11.56
(1.74)
Personal contacts 21.02
(4.56)
27.07
(4.56)
27.63
(18.35)
34.12
(3.41)
29.56
(2.38)
Newspaper 8.76
(3.91)
9.78
(3.44)
60.53
(18.99)
11.08
(2.24)
10.86
(1.71)
Campus recruitment 3.77
(2.17)
8.69
(2.90)
6.58
(6.66)
5.23
(1.61)
5.95
(1.24)
University of Fort Hare
Employment agency 0.00
(0.00)
4.50
(1.57)
0.00
(0.00)
1.62
(0.80)
1.92
(0.56)
Department of Labour 10.03
(3.18)
6.16
(1.89)
11.90
(5.62)
8.82
(1.80)
8.68
(1.28)
Relatives 1.21
(1.20)
3.08
(1.36)
1.82
(1.81)
3.42
(1.22)
2.79
(0.73)
Linked to bursary 12.11
(3.44)
4.92
(1.70)
21.56
(6.59)
15.48
(2.32)
12.91
(1.52)
Social media 5.84
(2.54)
7.84
(2.09)
0.00
(0.00)
4.36
(1.29)
4.99
(0.91)
Personal contacts 8.39
(2.86)
13.84
(2.66)
7.84
(3.82)
11.78
(2.15)
11.32
(1.37)
Newspaper 36.62
(5.04)
40.69
(3.87)
20.55
(6.08)
37.50
(3.13)
36.23
(2.10)
Campus recruitment 8.82
(2.99)
4.16
(1.55)
3.30
(3.23)
4.75
(1.34)
5.08
(0.96)
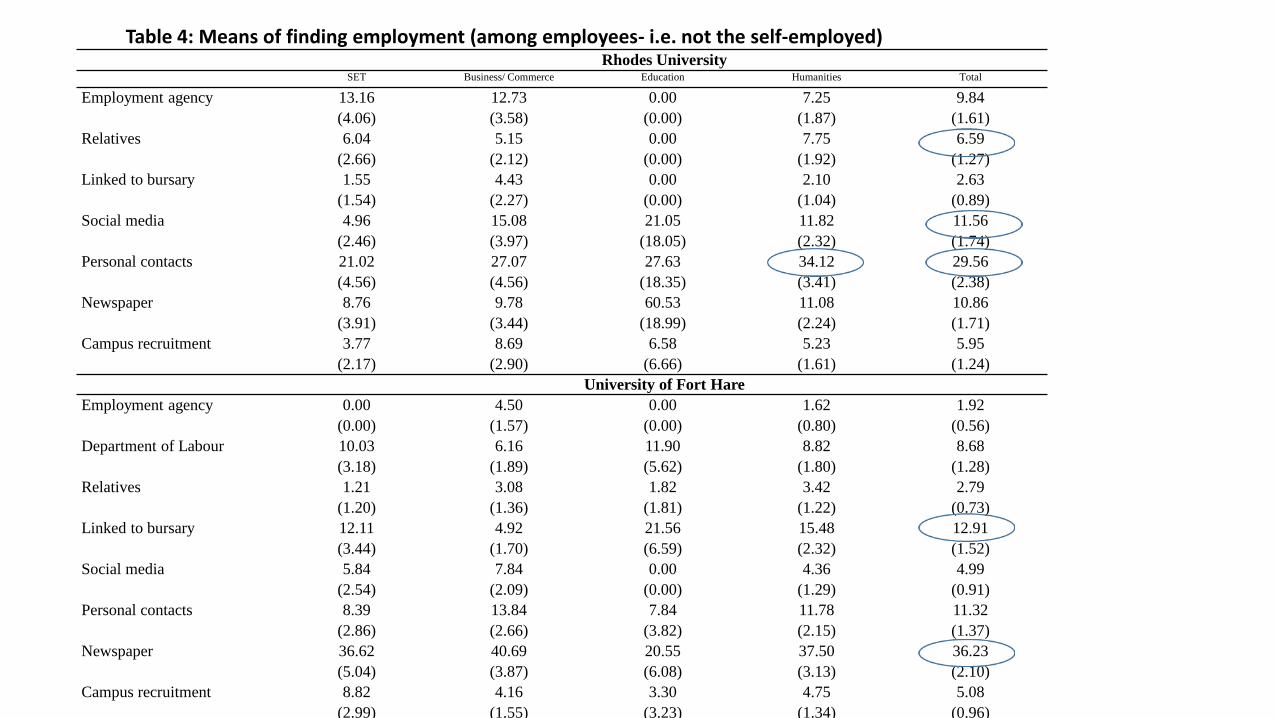
Table 4: Means of finding employment (among employees- i.e. not the self-employed)
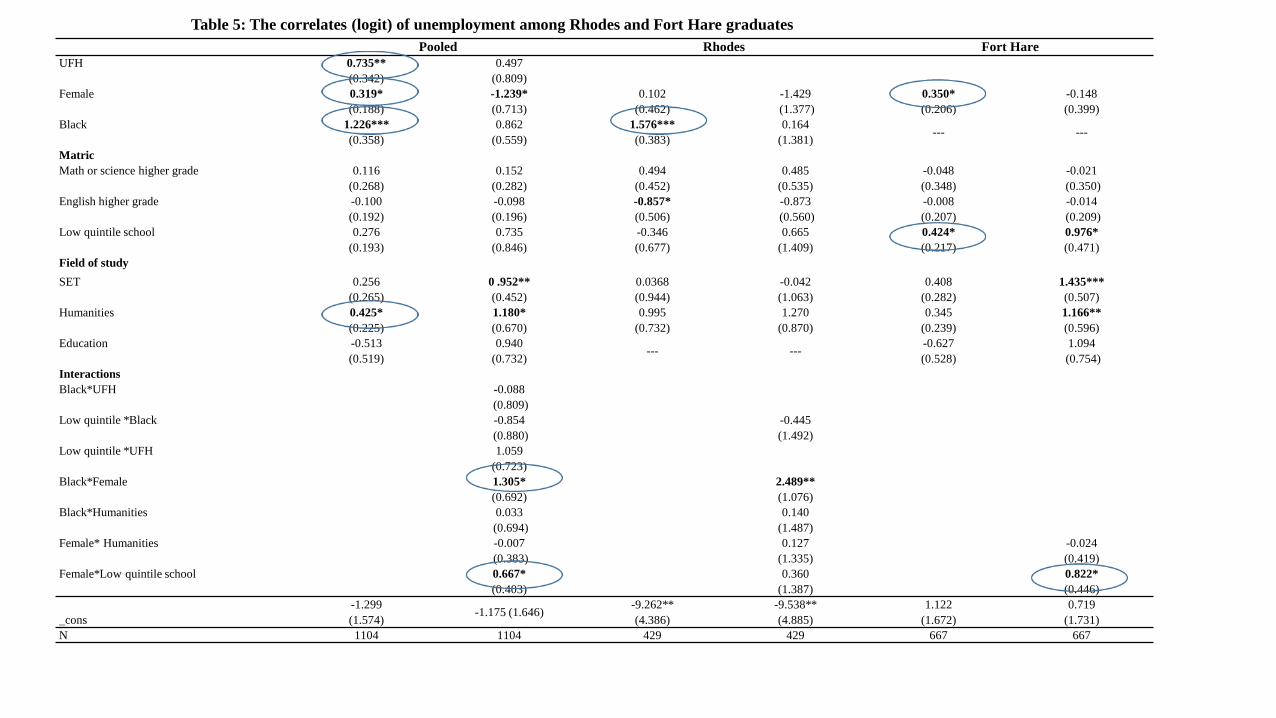
Table 5: The correlates (logit) of unemployment among Rhodes and Fort Hare graduates
Pooled Rhodes Fort Hare UFH 0.735**
(0.342)
0.497
(0.809)
Female 0.319*
(0.188)
-1.239*
(0.713)
0.102
(0.462)
-1.429
(1.377)
0.350*
(0.206)
-0.148
(0.399)
Black 1.226***
(0.358)
0.862
(0.559)
1.576***
(0.383)
0.164
(1.381) --- ---
Matric
Math or science higher grade 0.116
(0.268)
0.152
(0.282)
0.494
(0.452)
0.485
(0.535)
-0.048
(0.348)
-0.021
(0.350)
English higher grade -0.100
(0.192)
-0.098
(0.196)
-0.857*
(0.506)
-0.873
(0.560)
-0.008
(0.207)
-0.014
(0.209)
Low quintile school 0.276
(0.193)
0.735
(0.846)
-0.346
(0.677)
0.665
(1.409)
0.424*
(0.217)
0.976*
(0.471)
Field of study
SET 0.256
(0.265)
0 .952**
(0.452)
0.0368
(0.944)
-0.042
(1.063)
0.408
(0.282)
1.435***
(0.507)
Humanities 0.425*
(0.225)
1.180*
(0.670)
0.995
(0.732)
1.270
(0.870)
0.345
(0.239)
1.166**
(0.596)
Education -0.513
(0.519)
0.940
(0.732) --- ---
-0.627
(0.528)
1.094
(0.754)
Interactions
Black*UFH -0.088
(0.809)
Low quintile *Black -0.854
(0.880)
-0.445
(1.492)
Low quintile *UFH 1.059
(0.723)
Black*Female 1.305*
(0.692)
2.489**
(1.076)
Black*Humanities 0.033
(0.694)
0.140
(1.487)
Female* Humanities -0.007
(0.383)
0.127
(1.335)
-0.024
(0.419)
Female*Low quintile school
0.667*
(0.403)
0.360
(1.387)
0.822*
(0.446)
_cons
-1.299
(1.574) -1.175 (1.646)
-9.262**
(4.386)
-9.538**
(4.885)
1.122
(1.672)
0.719
(1.731)
N 1104 1104 429 429 667 667
Conclusions:
• Constrained study choices
• BUT study choice does not necessarily explain employment outcomes
• Disadvantages in schooling quality carrying over into the labour market (even for successful graduates)
• Signalling vs. matching/social networking? (Altman 2006)
• Different approaches needed (e.g. Rhodes vs. Fort Hare)
• Potential for Australian initiatives which are focussed on supporting learners in making decisions about further training and study (Stumpf et al. 2012)