Embed Size (px)
Citation preview
Insight & Foresight
CapitaLand LimitedAnnual Report 2013
ClarityClarity enables us to enhance organisational performancethrough operational excellence and eff iciencies.
Insight & ForesightCapitaLand is a leader in the real estate industry in Asia. It leverages growth opportunities driven by consumption and urbanisation. Its consolidated structure and core competencies allow the Group to focus on integrated, mixed-use opportunities and build scale across its six city clusters in the core markets of Singapore and China. Deep knowledge and experience give CapitaLand the insight and foresight to fine-tune operational excellence while its leading position provides the clearest possible perspective on future drivers of growth opportunities.
Cov
er p
hoto
cou
rtes
y of
Dav
id N
g So
on T
hong
(Sin
gapo
re),
Cap
itaLa
nd ‘B
uild
ing
Peop
le’ P
hoto
grap
hy C
ompe
titio
n 20
11.
Contents Corporate Profile 2Financial Highlights FY 2013 3Letter to Shareholders 4Managing Sustainability 13Year in Brief 14Awards & Accolades 16
Corporate Governance & TransparencyBoard of Directors 20 Senior Management 28Corporate Governance Report 33Enterprise Risk Management 61Stakeholder Communication 64Corporate Directory 68Financial Calendar 69
SustainabilityEnvironment, Health and Safety 70People 72Community 74
Business ReviewGlobal Presence 76Performance Overview 77Group Businesses 90CapitaLand Singapore 92CapitaLand China 94CapitaMalls Asia 96Ascott 98Regional Investments 100Financial Products & Services 103 Portfolio DetailsMixed-use Developments 106Residential 107 Commercial 112Shopping Malls 113Serviced Residences 1185-Year Financial Summary 123Share Price Performance 124 AppendixStatutory Accounts 125Economic Value Added Statements 248Value Added Statements 249Supplemental Information 250Shareholding Statistics 251Notice of
Annual General Meeting 252Proxy Form 257
1
Corporate Profile
To build a world-class company, with an international presence and a strong global network, that is managed by people whose core values are respected by the business and social community to:
• Create sustainable shareholder value
• Deliver quality products and services
• Attract and develop quality human capital
CapitaLand is one of Asia’s largest real estate companies. Headquartered and listed in Singapore, the company’s businesses in real estate and real estate fund management are focused on its core markets of Singapore and China.
The company’s diversified real estate portfolio primarily includes homes, offices, shopping malls, serviced residences and mixed-use developments. The company also has one of the largest real estate fund management businesses with assets located in Asia. CapitaLand leverages its significant asset base, real estate domain knowledge, product design and development capabilities, active capital management strategies and extensive market network to develop real estate products and services in its markets.
The listed entities of the CapitaLand Group include CapitaMalls Asia, Ascott Residence Trust, CapitaCommercial Trust, CapitaMall Trust, CapitaMalls Malaysia Trust, CapitaRetail China Trust and Australand.
Mission & Vision• Our people are our strength.
We build people to build for people.
• We are committed to the highest standards of integrity.
• We have the courage to do what is right and the will to succeed.
• We add value to what we do through innovation and continuous improvement.
• We are fair and reasonable in all our actions and dealings with business partners, customers and colleagues.
• We contribute to the well-being of the community.
Core Values
CapitaLand Limited Annual Report 2013 2 Clarity
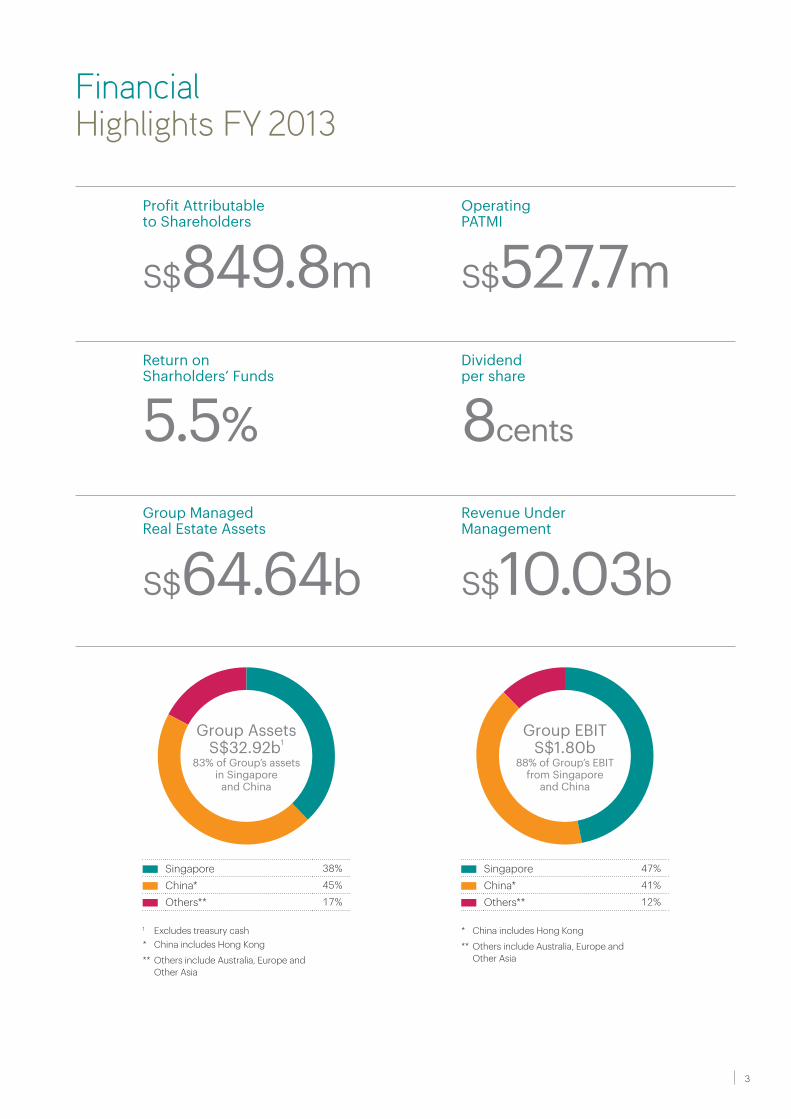
FinancialHighlights FY 2013
Profit Attributable to Shareholders
OperatingPATMI
S$849.8m
S$64.64b
5.5%
S$527.7m
S$10.03b
8cents
Return on Sharholders’ Funds
Dividendper share
Group Managed Real Estate Assets
Revenue Under Management
Singapore 38%
China* 45%
Others** 17%
1 Excludes treasury cash* China includes Hong Kong
** Others include Australia, Europe and Other Asia
Singapore 47%
China* 41%
Others** 12%
* China includes Hong Kong
** Others include Australia, Europe and Other Asia
Group Assets S$32.92b1
83% of Group’s assets in Singapore
and China
Group EBIT S$1.80b
88% of Group’s EBIT from Singapore
and China
3
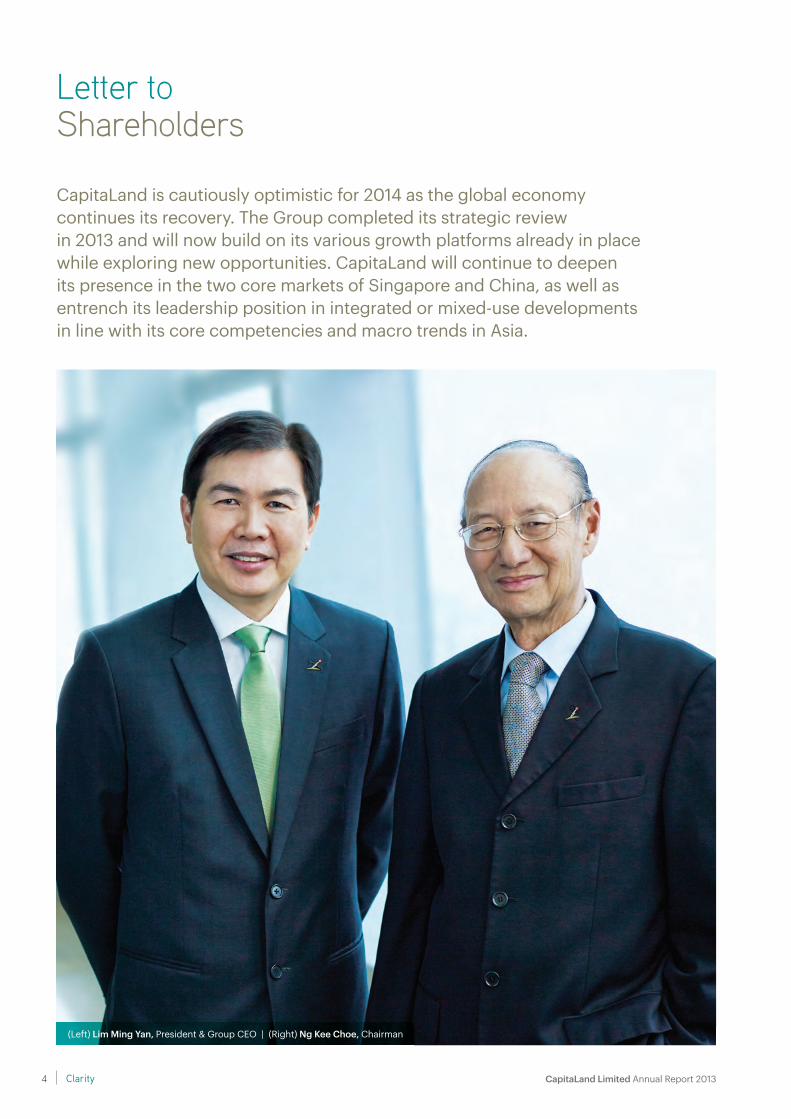
CapitaLand is cautiously optimistic for 2014 as the global economy continues its recovery. The Group completed its strategic review in 2013 and will now build on its various growth platforms already in place while exploring new opportunities. CapitaLand will continue to deepen its presence in the two core markets of Singapore and China, as well as entrench its leadership position in integrated or mixed-use developments in line with its core competencies and macro trends in Asia.
Letter to Shareholders
(Left) Lim Ming Yan, President & Group CEO | (Right) Ng Kee Choe, Chairman
CapitaLand Limited Annual Report 2013 4 Clarity
DEAR SHAREHOLDERS,
In 2013, following a strategic review, CapitaLand was reorganised and streamlined into four business units – CapitaLand Singapore, CapitaLand China, CapitaMalls Asia Limited (CMA) and The Ascott Limited (Ascott). CapitaLand Singapore and CapitaLand China concentrate in the residential, office and integrated or mixed-use development businesses, while CMA and Ascott continue their focus in the shopping mall and serviced residence businesses respectively. As part of the streamlining, a common Chinese name, , was adopted in both Singapore and China for greater clarity and consistency.
The streamlined organisation allows the Group to sharpen its focus, and better leverage and harness synergies across the four core business units; achieve greater economies of scale and enhance its competitive advantage in integrated and mixed-use development projects, and deepen its leading positions in shopping malls and serviced residences.
In the next three to five years, CapitaLand aims to deliver a sustainable return on equity (ROE) in excess of 8%.
KEY FINANCIAL HIGHLIGHTSFor the year ended 31 December 2013, the Group posted revenue of S$3.98 billion, earnings before interest and taxes (EBIT) of S$1.80 billion, and a 43% increase in operating net profit after tax and minority interest (PATMI) to S$527.7 million from 2012. PATMI of S$849.8 million was however lower compared to 2012, due mainly to a one-time accounting
loss on divestment of 20% stake in Australand and higher impairment costs.
FOCUS ON CORE MARKETS OF SINGAPORE AND CHINAFor the core markets of Singapore and China, CapitaLand further sharpened its focus on the six clusters, namely, Singapore, Beijing-Tianjin, Shanghai-Hangzhou-Suzhou-Ningbo, Guangzhou-Shenzhen, Chengdu-Chongqing, and Wuhan. The sharpened focus allows the Group to take advantage of Asia’s growth, urbanisation and consumer demand trends.
In 2013, CapitaLand invested a total of S$3.70 billion in new projects, with about 90% of the investments in Singapore and China. Its businesses in the two core markets of Singapore and China accounted for 83% of the Group’s total assets (excluding treasury cash). China, with one of the highest rates of economic growth globally, is the Group’s largest market with assets amounting to S$14.91 billion or 45% of Group’s total assets, as at 31 December 2013. Assets in the Singapore portfolio stood at S$12.52 billion or 38% of the Group’s total assets.
WELL-DIVERSIFIED PROPERTY ASSET PORTFOLIOSThe property asset portfolios in Singapore and China are well-diversified. In Singapore, residential, commercial (which includes mixed-use developments), shopping malls and serviced residences make up 32%, 18%, 42%, and 7% of the portfolio respectively. In China, the residential, commercial, shopping malls and serviced residences comprise 34%, 27%,
For the year ended 31 December 2013, the Group posted revenue of S$3.98 billion, EBIT of S$1.80 billion, and a 43% increase in operating PATMI to S$527.7 million
Group RevenueS$3.98b
In 2013, CapitaLand invested a total of S$3.70 billion in new projects, with about 90% of the investments in Singapore and China
New InvestmentsS$3.70b
5
Letter to Shareholders
32%, and 6% of the portfolio respectively. Singapore remains as CapitaLand’s most profitable market in 2013, accounting for 47% of Group EBIT, while China contributed 41%.
CapitaLand is positive about the long-term prospects of its two core markets of Singapore and China, both of which have strong economic fundamentals and healthy consumer demand. To further enhance value from these two core markets, the Group has deepened its expertise across the entire real estate value chain spanning from land acquisition, development and operation to capital management.
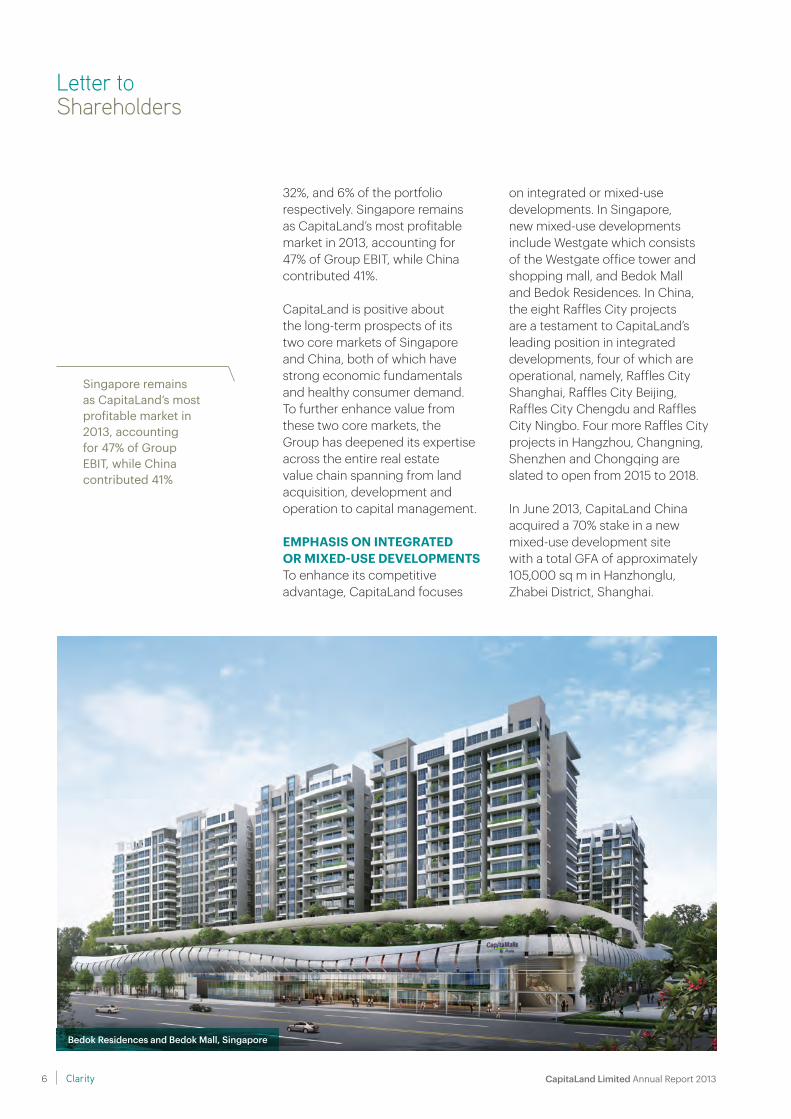
EMPHASIS ON INTEGRATED OR MIXED-USE DEVELOPMENTSTo enhance its competitive advantage, CapitaLand focuses
on integrated or mixed-use developments. In Singapore, new mixed-use developments include Westgate which consists of the Westgate office tower and shopping mall, and Bedok Mall and Bedok Residences. In China, the eight Raffles City projects are a testament to CapitaLand’s leading position in integrated developments, four of which are operational, namely, Raffles City Shanghai, Raffles City Beijing, Raffles City Chengdu and Raffles City Ningbo. Four more Raffles City projects in Hangzhou, Changning, Shenzhen and Chongqing are slated to open from 2015 to 2018.
In June 2013, CapitaLand China acquired a 70% stake in a new mixed-use development site with a total GFA of approximately 105,000 sq m in Hanzhonglu, Zhabei District, Shanghai.
Bedok Residences and Bedok Mall, Singapore
Singapore remains as CapitaLand’s most profitable market in 2013, accounting for 47% of Group EBIT, while China contributed 41%
CapitaLand Limited Annual Report 2013 6 Clarity
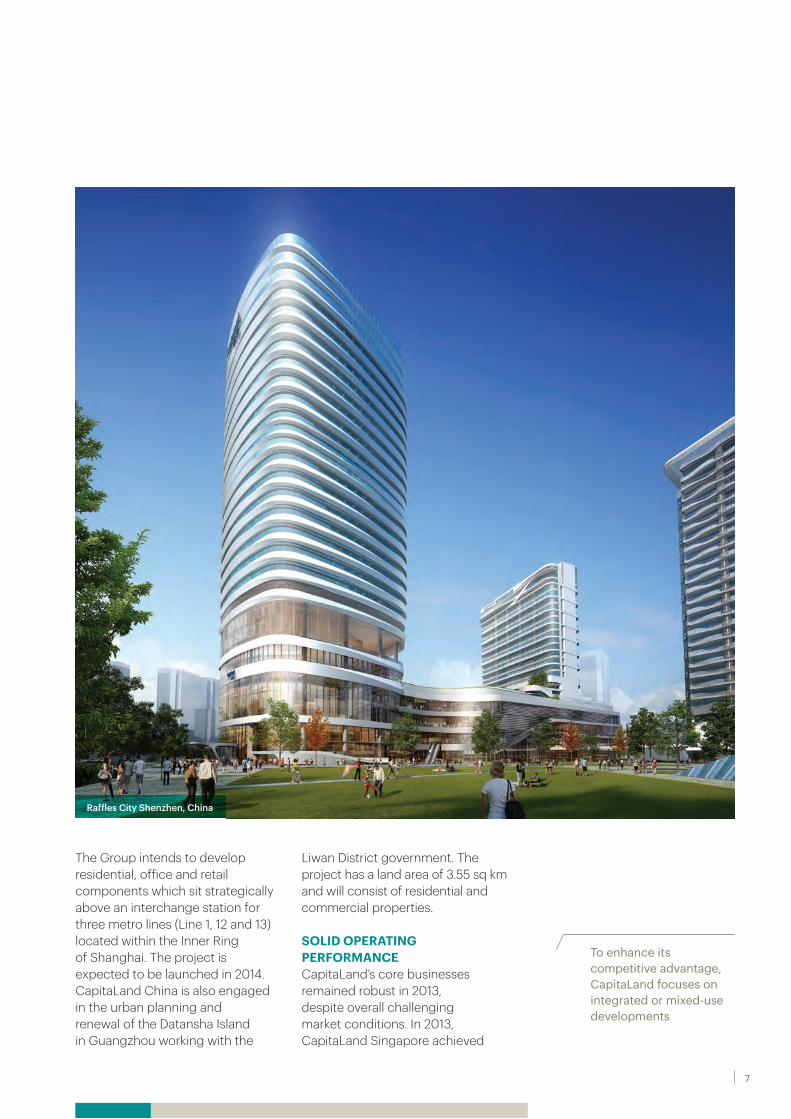
The Group intends to develop residential, office and retail components which sit strategically above an interchange station for three metro lines (Line 1, 12 and 13) located within the Inner Ring of Shanghai. The project is expected to be launched in 2014. CapitaLand China is also engaged in the urban planning and renewal of the Datansha Island in Guangzhou working with the
Liwan District government. The project has a land area of 3.55 sq km and will consist of residential and commercial properties.
SOLID OPERATING PERFORMANCE CapitaLand’s core businesses remained robust in 2013, despite overall challenging market conditions. In 2013, CapitaLand Singapore achieved
Raffles City Shenzhen, China
To enhance its competitive advantage, CapitaLand focuses on integrated or mixed-use developments
7
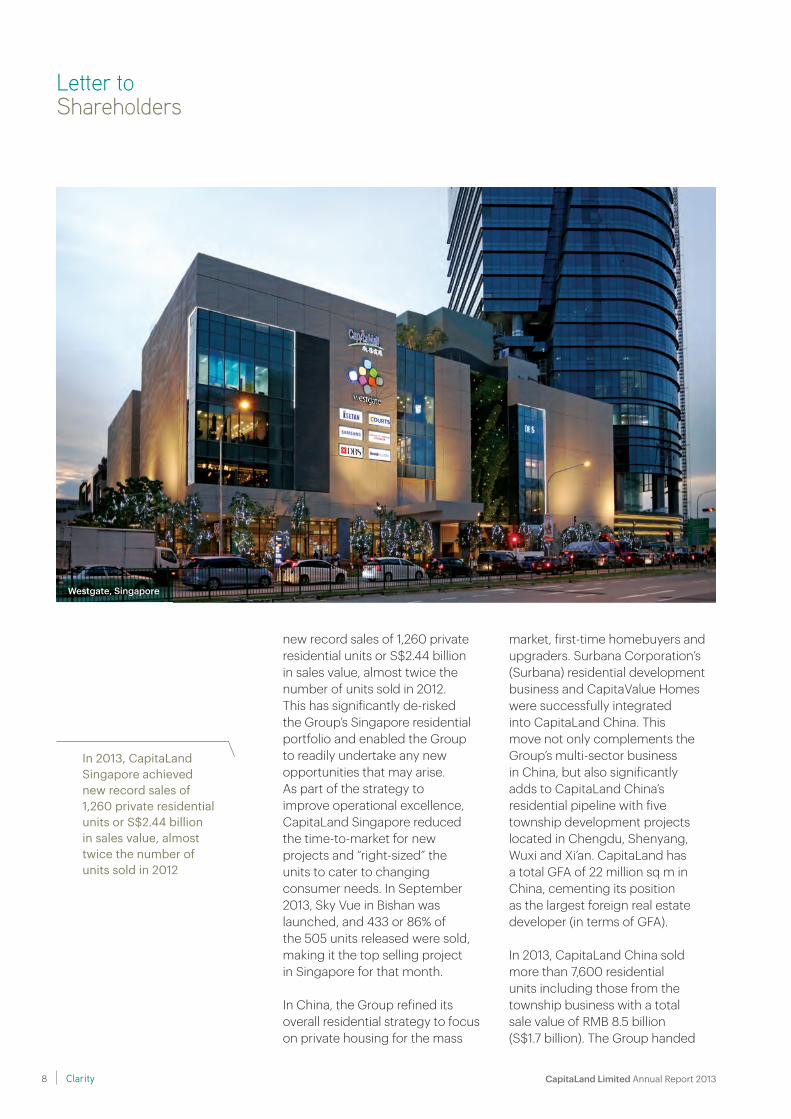
new record sales of 1,260 private residential units or S$2.44 billion in sales value, almost twice the number of units sold in 2012. This has significantly de-risked the Group’s Singapore residential portfolio and enabled the Group to readily undertake any new opportunities that may arise. As part of the strategy to improve operational excellence, CapitaLand Singapore reduced the time-to-market for new projects and “right-sized” the units to cater to changing consumer needs. In September 2013, Sky Vue in Bishan was launched, and 433 or 86% of the 505 units released were sold, making it the top selling project in Singapore for that month.
In China, the Group refined its overall residential strategy to focus on private housing for the mass
market, first-time homebuyers and upgraders. Surbana Corporation’s (Surbana) residential development business and CapitaValue Homes were successfully integrated into CapitaLand China. This move not only complements the Group’s multi-sector business in China, but also significantly adds to CapitaLand China’s residential pipeline with five township development projects located in Chengdu, Shenyang, Wuxi and Xi’an. CapitaLand has a total GFA of 22 million sq m in China, cementing its position as the largest foreign real estate developer (in terms of GFA).
In 2013, CapitaLand China sold more than 7,600 residential units including those from the township business with a total sale value of RMB 8.5 billion (S$1.7 billion). The Group handed
Letter to Shareholders
Westgate, Singapore
In 2013, CapitaLand Singapore achieved new record sales of 1,260 private residential units or S$2.44 billion in sales value, almost twice the number of units sold in 2012
CapitaLand Limited Annual Report 2013 8 Clarity
over 8,300 residential units, mainly from township and residential projects including Dolce Vita in Guangzhou; iPark in Shenzhen; The Loft in Chengdu and Imperial Bay in Hangzhou.
The Group’s shopping mall business held mainly through its subsidiary CMA, continued to perform well in key markets of Singapore and China, achieving higher shopper traffic and net property income. CMA opened four new malls - Westgate and Bedok Mall in Singapore, and CapitaMall Meilicheng and CapitaMall Jinniu (Phase II)in Chengdu, China. The malls in Malaysia, Japan and India maintained their stable performance. CMA also announced its partnership with Changi Airport Group to jointly develop a mixed-use development (Project Jewel) at Changi Airport. The project is expected to have a total GFA of approximately 134,000 sq m and total development cost (including land cost) of approximately S$1.47 billion.
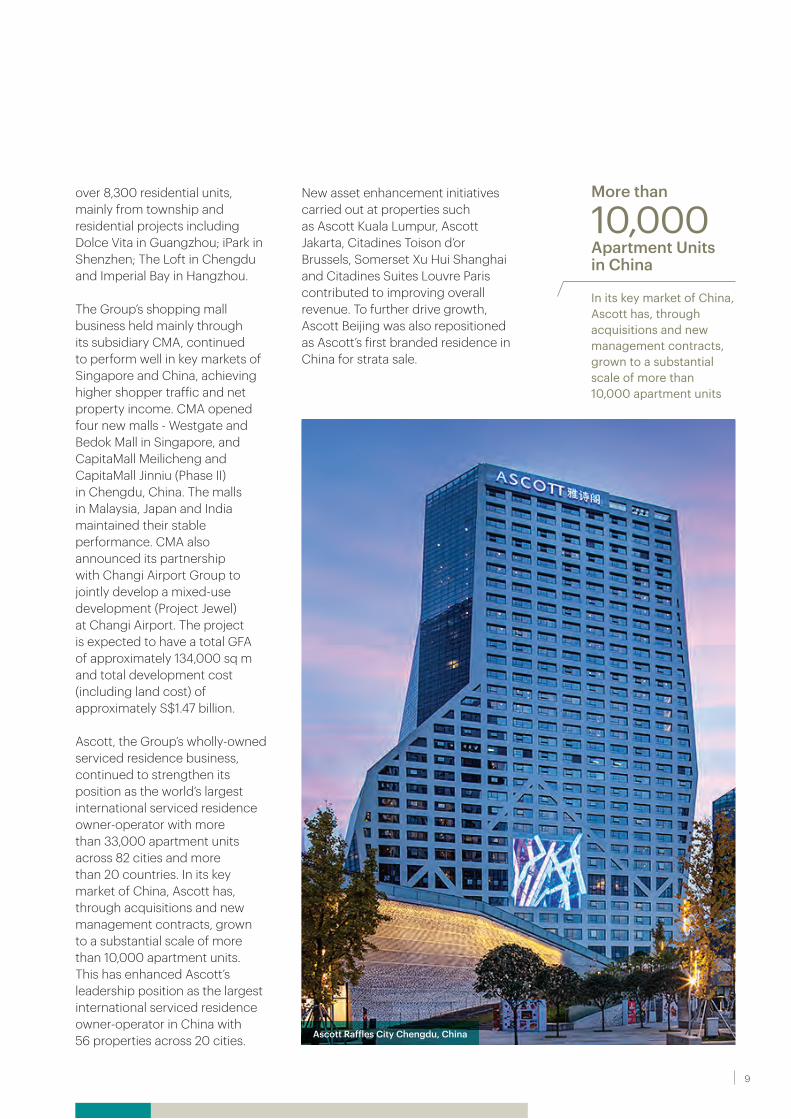
Ascott, the Group’s wholly-owned serviced residence business, continued to strengthen its position as the world’s largest international serviced residence owner-operator with more than 33,000 apartment units across 82 cities and more than 20 countries. In its key market of China, Ascott has, through acquisitions and new management contracts, grown to a substantial scale of more than 10,000 apartment units. This has enhanced Ascott’s leadership position as the largest international serviced residence owner-operator in China with 56 properties across 20 cities.
New asset enhancement initiatives carried out at properties such as Ascott Kuala Lumpur, Ascott Jakarta, Citadines Toison d’or Brussels, Somerset Xu Hui Shanghai and Citadines Suites Louvre Paris contributed to improving overall revenue. To further drive growth, Ascott Beijing was also repositioned as Ascott’s first branded residence in China for strata sale.
In its key market of China, Ascott has, through acquisitions and new management contracts, grown to a substantial scale of more than 10,000 apartment units
Apartment Units in China
10,000More than
Ascott Raffles City Chengdu, China
9
Letter to Shareholders
Besides the four core businesses, CapitaLand continued to nurture and enhance the value of three key investments namely Australand, CapitaLand Vietnam and StorHub. The Group also continued its active asset management strategy leveraging its REITs and private equity fund platforms.
In November 2013, CapitaLand sold 20% of its Australand stake. Post-placement, Australand’s free float increased by approximately 50% and its ranking in the ASX200 and ASX200 A-REIT indices improved significantly. Australand was also included in the FTSE EPRA/NAREIT Global Real Estate Index.
PRUDENT CAPITAL MANAGEMENTAs of 31 December 2013, CapitaLand maintained a strong balance sheet. About 9% of the Group’s total debt is due within one year and its average debt maturity profile remains stable at 3.6 years.
As part of the Group’s active capital management strategy, CapitaLand issued two new convertible bonds which totaled approximately S$1.45 billion, and simultaneously bought back a total of approximately S$1.55 billion of existing convertible bonds in 2013. Through both exercises, significant interest savings were achieved and the debt maturity was further extended. It is also noteworthy that the S$800 million 1.95% due 2023 convertible bond had won all major awards for a convertible bond issue in 2013 from FinanceAsia, IFR Asia, EuroWeek Asia/Asiamoney and The Asset.
In addition, the placement of 20% stake in Australand has enabled the
Group to reallocate the placement proceeds to its core markets of Singapore and China.
IMPROVING SHAREHOLDERS’ RETURN AND VALUETo improve its current ROE, CapitaLand is focused on increasing the profitability of its core businesses and the development of integrated or mixed-use projects. In 2013, the Group unlocked and recycled capital by divesting stabilised or non-core assets such as its entire stake in Technopark@Chai Chee and its one-third interest in investment properties in the United Kingdom. The Group also sold Westgate Office Tower and commenced strata sale of 81 apartment units in Somerset Grand Fortune Garden, Beijing.
Going forward, the Group will continue to adopt a well-balanced investment approach with an emphasis on integrated or mixed-use developments to ensure future growth across all the property asset classes.
DELIVERING SUSTAINABLE RETURNS To ensure sustainable growth in the Group’s ROE in the long run, the Group will maintain a judicious balance between operating assets that are contributing to the current income, and projects under development which provide for future growth.
CapitaLand also intends to increase and maintain the proportion of cash profit to more than half of total PATMI. This is in line with the Group’s policy to grow the core dividend for shareholders on a sustainable basis. For FY 2013, the Board has
CapitaLand’s average debt maturity profile remains stable at 3.6 years
Average Debt Maturity Profile
3.6 years
CapitaLand Limited Annual Report 2013 10 Clarity
recommended a final ordinary dividend of 8 Singapore cents a share compared with 7 cents previously, which represents a 14% increase.
DEVELOPING HUMAN CAPITALCapitaLand recognises the importance of attracting and recruiting the right talent. The Group actively identifies talent both internally and externally for future leadership succession and places great emphasis on building bench strength. In-house training and development programmes are conducted by the CapitaLand Institute of Management and Business, and Ascott Centre for Excellence. For employees who have been identified to assume senior positions, CapitaLand offers opportunities for them to pursue management courses at external
renowned universities. The Group has a well-trained pool of talent ready to bring the Group to the next phase of development. To better attract, motivate and retain talent, CapitaLand believes in rewarding employees with competitive compensation and benefits as well as providing a positive work environment.
CORPORATE SOCIAL RESPONSIBILITYThe Group remains committed to the sustainable development of its business, the environment and the well-being of stakeholders and communities in which it operates. As part of CapitaLand’s corporate social responsibility efforts and to commemorate its 13th anniversary, 200 senior management and staff helped to refurbish homes and create study corners for 20 underprivileged
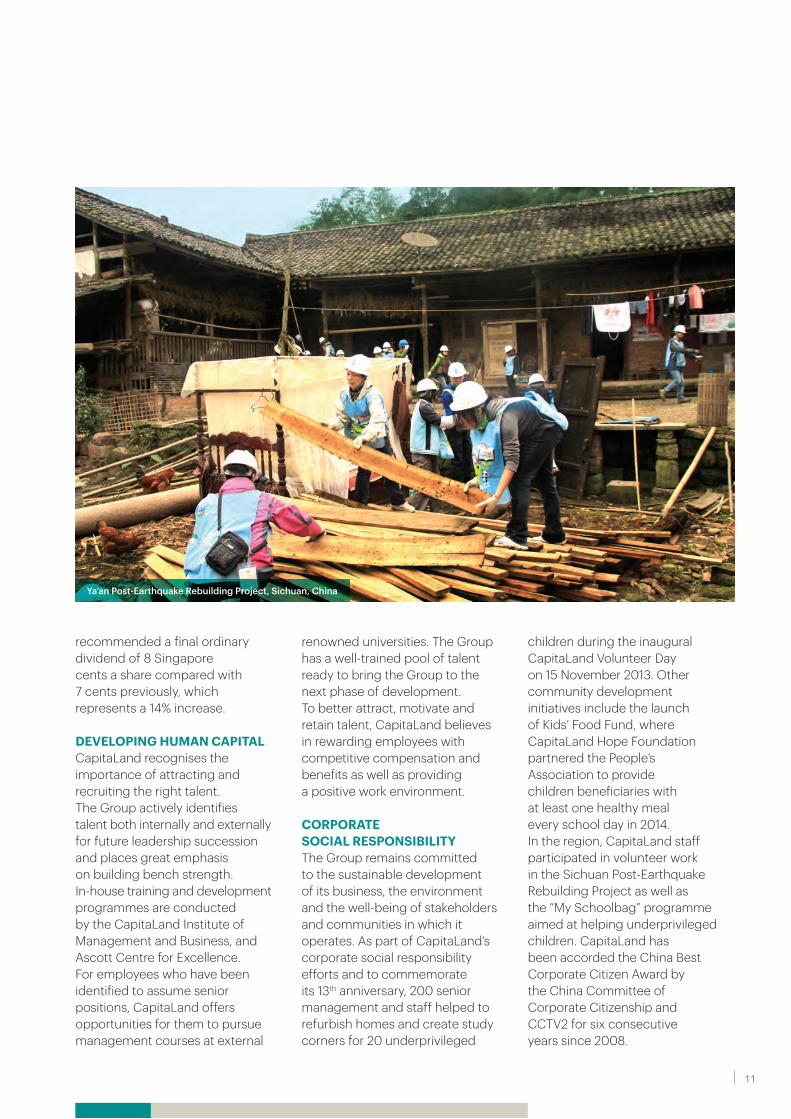
children during the inaugural CapitaLand Volunteer Day on 15 November 2013. Other community development initiatives include the launch of Kids’ Food Fund, where CapitaLand Hope Foundation partnered the People’s Association to provide children beneficiaries with at least one healthy meal every school day in 2014. In the region, CapitaLand staff participated in volunteer work in the Sichuan Post-Earthquake Rebuilding Project as well as the “My Schoolbag” programme aimed at helping underprivileged children. CapitaLand has been accorded the China Best Corporate Citizen Award by the China Committee of Corporate Citizenship and CCTV2 for six consecutive years since 2008.
Ya’an Post-Earthquake Rebuilding Project, Sichuan, China
11
Letter to Shareholders
The Group aims to be a leader in sustainability. It is ranked in the Global 100 Most Sustainable Corporations in the World by Corporate Knights and listed in The Sustainability Yearbook. CapitaLand is also named the Regional Sector Leader for Asia and the Global Sector Leader in the ‘Diversified’ property category by the Global Real Estate Sustainability Benchmark. The Group is listed in the Dow Jones Sustainability World Index (DJSI World) 2013/2014 and the Dow Jones Sustainability Asia Pacific Index (DJSI Asia Pacific) 2013/2014, and remains the first and largest real estate company in Asia to achieve ISO 14001 and OHSAS 18001 certification for its Environmental, Health and Safety Management System covering 15 countries since 2012.
BOARDMrs Arfat Pannir Selvam and Professor Kenneth Stuart Courtis, who have served with distinction on the CapitaLand Board for eight and seven years respectively, will not be seeking re-election as Directors at the forthcoming Annual General Meeting. On behalf of the Board and staff, we extend our deep appreciation to Mrs Selvam and Professor Courtis for all their invaluable contributions and wish them well in their future endeavours.
LOOKING FORWARDCapitaLand is cautiously optimistic for 2014 as the global economy continues its recovery. The Group will build on its various growth platforms while exploring new opportunities. CapitaLand will continue to deepen its presence in the two core markets of Singapore and China, as well as strengthen its leadership position in integrated or mixed-use developments, shopping malls and serviced residences. Coupled with a strong balance sheet and prudent capital management, the Group is well-positioned for its next phase of sustainable growth.
On behalf of the Board and management, we would like to thank all staff, our shareholders, customers, business partners and associates for their continued support for the Group.
NG KEE CHOEChairman
LIM MING YANPresident & Group CEO
28 February 2014
CapitaLand will continue to deepen its presence in the two core markets of Singapore and China
CapitaLand Limited Annual Report 2013 12 Clarity
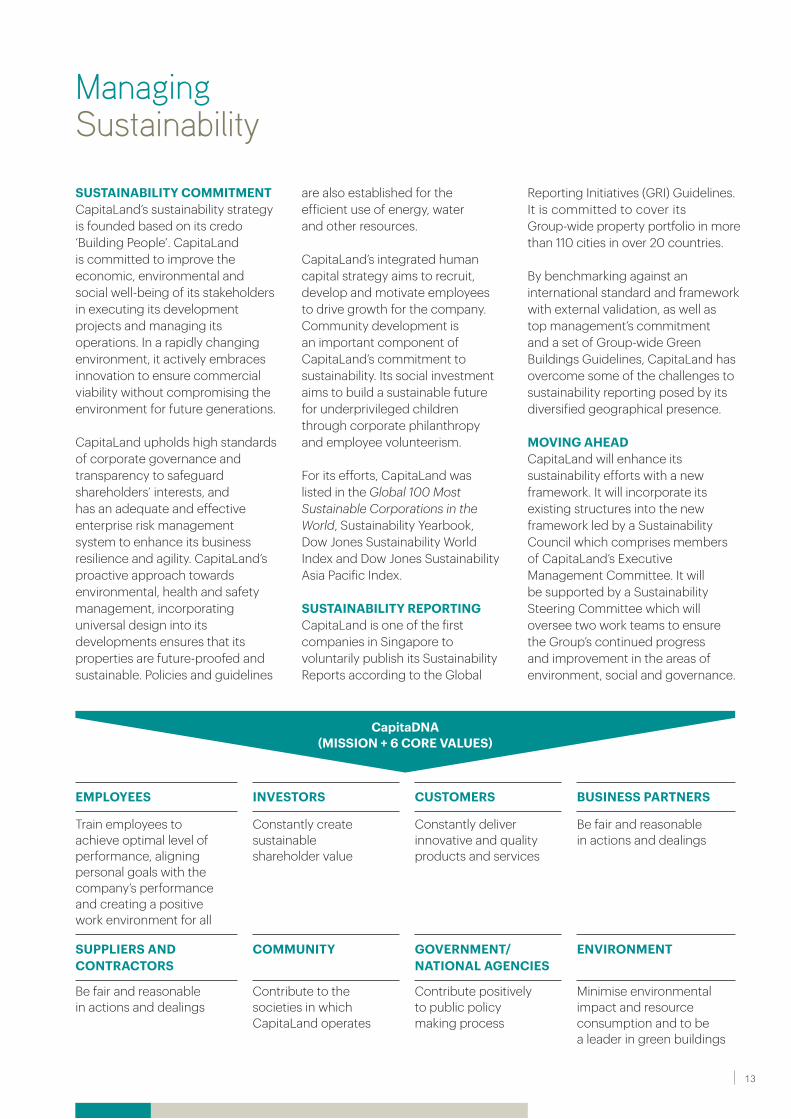
CapitaDNA (MISSION + 6 CORE VALUES)
EMPLOYEES INVESTORS CUSTOMERS BUSINESS PARTNERS
Train employees to achieve optimal level of performance, aligning personal goals with the company’s performance and creating a positive work environment for all
Constantly create sustainable shareholder value
Constantly deliver innovative and quality products and services
Be fair and reasonable in actions and dealings
SUPPLIERS AND CONTRACTORS
COMMUNITY GOVERNMENT/NATIONAL AGENCIES
ENVIRONMENT
Be fair and reasonable in actions and dealings
Contribute to the societies in whichCapitaLand operates
Contribute positively to public policy making process
Minimise environmental impact and resource consumption and to be a leader in green buildings
ManagingSustainability
SUSTAINABILITY COMMITMENTCapitaLand’s sustainability strategy is founded based on its credo ‘Building People’. CapitaLand is committed to improve the economic, environmental and social well-being of its stakeholders in executing its development projects and managing its operations. In a rapidly changing environment, it actively embraces innovation to ensure commercial viability without compromising the environment for future generations.
CapitaLand upholds high standards of corporate governance and transparency to safeguard shareholders’ interests, and has an adequate and effective enterprise risk management system to enhance its business resilience and agility. CapitaLand’s proactive approach towards environmental, health and safety management, incorporating universal design into its developments ensures that its properties are future-proofed and sustainable. Policies and guidelines
are also established for the efficient use of energy, water and other resources.
CapitaLand’s integrated human capital strategy aims to recruit, develop and motivate employees to drive growth for the company. Community development is an important component of CapitaLand’s commitment to sustainability. Its social investment aims to build a sustainable future for underprivileged children through corporate philanthropy and employee volunteerism.
For its efforts, CapitaLand was listed in the Global 100 Most Sustainable Corporations in the World, Sustainability Yearbook, Dow Jones Sustainability World Index and Dow Jones Sustainability Asia Pacific Index.
SUSTAINABILITY REPORTINGCapitaLand is one of the first companies in Singapore to voluntarily publish its Sustainability Reports according to the Global
Reporting Initiatives (GRI) Guidelines. It is committed to cover its Group-wide property portfolio in more than 110 cities in over 20 countries.
By benchmarking against an international standard and framework with external validation, as well as top management’s commitment and a set of Group-wide Green Buildings Guidelines, CapitaLand has overcome some of the challenges to sustainability reporting posed by its diversified geographical presence.
MOVING AHEADCapitaLand will enhance its sustainability efforts with a new framework. It will incorporate its existing structures into the new framework led by a Sustainability Council which comprises members of CapitaLand’s Executive Management Committee. It will be supported by a Sustainability Steering Committee which will oversee two work teams to ensure the Group’s continued progress and improvement in the areas of environment, social and governance.
13
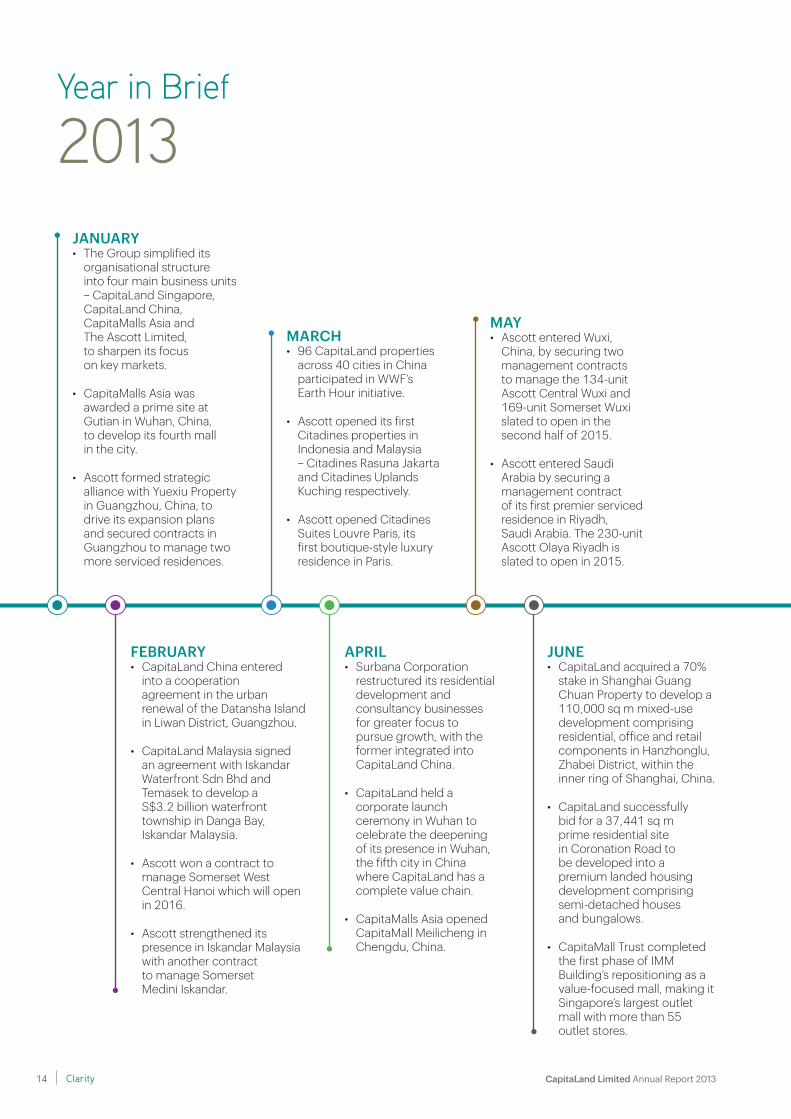
JANUARY• The Group simplified its
organisational structure into four main business units – CapitaLand Singapore, CapitaLand China, CapitaMalls Asia and The Ascott Limited, to sharpen its focus on key markets.
• CapitaMalls Asia was awarded a prime site at Gutian in Wuhan, China, to develop its fourth mall in the city.
• Ascott formed strategic alliance with Yuexiu Property in Guangzhou, China, to drive its expansion plans and secured contracts in Guangzhou to manage two more serviced residences.
FEBRUARY• CapitaLand China entered
into a cooperation agreement in the urban renewal of the Datansha Island in Liwan District, Guangzhou.
• CapitaLand Malaysia signed an agreement with Iskandar Waterfront Sdn Bhd and Temasek to develop a S$3.2 billion waterfront township in Danga Bay, Iskandar Malaysia.
• Ascott won a contract to manage Somerset West Central Hanoi which will open in 2016.
• Ascott strengthened its presence in Iskandar Malaysia with another contract to manage Somerset Medini Iskandar.
APRIL• Surbana Corporation
restructured its residential development and consultancy businesses for greater focus to pursue growth, with the former integrated into CapitaLand China.
• CapitaLand held a corporate launch ceremony in Wuhan to celebrate the deepening of its presence in Wuhan, the fifth city in China where CapitaLand has a complete value chain.
• CapitaMalls Asia opened CapitaMall Meilicheng in Chengdu, China.
MARCH• 96 CapitaLand properties
across 40 cities in China participated in WWF’s Earth Hour initiative.
• Ascott opened its first Citadines properties in Indonesia and Malaysia – Citadines Rasuna Jakarta and Citadines Uplands Kuching respectively.
• Ascott opened Citadines Suites Louvre Paris, its first boutique-style luxury residence in Paris.
JUNE• CapitaLand acquired a 70%
stake in Shanghai Guang Chuan Property to develop a 110,000 sq m mixed-use development comprising residential, office and retail components in Hanzhonglu, Zhabei District, within the inner ring of Shanghai, China.
• CapitaLand successfully bid for a 37,441 sq m prime residential site in Coronation Road to be developed into a premium landed housing development comprising semi-detached houses and bungalows.
• CapitaMall Trust completed the first phase of IMM Building’s repositioning as a value-focused mall, making it Singapore’s largest outlet mall with more than 55 outlet stores.
Year in Brief
2013
MAY• Ascott entered Wuxi,
China, by securing two management contracts to manage the 134-unit Ascott Central Wuxi and 169-unit Somerset Wuxi slated to open in the second half of 2015.
• Ascott entered Saudi Arabia by securing a management contract of its first premier serviced residence in Riyadh, Saudi Arabia. The 230-unit Ascott Olaya Riyadh is slated to open in 2015.
CapitaLand Limited Annual Report 2013 14 Clarity
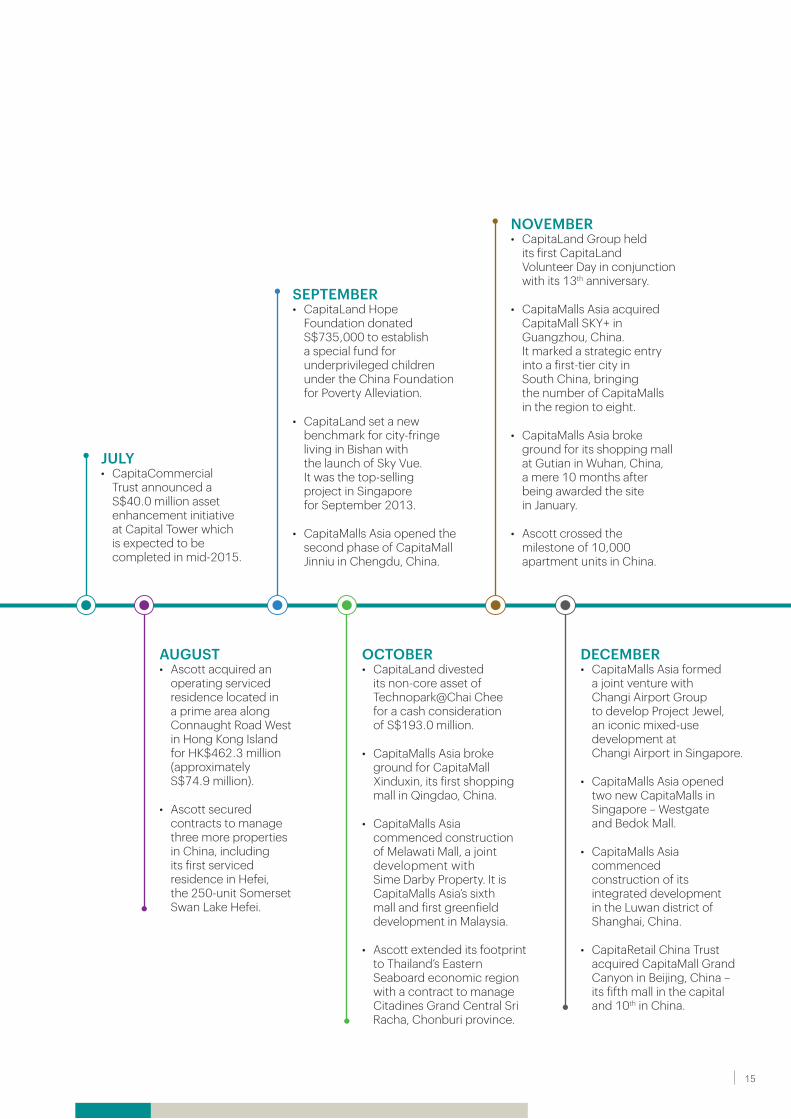
DECEMBER• CapitaMalls Asia formed
a joint venture with Changi Airport Group to develop Project Jewel, an iconic mixed-use development at Changi Airport in Singapore.
• CapitaMalls Asia opened two new CapitaMalls in Singapore – Westgate and Bedok Mall.
• CapitaMalls Asia commenced construction of its integrated development in the Luwan district of Shanghai, China.
• CapitaRetail China Trust acquired CapitaMall Grand Canyon in Beijing, China – its fifth mall in the capital and 10th in China.
SEPTEMBER• CapitaLand Hope
Foundation donated S$735,000 to establish a special fund for underprivileged children under the China Foundation for Poverty Alleviation.
• CapitaLand set a new benchmark for city-fringe living in Bishan with the launch of Sky Vue. It was the top-selling project in Singapore for September 2013.
• CapitaMalls Asia opened the second phase of CapitaMall Jinniu in Chengdu, China.
NOVEMBER• CapitaLand Group held
its first CapitaLand Volunteer Day in conjunction with its 13th anniversary.
• CapitaMalls Asia acquired CapitaMall SKY+ in Guangzhou, China. It marked a strategic entry into a first-tier city in South China, bringing the number of CapitaMalls in the region to eight.
• CapitaMalls Asia broke ground for its shopping mall at Gutian in Wuhan, China, a mere 10 months after being awarded the site in January.
• Ascott crossed the milestone of 10,000 apartment units in China.
JULY• CapitaCommercial
Trust announced a S$40.0 million asset enhancement initiative at Capital Tower which is expected to be completed in mid-2015.
AUGUST• Ascott acquired an
operating serviced residence located in a prime area along Connaught Road West in Hong Kong Island for HK$462.3 million (approximately S$74.9 million).
• Ascott secured contracts to manage three more properties in China, including its first serviced residence in Hefei, the 250-unit Somerset Swan Lake Hefei.
OCTOBER• CapitaLand divested
its non-core asset of Technopark@Chai Chee for a cash consideration of S$193.0 million.
• CapitaMalls Asia broke ground for CapitaMall Xinduxin, its first shopping mall in Qingdao, China.
• CapitaMalls Asia commenced construction of Melawati Mall, a joint development with Sime Darby Property. It is CapitaMalls Asia’s sixth mall and first greenfield development in Malaysia.
• Ascott extended its footprint to Thailand’s Eastern Seaboard economic region with a contract to manage Citadines Grand Central Sri Racha, Chonburi province.
15
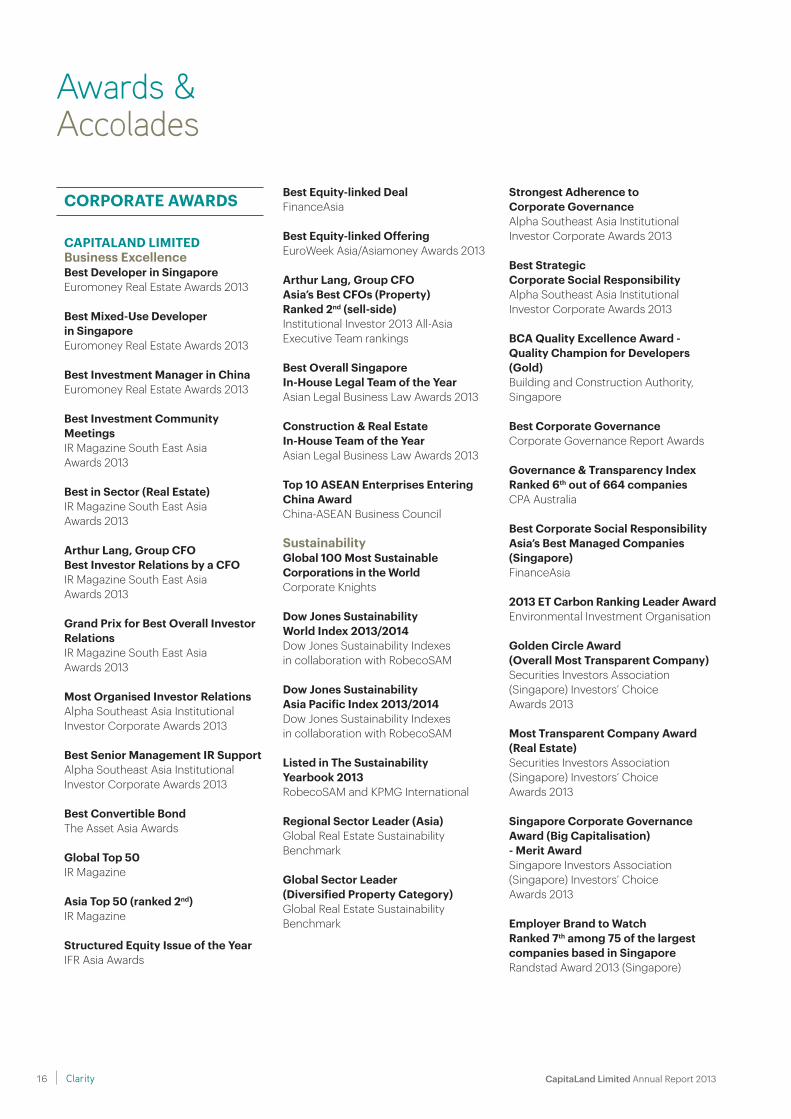
Awards &Accolades
CAPITALAND LIMITEDBusiness ExcellenceBest Developer in SingaporeEuromoney Real Estate Awards 2013
Best Mixed-Use Developer in SingaporeEuromoney Real Estate Awards 2013
Best Investment Manager in ChinaEuromoney Real Estate Awards 2013
Best Investment Community MeetingsIR Magazine South East Asia Awards 2013
Best in Sector (Real Estate)IR Magazine South East Asia Awards 2013
Arthur Lang, Group CFOBest Investor Relations by a CFO IR Magazine South East Asia Awards 2013
Grand Prix for Best Overall Investor RelationsIR Magazine South East Asia Awards 2013
Most Organised Investor RelationsAlpha Southeast Asia Institutional Investor Corporate Awards 2013
Best Senior Management IR SupportAlpha Southeast Asia Institutional Investor Corporate Awards 2013
Best Convertible BondThe Asset Asia Awards
Global Top 50IR Magazine
Asia Top 50 (ranked 2nd)IR Magazine
Structured Equity Issue of the YearIFR Asia Awards
Best Equity-linked DealFinanceAsia
Best Equity-linked OfferingEuroWeek Asia/Asiamoney Awards 2013
Arthur Lang, Group CFOAsia’s Best CFOs (Property) Ranked 2nd (sell-side)Institutional Investor 2013 All-Asia Executive Team rankings
Best Overall Singapore In-House Legal Team of the YearAsian Legal Business Law Awards 2013
Construction & Real Estate In-House Team of the YearAsian Legal Business Law Awards 2013
Top 10 ASEAN Enterprises Entering China AwardChina-ASEAN Business Council
Sustainability Global 100 Most Sustainable Corporations in the World Corporate Knights
Dow Jones Sustainability World Index 2013/2014Dow Jones Sustainability Indexes in collaboration with RobecoSAM
Dow Jones Sustainability Asia Pacific Index 2013/2014Dow Jones Sustainability Indexes in collaboration with RobecoSAM
Listed in The Sustainability Yearbook 2013RobecoSAM and KPMG International
Regional Sector Leader (Asia)Global Real Estate Sustainability Benchmark
Global Sector Leader (Diversified Property Category) Global Real Estate Sustainability Benchmark
Strongest Adherence to Corporate GovernanceAlpha Southeast Asia Institutional Investor Corporate Awards 2013
Best Strategic Corporate Social ResponsibilityAlpha Southeast Asia Institutional Investor Corporate Awards 2013
BCA Quality Excellence Award - Quality Champion for Developers (Gold) Building and Construction Authority, Singapore
Best Corporate GovernanceCorporate Governance Report Awards
Governance & Transparency Index Ranked 6th out of 664 companiesCPA Australia
Best Corporate Social ResponsibilityAsia’s Best Managed Companies (Singapore)FinanceAsia
2013 ET Carbon Ranking Leader Award Environmental Investment Organisation
Golden Circle Award (Overall Most Transparent Company)Securities Investors Association (Singapore) Investors’ Choice Awards 2013
Most Transparent Company Award (Real Estate)Securities Investors Association (Singapore) Investors’ Choice Awards 2013
Singapore Corporate Governance Award (Big Capitalisation) - Merit AwardSingapore Investors Association (Singapore) Investors’ Choice Awards 2013
Employer Brand to WatchRanked 7th among 75 of the largest companies based in SingaporeRandstad Award 2013 (Singapore)
CORPORATE AWARDS
CapitaLand Limited Annual Report 2013 16 Clarity
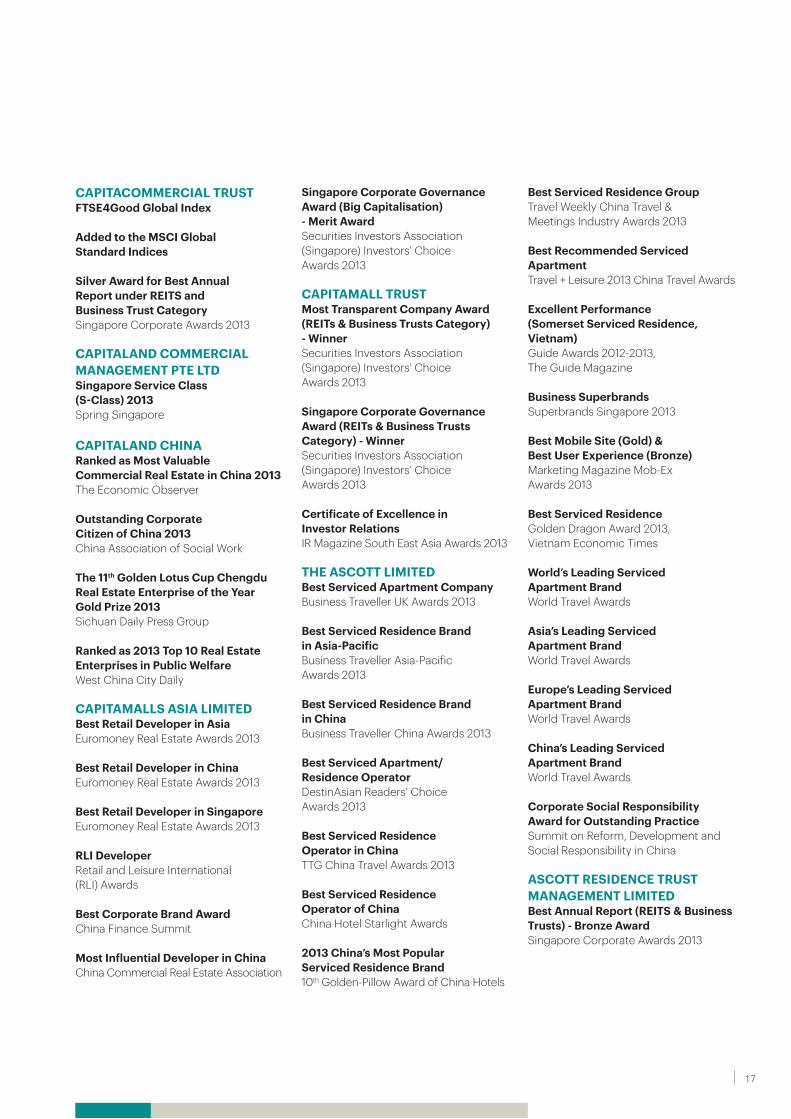
CAPITACOMMERCIAL TRUSTFTSE4Good Global Index
Added to the MSCI Global Standard Indices
Silver Award for Best Annual Report under REITS and Business Trust CategorySingapore Corporate Awards 2013
CAPITALAND COMMERCIAL MANAGEMENT PTE LTDSingapore Service Class (S-Class) 2013Spring Singapore
CAPITALAND CHINARanked as Most Valuable Commercial Real Estate in China 2013The Economic Observer
Outstanding Corporate Citizen of China 2013China Association of Social Work
The 11th Golden Lotus Cup Chengdu Real Estate Enterprise of the Year Gold Prize 2013Sichuan Daily Press Group
Ranked as 2013 Top 10 Real Estate Enterprises in Public WelfareWest China City Daily
CAPITAMALLS ASIA LIMITEDBest Retail Developer in Asia Euromoney Real Estate Awards 2013
Best Retail Developer in China Euromoney Real Estate Awards 2013
Best Retail Developer in Singapore Euromoney Real Estate Awards 2013
RLI DeveloperRetail and Leisure International (RLI) Awards
Best Corporate Brand Award China Finance Summit
Most Influential Developer in China China Commercial Real Estate Association
Singapore Corporate Governance Award (Big Capitalisation) - Merit Award Securities Investors Association (Singapore) Investors’ Choice Awards 2013
CAPITAMALL TRUST Most Transparent Company Award(REITs & Business Trusts Category) - Winner Securities Investors Association (Singapore) Investors’ Choice Awards 2013
Singapore Corporate Governance Award (REITs & Business Trusts Category) - Winner Securities Investors Association (Singapore) Investors’ Choice Awards 2013
Certificate of Excellence in Investor RelationsIR Magazine South East Asia Awards 2013
THE ASCOTT LIMITED Best Serviced Apartment CompanyBusiness Traveller UK Awards 2013
Best Serviced Residence Brand in Asia-PacificBusiness Traveller Asia-Pacific Awards 2013
Best Serviced Residence Brand in ChinaBusiness Traveller China Awards 2013
Best Serviced Apartment/Residence OperatorDestinAsian Readers’ Choice Awards 2013
Best Serviced Residence Operator in ChinaTTG China Travel Awards 2013
Best Serviced Residence Operator of ChinaChina Hotel Starlight Awards
2013 China’s Most Popular Serviced Residence Brand10th Golden-Pillow Award of China Hotels
Best Serviced Residence GroupTravel Weekly China Travel & Meetings Industry Awards 2013
Best Recommended Serviced ApartmentTravel + Leisure 2013 China Travel Awards
Excellent Performance (Somerset Serviced Residence, Vietnam)Guide Awards 2012-2013, The Guide Magazine
Business SuperbrandsSuperbrands Singapore 2013
Best Mobile Site (Gold) & Best User Experience (Bronze)Marketing Magazine Mob-Ex Awards 2013
Best Serviced ResidenceGolden Dragon Award 2013, Vietnam Economic Times
World’s Leading Serviced Apartment BrandWorld Travel Awards
Asia’s Leading Serviced Apartment BrandWorld Travel Awards
Europe’s Leading Serviced Apartment BrandWorld Travel Awards
China’s Leading Serviced Apartment BrandWorld Travel Awards
Corporate Social Responsibility Award for Outstanding PracticeSummit on Reform, Development and Social Responsibility in China
ASCOTT RESIDENCE TRUST MANAGEMENT LIMITED Best Annual Report (REITS & Business Trusts) - Bronze AwardSingapore Corporate Awards 2013
17
SINGAPORE Marine Parade Condominium Development Green Mark GoldPLUS
Building and Construction Authority, Singapore
Mixed Development at 15 Cairnhill Road (Residential component) Green Mark GoldPLUS
Building and Construction Authority, Singapore
d’LeedonUniversal Design Mark GoldPLUS (design) Building and Construction Authority, Singapore
The InterlaceUniversal Design Mark GoldPLUS
(design)Building and Construction Authority, Singapore
The InterlaceLandscape Excellence Assessment Framework Certification Scheme National Parks Board
Sky HabitatUniversal Design Mark Gold (design)Building and Construction Authority, Singapore
Sky VueUniversal Design Mark Gold (design)Building and Construction Authority, Singapore
Sky VuePeople’s Choice Awards (Most Popular Singapore Property Award)iProperty.com
The Nassim Universal Design Mark Gold (design) Building and Construction Authority, Singapore
Awards &Accolades
CHINADolce Vita (C1-C8), GuangzhouGreen Mark Certified (Provisional)Building and Construction Authority, Singapore
Riverside Ville, FoshanGreen Mark CertifiedUS Green Building Council
Beaufort, BeijingLeadership in Energy and Environmental Design (LEED) CertifiedUS Green Building Council
The Star VistaRLI International Retail and Leisure Destination (Highly Commended)Retail and Leisure International (RLI) Awards
JCubeUniversal Design Mark GoldPLUS Building and Construction Authority, Singapore
Tampines Mall Green Mark Gold Building and Construction Authority, Singapore
CHINACapitaMall Shawan, ChengduRetail Responsibility AwardSecond Annual Chengdu Retail Awards
CapitaMall Wusheng, WuhanCity Advancement AwardMall China Golden Mall Awards
CapitaMall Xuefu, HarbinUrban Shopping Mall Award Mall China Golden Mall Awards
Suzhou integrated development, SuzhouGold-level Pre-Certification Leadership in Energy and Environmental Design (LEED)US Green Building Council
CapitaMall Xindicheng, Xi’anGreen Mark Certified (Provisional)Building and Construction Authority, Singapore
CapitaMall Fucheng (Phase 2), MianyangGreen Mark Certified (Provisional)Building and Construction Authority, Singapore
MALAYSIAGurney Plaza, PenangBest Shopping Experience Excellence AwardExpatriate Lifestyle Readers’ Choice Best of Malaysia Awards
The Mines, SelangorGreen Mark Gold (Provisional) Building and Construction Authority, Singapore
RESIDENTIAL
COMMERCIAL
SHOPPING MALLS
SINGAPORE CapitaGreenUniversal Design Mark GoldPLUS (design) Building and Construction Authority, Singapore
Capital TowerGreen Mark Platinum Building and Construction Authority, Singapore
Golden Shoe Car ParkGreen Mark GoldPLUS
Building and Construction Authority, Singapore
SINGAPORE ION OrchardInternational FIABCI Prix d’Excellence Gold Award (Retail Category)
Plaza SingapuraRLI Shopping Centre RenovationRetail and Leisure International (RLI) Awards
The Star VistaBest Retail and Leisure Development (Silver Award) MIPIM Asia Awards
CapitaLand Limited Annual Report 2013 18 Clarity
SINGAPORE Ascott Raffles Place SingaporeBest Serviced Residence in Asia-PacificBusiness Traveller Asia-Pacific Awards 2013
Ascott Raffles Place SingaporeTop 25 Hotels in SingaporeTripAdvisor Travellers’ Choice Awards 2013
CHINAAscott Raffles City ChengduChina’s Outstanding Serviced Apartment2013 Hotel Industry Development Summit
Ascott IFC GuangzhouBest Serviced Apartment of China8th China Hotel Starlight Awards
MALAYSIASomerset Ampang Kuala LumpurTop 25 Hotels in MalaysiaTripAdvisor Travellers’ Choice Awards 2013
Somerset Ampang Kuala LumpurBest 3 Serviced Residence in MalaysiaHospitality Asia Platinum Awards (HAPA) Malaysia 2013-2015
Ascott Kuala Lumpur Best 3 Serviced Residence in MalaysiaHospitality Asia Platinum Awards (HAPA) Malaysia 2013-2015
PHILIPPINESAscott Makati Philippines’ Leading Serviced ApartmentsWorld Travel Awards 2013
Ascott Makati Top 25 Luxury Hotels in the PhilippinesTripAdvisor Travellers’ Choice Awards 2013
FRANCE Citadines Suites Louvre Paris France’s Leading Serviced Apartments World Travel Awards 2013
Citadines Suites Louvre ParisHotel of the Year, Laurier De Bronze Lauriers du Voyage d’Affaires 2013
INDONESIA Ascott Jakarta Indonesia’s Leading Serviced ApartmentsWorld Travel Awards 2013
Ascott Jakarta Green Mark Certified (Provisional)Building and Construction Authority, Singapore
JAPANCitadines Shinjuku Tokyo Top 25 Hotels in JapanTripAdvisor Travellers’ Choice Awards 2013
Citadines Karasuma-Gojo Kyoto Top 25 Hotels in Japan and Top 25 Hotels for Service in Japan TripAdvisor Travellers’ Choice Awards 2013
UNITED KINGDOM Citadines Prestige Trafalgar Square London England’s Leading Serviced ApartmentsWorld Travel Awards 2013
CHINARaffles City Shenzhen (Mall) Gold-level Pre-CertificationLeadership in Energy and Environmental Design (LEED) US Green Building Council
Raffles City Shenzhen (International Grade A Office)Gold-level Pre-CertificationLeadership in Energy and Environmental Design (LEED) US Green Building Council
Raffles City HangzhouChina (Hangzhou) Internet Media Award Most International New Business LandmarkSina House Online Real Estate Media
Raffles City NingboThe 8th Gold Property Award Best Commercial Space Design of the Year First PrizeTimes House Magazine
SERVICED RESIDENCES
MIXED-USE DEVELOPMENTS
SINGAPOREWestgate & Westgate TowerGreen Mark Platinum Universal Design Mark GoldPLUS (design) Building and Construction Authority, Singapore
Bedok Residences and Bedok MallUniversal Design Mark GoldPLUS (design) Building and Construction Authority, Singapore
19
Board ofDirectors
Ng Kee Choe, 69ChairmanIndependent Non-Executive DirectorBachelor of Science (Honours), University of Singapore
Date of first appointment as a director: 16 April 2010Date of appointment as Chairman: 1 May 2012Date of last re-election as a director: 26 April 2013Length of service as a director (as at 31 December 2013): 3 years 8 months
Board committees served on– Executive Resource and Compensation Committee (Chairman)– Finance and Budget Committee (Member)– Investment Committee (Chairman)– Nominating Committee (Member)
Present directorships in other listed companies– CapitaMalls Asia Limited (Chairman)– PT Bank Danamon Indonesia, Tbk (President-Commissioner)– Singapore Exchange Limited– SP AusNet (Chairman)
Present principal commitments(other than directorships in other listed companies)– Fullerton Financial Holdings Pte Ltd (Director)– NTUC Income Insurance Co-operative Limited (Special Advisor)– Tanah Merah Country Club (Chairman)
Directorship in other listed company held over the preceding three years– Singapore Airport Terminal Services Limited
Background and working experience– Vice-Chairman of DBS Group Holdings Ltd (DBS)– Retired from his executive position in DBS in July 2003
after 33 years of service
Awards– Distinguished Service Award by the Singapore National Trades Union Congress in 2013– The Meritorious Service Medal
at the Singapore National Day Awards 2012– The Public Service Star
at the Singapore National Day Awards 2001
CapitaLand Limited Annual Report 2013 Clarity20
Peter Seah Lim Huat, 67Deputy ChairmanIndependent Non-Executive DirectorBachelor of Business Administration (Honours), University of Singapore
Date of first appointment as a director: 18 December 2001Date of appointment as Deputy Chairman: 1 January 2009Date of last re-election as a director: 26 April 2013Length of service as a director (as at 31 December 2013): 12 years
Board committees served on– Executive Resource and Compensation Committee (Member) – Finance and Budget Committee (Chairman)– Nominating Committee (Chairman)
Present directorships in other listed companies– DBS Group Holdings Ltd (Chairman)– Level 3 Communications Inc– StarHub Ltd– STATS ChipPAC Ltd
Present principal commitments(other than directorships in other listed companies)– Asia Mobile Holdings Pte Ltd (Director)– DBS Bank Ltd (Chairman)– DBS Bank (Hong Kong) Limited (Chairman)– Fullerton Financial Holdings Pte Ltd (Director)– Government of Singapore Investment Corporation Pte Ltd
(Director)– LaSalle College of the Arts Limited (Chairman)– Singapore Health Services Pte Ltd (Chairman)– STT Communications Ltd (Director)
Directorships in other listed companies held over the preceding three years– Global Crossing Limited (Deputy Chairman)– Singapore Technologies Engineering Limited (Chairman)
Background and working experience– President & CEO of Singapore Technologies Pte Ltd
(From 2001 to 2004)– Joined Overseas Union Bank (OUB) in 1977 and
became President & CEO of OUB (From 1991 to 2001)
Award– The Distinguished Service Order
at the Singapore National Day Awards 2012
21Corporate Governance& Transparency
Manager Report
Board ofDirectors
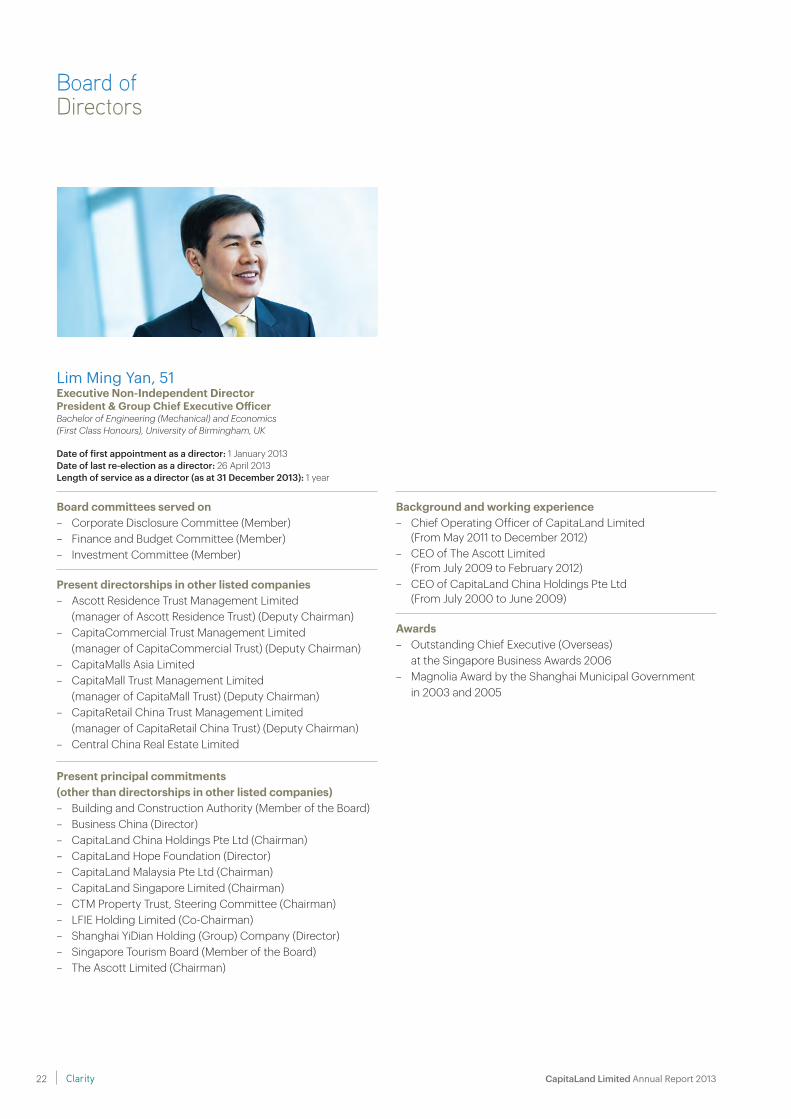
Lim Ming Yan, 51Executive Non-Independent DirectorPresident & Group Chief Executive Off icer Bachelor of Engineering (Mechanical) and Economics(First Class Honours), University of Birmingham, UK
Date of first appointment as a director: 1 January 2013Date of last re-election as a director: 26 April 2013Length of service as a director (as at 31 December 2013): 1 year
Board committees served on – Corporate Disclosure Committee (Member)– Finance and Budget Committee (Member)– Investment Committee (Member)
Present directorships in other listed companies– Ascott Residence Trust Management Limited
(manager of Ascott Residence Trust) (Deputy Chairman)– CapitaCommercial Trust Management Limited
(manager of CapitaCommercial Trust) (Deputy Chairman)– CapitaMalls Asia Limited– CapitaMall Trust Management Limited
(manager of CapitaMall Trust) (Deputy Chairman)– CapitaRetail China Trust Management Limited
(manager of CapitaRetail China Trust) (Deputy Chairman)– Central China Real Estate Limited
Present principal commitments(other than directorships in other listed companies)– Building and Construction Authority (Member of the Board)– Business China (Director)– CapitaLand China Holdings Pte Ltd (Chairman)– CapitaLand Hope Foundation (Director)– CapitaLand Malaysia Pte Ltd (Chairman)– CapitaLand Singapore Limited (Chairman)– CTM Property Trust, Steering Committee (Chairman)– LFIE Holding Limited (Co-Chairman)– Shanghai YiDian Holding (Group) Company (Director)– Singapore Tourism Board (Member of the Board)– The Ascott Limited (Chairman)
Background and working experience– Chief Operating Officer of CapitaLand Limited (From May 2011 to December 2012)– CEO of The Ascott Limited (From July 2009 to February 2012) – CEO of CapitaLand China Holdings Pte Ltd (From July 2000 to June 2009)
Awards– Outstanding Chief Executive (Overseas)
at the Singapore Business Awards 2006– Magnolia Award by the Shanghai Municipal Government
in 2003 and 2005
CapitaLand Limited Annual Report 2013 Clarity22
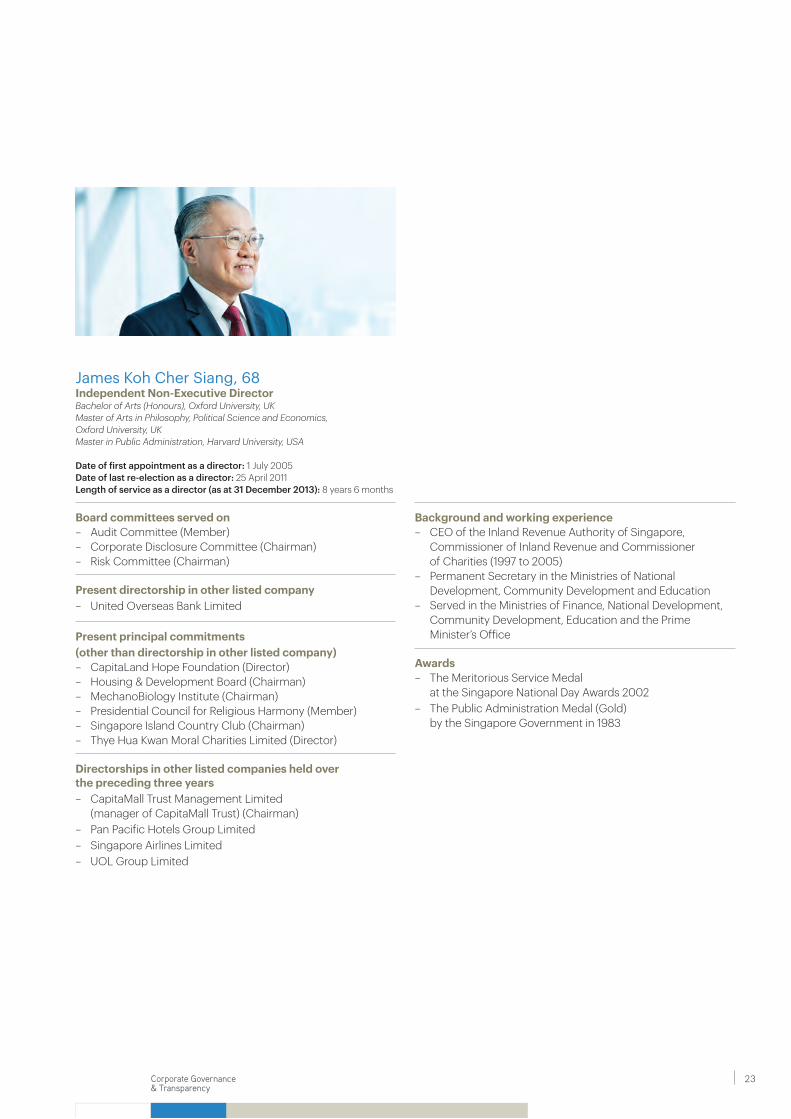
James Koh Cher Siang, 68Independent Non-Executive DirectorBachelor of Arts (Honours), Oxford University, UKMaster of Arts in Philosophy, Political Science and Economics, Oxford University, UKMaster in Public Administration, Harvard University, USA
Date of first appointment as a director: 1 July 2005Date of last re-election as a director: 25 April 2011Length of service as a director (as at 31 December 2013): 8 years 6 months
Board committees served on– Audit Committee (Member)– Corporate Disclosure Committee (Chairman)– Risk Committee (Chairman)
Present directorship in other listed company– United Overseas Bank Limited
Present principal commitments(other than directorship in other listed company)– CapitaLand Hope Foundation (Director)– Housing & Development Board (Chairman)– MechanoBiology Institute (Chairman)– Presidential Council for Religious Harmony (Member)– Singapore Island Country Club (Chairman)– Thye Hua Kwan Moral Charities Limited (Director)
Directorships in other listed companies held over the preceding three years– CapitaMall Trust Management Limited
(manager of CapitaMall Trust) (Chairman)– Pan Pacific Hotels Group Limited– Singapore Airlines Limited– UOL Group Limited
Background and working experience– CEO of the Inland Revenue Authority of Singapore,
Commissioner of Inland Revenue and Commissioner of Charities (1997 to 2005)
– Permanent Secretary in the Ministries of National Development, Community Development and Education
– Served in the Ministries of Finance, National Development, Community Development, Education and the Prime Minister’s Office
Awards– The Meritorious Service Medal
at the Singapore National Day Awards 2002– The Public Administration Medal (Gold)
by the Singapore Government in 1983
23Corporate Governance& Transparency
Manager Report
Board ofDirectors
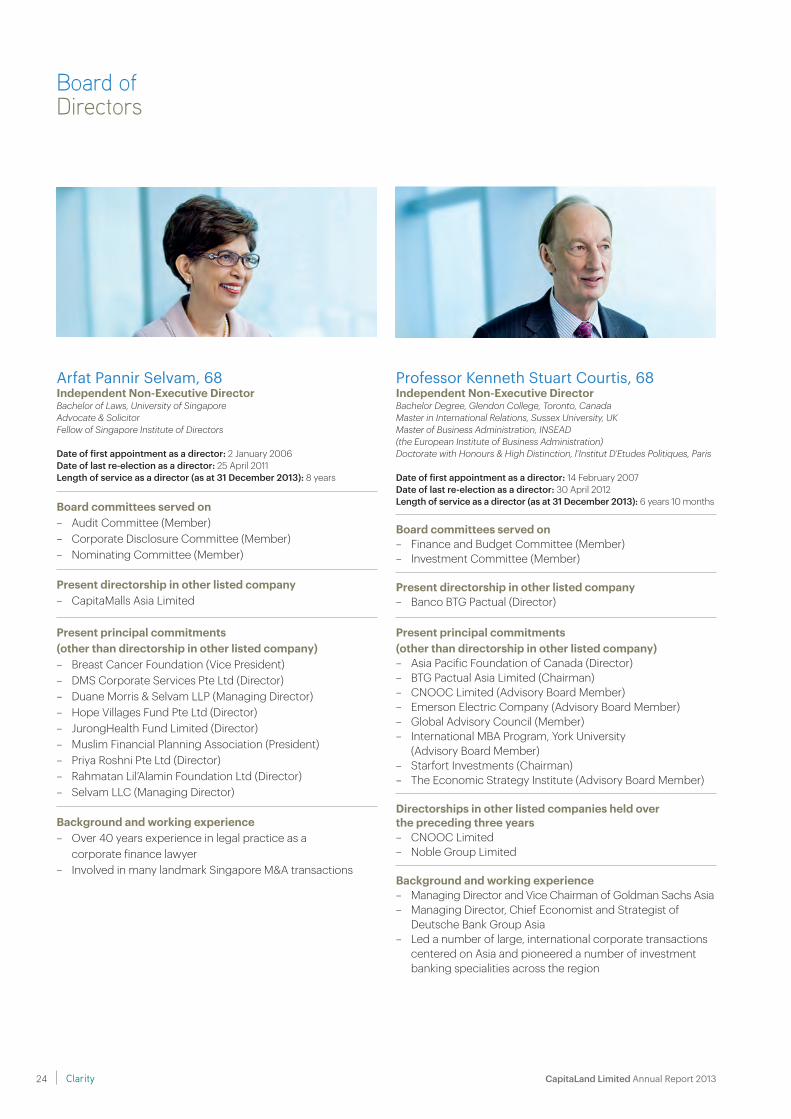
Professor Kenneth Stuart Courtis, 68Independent Non-Executive DirectorBachelor Degree, Glendon College, Toronto, CanadaMaster in International Relations, Sussex University, UKMaster of Business Administration, INSEAD(the European Institute of Business Administration)Doctorate with Honours & High Distinction, l’Institut D’Etudes Politiques, Paris
Date of first appointment as a director: 14 February 2007Date of last re-election as a director: 30 April 2012Length of service as a director (as at 31 December 2013): 6 years 10 months
Board committees served on– Finance and Budget Committee (Member)– Investment Committee (Member)
Present directorship in other listed company– Banco BTG Pactual (Director)
Present principal commitments(other than directorship in other listed company)– Asia Pacific Foundation of Canada (Director)– BTG Pactual Asia Limited (Chairman)– CNOOC Limited (Advisory Board Member)– Emerson Electric Company (Advisory Board Member)– Global Advisory Council (Member) – International MBA Program, York University
(Advisory Board Member)– Starfort Investments (Chairman)– The Economic Strategy Institute (Advisory Board Member)
Directorships in other listed companies held over the preceding three years– CNOOC Limited – Noble Group Limited
Background and working experience– Managing Director and Vice Chairman of Goldman Sachs Asia– Managing Director, Chief Economist and Strategist of
Deutsche Bank Group Asia– Led a number of large, international corporate transactions
centered on Asia and pioneered a number of investment banking specialities across the region
Arfat Pannir Selvam, 68Independent Non-Executive DirectorBachelor of Laws, University of SingaporeAdvocate & SolicitorFellow of Singapore Institute of Directors
Date of first appointment as a director: 2 January 2006Date of last re-election as a director: 25 April 2011Length of service as a director (as at 31 December 2013): 8 years
Board committees served on– Audit Committee (Member)– Corporate Disclosure Committee (Member)– Nominating Committee (Member)
Present directorship in other listed company– CapitaMalls Asia Limited
Present principal commitments(other than directorship in other listed company)– Breast Cancer Foundation (Vice President)– DMS Corporate Services Pte Ltd (Director)– Duane Morris & Selvam LLP (Managing Director)– Hope Villages Fund Pte Ltd (Director)– JurongHealth Fund Limited (Director)– Muslim Financial Planning Association (President)– Priya Roshni Pte Ltd (Director)– Rahmatan Lil’Alamin Foundation Ltd (Director)– Selvam LLC (Managing Director)
Background and working experience– Over 40 years experience in legal practice as a
corporate finance lawyer– Involved in many landmark Singapore M&A transactions
CapitaLand Limited Annual Report 2013 Clarity24
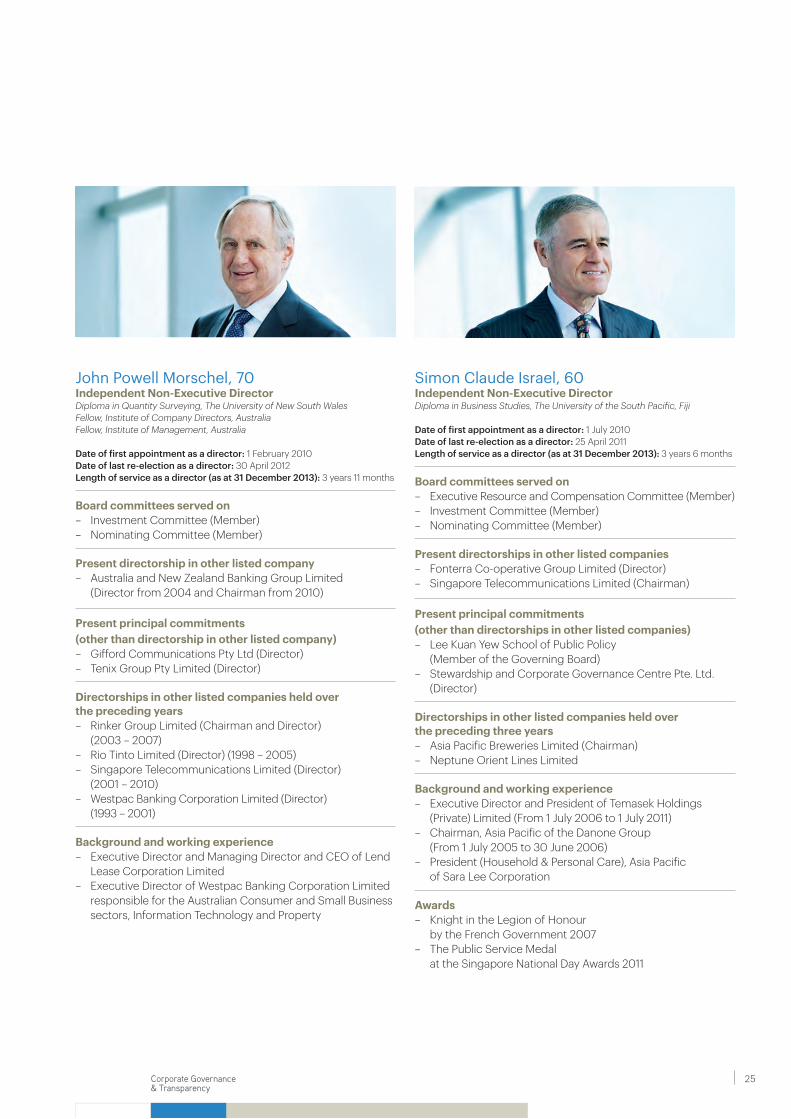
Simon Claude Israel, 60Independent Non-Executive DirectorDiploma in Business Studies, The University of the South Pacific, Fiji
Date of first appointment as a director: 1 July 2010Date of last re-election as a director: 25 April 2011Length of service as a director (as at 31 December 2013): 3 years 6 months
Board committees served on– Executive Resource and Compensation Committee (Member)– Investment Committee (Member)– Nominating Committee (Member)
Present directorships in other listed companies– Fonterra Co-operative Group Limited (Director)– Singapore Telecommunications Limited (Chairman)
Present principal commitments(other than directorships in other listed companies)– Lee Kuan Yew School of Public Policy
(Member of the Governing Board)– Stewardship and Corporate Governance Centre Pte. Ltd.
(Director)
Directorships in other listed companies held over the preceding three years– Asia Pacific Breweries Limited (Chairman)– Neptune Orient Lines Limited
Background and working experience– Executive Director and President of Temasek Holdings
(Private) Limited (From 1 July 2006 to 1 July 2011)– Chairman, Asia Pacific of the Danone Group
(From 1 July 2005 to 30 June 2006)– President (Household & Personal Care), Asia Pacific
of Sara Lee Corporation
Awards– Knight in the Legion of Honour
by the French Government 2007– The Public Service Medal
at the Singapore National Day Awards 2011
John Powell Morschel, 70Independent Non-Executive DirectorDiploma in Quantity Surveying, The University of New South WalesFellow, Institute of Company Directors, AustraliaFellow, Institute of Management, Australia
Date of first appointment as a director: 1 February 2010Date of last re-election as a director: 30 April 2012Length of service as a director (as at 31 December 2013): 3 years 11 months
Board committees served on– Investment Committee (Member)– Nominating Committee (Member)
Present directorship in other listed company– Australia and New Zealand Banking Group Limited
(Director from 2004 and Chairman from 2010)
Present principal commitments(other than directorship in other listed company)– Gifford Communications Pty Ltd (Director)– Tenix Group Pty Limited (Director)
Directorships in other listed companies held over the preceding years – Rinker Group Limited (Chairman and Director)
(2003 – 2007)– Rio Tinto Limited (Director) (1998 – 2005)– Singapore Telecommunications Limited (Director)
(2001 – 2010)– Westpac Banking Corporation Limited (Director)
(1993 – 2001)
Background and working experience– Executive Director and Managing Director and CEO of Lend
Lease Corporation Limited – Executive Director of Westpac Banking Corporation Limited
responsible for the Australian Consumer and Small Business sectors, Information Technology and Property
25Corporate Governance& Transparency
Manager Report
Board ofDirectors
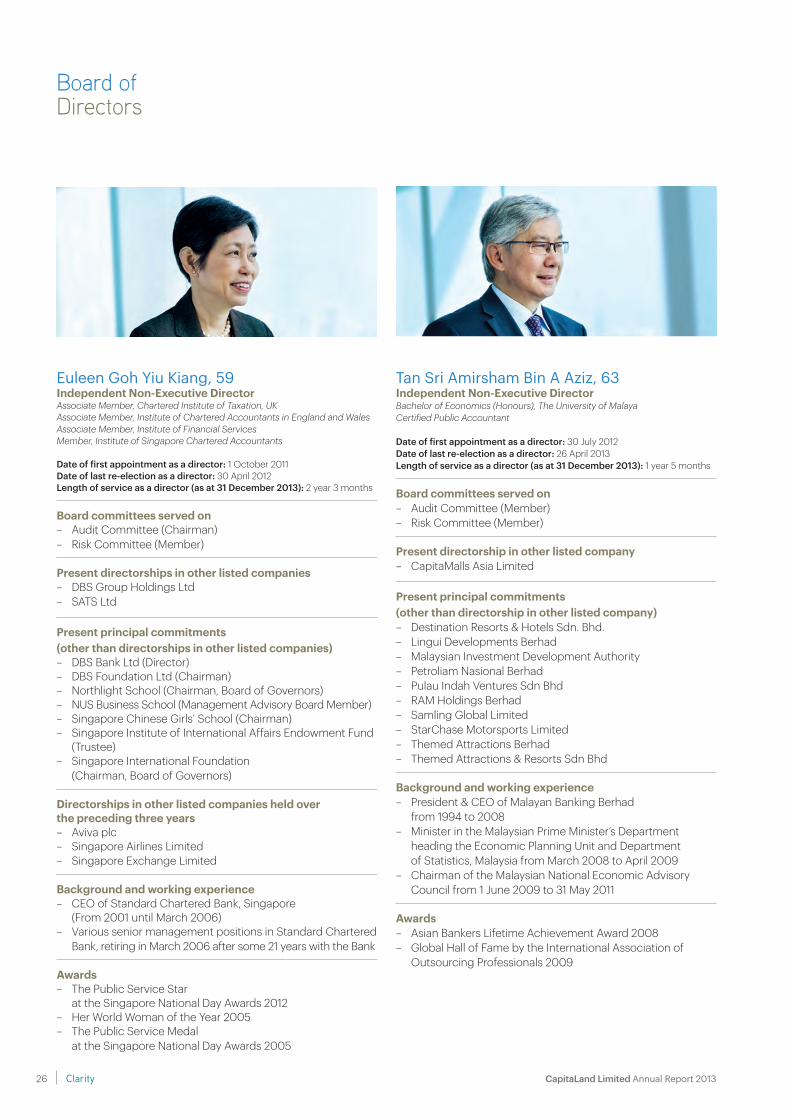
Tan Sri Amirsham Bin A Aziz, 63Independent Non-Executive DirectorBachelor of Economics (Honours), The University of MalayaCertified Public Accountant
Date of first appointment as a director: 30 July 2012Date of last re-election as a director: 26 April 2013Length of service as a director (as at 31 December 2013): 1 year 5 months
Board committees served on– Audit Committee (Member)– Risk Committee (Member)
Present directorship in other listed company– CapitaMalls Asia Limited
Present principal commitments(other than directorship in other listed company)– Destination Resorts & Hotels Sdn. Bhd.– Lingui Developments Berhad– Malaysian Investment Development Authority– Petroliam Nasional Berhad– Pulau Indah Ventures Sdn Bhd– RAM Holdings Berhad– Samling Global Limited– StarChase Motorsports Limited– Themed Attractions Berhad– Themed Attractions & Resorts Sdn Bhd
Background and working experience– President & CEO of Malayan Banking Berhad
from 1994 to 2008 – Minister in the Malaysian Prime Minister’s Department
heading the Economic Planning Unit and Department of Statistics, Malaysia from March 2008 to April 2009
– Chairman of the Malaysian National Economic Advisory Council from 1 June 2009 to 31 May 2011
Awards– Asian Bankers Lifetime Achievement Award 2008– Global Hall of Fame by the International Association of
Outsourcing Professionals 2009
Euleen Goh Yiu Kiang, 59Independent Non-Executive DirectorAssociate Member, Chartered Institute of Taxation, UKAssociate Member, Institute of Chartered Accountants in England and WalesAssociate Member, Institute of Financial ServicesMember, Institute of Singapore Chartered Accountants
Date of first appointment as a director: 1 October 2011Date of last re-election as a director: 30 April 2012Length of service as a director (as at 31 December 2013): 2 year 3 months
Board committees served on– Audit Committee (Chairman)– Risk Committee (Member)
Present directorships in other listed companies– DBS Group Holdings Ltd– SATS Ltd
Present principal commitments(other than directorships in other listed companies)– DBS Bank Ltd (Director)– DBS Foundation Ltd (Chairman)– Northlight School (Chairman, Board of Governors)– NUS Business School (Management Advisory Board Member)– Singapore Chinese Girls’ School (Chairman)– Singapore Institute of International Affairs Endowment Fund
(Trustee)– Singapore International Foundation
(Chairman, Board of Governors)
Directorships in other listed companies held over the preceding three years– Aviva plc– Singapore Airlines Limited– Singapore Exchange Limited
Background and working experience– CEO of Standard Chartered Bank, Singapore
(From 2001 until March 2006)– Various senior management positions in Standard Chartered
Bank, retiring in March 2006 after some 21 years with the Bank
Awards– The Public Service Star
at the Singapore National Day Awards 2012 – Her World Woman of the Year 2005– The Public Service Medal
at the Singapore National Day Awards 2005
CapitaLand Limited Annual Report 2013 Clarity26
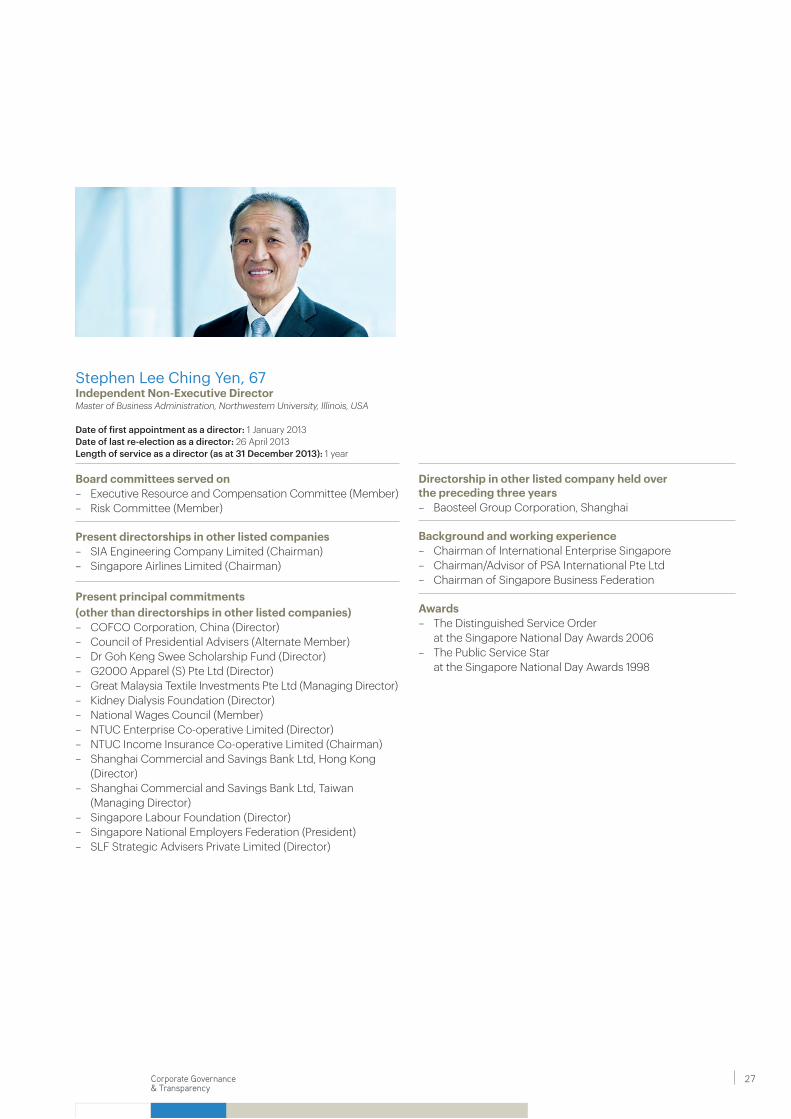
Stephen Lee Ching Yen, 67Independent Non-Executive DirectorMaster of Business Administration, Northwestern University, Illinois, USA
Date of first appointment as a director: 1 January 2013Date of last re-election as a director: 26 April 2013Length of service as a director (as at 31 December 2013): 1 year
Board committees served on– Executive Resource and Compensation Committee (Member)– Risk Committee (Member)
Present directorships in other listed companies– SIA Engineering Company Limited (Chairman)– Singapore Airlines Limited (Chairman)
Present principal commitments(other than directorships in other listed companies)– COFCO Corporation, China (Director)– Council of Presidential Advisers (Alternate Member)– Dr Goh Keng Swee Scholarship Fund (Director)– G2000 Apparel (S) Pte Ltd (Director) – Great Malaysia Textile Investments Pte Ltd (Managing Director)– Kidney Dialysis Foundation (Director)– National Wages Council (Member)– NTUC Enterprise Co-operative Limited (Director)– NTUC Income Insurance Co-operative Limited (Chairman)– Shanghai Commercial and Savings Bank Ltd, Hong Kong
(Director)– Shanghai Commercial and Savings Bank Ltd, Taiwan
(Managing Director)– Singapore Labour Foundation (Director)– Singapore National Employers Federation (President)– SLF Strategic Advisers Private Limited (Director)
Directorship in other listed company held over the preceding three years– Baosteel Group Corporation, Shanghai
Background and working experience– Chairman of International Enterprise Singapore – Chairman/Advisor of PSA International Pte Ltd– Chairman of Singapore Business Federation
Awards– The Distinguished Service Order
at the Singapore National Day Awards 2006– The Public Service Star
at the Singapore National Day Awards 1998
27Corporate Governance& Transparency
Manager Report
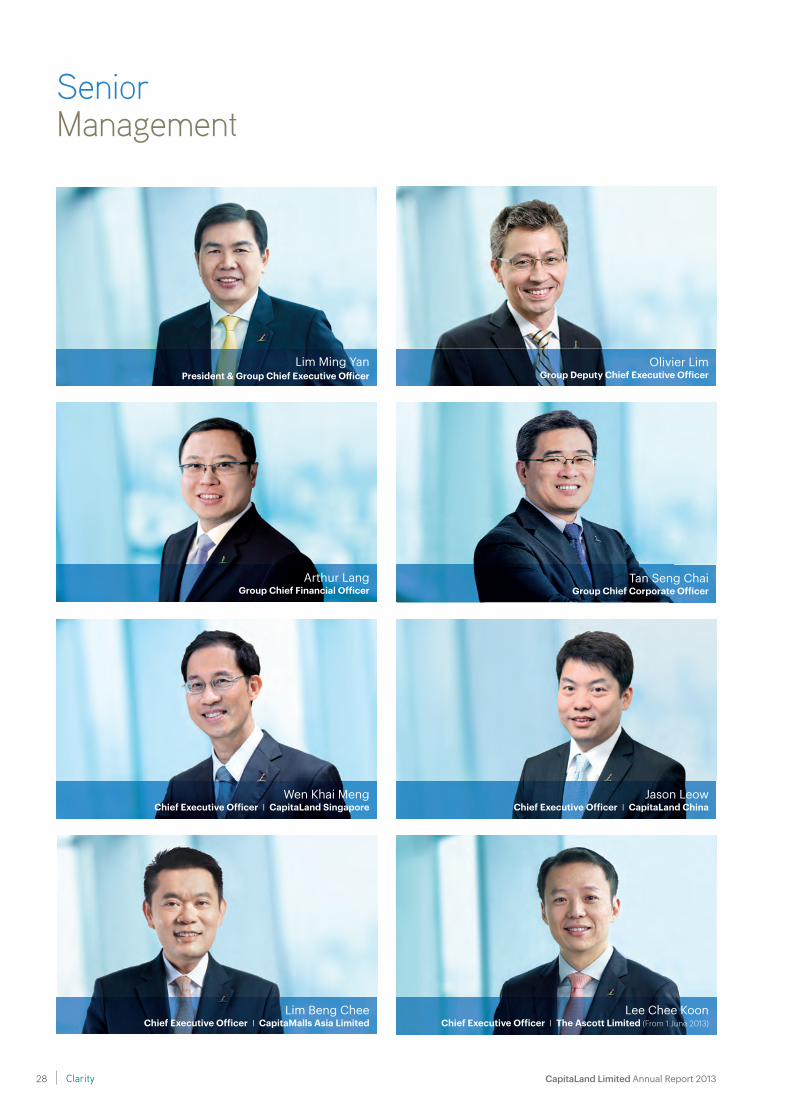
SeniorManagement
Olivier LimGroup Deputy Chief Executive Officer
Lim Ming YanPresident & Group Chief Executive Off icer
Jason LeowChief Executive Officer | CapitaLand China
Wen Khai MengChief Executive Officer | CapitaLand Singapore
Arthur LangGroup Chief Financial Officer
Tan Seng ChaiGroup Chief Corporate Officer
Lee Chee KoonChief Executive Officer | The Ascott Limited (From 1 June 2013)
Lim Beng CheeChief Executive Officer | CapitaMalls Asia Limited
CapitaLand Limited Annual Report 2013 Clarity28
Lim Ming YanPresident & Group CEO, CapitaLand Limited
Mr Lim Ming Yan is President & Group Chief Executive Officer of CapitaLand Limited. Mr Lim is Chairman of CapitaLand China Holdings Pte Ltd, The Ascott Limited, CapitaLand Singapore Limited, CapitaLand Malaysia Pte Ltd, CapitaLand Financial Limited and CapitaLand Regional Investments Limited. He is also Deputy Chairman of CapitaMall Trust Management Limited, CapitaCommercial Trust Management Limited, CapitaRetail China Trust Management Limited and Ascott Residence Trust Management Limited. He is the Director of CapitaMalls Asia Limited and CapitaLand Hope Foundation, the Group’s philanthropic arm.
Mr Lim is a Board Member of the Building and Construction Authority of Singapore, Director of Business China, an organisation that promotes bilingualism and biculturalism between Singapore and China, as well as Board Member of the Singapore Tourism Board.
Mr Lim was the Chief Operating Officer of CapitaLand from May 2011 to December 2012 and Chief Executive Officer of The Ascott Limited from July 2009 to February 2012. Prior to joining Ascott, Mr Lim was the Chief Executive Officer of CapitaLand China Holdings Pte Ltd from November 2000 to June 2009, responsible for growing CapitaLand into a leading foreign real estate developer in China.
Mr Lim was named Outstanding Chief Executive (Overseas) at the Singapore Business Awards 2006. He was also conferred the prestigious Magnolia Award by the Shanghai Municipal Government in 2003 and 2005 for his significant contributions to Shanghai.
Mr Lim obtained first class honours in Mechanical Engineering and Economics from the University of Birmingham, United Kingdom in 1985. He attended the Advanced Management Program at Harvard Business School in 2002.
Olivier LimGroup Deputy CEO, CapitaLand Limited
Mr Olivier Lim is the Group Deputy Chief Executive Officer of CapitaLand Limited. He is concurrently the non-executive Chairman of Australand Holdings Limited, and a non-executive director of CapitaMalls Asia Limited. Mr Lim also serves as a board member of Sentosa Development Corporation, and as the non-executive Chairman of its subsidiary, Mount Faber Leisure Group Pte Ltd.
Mr Lim joined CapitaLand Limited in 2003 after a total of 13 years with Citibank. His prior roles in CapitaLand included Group Chief Investment Officer until January 2013, Head of Strategic Corporate Development until February 2012, and Group Chief Financial Officer for six years until 2011. At Citibank, he held various roles in the corporate banking and investment banking in Singapore. His last position at the bank was as Head of the Real Estate Unit in the Corporate Bank.
Mr Lim was awarded Best Investor Relations by a CFO by IR Magazine for South East Asia for 2009, 2010 and 2011, and Pan-Asia for 2011. He was named CFO of the Year by The Asset magazine in its 2010 Asian Awards. He was also named CFO of the Year in 2007 (for firms with market value of S$500 million or more) in The Business Times’ Singapore Corporate Awards.
Mr Lim holds a First Class Honours degree in Civil Engineering from Imperial College, London.
Corporate Governance& Transparency
Manager Report
29
SeniorManagement
Tan Seng ChaiGroup Chief Corporate Officer, CapitaLand Limited
Mr Tan Seng Chai is Group Chief Corporate Officer of CapitaLand Limited. Prior to this, he was Deputy Chief Corporate Officer and Chief Human Resource Officer of CapitaLand Limited.
Mr Tan oversees the Group’s corporate functions including Human Resource and Administration, Information Technology, Corporate Communications, Corporate Marketing, Group Legal, Company Secretariat & Compliance and Corporate Security & Investigation. Mr Tan is also the Executive Director of CapitaLand Hope Foundation, the philanthropic arm of CapitaLand.
Prior to joining the Group in February 2008, Mr Tan was with Chartered Semiconductor Manufacturing Ltd, Singapore (Chartered) for 12 years. He held key positions in the company including heading its worldwide human resource organisation as well as overseeing key project implementation and strategic investment activities.
An engineer by training, Mr Tan started his career with National Semiconductor Manufacturer Singapore Pte Ltd as a Process Engineer and subsequently became the company’s Human Resource Manager. He continued his career progression to head the human resource function at Creative Technology Ltd, Singapore, before joining Chartered.
Mr Tan holds an honours degree in Civil & Structural Engineering and a Master of Science degree in Industrial & System Engineering from the National University of Singapore.
Arthur LangGroup Chief Financial Officer, CapitaLand Limited
Mr Arthur Lang is the Group Chief Financial Officer of CapitaLand Limited. In his current role, he has direct oversight of the functions of the treasury, financial reporting and controls, risk management, special strategic projects, tax and investor relations departments of CapitaLand. He also looks after the administrative matters of the internal audit department.
Prior to joining CapitaLand, he was co-head of the Southeast Asia investment banking division for Morgan Stanley. Mr Lang was also the Chief Operating Officer for the Asia Pacific investment banking division where he was based in Hong Kong for two years.
Mr Lang is also a board member of the Land Transport Authority of Singapore, Tiger Airways Holdings Limited and the Advisory Board of the Lee Kong Chian School of Business, Singapore Management University. He has also been appointed as a member of CNBC’s Global CFO Council.
Mr Lang was awarded the Best Investor Relations by a CFO award by IR Magazine for both 2012 and 2013. He was also placed second (sell-side) for Asia’s Best CFOs (Property) in the Institutional Investor 2013 All-Asia Executive Team rankings.
Mr Lang has an MBA from the Harvard Business School and a BA in Economics (magna cum laude) from Harvard University.
CapitaLand Limited Annual Report 2013 Clarity30
Wen Khai MengCEO, CapitaLand Singapore
Mr Wen Khai Meng is the Chief Executive Officer of CapitaLand Singapore. He is also a non-executive director of CapitaCommercial Trust Management Limited and Quill Capita Management Sdn Bhd.
Prior to this, Mr Wen has held several senior appointments within the Group including Chief Investment Officer of CapitaLand Limited, Chief Executive Officer of CapitaLand Commercial Limited and Chief Executive Officer of CapitaLand Financial Limited. He was also a non-executive director of Ascott Residence Trust Management Limited.
Before joining the Group, Mr Wen was with the Urban Redevelopment Authority (URA) for seven years.He was Director (Corporate Development) and Deputy Director (Land Administration). Prior to that, he was with the Ministry of National Development, Singapore, as Deputy Director (Infrastructure) for four years.
Mr Wen holds a Master of Business Administration and a Master of Science in Construction Engineering as well as a Bachelor of Engineering (First Class Honours).
Jason LeowCEO, CapitaLand China
Mr Jason Leow is Chief Executive Officer of CapitaLand China and the Country Coordinating Chief Executive Officer of CapitaLand Group in China.
Mr Leow has been with CapitaLand from 1994 and has over 20 years of experience in China. He has held several appointments within the Group, including General Manager of Business Development, General Manager of Corporate Services and Deputy Chief Executive Officer of CapitaLand China Holdings.
Prior to joining CapitaLand, he was a senior financial analyst at ST Aerospace Ltd and also spent three years at DBS Finance Ltd.
Mr Leow is a Certified Public Accountant and a member of the Institute of Certified Public Accountants of Singapore. He obtained an Executive Master in Business Administration degree from Fudan University and also attended the Advanced Management Program at Harvard Business School in 2007.
Corporate Governance& Transparency
Manager Report
31
SeniorManagement
Lim Beng CheeCEO, CapitaMalls Asia Limited
Mr Lim Beng Chee has been CapitaMalls Asia Limited (CMA)’s Chief Executive Officer since 1 November 2008.
Mr Lim played an active role in creating CMA’s retail real estate funds and retail real estate investment trusts. Mr Lim was the Deputy CEO of CapitaMall Trust Management Limited from March 2005 - December 2006. He was the CEO of CapitaRetail China Trust Management Limited from December 2006 – September 2008. Mr Lim was appointed as CEO for both CapitaMalls Asia and CapitaMall Trust Management Limited in November 2008, stepping down as CEO of CapitaMall Trust Management Limited on 25 November 2009 upon the listing of CMA.
Mr Lim holds a Master of Business Administration (Accountancy) from the Nanyang Technological University of Singapore and a Bachelor of Arts in Physics (Honours) from the University of Oxford, United Kingdom.
Lee Chee KoonCEO, The Ascott Limited(From 1 June 2013)
Mr Lee Chee Koon is the Chief Executive Officer of The Ascott Limited, the world’s largest international serviced residence owner-operator. Prior to this, Mr Lee was appointed as Ascott’s Deputy CEO in February 2012, assisting the CEO in strategic planning and investment of the serviced residence business. He was concurrently Ascott’s Managing Director for North Asia, responsible for driving the company’s investment and business development as well as managing the operations in China, Japan and Korea.
Before Mr Lee joined Ascott in July 2009 as Managing Director for China, he was the Vice President in the Office of the President at CapitaLand. Prior to joining CapitaLand in February 2007, Mr Lee was with the Administrative Service in the Singapore Civil Service. He was Assistant Director/Senior Assistant Director of Trade Directorate at the Ministry of Trade and Industry for over three years, and was responsible for trade policies. From mid 2004 to December 2005, Mr Lee was Head of International Department and Head of Economic Strategy at Ministry of Finance. In 2006, he joined Monetary Authority of Singapore for a year and was Head of the Organising Secretariat responsible for the 2006 IMF/WB Meetings in Singapore.
For Mr Lee’s contributions to the hospitality industry in China, he was named one of the ‘Top 10 Hoteliers of the Year’ by China Hotel Starlight Awards for three consecutive years in 2010, 2011 and 2012.
Mr Lee obtained a first class honours degree in Mechanical Engineering from the National University of Singapore in 1999. He also holds a Master of Science degree in Mechanical Engineering from Imperial College London, United Kingdom.
CapitaLand Limited Annual Report 2013 Clarity32
Corporate Governance Report
CapitaLand Limited (the Company, and together with its subsidiaries, the Group) observes high standards of corporate conduct which are in line with the Principles of the Code of Corporate Governance 2012 (the Code). The Company believes in developing and maintaining sound and transparent policies and practices to meet the specific business needs of the Group and to provide a firm foundation for a trusted and respected business enterprise. The Company remains focused on complying with the substance and spirit of the Principles of the Code while achieving operational excellence and delivering the Group’s long-term strategic objectives.
This report on the corporate governance practices for financial year 2013 (FY 2013) describes the Company’s application of good governance principles in building a company committed to integrity, transparency, excellence and its people. This application is underpinned by sound and robust systems of internal controls and accountability to promote and drive long-term sustainable growth and value for its shareholders.
The following sections outline the Company’s policies and practices on corporate governance. Where there is any material deviation from any Principle of the Code, an explanation has been provided within this report.
(A) BOARD MATTERS
The Board’s Conduct of AffairsPrinciple 1:Every company should be headed by an effective Board to lead and control the company.
The Board is collectively responsible for the long-term success of the company. The Board works with Management to achieve this objective and Management remains accountable to the Board.
The Company is led by a Board comprising a majority of independent non-executive Directors. Each Director brings to the Board skills, experience, insights and sound judgment, which together with strategic networking relationships, serve to further the interests of the Group. At all times, the Directors are collectively and individually obliged to act honestly and with diligence, and consider the best interests of the Company.
The Board oversees the affairs of the Company and is collectively responsible for the long-term success of the Company. The President & Group Chief Executive Officer (CEO), who is assisted by Management, is responsible for the day-to-day management and overall operation of the Group’s businesses.
The Board has adopted a Board Charter setting forth the duties and responsibilities of the Board. These include:
(a) approving the Group’s broad policies, strategies and objectives;
(b) approving annual budgets, major funding, including capital management proposals, investment and divestment proposals;
(c) reviewing at least annually the adequacy and
effectiveness of the Group’s risk management and internal control systems including establishing risk appetite and parameters, and internal control systems including financial, operational, compliance and information technology controls;
(d) reviewing succession plans for Directors and recommending the appointment of identified individuals as Directors for shareholders’ approval;
(e) reviewing the appointment of and succession plans for the CEO;
(f) recommending Board compensation for shareholders’ approval; and
(g) approving compensation framework and specific remuneration packages of CEO and key management personnel.
Specific matters which are reserved for the Board’s approval include:
(a) material acquisitions, investments, disposals and divestments;
(b) corporate and financial restructuring;
(c) share issuances, dividends and other returns to shareholders;
(d) approving the targets for and assessing the performance of the CEO and determining the compensation package for the CEO; and
33Corporate Governance& Transparency
Manager Report
(e) matters which involve a conflict of interest for a substantial shareholder or a Director.
Various Board Committees, namely Audit Committee (AC), Corporate Disclosure Committee (CDC), Executive Resource and Compensation Committee (ERCC), Finance and Budget Committee (FBC), Investment Committee (IC), Nominating Committee (NC) and Risk Committee (RC) have been constituted with clear written Terms of Reference to assist the Board in the discharge of its functions.
Each of these Board Committees operates under delegated authority from the Board. The Board may form other Board Committees as dictated by business imperatives. Membership of the various Board Committees is managed to ensure an equitable distribution of responsibilities among Board members, to maximise the effectiveness of the Board and to foster active participation and contribution from Board members. Diversity of experience and appropriate skills are considered. The Company has also taken steps to ensure that there are appropriate checks and balances between the different Board Committees.
A table of the Board members’ participation in the various Board Committees is set out on page 54 of this Annual Report. This reflects each Board member’s additional responsibilities and special focus in the respective Board Committees.
The Board has adopted a set of internal controls which establishes approval limits for capital expenditure, investments and
divestments, bank borrowings and minimum signature requirements for cheques at Board level. Apart from matters that specifically require the Board’s approval, the Board, while approving certain transactions exceeding certain threshold limits, delegates authority for transactions below those limits to Board Committees and Management. Such transactions include the following:
(a) approval of new investments, acquisitions, financing and banking facilities;
(b) approval of divestments and write-offs of investments;
(c) approval of specific budgetsfor capital expenditure for development projects, acquisitions and enhancements/upgrading of properties;
(d) review of operating budgets; and
(e) award of contracts for development projects.
Approval sub-limits are also provided at Management levels to optimise operational efficiency.The Board meets at least once every quarter, and as required by business imperatives. Prior to the start of each Board meeting, the non-executive Directors would meet without the presence of Management. Where a physical Board meeting is not possible, the Articles of Association (Articles) of the Company permit the Directors to meet via teleconferencing or video conferencing. The Board and Board Committees may also make decisions by way of resolutions in writing.
A total of eight Board meetings were held in FY 2013. A table showing the attendance record of Directors at Boardand Board Committee meetingsduring FY 2013 is set out on page 55 of this Annual Report. The Company believes in the manifest contribution of its Directors beyond attendance at formal Board and Board Committee meetings. To judge a Director’s contributions based on his attendance at formal meetings alone would not do justice to his overall contributions, which includes being accessible by Management for guidance or exchange of views outside the formal environment of Board and Board Committee meetings.
Board meetings for each year are scheduled in advance in the preceding year to facilitate Directors’ individual administrativearrangements in respect of competing commitments.
The Company provides suitable training for Directors. Upon appointment, each Director is provided with a formal letter of appointment and will also be given a copy of the New Director’s Manual (which includes information on a broad range of matters relating to the role of a Director). All Directors on appointment will be required to undertake an induction programmeto familiarise themselves with mattersrelating to the Company’s strategy andbusiness activities. The induction programme includes meetings with the Chairman of the Board, the Chairmen of the Board Committees, the President & Group CEO, the Group Chief Financial Officer (CFO),the Company Secretary and other key executive members.
CorporateGovernance Report
CapitaLand Limited Annual Report 2013 34 Clarity
Following their appointment, Directors are provided with opportunities for continuing education in areas such as Directors’ duties and responsibilities, changes to regulations and accounting standards and industry-related matters, so as to be updated on matters that affect or may enhance their performance as Board or Board Committee members.
Board Composition and GuidancePrinciple 2:There should be a strong and independent element on the Board, which is able to exercise objective judgment on corporate affairs independently, in particular, from Management and 10% shareholders. No individual or small group of individuals should be allowed to dominate the Board’s decision making.
The Board comprises 11 Directors, out of whom 10 are non-executive Directors who have no relationship with the Company, its related corporations, its shareholders who hold 10% or more of the voting shares of the Company or its officers that could interfere, or be reasonably perceived to interfere, with the exercise of their independent business judgment. Profiles of the Directors are provided on pages 20 to 27 of this Annual Report.
Mr Ng Kee Choe is the Chairman of the Board; he brings with him significant experience from his leadership in major regional companies in banking, finance, insurance and utilities.
Mr Lim Ming Yan, President & Group CEO of the Company, is the sole executive Director of the Company. He also brings with him significant real estate investment and asset management experience, including experience from his previous appointments in various positions within the Group.
The Board, through the NC, reviews the size and composition of the Board and is of the opinion that, given the scope and nature of the Group’s operations, the size of the Board is appropriate in facilitating effective decision-making.
The Directors are business leaders and professionals with financial, banking, real estate, tax, legal, economics, investment, accounting and manufacturing backgrounds. The varied background of the Directors enables Management to benefit from their external, diverse and objective perspectives on issues brought before the Board. It also enables the Board to interact and work with Management through a robust exchange of ideas and views to help shape the strategic process. This, together with the separation of the roles of the Chairman and the CEO, provides a healthy professional relationship between the Board and Management with clarity of roles and facilitates robust deliberation on the Group’s business activities.
The NC makes recommendations to the Board the appointments to the Board and Board Committees and the independence of the Directors, taking into account the guidance provided in the Code. The independence of
each independent non-executive Director is reviewed annually by the NC. The NC had recommended and the Board has determined that all non-executive Directors were independent in FY 2013. For the purposes of the determination, the non-executive Directors provided declarations of their independence which were deliberated upon by the NC and the Board.
The Board has determined that Mr Ng Kee Choe be considered independent notwithstanding that he is Chairman of the Company’s listed subsidiary, CapitaMalls Asia Limited (CMA)since 24 April 2013 as (i) the threshold of S$200,000 recommended in Guideline 2.3(d) of the Code was not significant compared with the revenues received by the Group in FY 2013, (ii) the payments received by the Group from CMA for the corporate support services supplied were interested person transactions (IPTs) from CMA’s perspective and would be on normal commercial terms since IPTs are regulated by Chapter 9of the Listing Manual of the Singapore Exchange Securities Trading Limited (SGX-ST), (iii) the corporate support services supplied were not material to the Company’s business and (iv) Mr Ng is required under the Company’s policy to recuse himself from any transaction with CMA or any matter that might give rise to the conflict of interest with CMA and would abstain from voting on such proposals at the Board meetings. Mr Ng has also demonstrated independence in character and judgment in the discharge of his responsibilities as a Director of the Company
35Corporate Governance& Transparency
Manager Report
CorporateGovernance Report
and, based on his declaration received, there are no other relationships or circumstances that are likely to affect, or could appear to affect, his judgment.
The Board has determined that Mr Peter Seah Lim Huat be considered independent notwithstanding that he has served on the Board beyond nine years as he has continued to demonstrate strong independence in character and judgment in the manner in which he has discharged his responsibilities as a Director of the Company. He has continued to express his individual viewpoints, debated issues and objectively scrutinised and challenged Management. He has sought clarification and amplification as he considered necessary, including through direct access to the Group’s employees and external advisors. Based on his declaration received, Mr Seah has no association with Management that could compromise his independence.
The Board has determined that Mr Seah be considered independent notwithstanding that he is Chairman of DBS Bank as (i) the threshold of S$200,000 recommended in Guideline 2.3(d) of the Code for payments made by the Group to DBS Bank was not significant compared with the overall payments made by the Group in FY 2013, (ii) the services received by the Group from DBS Bank was not material in the context of all the financial advisory and related services that the Group had received from its other banks and (iii) Mr Seah is required under the Company’s policy to recuse himself from any transaction with DBS Bank or any matter that might give
rise to a conflict of interest with DBS Bank and would abstain from voting on such proposals at the Board meetings. Based on his declaration received, there are no other relationships or circumstances that are likely to affect, or could appear to affect his judgment.
The Board has determined that Mr James Koh Cher Siang be considered independent notwithstanding that he is a Director of United Overseas Bank (UOB) as (i) the threshold of S$200,000 recommended in Guideline 2.3(d) of the Code for payments made by the Group to UOB was not significant compared with the overall payments made by the Group in FY 2013, (ii) the services received by the Group from UOB was not material in the context of all the financial advisory and related services that the Group had received from its other banks and (iii) Mr Koh is required under the Company’s policy to recuse himself from any transaction with UOB or any matter that might give rise to a conflict of interest with UOB and would abstain from voting on such proposals at the Board meetings. Mr Koh has also demonstrated independence in character and judgment in the discharge of his responsibilities as a Director of the Company and, based on his declaration received, there are no other relationships or circumstances that are likely to affect, or could appear to affect, his judgment.
The Board has determined that Mrs Arfat Pannir Selvam
be considered independent notwithstanding that she is a Director of CMA as (i) the threshold of S$200,000 recommended in Guideline 2.3(d)of the Code for payments made by CMA to the Company was not significant compared with the revenues receivedby the Group in FY 2013, (ii) the payments received by the Group from CMA for the corporate support services supplied were IPTs from CMA’s perspective and would be on normal commercial terms since IPTs are regulated by Chapter 9 of the Listing Manual of SGX-ST, (iii) the corporate support services supplied were not material to the Group’s business and (iv) Mrs Selvam is required under the Company’s policy to recuse herself from any transaction with CMA or any matter that might give rise to a conflict of interest with CMA and would abstain from voting on such proposals at the Board meetings. Mrs Selvam has also demonstrated independence in character and judgment in the discharge of her responsibilities as a Director of the Company and, based on her declaration received, there are no other relationships or circumstances that are likely to affect, or could appear to affect, her judgment.
The Board has determined that Prof Kenneth Stuart Courtis be considered independent as he has demonstrated independence in character and judgment in the discharge of his responsibilities as a Director of the Company and, based on his declaration received, there are no relationships or circumstances that are likely to affect, or could appear to affect, his judgment.
CapitaLand Limited Annual Report 2013 36 Clarity
The Board has determined that Mr John Powell Morschel be considered independent notwithstanding that he is Chairman of Australia and New Zealand Banking Group (ANZ Bank) as (i) the threshold of S$200,000 recommended in Guideline 2.3(d) of the Code for payments made by the Group to ANZ Bank was not significant compared with the overall payments made by the Group in FY 2013, (ii) the services received by the Group from ANZ Bank was not material in the context of all the financial advisory and related services that the Group had received from its other banks and (iii) Mr Morschel is required under the Company’s policy to recuse himself from any transaction with ANZ Bank or any matter that might give rise to a conflict of interest with ANZ Bank and would abstain from voting on such proposals at the Board meetings. Mr Morschel has also demonstrated independence in character and judgment in the discharge of his responsibilities as a Director of the Company and, based on his declaration received, there are no other relationships or circumstances that are likely to affect, or could appear to affect, his judgment.
The Board has determined that Mr Simon Claude Israel be considered independent as he has demonstrated independence in character and judgment in the discharge of his responsibilities as a Director of the Company and, based on his declaration received, there are no relationships or circumstances that are likely to affect, or could appear to affect, his judgment.
The Board has determined that Ms Euleen Goh Yiu Kiang be considered independent notwithstanding that she is a Director of DBS Bank as (i) the threshold of S$200,000 recommended in Guideline 2.3(d) of the Code for payments made by the Group to DBS Bank was not significant compared with the overall payments made by the Group in FY 2013, (ii) the services received by the Group from DBS Bank was not material in the context of all the financial advisory and related services that the Group had received from its other banks and (iii) Ms Goh is required under the Company’s policy to recuse herself from any transaction with DBS Bank or any matter that might give rise to a conflict of interest with DBS Bank and would abstain from voting on such proposals at the Board meetings. Ms Goh has also demonstrated independence in character and judgment in the discharge of her responsibilities as a Director of the Company and, based on her declaration received, there are no other relationships or circumstances that are likely to affect, or could appear to affect, her judgment.
The Board has determined that Tan Sri Amirsham Bin A Aziz be considered independent notwithstanding that he is a Director of CMA as (i) the threshold of S$200,000 recommended in Guideline 2.3(d) of the Code for payments made by CMA to the Company was not significant compared with the revenues received by the Group in FY 2013, (ii) the payments received by the Group from CMA for the corporate support services supplied were IPTs from CMA’s perspective and would be on normal commercial terms since IPTs are regulated
by Chapter 9 of the Listing Manual of SGX-ST, (iii) the corporate support services supplied were not material to the Group’s business and (iv) Tan Sri Amirsham is required under the Company’s policy to recuse himself from any transaction with CMA or any matter that might give rise to a conflict of interest with CMA and would abstain from voting on such proposals at the Board meetings. Tan Sri Amirsham has also demonstrated independence in character and judgment in the discharge of his responsibilities as a Director of the Company and, based on his declaration received, there are no other relationships or circumstances that are likely to affect, or could appear to affect, his judgment.
The Board has determined that Mr Stephen Lee Ching Yen be considered independent as he has demonstrated independence in character and judgment in the discharge of his responsibilities as a Director of the Company and, based on his declaration received, there are no relationships or circumstances that are likely to affect, or could appear to affect, his judgment.
Mr Lim Ming Yan is the President & Group CEO of the Company and he is therefore a non-independent Director. He is the sole non-independent Director.
Chairman and Chief Executive OfficerPrinciple 3:There should be a clear division of responsibilities between the leadership of the Board and the executives responsible for managing the company’s business. No one individual should represent a considerable concentration of power.
37Corporate Governance& Transparency
Manager Report
CorporateGovernance Report
To maintain an appropriate balance of power, increased accountability and greater capacity of the Board for independent decision making, the roles and responsibilities of the Chairman and CEO are held by separate individuals.
The non-executive Chairman, Mr Ng Kee Choe, is responsible for leading the Board and ensuring that the Board is effective on all aspects of its roles, while the President & Group CEO, Mr Lim Ming Yan, is responsible for the overall operation of the Group’s businesses. The Chairman and President & Group CEO are not immediate family members.
The Chairman ensures that the members of the Board and Management work together with integrity, competency and moral authority, and that the Board constructively engages Management on strategy, business operations, enterprise risk and other plans.
The President & Group CEO, is a Board member and has full executive responsibilities over the business directions and operational decisions of the Group. The President & Group CEO, in consultation with the Chairman, schedules Board meetings and finalises the preparation of the Board meeting agenda. He ensures the quality and timeliness of the flow of information between Management and the Board. He is also responsible for ensuring that the Company complies with the principles and guidelines of the Code.
Board Membership Principle 4: There should be a formal and transparent process for the appointment and re-appointment of directors to the Board.
The Board has established the NC which makes recommendations to the Board on all appointments to the Board and Board Committees. The NC ensures that the Board and Board Committees in the Group comprise individuals who are best able to discharge their responsibilities as Directors or, as the case may be, Board Committee members, having regard to applicable laws and regulations as well as the highest standards of corporate governance.
The NC is chaired by Mr Peter Seah Lim Huat and the other NC members are Mr Ng Kee Choe, Mrs Arfat Pannir Selvam, Mr John Powell Morschel and Mr Simon Claude Israel. All the NC members, including the Chairman, are independent non-executive Directors.
In performing its roles, the NC is guided by its Terms of Reference which sets out its responsibilities. In particular, the NC recommends to the Board:
(a) candidates for appointments to the Company’s Board and Board Committees;
(b) candidates to be the Company’s nominees on the Boards of listed subsidiaries and/or associates within the Group; and
(c) candidates to the Board and Board Committees of holding companies of the unlisted business units.
In addition, the NC:
(a) makes recommendations to the Board on the succession plans for Directors and the appointment of and succession plans for the CEO;
(b) reviews and recommends the development of a process for evaluation of the performance of the Board, Board Committees and Directors;
(c) reviews and recommends the training and professional development programmes for the Board;
(d) considers annually, and as and when circumstances require, if a Director is independent, and provides its views to the Board for consideration;
(e) reviews and decides if a Director is able to and has been adequately carrying out his duties as a Director, taking into consideration the Director’s number of listed company board representation and other principal commitments; and
(f) reviews at least once a year the Company’s corporate governance practices, having regard to relevant local and international developments in the area of corporate governance (including changes in applicable law, regulations and listing rules), and recommends changes to the Board.
CapitaLand Limited Annual Report 2013 38 Clarity
The Board has delegated specific duties to the NC with regard to the selection, appointment and re-election of non-executive Directors. The Board has formalised the process for selecting, appointing and re-electing non-executive Directors to the Board as follows:
(a) The NC carries out a proactive review of the Board composition at least annually as well as on each occasion that an existing non-executive Director gives notice of his or her intention to retire or resign. This is to assess the collective skills of non-executive Directors represented on the Board to determine whether the Board, as a whole, has the skills required to achieve the Group’s strategic and operational objectives. The outcome of that assessment will be reported to the Board. In carrying out this review, the NC will take into account that the Board composition should reflect balance in matters such as skill representation, tenure, experience, age spread and diversity (including gender diversity).
(b) The NC identifies suitable candidates for appointment to the Board having regard to the skills required and the skills represented on the Board.
(c) External consultants may be used from time to time to access a wide base of potential non-executive Directors. Those considered will be assessed against a range of criteria including background, experience,
professional skills and personal qualities. The NC and the Board will also consider whether a candidate’s skills and experience will complement the existing Board and whether the candidate has sufficient time available to commit to his responsibilities as a Director.
(d) The NC makes recommendations to the Board on candidates it considers appropriate for appointment.
(e) Subject to the provisions of the Articles and the Companies Act Chapter 50 of Singapore (Companies Act), the Board may from time to time appoint a person as a Director of the Company but that person must retire, and may seek electionby shareholders, at the next Annual General Meeting (AGM).
(f) In regard to the re-election of existing Directors each year, the NC advises the Board of those Directors who are retiring in accordance with the provisions of the Articles and the Companies Act.
(g) The NC makes recommendations to the Board as to whether the Board should support the re-election of a Director retiring in accordance with the provisions of the Articles and the Companies Act.
(h) In making recommendations, the NC will undertake a process of review of the retiring non-executive Director’s performance during the period in which the non-executive Director
has been a member of the Board.
(i) A non-executive Director will serve a maximum of two three-year terms and thereafter by exception on the recommendation of the NC.
The above process may be reviewed periodically at the discretion of the Board.
For FY 2013, the NC has performed the duties as required under its Terms of Reference. In particular, the NC had carried out the annual assessment of the independence of the independent Directors and formal evaluation of the effectiveness of the Board and its Board Committees for FY 2013.
The Company believes that Board renewal is a necessary and continual process, for good governance and maintaining relevance to the changing needs of the Group’s businesses. Election of Board members is the prerogative and right of shareholders.
The Company’s Articles require one-third of its Directors (prioritised by length of service since previous re-election or appointment) to retire and subject themselves to re-election by shareholders at every AGM (one-third rotation rule). This effectively means that no Director will remain in office for more than three years without being re-elected by shareholders. In addition, any newly appointed Director (whether as an additional Director or to fill a casual vacancy) will submit himself for retirement and re-election at the AGM immediately following his appointment. Thereafter, he is subject to the one-third rotation rule.
39Corporate Governance& Transparency
Manager Report
CorporateGovernance Report
The President & Group CEO, as a Board member, is also subject to the one-third rotation rule. His role as President & Group CEO is separate from his position as a Board member, and does not affect the ability of shareholders to exercise their right to select all Board members.
Directors who are above the age of 70 are also statutorily required under the Companies Act to retire and seek re-appointment at each AGM.
Guideline 4.4 of the Code recommends that the Board determines the maximum number of listed companies board representations which any director may hold and disclose this in the annual report. The Board is of the view that, the limit on the number of listed company directorships that an individual may hold should be considered on a case-by-case basis, as a person’s available time and attention may be affected by many different factors such as whether they are in full-time employment and their other responsibilities. A Director with multiple directorships is expectedto ensure that sufficient attention is given to the affairs of the Group. The Board believes that each individual Director is best placed to determine and ensure that he isable to devote sufficient time and attention to discharge his duties and responsibilities as a Director of the Company, bearing in mind his other commitments. In consideringthe nomination of Directors for appointment or re-election, the NC will take into account, amongst others, the competing time commitments faced by Directors with multiple Board memberships. All Directors had confirmed that notwithstanding the number of their individual listed
company board representations and other principal commitments, which the Directors held, they were able to devote sufficient time and attention to the affairs of the Company. A total of two NC meetings were held in FY 2013.
Board Performance Principle 5:There should be a formal annual assessment of the effectiveness of the Board as a whole and its Board committees and the contribution by each director to the effectiveness of the Board.
The Company believes that Board performance is ultimately reflected in the long-term performance of the Group.
The Board, through the NC, strives to ensure that there is an optimal blend in the Board of background, experience and knowledge in technology, business, finance and management skills critical to the Group’s businesses and that each Director could bring to the Board an independent and objective perspective to enable balanced and well-considered decisions to be made in the interests of the Group. Contributions by an individual Board member can also take other forms, including providing objective perspectives on issues, facilitating business opportunities and strategic relationships, and accessibility by Management outside of a formal environment of Board and/or Board Committee meetings.
Renewal or replacement of Board members do not necessarily reflect their contributions to date, but may be driven by the need to position and shape
the Board in line with the needs of the Company and its business.
To enhance the long-term performance of the Board and its Board Committees, the Board has, through the NC, adopted a process to evaluate the effectiveness of the Board and Board Committees annually. An external consultant was engaged to facilitate the evaluation process since financial year 2011 (FY 2011). The consultant is independent of and is not related to the Company or any of its Directors. As part of the process, questionnaires were sent by the consultant to the Directors and Senior Management and the findings were evaluated by the consultant and reported, together with the recommendations of the consultant, to the Chairman of the NC. The findings and the recommendations of the consultant were reviewed by the Board.
Access to InformationPrinciple 6:In order to fulfill their responsibilities, directors should be provided with complete, adequate and timely information prior to Board meetings and on an on-going basis so as to enable them to make informed decisions to discharge their duties and responsibilities.
The Company believes that the Board should be provided with timely, adequate and complete information prior to Board meetings, and as and when the need arises. As a general rule, Board papers are sent to Board members
CapitaLand Limited Annual Report 2013 40 Clarity
at least five working days prior to the Board meeting to allow the Board members to prepare for the Board meetings which enable the discussions to focus on questions that the Board members may have. However, sensitive matters may be tabled at the meeting itself or discussed without any papers being distributed. The Directors have access to the Company’s records, such as Board papers and related materials, and minutes of Board meetings and Board Committee meetings. New Board members are fully briefed on the businesses of the Group.
Management provides timely, adequate and complete informationto the Board on Board affairs and issues requiring the Board’s decision. It also provides ongoing reports relating to the operational and financial performance of the Company, such as monthly management financial reports. Timely communication with members of the Board is effected through electronic means which include electronic mail, teleconferencing and video conferencing. Informal meetings are also held for Management to brief Directors on prospective deals and potential developments in the early stages before formal Board approval is sought.
The Board has separate and independent access to Management including the Company Secretary at all times. The Company Secretary attends to corporate secretarial administration matters and is the corporate governance advisor on corporate matters to the Board and Management. The Company Secretary
attends Board meetings. The Board, whether as individual Director or as a group, is also entitled to have access to independent professional advice where required, at the Company’s expense.
The AC also meets the external and internal auditors separately at least once a year, without the presence of the President & Group CEO and Management, in order to have unfettered access to any information that it may require.
(B) REMUNERATION MATTERS
Procedures for Developing Remuneration Policies Principle 7:There should be a formal and transparent procedure for developing policy on executive remuneration and for fixing the remuneration packages of individual directors. No director should be involved in deciding his own remuneration.
Level and Mix of RemunerationPrinciple 8:The level and structure of remuneration should be aligned with the long-term interest and risk policies of the company, and should be appropriate to attract, retain and motivate (a) the directors to provide good stewardship of the company, and (b) key management personnel to successfully manage the company. However, companies should avoid paying more than is necessary for this purpose.
Disclosure on Remuneration Principle 9:Every company should provide clear disclosure of its remuneration policies,level and mix of remuneration, and the procedure for setting remuneration, in the company’s Annual Report. It should provide disclosure in relation to its remuneration policies to enable investors to understand the link between remuneration paid to directors and key management personnel, and performance.
We believe that a framework of remuneration for the Board and key executives should not be taken in isolation. It should be linked to the building of management bench strength and the development of key executives. This is to ensure continual development of talent and renewal of strong and sound leadership for a sustainable business and a lasting company.
The Board has established the ERCC to oversee executive compensation and development in the Company. The Company’s ERCC sets appropriate remuneration policies and designs competitive compensation packages with a focus on long-term sustainability of business and long-term shareholders’ return. The ERCC plays a crucial role in helping to ensure that the Company is able to attract, recruit and retain the best talents to drive the Group’s businesses forward.
The ERCC is chaired by Mr Ng Kee Choeand the other ERCC members are Mr Peter Seah Lim Huat, Mr Simon Claude Israel and Mr Stephen Lee Ching Yen.
41Corporate Governance& Transparency
Manager Report
CorporateGovernance Report
All the ERCC members, including the Chairman, are independent non-executive Directors.
The ERCC is guided by its Terms of Reference which defines its scope of authority. In particular, the ERCC:
Executive Remuneration Policy
(a) reviews and recommends to the Board a general framework of remuneration for key management personnel 1 of the Group;
1 The term “key management personnel” shall mean the CEO and other persons having authority and responsibility for planning, directing and controlling the activities of the company.
(b) reviews the on-going appropriateness and relevance of the executive remuneration policy and other benefit programmes;
Key Management Personnel
(a) considers, reviews, varies (if necessary) and recommends to the Board the employment contract terms and remuneration package for each key management personnel in the Group excluding its listed subsidiaries (including salaries, allowances, bonuses, stock grants, benefits-in-kind, retirement terms, and other relevant terms and conditions of employment) having regard to the general framework of remuneration for key management personnel in the Group;
(b) reviews and recommends termination payments, retirement payments, gratuities, ex-gratia payments,
severance payments and other similar payments where applicable to key management personnel in the Group excluding its listed subsidiaries;
(c) ensures that their contracts of service contain fair and reasonable termination clauses which are not overly generous;
Equity-Based Plans
(a) reviews and approves the design of all share plans and/or other equity-based plans in the Company;
(b) for each equity-based plan, determines each year whether awards will be made under that plan;
(c) reviews and recommends each award as well as the total proposed awards under each plan in accordance with the rules governing each plan, including awards to each key management personnel;
(d) reviews, approves and keeps under review performance hurdles and/or fulfillment of performance hurdles for each equity-based plan in the Company;
Non-Executive Director Remuneration Framework
(a) reviews and recommends to the Board a general framework of remuneration (including Directors’ fees) for non-executive Directors in the Group excluding its listed subsidiaries;
(b) reviews and recommends to the Board specific remuneration packages for each Director in the Company;
Executive and Leadership Development
(a) oversees the development plans of Management with the aim of building up of talent and renewal of strong and sound leadership to the Group and its businesses. It approves the appointment of key management positions, reviews succession plans for key management positions in the Group (excluding the President & Group CEO) and oversees the development of key executives and talented executives in the Group.
The ERCC aims to build capable and committed management teams, through competitive compensation, strong management bench and progressive policies which are aligned with the long-term interests and risk policies of the Group, and can attract, motivate and retain a pool of talented executives to meet the current and future growth of the Company.
The ERCC conducts, on an annual basis, a succession planning review of the President & Group CEO and selected key management positions in the Company. Potential internal and external candidates for succession are reviewed for their readiness in the immediate, medium and longer term.
CapitaLand Limited Annual Report 2013 42 Clarity
REMUNERATION POLICY FOR KEY MANAGEMENT PERSONNELThe principles governing the Company’s key management personnel remuneration policy are as follows:
BUSINESS ALIGNMENT
• Build sustainable value creation and drive wealth-added to align with longer term shareholder interests
• Provide sound, structured funding to ensure affordability and cost-effectiveness in line with performance goals
• Enhance retention of key talents to build strong organisational capabilities
MOTIVATE RIGHT BEHAVIOURS
• Pay for performance – align, differentiate and balance rewards according to multiple dimensions of performance
• Strengthen line-of-sight linking rewards and performance goals• Foster Group-Wide Interests to recognise the interdependence of
the various business units and drive superior outcomes
FAIR & APPROPRIATE
• Ensure remuneration is competitive relative to the appropriate external talent markets
• Manage internal equity so that remuneration systems are viewed as fair across the Group
• Significant and appropriate portion of pay-at-risk, taking into account risk policies of the Group, symmetrical with risk outcomes and sensitive to risk time horizon
EFFECTIVE IMPLEMENTATION
• Maintain rigorous corporate governance requirements• Exercise appropriate flexibility to meet strategic business needs
and practical implementation considerations• Facilitate employee understanding to maximise the value of the
remuneration programs
The Board sets the remuneration policies in line with the Company’s business strategy and approves the executive compensation framework based on the key principle of tying pay to performance. The Board approves the guaranteed cash component based on position and size of the job and relevant market competitive levels of compensation. The Board also approves performance conditions for all incentive plans and reviews the compensation payouts for various levels of group, business unit and individual performance at the end of the financial year. The resulting incentives taking into account the relevant market competitive levels of compensation are also approved by the Board. The Board has access to the advice of an independent remuneration consultant to assist with the above procedure.
In FY 2013, the ERCC appointed an external consultant Carrots Consulting Pte Ltd (Carrots) to provide professional advice on board and executive remuneration. The consultant is independent and is not related to the Company or any of its Directors. In its deliberations, the ERCC takes into consideration industry practices and norms in compensation. The President & Group CEO was not present during the discussions relating to his own compensation and terms and conditions of his service, and the review of his performance. The President & Group CEO was in attendance when the ERCC discussed policies and compensation of his senior team and key staff which included contingent share awards, bonus, staff salary review and other incentive schemes. A total of four ERCC meetings were held in FY 2013.
43Corporate Governance& Transparency
Manager Report
CorporateGovernance Report
EXECUTIVE REMUNERATION FOR KEY MANAGEMENT PERSONNEL
Remuneration for key management personnel comprise a fixed component, a variable cash component, share-based component and market-related benefits:
A. Fixed Component:
The fixed component comprises the base salary and compulsory employer contribution to an employee’s Central Provident Fund.
B. Variable Cash Component:
The variable cash component includes the Scorecard-based Annual Bonus Plan and EVA-based Incentive Plan.
Scorecard-based Annual Bonus Plan
Scorecard-based Annual Bonus Plan is a remuneration component linked to the achievement of annual performance targets for each key management personnel as agreed with the Board (for President & Group CEO) and with the President & Group CEO (for the other key management personnel) at the beginning of each financial year.
Performance objectives aligned to the overall business metric and strategic goals of the Group are cascaded down throughout the organisation through the use of Balanced Scorecard, thereby creating greater alignment between performance of the Group, Business Units and the individual employees.
These could be in the form of both quantitative and qualitativemeasures which are aligned to the Group’s business strategy.
In determining the final payout for each key management personnel under the plan, the ERCC considers overall Group performance, funding affordability and individual performance.
EVA-based Incentive Plan
EVA-based Incentive Plan (EBIP) is an annual remuneration component based on sharing a portion of the economic value created with employees which varies according to actual achievement of residual economic profit.
The EBIP rewards for sustainable shareholder value creation over the medium term achieved by growing profits, deploying capital efficiently and managing the risk profile and risk time horizon of a property business.
Under this plan, one-third of the accumulated EBIP bonus, comprising of EBIP bonus for the year, and the balance of the EBIP bonus brought forward from preceding years, is paid out in cash each year. The remaining two-thirds are carried forward in each individual executive’s EBIP account for future years. Amounts in the EBIP account are at risk because a significant reduction in EVA in any year will result in retraction (performance clawback) of the EBIP bonus declared in preceding years. The EBIP encourages key management
personnel to work for sustained EVA generation and to take actions that are aligned with the long-term interests of shareholders.
In determining the final EBIP bonus declared, the ERCC considers overall Group performance and relevant market remuneration benchmarks.
Based on the ERCC’s assessment that the actual performance of the Group in FY 2013 has partially met the pre-determined targets, the resulting annual EVA declared under the EBIP has been adjusted accordingly to reflect the performance level.
C. Share-based Component:
Share awards which were granted in FY 2013 were based on the CapitaLand Performance Share Plan 2010 and the CapitaLand Restricted Share Plan 2010 (the New Share Plans) approved and adopted by the shareholders of the Company at the Extraordinary General Meeting held on 16 April 2010.
Upon the adoption of the New Share Plans, the CapitaLand Performance Share Plan and the CapitaLand Restricted Stock Plan (the Previous Share Plans) were terminated without prejudice to the rights of holders of outstanding options and awards. The New Share Plans carry the same terms as the Previous Share Plans except that the maximum size of the shares to be issued has been reduced to 8% (including
CapitaLand Limited Annual Report 2013 44 Clarity
outstanding options and share grants from previous plans) over the 10-year life of the New Share Plans (compared to 15% of the Previous Share Plans). For FY 2013, shares granted under the New Share Plans did not exceed the Yearly Limit of 1% of the total number of issued shares (excluding treasury shares).
Details of the Previous Share Plansand New Share Plans as well as awards granted under the Previous Share Plans and New Share Plans are given in the Share Plans section of the Directors’ Report from pages 128 to 133.
Performance Share Plan
During FY 2013, the ERCC of the Company has grantedawards which are conditional on targets set for a performance period, currently prescribed to be a three-year performance period. A specified number of shares will only be released to the recipient at the end of the qualifying performance period, provided that minimally the threshold targets are achieved. An initial number of shares (baseline award) is allocated according to the following performance conditions:
• Group’s Absolute Total Shareholder Return measured as a multiple of Cost of Equity; and
• Group’s Relative Total Shareholder Return measured as the outperformance against the MSCI Asia Pacific ex-Japan Real Estate Index.
The above performance measures are selected as key measurements of wealth creation for shareholders. The final number of shares to be released will depend on the achievement of pre-determined targets over a three-year performance period. No share will be released if the threshold targets are not met at the end of the performance period. Conversely, if superior targets are met, more shares than the baseline award could be released. For awards granted prior to 2012, the maximum is 200% of the baseline award. From 2012, the maximum will be 175% of the baseline award.
The Group has attained a nil achievement factor which is reflective of not meeting the pre-determined target performance level for Performance Shares awards granted based on the performance period from FY 2011 to FY 2013.
Restricted Share Plan
During FY 2013, the ERCC of the Company has granted awards which are conditional on targets set for a performance period, currently prescribed to be a one-year performance period. A specified number of shares will only be released to the recipients at the end of the qualifying performance period, provided that minimally the threshold targets are achieved. An initial number of shares (baseline award) is allocated according to the following performance conditions:
• Group’s Operating Earnings Before Interest and Tax; and
• Group’s Operating Return on Total Assets.
The above performance measures are selected as they are the key drivers of shareholder value and are aligned to the Company’s business objectives. The final number of shares to be released will depend on the achievement of pre-determined targets at the end of a one-year performance period. No share will be released if the threshold targets are not met at the end of the performance period. On the other hand, if superior targets are met, more shares than the baseline award could be delivered up to a maximum of 150% of the baseline award. Once the final number of shares has been determined, it will be released over a vesting period of three years. Recipients can receive fully paid shares, their equivalent cash value or combinations thereof, at no cost.
The Group has attained an achievement factor which is reflective of partially meeting the pre-determined target performance level for Restricted Shares awards granted based on the performance period for FY 2013.
D. Market-related Benefits
The benefits provided are comparable with local market practices.
45Corporate Governance& Transparency
Manager Report
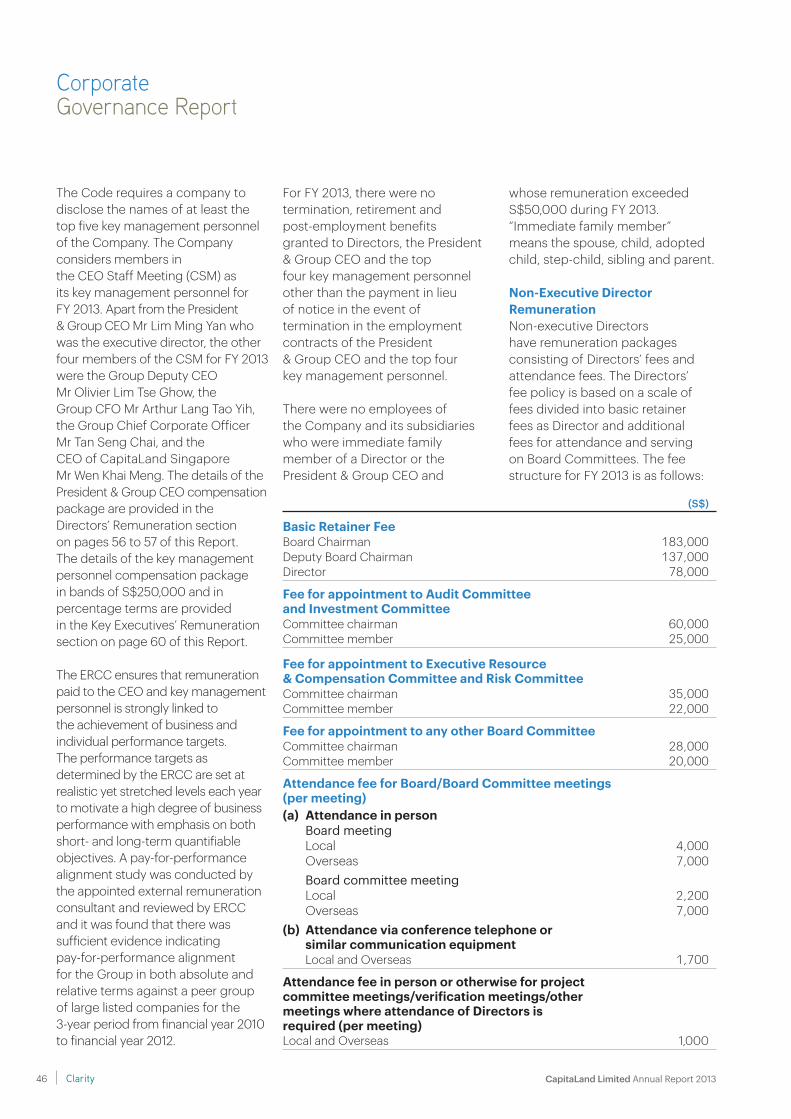
CorporateGovernance Report
The Code requires a company to disclose the names of at least the top five key management personnel of the Company. The Company considers members in the CEO Staff Meeting (CSM) as its key management personnel for FY 2013. Apart from the President & Group CEO Mr Lim Ming Yan who was the executive director, the other four members of the CSM for FY 2013 were the Group Deputy CEO Mr Olivier Lim Tse Ghow, the Group CFO Mr Arthur Lang Tao Yih, the Group Chief Corporate Officer Mr Tan Seng Chai, and the CEO of CapitaLand Singapore Mr Wen Khai Meng. The details of the President & Group CEO compensationpackage are provided in the Directors’ Remuneration section on pages 56 to 57 of this Report. The details of the key management personnel compensation package in bands of S$250,000 and in percentage terms are provided in the Key Executives’ Remuneration section on page 60 of this Report.
The ERCC ensures that remuneration paid to the CEO and key management personnel is strongly linked to the achievement of business and individual performance targets. The performance targets as determined by the ERCC are set at realistic yet stretched levels each year to motivate a high degree of business performance with emphasis on both short- and long-term quantifiable objectives. A pay-for-performance alignment study was conducted by the appointed external remuneration consultant and reviewed by ERCC and it was found that there was sufficient evidence indicating pay-for-performance alignment for the Group in both absolute and relative terms against a peer group of large listed companies for the 3-year period from financial year 2010 to financial year 2012.
For FY 2013, there were no termination, retirement and post-employment benefits granted to Directors, the President & Group CEO and the top four key management personnel other than the payment in lieu of notice in the event of termination in the employment contracts of the President & Group CEO and the top four key management personnel.
There were no employees of the Company and its subsidiaries who were immediate family member of a Director or the President & Group CEO and
whose remuneration exceeded S$50,000 during FY 2013. “Immediate family member” means the spouse, child, adopted child, step-child, sibling and parent.
Non-Executive Director RemunerationNon-executive Directors have remuneration packages consisting of Directors’ fees and attendance fees. The Directors’ fee policy is based on a scale of fees divided into basic retainer fees as Director and additional fees for attendance and serving on Board Committees. The fee structure for FY 2013 is as follows:
(S$)
Basic Retainer FeeBoard Chairman 183,000Deputy Board Chairman 137,000Director 78,000
Fee for appointment to Audit Committeeand Investment CommitteeCommittee chairman 60,000Committee member 25,000
Fee for appointment to Executive Resource & Compensation Committee and Risk CommitteeCommittee chairman 35,000Committee member 22,000
Fee for appointment to any other Board CommitteeCommittee chairman 28,000Committee member 20,000
Attendance fee for Board/Board Committee meetings (per meeting)(a) Attendance in person Board meeting Local 4,000 Overseas 7,000 Board committee meeting Local 2,200 Overseas 7,000(b) Attendance via conference telephone or similar communication equipment Local and Overseas 1,700
Attendance fee in person or otherwise for project committee meetings/verification meetings/other meetings where attendance of Directors is required (per meeting)Local and Overseas 1,000
CapitaLand Limited Annual Report 2013 46 Clarity
Non-executive Directors who served on the Board during FY 2013 will receive about 70% of his total Directors’ fees in cash and about 30% of his total Directors’ fees in the form of shares in the Company. The actual number of shares to be awarded will be based on thevolume-weighted average price (VWAP)of the Company’s share on the SGX-ST over the 14 trading days from (and including) the ex-dividend date following the date of the Company’s AGM, rounded down to the nearest share, and any residual balance settled in cash. The awards will consist of the grant of fully paid shares, with no performance conditions attached and no vesting periods imposed. However, in order to encourage the alignment of interests of the non-executive Directors with the interests of shareholders, a non-executive Director is required to hold shares in the Company worth at least one-time his annual basic retainer fee based on the VWAP of the Company’s share over the 14 trading days from (and including) the ex-dividend date (if any) following the date of the Company’s AGM or the total number of shares awarded under the above policy for FY 2011 and onwards, whichever is lower, at all times during his Board tenure. Details of the Directors’ remuneration are provided in the Directors’ Remuneration section on pages 56 to 57 of this Report. The President & Group CEO as executive Director does not receive Director’s fees. Directors’ fees in aggregate for non-executive Directors are subject to the approval of shareholders at the AGM.
(C) ACCOUNTABILITY AND AUDIT
AccountabilityPrinciple 10:The Board should present a balanced and understandable assessment of the company’s performance, position and prospects.
The Company provides shareholders with quarterly and annual financial statements. The Listing Manual of SGX-ST requires results for the first three quarters to be released to shareholders within 45 days from the end of the quarter and the annual results to be released within 60 days from the financial year end. The Company’s results for the first three quarters and the full year for FY 2013 were all released on a timely basis, within 31 days of the end of the relevant quarter and 50 days of the end of the financial year.
In presenting the annual and quarterly financial statements to shareholders, the Board aims to provide shareholders with a balanced, clear and understandable assessment of the Company and the Group’s performance, position and prospects. In order to achieve this, Management provides the Board with management accounts on a monthly basis and such explanation and information as any Director may require, to enable the Directors to keep abreast, and make a balanced and informed assessment, of the Group’s financial performance, position and prospects.
The Company believes in conducting itself in ways that seek to deliver maximum sustainable value to its shareholders. Best practices are promoted as a means to build an excellent business for
its shareholders and the Company is accountable to shareholders for its performance. Prompt fulfilment of statutory reporting requirements is but one way to maintaining shareholders’ confidence and trust in the capability and integrity of the Company.
Risk Management and Internal Controls Principle 11:The Board is responsible for the governance of risk. The Board should ensure that Management maintains a sound system of risk management and internal controls to safeguard shareholders’ interest and the company’s assets, and should determine the nature and extent of the significant risks which the Board is willing to take in achieving its strategic objectives.
The Company has in place an adequate and effective system of internal controls addressing material financial, operational, compliance and information technology risks to safeguard shareholders’ interests and the Group’s assets.
The Board has overall responsibility for the governance of risk and exercises oversight of the risk management strategy and framework. The RC assists the Board in strengthening the Company’s risk management capabilities.
The RC is chaired by Mr James Koh Cher Siang and the other RC members are Ms Euleen Goh Yiu Kiang, Tan Sri Amirsham Bin A Aziz and Mr Stephen Lee Ching Yen. A total of four RC meetings were held during FY 2013.
47Corporate Governance& Transparency
Manager Report
CorporateGovernance Report
consistent manner. The ERM Framework and related policies are reviewed at least annually.
As part of the ERM Framework, Management, amongst other things, undertakes and performs a risk and control self-assessment (RCSA) process. As a result of the RCSA process, the Group produces and maintains a risk register which identifies the material risks it faces and the corresponding internal controls in place to manage or mitigate those risks. The material risks are reviewed annually by the RC, the AC and the Board.
The Group has formalised its framework which sets out the approach on how risk appetite is defined, monitored and reviewed across the Group. The Group Risk Appetite Statement is approved by the Board and it addresses the management of material risks faced by the Group.
More information on the Group’s ERM Framework can be found in the Enterprise Risk Management Section on pages 61 to 63 of this Annual Report.
Internal and external auditors conduct audits that involve testing the effectiveness of the material internal controls in the Group addressing financial, operational, compliance and information technology risks, including testing, where practical, material internal controls in areas managed by external service providers. Any material non-compliance or lapses in internal controls together with corrective measures recommended by internal and external auditors are reported to and reviewed by the AC. The adequacy and effectiveness of the measures taken by Management in response
to the recommendations made by the internal and external auditors are also reviewed by the AC.
The Board has received assurance from the President & Group CEO and the Group CFO that:
(a) the financial records of the Group have been properly maintained and the financial statements for FY 2013 give a true and fair view of the Group’s operations and finances; and
(b) the system of risk management and internal controls in place within the Group is adequate and effective in addressing the material risks faced by the Group in its current business environment including material financial, operational, compliance and information technology risks. The President & Group CEO and the Group CFO have obtained similar assurance from the business and corporate executive heads in the Group.
In addition, in FY 2013, the Board has also received quarterly certification by Management on the integrity of financial reporting and the Board has provided a negative assurance confirmation to shareholders, as required by the Listing Manual of SGX-ST.
Based on the ERM Framework established and the reviews conducted by Management and both the internal and external auditors, as well as the assurance from the President & Group CEO and the Group CFO,the Board concurs with the recommendation of the AC and is of the opinion, that the Group’s system of risk management and internal controls addressing
The RC is guided by its Terms of Reference. Specifically, the RC assists the Board to:
(a) determine the Group’s levels of risk tolerance and risk policies;
(b) oversee Management in the formulation, updating and maintenance of an adequate and effective risk management framework in addressing material risks including material financial, operational, compliance and information technology risks;
(c) make the necessary recommendation to AC and the Board such that an opinion or comment regarding the adequacy and effectiveness of the risk management and internal control systems can be made by the Board of Directors in the annual report as required by the Listing Manual of the SGX-ST and the Code;
(d) review the Group’s risk profile regularly and the adequacy of any proposed action, if necessary; and
(e) review any material breaches of risk limits and the adequacy of any proposed action, if necessary.
The AC provides oversight of the financial reporting risk and the adequacy and effectiveness of the Group’s internal controls.
The Group adopts an Enterprise Risk Management (ERM) Framework which sets out the required environmental and organisational components for managing risk in an integrated, systematic and
CapitaLand Limited Annual Report 2013 48 Clarity
financial, operational, compliance and information technology risks is adequate and effective to meet the needs of the Group in its current business environment as at 31 December 2013.
The Board notes that the system of risk management and internal controls established by Management provides reasonable, but not absolute, assurance that the Group will not be significantly affected by any event that can be reasonably foreseen as it strives to achieve its business objectives. However, the Board also notes that no system of risk management and internal controls can provide absolute assurance in this regard,or absolute assurance against poor judgment in decision making, human error, losses, fraud or other irregularities.
Audit CommitteePrinciple 12:The Board should establish an Audit Committee with written terms of reference which clearly set out its authority and duties.
The AC is chaired by Ms Euleen Goh Yiu Kiang and the other AC members are Mr James Koh Cher Siang, Mrs Arfat Pannir Selvam and Tan Sri Amirsham Bin A Aziz. All the members of the AC, including the Chairman, are independent non-executive Directors. The members bring with them invaluable recent and relevant managerial and professional expertise in accounting and related financial management domains.
The AC functions independently of the officers and other Directors of the Company who are not
AC members. Management is required to provide the fullest co-operation in providing information and resources, and in implementing or carrying out all requests made by the AC. The AC has direct access to the internal and external auditors and full discretion to invite any Director or executive officer to attend its meetings.
The AC is guided by Terms of Reference which defines its scope of authority. Specifically, the AC:
(a) reviews the Company’s and the Group’s financial statements and any public financial reporting with Management and external auditors for submission to the Board;
(b) reviews with the external auditors their audit plan, audit report, management letter and the response from the Management or difficulties with Management encountered during the course of the audit;
(c) reviews with the external and internal auditors the adequacy and effectiveness of the Group’s internal control systems, including financial, operational, compliance and information technology controls;
(d) makes the necessary recommendation to the Board such that an opinion or comment regarding the adequacy and effectiveness of the risk management and internal control systems of the Group can be made by the Board in the annual report as required by the Listing Manual of the SGX-ST and the Code;
(e) reviews with the internal auditors, the programme, scope and results of the internal audit and Management’s response to their findings to ensure that appropriate follow-up measures are taken;
(f) reviews at least annually the adequacy and effectiveness of the internal audit function;
(g) reviews with the external auditors the impact of any new or proposed changes in accounting principles or regulatory requirements on the financial statements of the Company and the Group;
(h) reviews IPTs for potential conflicts of interest;
(i) reviews on a periodic basis the framework and processes established for the implementation of the terms of the collaboration agreement with CMA in order to ensure that such framework and processes remain appropriate;
(j) reviews and assesses from time to time whether additional processes are required to be put in place to manage any material conflicts of interest within the Group and propose, where appropriate, the relevant measures for the measurement of such conflicts;
(k) reviews and resolves all conflicts of interest matters referred to it;
(l) assesses the suitability of the accounting firm as external auditors and recommend to the Board their appointment or re-appointment as external auditors for the coming year,
49Corporate Governance& Transparency
Manager Report
CorporateGovernance Report
without Management’s presence, to discuss the reasonableness of the financial reporting process, the system of internal controls, and the significant comments and recommendations by the auditors.
During FY 2013, the Group CFO briefed the AC on the impact of the new accounting standards on the Group’s consolidated financial statements.
The Company confirms that it complies with Rules 712, 715 and 716 of the Listing Manual of the SGX-ST in relation to its auditing firms.
Internal Audit Principle 13:The company should establish an effective internal audit function that is adequately resourced and independent of the activities it audits.
The Company has an Internal Audit Department (CL IA) which reports directly to the AC and administratively to the Group CFO.CL IA plans its internal audit schedules in consultation with, but independently of, Management and its plan is submitted to the AC for approval prior to the beginning of each year. The AC also meets with CL IA at least once a year without the presence of Management.
CL IA is a corporate member of the Singapore branch of the Institute of Internal Auditors Inc. (IIA),which has its headquarters in the USA. CL IA subscribes to, and is guided by, the Standards for the Professional Practice of Internal Auditing (Standards) developed by the IIA and has incorporated these Standardsinto its audit practices.
The Standards set by the IIA cover requirements on:
(a) Independence;(b) Professional Proficiency;(c) Scope of Work;(d) Performance of Audit Work;
and(e) Management of the Internal
Auditing Department.
To ensure that the internal audits are performed by competent professionals, CL IA recruits and employs suitably qualified professional staff with the requisite skill sets and experience. For instance, CL IA staff who are involved in Information Technology (IT) audits are Certified Information System Auditors and members of the Information System Audit and Control Association (ISACA) in the United States of America. The ISACA Information System Auditing Standards provide guidance on the standards and procedures to be applied in IT audits.
CL IA identifies and provides training and development opportunities for its staff to ensure that their technical knowledge and skill sets remain current and relevant. (D) SHAREHOLDERS RIGHTS AND RESPONSIBILITIES
Shareholder RightsPrinciple 14:Companies should treat all shareholders fairly and equitably, and should recognise, protect and facilitate the exercise of shareholders’ rights, and continually review and update such governance arrangements.
to approve their compensation as negotiated by Management and to review and approve their discharge. The AC reviews the scope and results of the external audit and also assesses the cost effectiveness, the independence and objectivity of the external auditors. Where the auditors also supply a substantial volume of non-audit services to the Company, the AC shall keep the nature and extent of such services under review, seeking to balance the maintenance of objectivity and value for money;
(m) reviews filings with SGX-ST or other regulatory bodies which contain the Company’s and the Group’s financial statements and ensure proper disclosure;
(n) commissions and reviews the findings of internal investigations into matters where there is any suspected fraud or irregularity or failure of internal controls or infringement of any law, rule and regulation which has or is likely to have a material impact on the Group’s operating results and/or financial position. The AC is empowered to retain independent counsel, accountants or others to assist in the conduct of any investigation;
(o) reports to the Board the work performed by the AC in carrying out its functions; and
(p) considers any other matters, as defined by the Board.
A total of four AC meetings were held in FY 2013. The AC also held one meeting with the external auditors and internal auditors,
CapitaLand Limited Annual Report 2013 50 Clarity
The Company is committed to treating all its shareholders fairly and equitably and keeping all its shareholders and other stakeholders and analysts in Singapore and around the world informed of its performance and changes in the Company or its business which would be likely to materially affect the price or value of the Company’s shares, on a timely and consistent basis, so as to assist shareholders and investors in their investment decisions.
The Company provides accurate and timely disclosure of material information on the SGXNet.
All shareholders are entitled to attend AGMs and are accorded the opportunity to participate effectively and vote at AGMs. All shareholders are also informed of the rules, including voting procedures, governing such meetings.
Communication with ShareholdersPrinciple 15:Companies should actively engage their shareholders and put in place an investor relations policy to promote regular, effective and fair communication with shareholders.
The Company has in place an Investor Relations department and a Corporate Communications department which facilitate effective communication with the Company’s shareholders, analysts, fund managers and the media.
The Company actively engages with its shareholders and has put in place its Investor Relations Policy to promote regular, effective and fair communications with its shareholders. The Policy is
uploaded on the Group’s website at www.capitaland.com and is reproduced on pages 66 to 67 of this Annual Report.
The Board has established the CDC which is chaired by Mr James Koh Cher Siang and the other CDC members are Mr Lim Ming Yan and Mrs Arfat Pannir Selvam. The CDC reviews the promptness and comprehensiveness of corporate disclosures and announcements made to the SGX-ST. It ensures the adoption of good corporate governance and best practices in terms of transparency to shareholders and the investing community.
The Company makes disclosures on an immediate basis as required under the Listing Manual of the SGX-ST, or as soon as possible where immediate disclosure is not practicable. Regular briefings and meetings for analysts and the media are held, generally coinciding with the release of the Group’s second quarter and full-year results. During these briefings, Senior Management reviews the Group’s most recent performance and discusses the Company’s outlook. In the interest of transparency and broad dissemination, these briefings are webcast live and accessible to the public on the Group’s website at www.capitaland.com, materials used in the briefings are disseminated via SGXNet and recordings of the briefings are also archived on the Group’s website. In 2013, Management conducted more than 400 meetings with fund managers and institutional investors and also participated in several non-deal roadshows/conferences
in Florida, San Francisco, London, Hong Kong and Beijing.
In addition, the Company pursues opportunities to keep its retail shareholders informed through the business media, website postings and other publicity channels. Materials used in the briefings to institutional shareholders are also disseminated via SGXNet for easy access by retail shareholders.
Shareholders and potential investors have access to the Company’s website which is available in English, including a dedicated Investor Relations link providing the Company’s latest announcements and stock details. The public is able to post questions to the Company and the Board on the Company’s website through the ‘Contact Us’ link. Shareholders may also raise any enquiry to the Company and the Board by post to the Company at (in the case of shareholders in Singapore) 168 Robinson Road, #30-01 Capital Tower, Singapore 068912.
The Company has a policy on the payment of dividends. Barring unforeseen circumstances, the Company’s policy is to declare a dividend of at least 30% of the annual profit after tax and non-controlling interests excluding unrealised revaluation gains or losses as well as impairment charges or write backs.
Conduct of Shareholder MeetingsPrinciple 16:Companies should encourage greater shareholder participation at general meetings of shareholders, and allow shareholders the opportunity to communicate their views on various matters affectingthe company.
51Corporate Governance& Transparency
Manager Report
CorporateGovernance Report
changes are effected to recognise electronic voting.
Minutes of the general meetings are taken and are available to shareholders for their inspection upon their request.
Shareholders also have the opportunity to communicate their views and discuss with the Board and Management matters affecting the Company after the general meetings. The Group’s communication efforts have been recognised by the investment community. In 2013, it was conferred a number of awards which are listed on pages 16 to 19 of this Annual Report.
(E) ADDITIONAL INFORMATION
Additional Committees
Apart from the AC, CDC, ERCC, NC and RC, the Company has also set up the IC and the FBC. The IC is guided by its Terms of Reference. Specifically, the IC:
(a) approves the Group’s investments and divestments, project budget variances, asset write-offs and disposals, reported losses of money, bad debt write-offs, granting of rebates and credits, rescheduling of recoverable debts, budget variances and procurement of goods and services within certain limits; and
(b) approves the acceptance of credit facilities from financial institutions and capital markets.
The IC is chaired by Mr Ng Kee Choeand the other IC members are Mr Lim Ming Yan,
Prof Kenneth Stuart Courtis, Mr John Powell Morschel and Mr Simon Claude Israel. Apart from convening five meetings of the IC in FY 2013, the views of the IC and Board were actively sought by the SBUs and the approval of the IC was obtained where required.
The FBC reviews the Group’s annual budget and financial policies and makes recommendation to the Board for approval. The FBC is chaired by Mr Peter Seah Lim Huat and the other FBC members are Mr Ng Kee Choe, Mr Lim Ming Yan and Prof Kenneth Stuart Courtis.
The FBC is guided by its Terms of Reference. Specifically, the FBC:
(a) reviews the Group’s annual budget or financial policies. The annual budget, after being endorsed by the FBC, shall be approved by the Board;
(b) reviews the Group’s full year forecast and three-year outlook (if any); and
(c) reviews the Group Finance Manualwhich contains policies, procedures, financial authority limits and guidelines in areas such as accounting, treasury, investment appraisal, management and statutory reporting, and corporate governance. The Finance Manual and any updates, after being endorsed by the FBC, shall be approved by the Board.
A total of two FBC meetings were held in FY 2013.
The Company supports the principle of encouraging shareholder participation and voting at general meetings. Shareholders receive the summary financial report and notice of the AGM and other general meetings (if any). Notices of the AGM and other general meetings (if any) are also advertised in the press and issued via SGXNet.
At general meetings, shareholders are encouraged to communicate their views on and discuss with the Board and Management matters affecting the Company. All Directors (including the respective Chairpersons of the Board, AC, ERCC and NC), and the external auditors, would usually be present at general meetings.
To safeguard shareholder interests and rights, a separate resolution is proposed for each substantially separate issue at general meetings. To ensure transparency in the voting process and better reflect shareholders’ interest, the Company conducts electronic poll voting for shareholders/proxies present at the meeting for all the resolutions proposed at the general meetings. Votes cast, for or against and the respective percentages, on each resolution will be tallied and displayed ‘live-on-screen’ to shareholders immediately at the general meetings. The total number of votes cast for or against the resolutions and the respective percentages are also announced after the general meetings via SGXNet. Voting in absentia and by email may only be possible following careful study to ensure that the integrity of information and authentication of the identity of shareholders through the web are not compromised and legislative
CapitaLand Limited Annual Report 2013 52 Clarity
Dealings in Securities
The Company has devised and adopted a securities dealing policy for the Group’s officers and employees which applies the best practices recommendations in the Listing Manual of the SGX-ST.To this end, the Company has issued guidelines to Directors and employees in the Group, which sets out prohibitions against dealings in the Company’s securities (i) while in possession of material unpublished price-sensitive information, (ii) during the two weeks immediately preceding, and up to the time of the announcement of, the Company’s results for each of the first three quarters of its financial year and (iii) during the one month preceding, and up to the time of announcement of the Company’s results for the full financial year.
Directors and employees of the Group are also prohibited from dealing in securities of other listed entities in the Group while in possession of unpublished price-sensitive information by virtue of their status as Directors and/or employees. They are also made aware of the applicability of the insider trading laws at all times and are also discouraged from dealing in the Company’s securities on short-term considerations.
Code of Business Conduct
The Company adheres to an ethics and code of business conduct policy which deals with issues such as confidentiality, conduct and work discipline, corporate gifts and concessionary offers. Clear policies and guidelines on how to handle work place harassment and grievances are also in place.
All employees of the Company have each been given a printed employee handbook which sets out these policies clearly. The policies and guidelines are published on the Company’s intranet, which is accessible by all staff.
The Company believes that the policies it has implemented help to detect and prevent occupational fraud in mainly three ways.
First, the Company offers fair compensation packages, based on practices of pay-for-performance and promotion based on merit, to its employees. The Company also provides various healthcare subsidies and financial assistance schemes to alleviate the common financial pressures its employees face.
Second, clearly documented policies and work procedures incorporate internal controls which ensure that adequate checks and balances are in place. Periodic audits are also conducted to evaluate the efficacy of these internal controls.
Finally, the Company seeks to build and maintain the right organisational culture through its core values, educating its employees on good business conduct and ethical values.
Anti-Corruption and Bribery Policy
The Company adopts a strong stance against corruption and bribery. In addition to clear guidelines and procedures for the giving and receipt of corporate gifts and concessionary offers, all employees of the Group are required to make a declaration
on an annual basis where they pledge to uphold its core values and not to engage in any corrupt or unethical practices. The Company believes that such an initiative serves as a reminder to all employees to maintain the highest standards of integrity in their work and business dealings. The Company’s stance against corruption and bribery is frequently reiterated by Management during its regular staff communication sessions as well.
The Company’s zero tolerance policy against corruption and bribery extends to its dealings with third-party service providers and vendors. Pursuant to such policy, the Company requires that all agreementsof the Group with third-party service providers and vendors incorporate robust anti-corruption and anti-bribery provisions.
Whistle-Blowing Policy
Whistle-blowing policy and procedures are put in place to provide the Group’s employees and parties who have dealings with the Group with well defined, accessible and trusted channels to report suspected fraud, corruption, dishonest practices or other impropriety in the workplace, and for the independent investigation of any reported incidents and appropriate follow up action. The objective of the whistle-blowing policy is to encourage the reporting of such matters - that employees or external parties making any reports in good faith will be able to do so with the confidence that they will be treated fairly, and to the extent possible, be protected from reprisal.
53Corporate Governance& Transparency
Manager Report
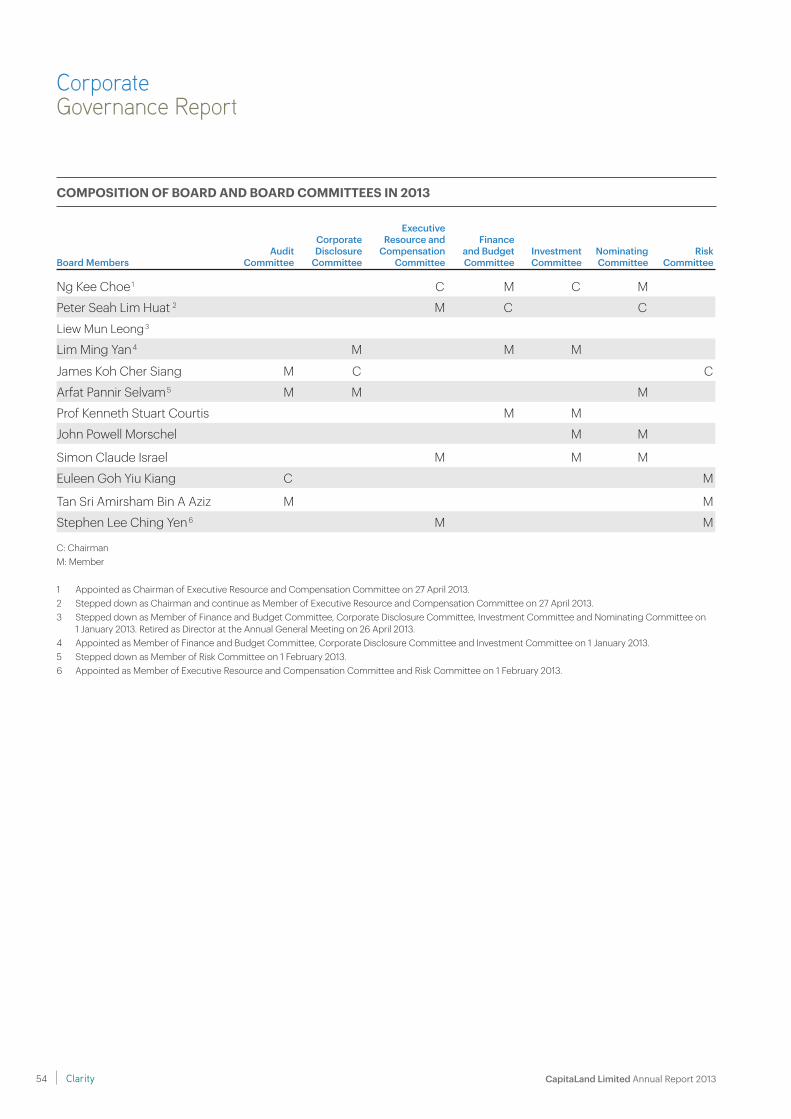
C: ChairmanM: Member
1 Appointed as Chairman of Executive Resource and Compensation Committee on 27 April 2013.2 Stepped down as Chairman and continue as Member of Executive Resource and Compensation Committee on 27 April 2013.3 Stepped down as Member of Finance and Budget Committee, Corporate Disclosure Committee, Investment Committee and Nominating Committee on
1 January 2013. Retired as Director at the Annual General Meeting on 26 April 2013. 4 Appointed as Member of Finance and Budget Committee, Corporate Disclosure Committee and Investment Committee on 1 January 2013.5 Stepped down as Member of Risk Committee on 1 February 2013.6 Appointed as Member of Executive Resource and Compensation Committee and Risk Committee on 1 February 2013.
CorporateGovernance Report
COMPOSITION OF BOARD AND BOARD COMMITTEES IN 2013
Board MembersAudit
Committee
Corporate Disclosure
Committee
Executive Resource and
Compensation Committee
Finance and Budget Committee
Investment Committee
Nominating Committee
Risk Committee
Ng Kee Choe1 C M C M
Peter Seah Lim Huat 2 M C C
Liew Mun Leong 3
Lim Ming Yan4 M M M
James Koh Cher Siang M C C
Arfat Pannir Selvam5 M M M
Prof Kenneth Stuart Courtis M M
John Powell Morschel M M
Simon Claude Israel M M M
Euleen Goh Yiu Kiang C M
Tan Sri Amirsham Bin A Aziz M M
Stephen Lee Ching Yen6 M M
CapitaLand Limited Annual Report 2013 54 Clarity
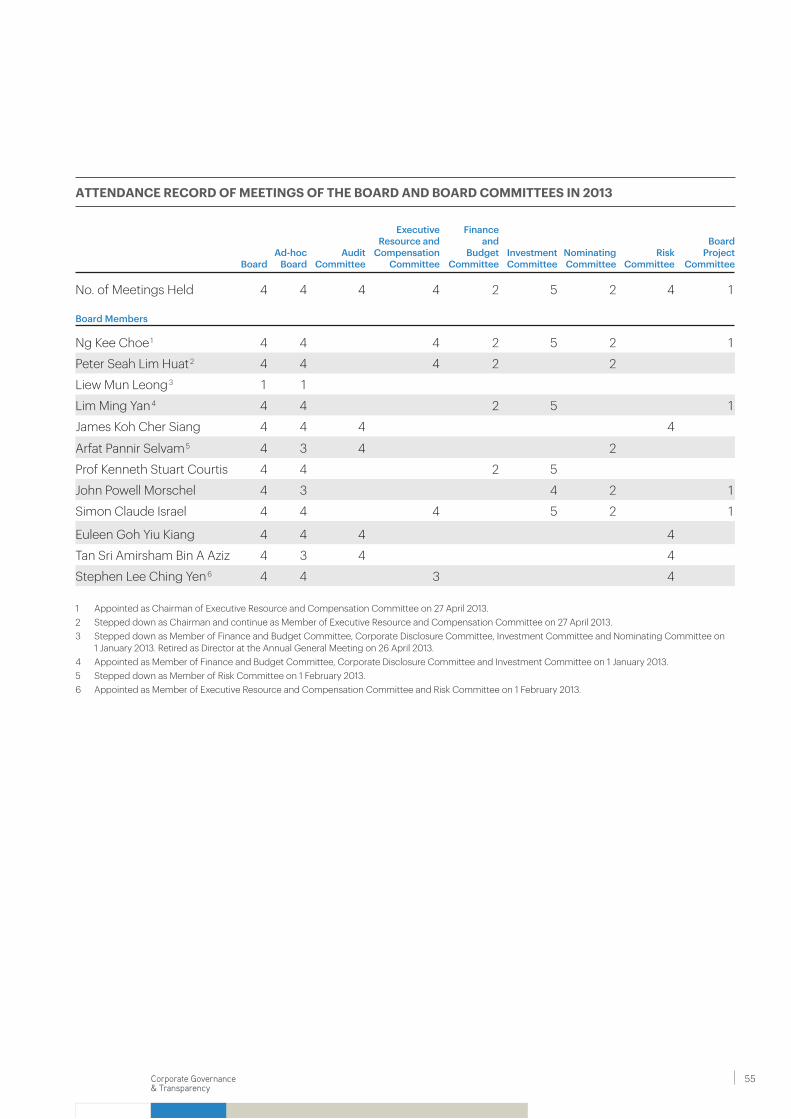
ATTENDANCE RECORD OF MEETINGS OF THE BOARD AND BOARD COMMITTEES IN 2013
BoardAd-hoc
BoardAudit
Committee
Executive Resource and
Compensation Committee
Financeand
BudgetCommittee
Investment Committee
NominatingCommittee
Risk Committee
BoardProject
Committee
No. of Meetings Held 4 4 4 4 2 5 2 4 1
Board Members
Ng Kee Choe 1 4 4 4 2 5 2 1
Peter Seah Lim Huat 2 4 4 4 2 2
Liew Mun Leong3 1 1
Lim Ming Yan 4 4 4 2 5 1
James Koh Cher Siang 4 4 4 4
Arfat Pannir Selvam 5 4 3 4 2
Prof Kenneth Stuart Courtis 4 4 2 5
John Powell Morschel 4 3 4 2 1
Simon Claude Israel 4 4 4 5 2 1
Euleen Goh Yiu Kiang 4 4 4 4
Tan Sri Amirsham Bin A Aziz 4 3 4 4
Stephen Lee Ching Yen6 4 4 3 4
1 Appointed as Chairman of Executive Resource and Compensation Committee on 27 April 2013.2 Stepped down as Chairman and continue as Member of Executive Resource and Compensation Committee on 27 April 2013.3 Stepped down as Member of Finance and Budget Committee, Corporate Disclosure Committee, Investment Committee and Nominating Committee on
1 January 2013. Retired as Director at the Annual General Meeting on 26 April 2013. 4 Appointed as Member of Finance and Budget Committee, Corporate Disclosure Committee and Investment Committee on 1 January 2013.5 Stepped down as Member of Risk Committee on 1 February 2013.6 Appointed as Member of Executive Resource and Compensation Committee and Risk Committee on 1 February 2013.
55Corporate Governance& Transparency
Manager Report
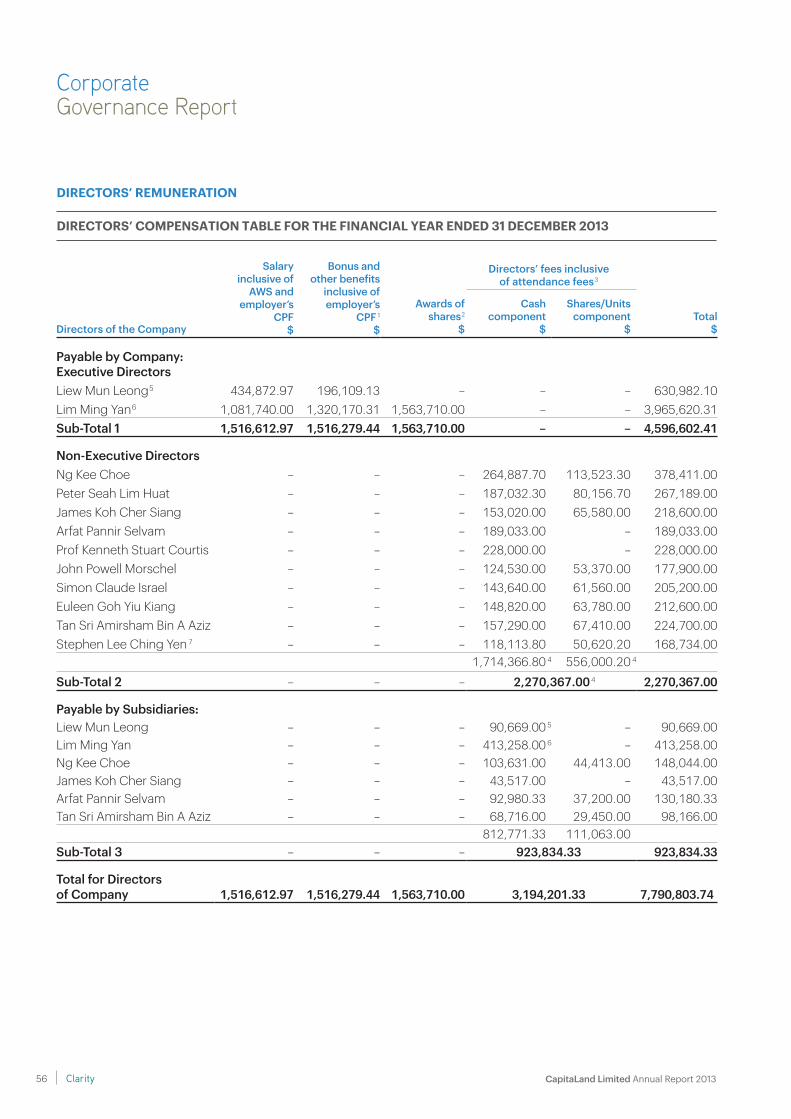
CorporateGovernance Report
DIRECTORS’ REMUNERATION
DIRECTORS’ COMPENSATION TABLE FOR THE FINANCIAL YEAR ENDED 31 DECEMBER 2013
Directors of the Company
Salary inclusive of
AWS andemployer’s
CPF$
Bonus andother benefits
inclusive ofemployer’s
CPF 1
$
Directors’ fees inclusiveof attendance fees 3
Total$
Awards ofshares 2
$
Cashcomponent
$
Shares/Unitscomponent
$
Payable by Company:Executive DirectorsLiew Mun Leong 5 434,872.97 196,109.13 – – – 630,982.10Lim Ming Yan 6 1,081,740.00 1,320,170.31 1,563,710.00 – – 3,965,620.31Sub-Total 1 1,516,612.97 1,516,279.44 1,563,710.00 – – 4,596,602.41
Non-Executive DirectorsNg Kee Choe – – – 264,887.70 113,523.30 378,411.00Peter Seah Lim Huat – – – 187,032.30 80,156.70 267,189.00James Koh Cher Siang – – – 153,020.00 65,580.00 218,600.00Arfat Pannir Selvam – – – 189,033.00 – 189,033.00Prof Kenneth Stuart Courtis – – – 228,000.00 – 228,000.00John Powell Morschel – – – 124,530.00 53,370.00 177,900.00Simon Claude Israel – – – 143,640.00 61,560.00 205,200.00Euleen Goh Yiu Kiang – – – 148,820.00 63,780.00 212,600.00Tan Sri Amirsham Bin A Aziz – – – 157,290.00 67,410.00 224,700.00Stephen Lee Ching Yen 7 – – – 118,113.80 50,620.20 168,734.00
1,714,366.80 4 556,000.20 4
Sub-Total 2 – – – 2,270,367.00 4 2,270,367.00
Payable by Subsidiaries:Liew Mun Leong – – – 90,669.00 5 – 90,669.00Lim Ming Yan – – – 413,258.00 6 – 413,258.00Ng Kee Choe – – – 103,631.00 44,413.00 148,044.00James Koh Cher Siang – – – 43,517.00 – 43,517.00Arfat Pannir Selvam – – – 92,980.33 37,200.00 130,180.33Tan Sri Amirsham Bin A Aziz – – – 68,716.00 29,450.00 98,166.00
812,771.33 111,063.00Sub-Total 3 – – – 923,834.33 923,834.33
Total for Directors of Company 1,516,612.97 1,516,279.44 1,563,710.00 3,194,201.33 7,790,803.74
CapitaLand Limited Annual Report 2013 56 Clarity
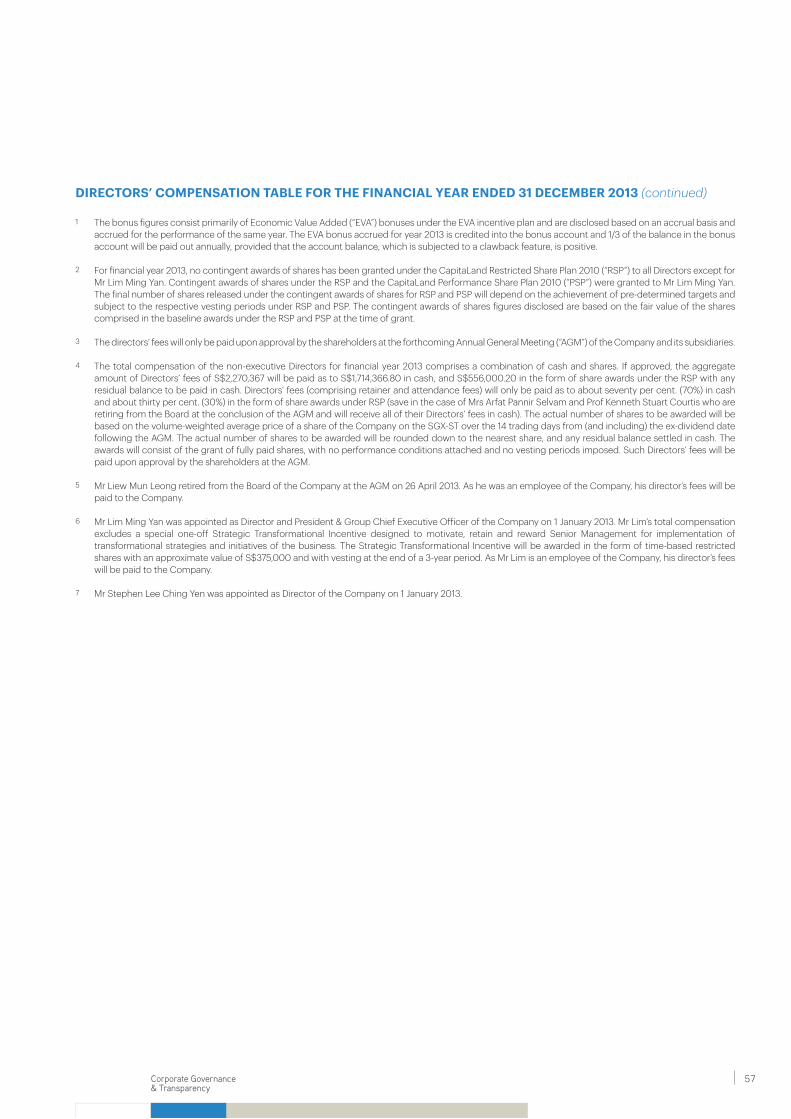
DIRECTORS’ COMPENSATION TABLE FOR THE FINANCIAL YEAR ENDED 31 DECEMBER 2013 (continued)
1 The bonus figures consist primarily of Economic Value Added (“EVA”) bonuses under the EVA incentive plan and are disclosed based on an accrual basis and accrued for the performance of the same year. The EVA bonus accrued for year 2013 is credited into the bonus account and 1/3 of the balance in the bonus account will be paid out annually, provided that the account balance, which is subjected to a clawback feature, is positive.
2 For financial year 2013, no contingent awards of shares has been granted under the CapitaLand Restricted Share Plan 2010 (“RSP”) to all Directors except for Mr Lim Ming Yan. Contingent awards of shares under the RSP and the CapitaLand Performance Share Plan 2010 (“PSP”) were granted to Mr Lim Ming Yan. The final number of shares released under the contingent awards of shares for RSP and PSP will depend on the achievement of pre-determined targets and subject to the respective vesting periods under RSP and PSP. The contingent awards of shares figures disclosed are based on the fair value of the shares comprised in the baseline awards under the RSP and PSP at the time of grant.
3 The directors’ fees will only be paid upon approval by the shareholders at the forthcoming Annual General Meeting (“AGM”) of the Company and its subsidiaries.
4 The total compensation of the non-executive Directors for financial year 2013 comprises a combination of cash and shares. If approved, the aggregate amount of Directors’ fees of S$2,270,367 will be paid as to S$1,714,366.80 in cash, and S$556,000.20 in the form of share awards under the RSP with any residual balance to be paid in cash. Directors’ fees (comprising retainer and attendance fees) will only be paid as to about seventy per cent. (70%) in cash and about thirty per cent. (30%) in the form of share awards under RSP (save in the case of Mrs Arfat Pannir Selvam and Prof Kenneth Stuart Courtis who are retiring from the Board at the conclusion of the AGM and will receive all of their Directors’ fees in cash). The actual number of shares to be awarded will be based on the volume-weighted average price of a share of the Company on the SGX-ST over the 14 trading days from (and including) the ex-dividend date following the AGM. The actual number of shares to be awarded will be rounded down to the nearest share, and any residual balance settled in cash. The awards will consist of the grant of fully paid shares, with no performance conditions attached and no vesting periods imposed. Such Directors’ fees will be paid upon approval by the shareholders at the AGM.
5 Mr Liew Mun Leong retired from the Board of the Company at the AGM on 26 April 2013. As he was an employee of the Company, his director’s fees will be paid to the Company.
6 Mr Lim Ming Yan was appointed as Director and President & Group Chief Executive Officer of the Company on 1 January 2013. Mr Lim’s total compensation excludes a special one-off Strategic Transformational Incentive designed to motivate, retain and reward Senior Management for implementation of transformational strategies and initiatives of the business. The Strategic Transformational Incentive will be awarded in the form of time-based restricted shares with an approximate value of S$375,000 and with vesting at the end of a 3-year period. As Mr Lim is an employee of the Company, his director’s fees will be paid to the Company.
7 Mr Stephen Lee Ching Yen was appointed as Director of the Company on 1 January 2013.
57Corporate Governance& Transparency
Manager Report
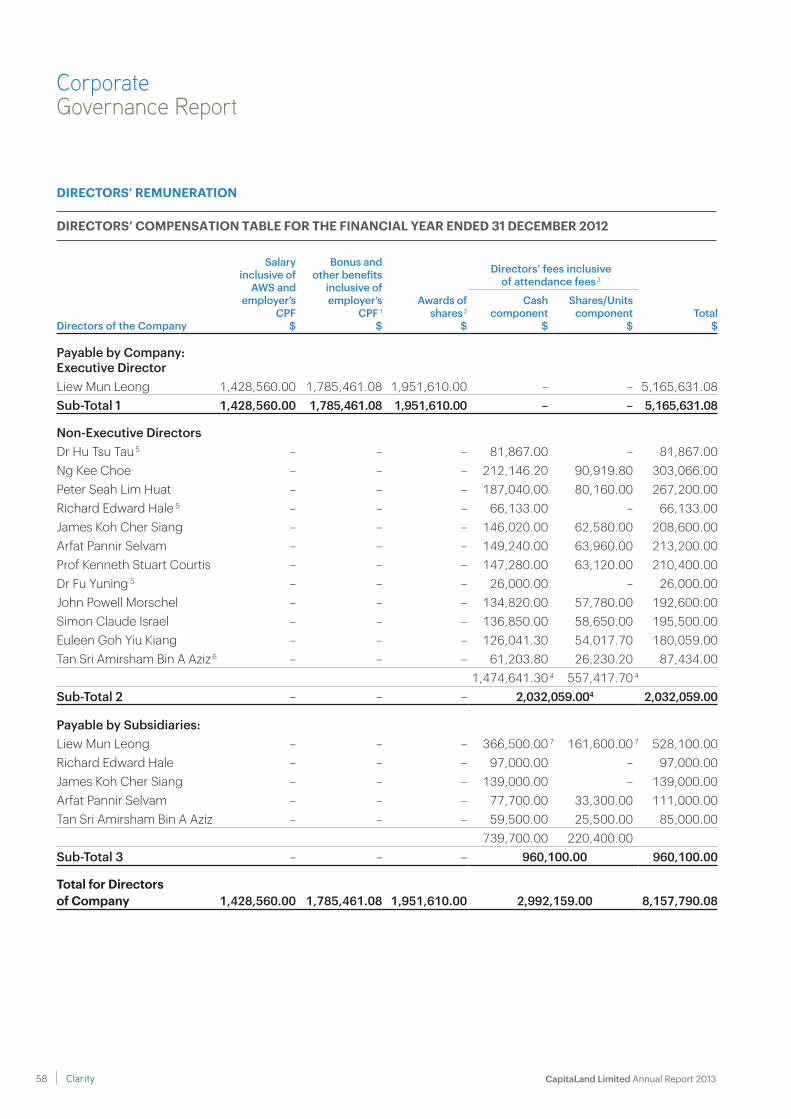
CorporateGovernance Report
DIRECTORS’ REMUNERATION
DIRECTORS’ COMPENSATION TABLE FOR THE FINANCIAL YEAR ENDED 31 DECEMBER 2012
Directors of the Company
Salary inclusive of
AWS andemployer’s
CPF$
Bonus andother benefits
inclusive ofemployer’s
CPF 1
$
Directors’ fees inclusiveof attendance fees 3
Total$
Awards ofshares 2
$
Cashcomponent
$
Shares/Unitscomponent
$
Payable by Company:Executive DirectorLiew Mun Leong 1,428,560.00 1,785,461.08 1,951,610.00 – – 5,165,631.08Sub-Total 1 1,428,560.00 1,785,461.08 1,951,610.00 – – 5,165,631.08
Non-Executive DirectorsDr Hu Tsu Tau 5 – – – 81,867.00 – 81,867.00Ng Kee Choe – – – 212,146.20 90,919.80 303,066.00Peter Seah Lim Huat – – – 187,040.00 80,160.00 267,200.00Richard Edward Hale 5 – – – 66,133.00 – 66,133.00James Koh Cher Siang – – – 146,020.00 62,580.00 208,600.00Arfat Pannir Selvam – – – 149,240.00 63,960.00 213,200.00Prof Kenneth Stuart Courtis – – – 147,280.00 63,120.00 210,400.00Dr Fu Yuning 5 – – – 26,000.00 – 26,000.00John Powell Morschel – – – 134,820.00 57,780.00 192,600.00Simon Claude Israel – – – 136,850.00 58,650.00 195,500.00Euleen Goh Yiu Kiang – – – 126,041.30 54,017.70 180,059.00Tan Sri Amirsham Bin A Aziz 6 – – – 61,203.80 26,230.20 87,434.00
1,474,641.30 4 557,417.70 4
Sub-Total 2 – – – 2,032,059.004 2,032,059.00
Payable by Subsidiaries:Liew Mun Leong – – – 366,500.00 7 161,600.00 7 528,100.00Richard Edward Hale – – – 97,000.00 – 97,000.00James Koh Cher Siang – – – 139,000.00 – 139,000.00Arfat Pannir Selvam – – – 77,700.00 33,300.00 111,000.00Tan Sri Amirsham Bin A Aziz – – – 59,500.00 25,500.00 85,000.00
739,700.00 220,400.00Sub-Total 3 – – – 960,100.00 960,100.00
Total for Directors of Company 1,428,560.00 1,785,461.08 1,951,610.00 2,992,159.00 8,157,790.08
CapitaLand Limited Annual Report 2013 58 Clarity
DIRECTORS’ COMPENSATION TABLE FOR THE FINANCIAL YEAR ENDED 31 DECEMBER 2012 (continued)
1 The bonus figures consist primarily of Economic Value Added (“EVA”) bonuses under the EVA incentive plan and are disclosed based on an accrual basis and accrued for the performance of the same year. The EVA bonus for the year 2012 is lower than 2011 due to lower portfolio gain. The EVA bonus accrued for year 2012 is credited into the bonus account and 1/3 of the balance in the bonus account will be paid out annually, provided that the account balance, which is subjected to a clawback feature, is positive.
2 For the year 2012, no contingent awards of shares has been granted under the CapitaLand Restricted Share Plan 2010 (“RSP”) to all Directors except for Mr Liew Mun Leong. Contingent awards of shares under the RSP and the CapitaLand Performance Share Plan 2010 (“PSP”) were granted to Mr Liew Mun Leong. The final number of shares released under the contingent awards of shares for RSP and PSP will depend on the achievement of pre-determined targets and subject to the respective vesting period under RSP and PSP. The contingent awards of shares figures disclosed are based on the fair value of the shares comprised in the baseline awards under the RSP and PSP at the time of grant.
3 The directors’ fees will only be paid upon approval by the shareholders at the forthcoming Annual General Meeting of the Company and its subsidiaries.
4 The total compensation of the non-executive Directors for 2012 of an aggregate amount of S$2,032,059, if approved, will be paid as to S$1,474,641.30 in cash, and S$557,417.70 in the form of share awards under the RSP. Consequently, and in accordance with the “Directors’ Fee Policy”, a non-executive Director who served on the Board during 2012 (with the exception of Dr Hu Tsu Tau, Mr Richard Edward Hale and Dr Fu Yuning, who retired from the Board during 2012) will be remunerated as to about 70 per cent. (70%) of his total Directors’ fees in cash and about 30 per cent. (30%) of his total Directors’ fees in the form of shares in the Company. The actual number of shares to be awarded will be based on the volume-weighted average price of a share on the SGX-ST over the 14 trading days from (and including) the ex-dividend date following the Company’s Annual General Meeting, rounded down to the nearest share, and any residual balance settled in cash. The awards will consist of the grant of fully paid shares, with no performance conditions attached and no vesting periods imposed. Each of Dr Hu Tsu Tau, Mr Richard Edward Hale and Dr Fu Yuning will receive all of their Directors’ fees in cash.
5 Dr Hu Tsu Tau and Mr Richard Edward Hale retired from the Board of the Company from the Annual General Meeting on 30 April 2012. Dr Fu Yuning retired from the Board of the Company at the Annual General Meeting on 30 April 2012.
6 Tan Sri Amirsham Bin A Aziz was appointed as Director of the Company on 30 July 2012.
7 Mr Liew Mun Leong is an employee of the Company. The cash component of his directors’ fees will be paid to the Company, but he will be entitled to retain the shares component of the subsidiaries and/or units component of the real estate investment trusts managed by the subsidiaries.
59Corporate Governance& Transparency
Manager Report
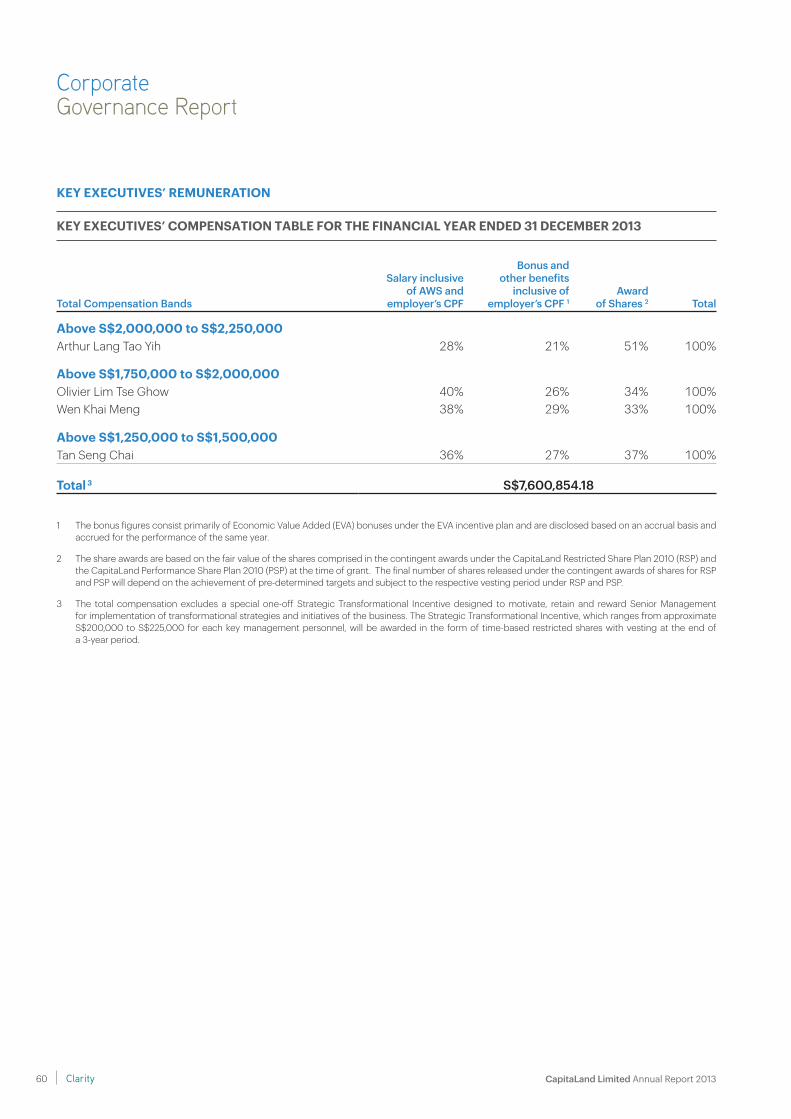
1 The bonus figures consist primarily of Economic Value Added (EVA) bonuses under the EVA incentive plan and are disclosed based on an accrual basis and accrued for the performance of the same year.
2 The share awards are based on the fair value of the shares comprised in the contingent awards under the CapitaLand Restricted Share Plan 2010 (RSP) and the CapitaLand Performance Share Plan 2010 (PSP) at the time of grant. The final number of shares released under the contingent awards of shares for RSP and PSP will depend on the achievement of pre-determined targets and subject to the respective vesting period under RSP and PSP.
3 The total compensation excludes a special one-off Strategic Transformational Incentive designed to motivate, retain and reward Senior Management for implementation of transformational strategies and initiatives of the business. The Strategic Transformational Incentive, which ranges from approximate S$200,000 to S$225,000 for each key management personnel, will be awarded in the form of time-based restricted shares with vesting at the end of a 3-year period.
CorporateGovernance Report
Total Compensation Bands
Salary inclusive of AWS and
employer’s CPF
Bonus andother benefits
inclusive ofemployer’s CPF 1
Awardof Shares 2 Total
Above S$2,000,000 to S$2,250,000Arthur Lang Tao Yih 28% 21% 51% 100%
Above S$1,750,000 to S$2,000,000Olivier Lim Tse Ghow 40% 26% 34% 100%Wen Khai Meng 38% 29% 33% 100%
Above S$1,250,000 to S$1,500,000Tan Seng Chai 36% 27% 37% 100%
Total 3 S$7,600,854.18
KEY EXECUTIVES’ REMUNERATION
KEY EXECUTIVES’ COMPENSATION TABLE FOR THE FINANCIAL YEAR ENDED 31 DECEMBER 2013
CapitaLand Limited Annual Report 2013 60 Clarity
Enterprise Risk Management
ENTERPRISE RISK MANAGEMENTRisk management is an integral part of CapitaLand’s business activities whether at a strategic or operational level. Through proactive risk management, which supports the Group’s business objectives and corporate strategy, value is created and preserved.
The Group recognises that risk management is about opportunities as much as threats. To capitalise on opportunities, the Group has to take risks. Therefore, risk management is not about pursuing risk minimisation as a goal but rather optimising the risk-reward relationship, within known and agreed risk appetite levels. The Group therefore takes risks in a prudent manner for justifiable business reasons.
The Board of Directors is overall responsible for the governance of risk across the Group. Such responsibilities include determining the Group’s risk appetite and risk policies, overseeing the Group’s Risk Management Framework, regularly reviewing the Group’s risk profile, material risks and mitigation strategies, and ensuring the effectiveness of Risk Management policies and procedures. For these purposes, it is assisted by the Risk Committee (RC), established in 2002, to provide dedicated oversight of risk management at the Board level.
The RC currently comprises four independent board members and meets on a quarterly basis. The meetings are attended
by the President & Group CEO as well as other key management staff. The RC is assisted by the Risk Assessment Group (RAG), an independent in-house unit with highly specialised and professional members having diverse experience in financial, operational and enterprise risk management.
In determining the nature and extent of significant risks which the Group is willing to take to achieve its strategic objectives, the Board has approved the Group’s risk appetite which is expressed via formal, high-level statements and accompanying comprehensive risk limits/parameters which determine specific risk boundaries established at an operational level. Having considered key stakeholders’ interests, the Group’s Risk Appetite Statement (RAS) aims to set out explicit, forward-looking views of the Group’s desired risk profile and is aligned to the Group’s strategy and business plans.
An Enterprise Risk Management Committee (ERMC), established in 2012, comprising key management staff at the Group level is responsible for directing and monitoring the development, implementation and practice of Enterprise Risk Management (ERM) across the Group. The ERMC is chaired by the Group CFO and reports through President & Group CEO to the RC. Operationally, the ERMC is supported by a network of risk champions from the different Strategic Business Units (SBUs) and corporate functions as well as various specialist support functions which are tasked to develop, implement and monitor risk management policies,
methodologies and procedures in their respective areas. For example, RAG covers the area of ERM while the Operations Compliance Unit provides oversight and support in the area of Bribery and Corruption Prevention.
61Corporate Governance& Transparency
Manager Report
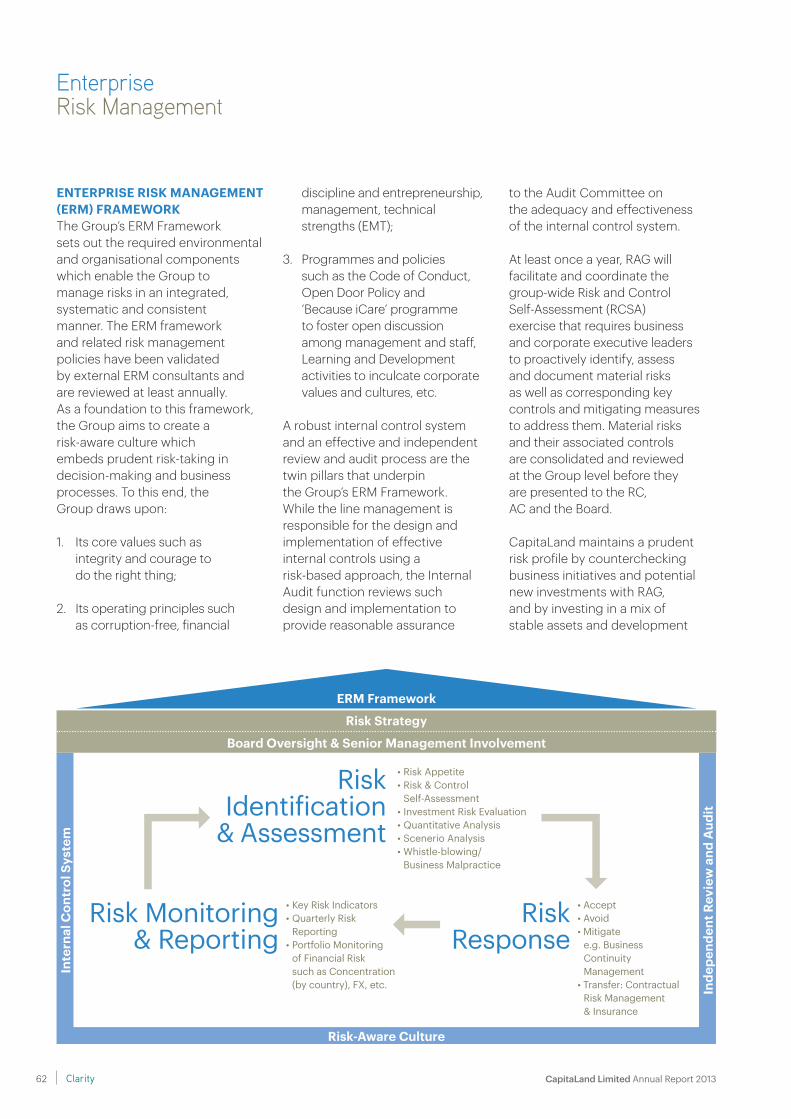
Enterprise Risk Management
ENTERPRISE RISK MANAGEMENT (ERM) FRAMEWORKThe Group’s ERM Framework sets out the required environmental and organisational components which enable the Group to manage risks in an integrated, systematic and consistent manner. The ERM framework and related risk management policies have been validated by external ERM consultants and are reviewed at least annually. As a foundation to this framework, the Group aims to create a risk-aware culture which embeds prudent risk-taking in decision-making and business processes. To this end, the Group draws upon:
1. Its core values such as integrity and courage to do the right thing;
2. Its operating principles such as corruption-free, financial
discipline and entrepreneurship, management, technical strengths (EMT);
3. Programmes and policies such as the Code of Conduct, Open Door Policy and ‘Because iCare’ programme to foster open discussion among management and staff, Learning and Development activities to inculcate corporate values and cultures, etc.
A robust internal control system and an effective and independent review and audit process are the twin pillars that underpin the Group’s ERM Framework. While the line management is responsible for the design and implementation of effective internal controls using a risk-based approach, the Internal Audit function reviews such design and implementation to provide reasonable assurance
to the Audit Committee on the adequacy and effectiveness of the internal control system.
At least once a year, RAG will facilitate and coordinate the group-wide Risk and Control Self-Assessment (RCSA) exercise that requires business and corporate executive leaders to proactively identify, assess and document material risks as well as corresponding key controls and mitigating measures to address them. Material risks and their associated controls are consolidated and reviewed at the Group level before they are presented to the RC, AC and the Board.
CapitaLand maintains a prudent risk profile by counterchecking business initiatives and potential new investments with RAG, and by investing in a mix of stable assets and development
Risk-Aware Culture
ERM Framework
Risk Strategy
Board Oversight & Senior Management Involvement
Risk Identification
& Assessment
Risk Monitoring & Reporting
Risk Response
• Risk Appetite• Risk & Control
Self-Assessment• Investment Risk Evaluation • Quantitative Analysis• Scenerio Analysis• Whistle-blowing/
Business Malpractice
• Key Risk Indicators• Quarterly Risk
Reporting • Portfolio Monitoring
of Financial Risksuch as Concentration (by country), FX, etc.
• Accept• Avoid• Mitigate
e.g. Business Continuity Management
• Transfer: Contractual Risk Management & Insurance
Inde
pend
ent R
evie
w a
nd A
udit
Inte
rnal
Con
trol
Sys
tem
CapitaLand Limited Annual Report 2013 62 Clarity
properties. On a quarterly basis, RAG generates and presents to the RC a comprehensive group-wide portfolio risk report that measures a wide spectrum of risks and keeps the Board and management apprised of the risk profiles of activities and investments in different countries. RAG employs an innovative, state-of-the-art Value-at-Risk (VaR) model that is adapted from the banking industry and is especially tailored for the real estate industry. This is a comprehensive risk measurement tool that measures the Group’s potential value deterioration of all material risk exposures using a historical simulation method.
Understanding that the property market is dynamic and ever-changing, RAG conducts regular and comprehensive risk studies based on the Group’s material risks. Detailed findings including results from scenario analyses and stress testing are presented as part of the quarterly risk report to the RC.
At the individual project level, RAG performs an independent risk evaluation for investment proposals above a stipulated investment value threshold to ensure that significant risks are adequately identified and thoroughly assessed. Benchmarked against market comparables and historical data, RAG objectively challenges the financial projections and where appropriate and possible, suggests project improvement structures to mitigate significant risks and systematically improve the risk-return profile.
To ensure that potential returns are commensurate with the risks
undertaken, RAG is instrumental in computing risk-adjusted weighted average cost of capital and investment hurdle rates for individual countries and business units according to their respective risk profiles. These benchmarks are reviewed annually and when necessary, adjustments are made to reflect changes in business risk and costs of investments.
In addition, RAG maintains a contingent obligation risk registry which captures all contingent risks mainly arising from treasury activities, commercial deals and legal suits. Contingent risks are objectively priced on a regular basis using established risk pricing models such as Monte Carlo simulation and Binomial Tree techniques.
CapitaLand believes that having the right risk culture and people with the right attitude, values and knowledge are fundamental to the Group’s success. Therefore, RAG continues to enhance risk management knowledge within the Group to promote a culture of risk awareness through conducting regular risk workshops for all levels and functions, and communicating frequently via internally published risk management articles.
63Corporate Governance& Transparency
Manager Report
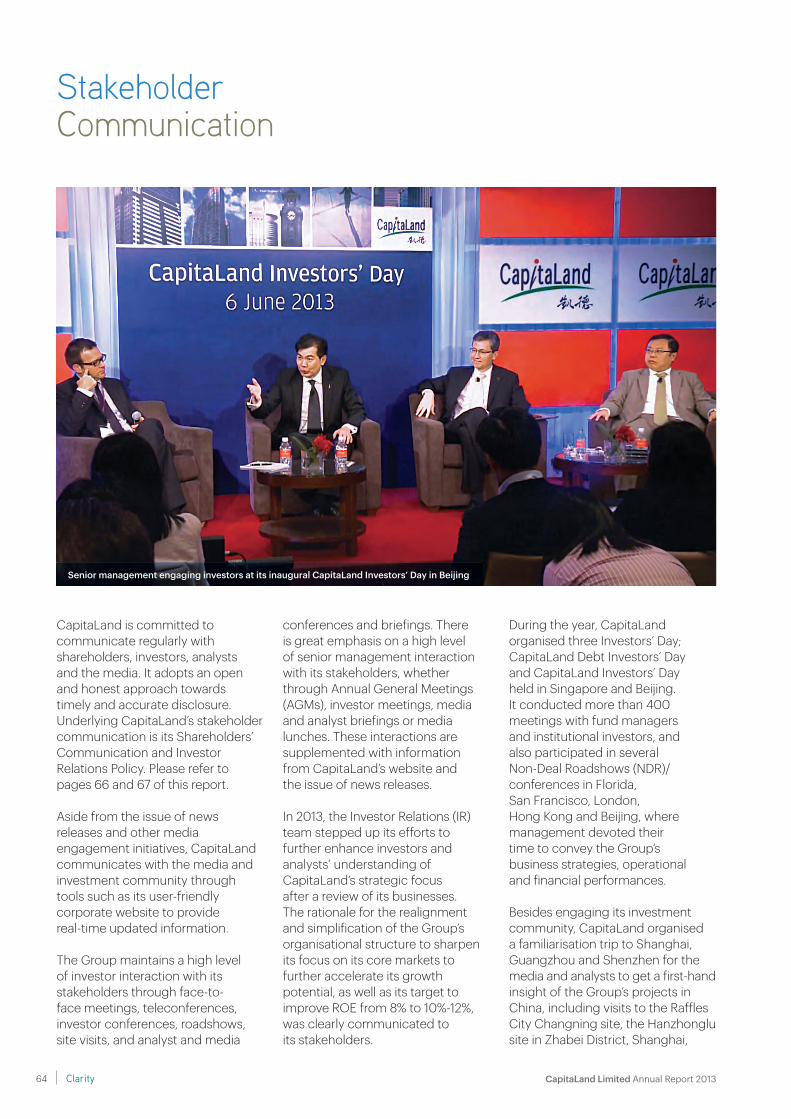
Stakeholder Communication
CapitaLand is committed to communicate regularly with shareholders, investors, analysts and the media. It adopts an open and honest approach towards timely and accurate disclosure. Underlying CapitaLand’s stakeholder communication is its Shareholders’ Communication and Investor Relations Policy. Please refer to pages 66 and 67 of this report.
Aside from the issue of news releases and other media engagement initiatives, CapitaLand communicates with the media and investment community through tools such as its user-friendly corporate website to provide real-time updated information.
The Group maintains a high level of investor interaction with its stakeholders through face-to-face meetings, teleconferences, investor conferences, roadshows, site visits, and analyst and media
conferences and briefings. There is great emphasis on a high level of senior management interaction with its stakeholders, whether through Annual General Meetings (AGMs), investor meetings, media and analyst briefings or media lunches. These interactions are supplemented with information from CapitaLand’s website and the issue of news releases.
In 2013, the Investor Relations (IR)team stepped up its efforts to further enhance investors and analysts’ understanding of CapitaLand’s strategic focus after a review of its businesses. The rationale for the realignment and simplification of the Group’s organisational structure to sharpen its focus on its core markets to further accelerate its growth potential, as well as its target to improve ROE from 8% to 10%-12%, was clearly communicated to its stakeholders.
During the year, CapitaLand organised three Investors’ Day; CapitaLand Debt Investors’ Day and CapitaLand Investors’ Day held in Singapore and Beijing. It conducted more than 400 meetings with fund managers and institutional investors, and also participated in several Non-Deal Roadshows (NDR)/conferences in Florida, San Francisco, London, Hong Kong and Beijing, where management devoted their time to convey the Group’s business strategies, operational and financial performances.
Besides engaging its investment community, CapitaLand organised a familiarisation trip to Shanghai, Guangzhou and Shenzhen for the media and analysts to get a first-hand insight of the Group’s projects in China, including visits to the Raffles City Changning site, the Hanzhonglu site in Zhabei District, Shanghai,
Senior management engaging investors at its inaugural CapitaLand Investors’ Day in Beijing
CapitaLand Limited Annual Report 2013 64 Clarity
2013 INVESTOR RELATIONS CALENDAR
1ST QUARTER
• 1st Analysts’ Briefing by President & Group CEO
• FY 2012 financial results briefing to media and analysts and live webcast
• Goldman Sachs NDR (Hong Kong)
• Citi 18th Annual Global Property CEO Conference (Florida)
• Macquarie NDR (San Francisco)
• Credit Suisse 16th Asian Investment Conference (Hong Kong)
2ND QUARTER
• Annual General Meeting
• Release of 1Q 2013 financial results
• 2nd Singapore Investment Week 2013 organised by Securities Investors Association (Singapore)
• HSBC 3rd Annual ASEAN Conference (Singapore)
• 4th Annual DB Access Asia Conference (Singapore)
• JPMorgan China Summit 2013 (Beijing)
• CapitaLand Investors’ Day (Beijing)
• Nomura Investment Forum Asia 2013(Singapore)
3RD QUARTER
• 1H 2013 financial results briefing to media and analysts and live webcast
• Credit Suisse NDR (Hong Kong)
• CapitaLand Debt Investors’ Day (Singapore)
• Macquarie ASEAN Conference (Singapore)
• CLSA Investors’ Forum 2013 (Hong Kong)
4TH QUARTER
• Release of 3Q 2013 financial results
• CapitaLand Investors’ Day (Singapore)
• Morgan Stanley 12th Annual Asia Pacific Summit (Singapore)
• CapitaLand Media & Analysts’ Familiarisation Trip to Shanghai, Guangzhou and Shenzhen
• UBS Global Real Estate CEO/CFO Conference (London)
and an in-depth perspective of the Group’s first urban renewal project in Datansha Island, Guangzhou. Through these projects, the Group showed its competitive advantage in mixed-use developments by leveraging its core competencies in homes, offices, shopping malls and serviced residences. Aside from the media and analyst trip, the IR team facilitated nine site visits for fund managers in Singapore and China.
Separately, CapitaLand reached out to retail shareholders through participation in the second Singapore Investment Week organised by the Securities
Investors Association (Singapore) which attracted 2,500 retail investors over a two-day weekend investment seminar held in English, and for the first time in Chinese. During the event, the IR team took the opportunity to present CapitaLand’s strategy to the audience.
CapitaLand’s stakeholder communication efforts have been recognised by the investment community. It was conferred a number of awards, including the Most Transparent Company Award(Real Estate) for the 13th consecutive year and the prestigious Golden Circle Award for the second
consecutive year by the Securities Investors Association (Singapore) Investors’ Choice Awards 2013; and the Grand Prix for Best Overall Investor Relations, Best Investment Community Meetings and Best in Sector (Real Estate) awards by IR Magazine - South East Asia 2013. In addition, it received the highest honour as a top investor relations performer in The IR Magazine’s Global Top 50 (Global Top 50). The Global Top 50 is the first of its kind, recognising top performers in investor relations across South East Asia, Greater China,the US, Canada, Europe and Brazil.
65Corporate Governance& Transparency
Manager Report
Stakeholder Communication
SHAREHOLDERS’ COMMUNICATION AND INVESTOR RELATIONS POLICY
1. GENERAL POLICYAt all times, CapitaLand is committed to making timely, full and accurate disclosure and distributing other corporate communications materials* in accordance with the Singapore Code of Corporate Governance 2012.
1.1 All disclosures submitted to the Singapore Exchange Securities Trading Limited (SGX-ST) through SGXNET shall be made available on CapitaLand’s well-maintained and updated corporate website.
1.2 This Policy is subject to regular review by the senior management and board of directors of CapitaLand (the Board) to ensure its effectiveness. Updates and amendments (as appropriate) will be made to reflect current best practices in our communication with Shareholders and the investment community.
* Other corporate communication materials refer to any document issued or to be issued by CapitaLand for the information or action of its Shareholders, including, but not limited to, the annual report, a notice of meeting, a circular and a proxy form.
2. SHAREHOLDERS’ RIGHTS CapitaLand is also committed
to treating all Shareholders fairly and equitably, and would recognise, protect and facilitate the exercise of Shareholders’ rights, and continually review and update such governance arrangements by adhering to the following guidelines:
2.1 CapitaLand would facilitate the opportunity for Shareholders to participate effectively in and vote at general meetings of Shareholders. Shareholders would also be informed of the rules, including voting procedures that govern general meetings of Shareholders.
2.2 CapitaLand would allow corporations which provide nominee or custodial services to appoint more than two proxies so that Shareholders who hold shares through such corporations can attend and participate in general meetingsas proxies.
3. COMMUNICATION PRINCIPLES3.1 CapitaLand strives
to provide pertinent and accurate information to its Shareholders and the investment community in an effective and timely manner.
3.2 CapitaLand will use clear and plain language in its communication with its Shareholders.
3.3 CapitaLand endeavours to provide a consistent level of disclosure on both positive and negative developments of the organisation.
3.4 CapitaLand will communicate only through its designated spokespersons.
3.5 CapitaLand and its designated senior spokespersons will establish and maintain regular dialogue with Shareholders, analysts and the media through press cum analysts’ briefings, investor roadshows or Investors’ Day briefings in order to solicit and understand the views of Shareholders, analysts and the media.
3.6 CapitaLand does not respond to rumours. However, if rumours indicate that material information has been leaked or they are in fact false or inaccurate, the rumours will be promptly denied or clarified via announcements made through SGXNET to SGX-ST.
3.7 CapitaLand observes a “blackout period” of two weeks prior to the announcement of its quarterly results and one month prior to the announcement of its full-year results. During this period, CapitaLand does not comment on industry outlook, the Group’s business performance and financial results.
4. COMMUNICATION STRATEGIES4.1 CapitaLand actively engages
its Shareholders and the investment community via:
(i) Annual General Meeting (AGM) and Extraordinary General Meeting (EGM) if necessary;
(ii) quarterly results presentation slides and financial results announced via SGXNET to SGX-ST and posted on CapitaLand’s corporate website;
CapitaLand Limited Annual Report 2013 66 Clarity
(iii) half yearly media and analysts’ briefings for half-year and full-year financial results, with “live” webcasts available for viewing via CapitaLand’s corporate website;
(iv) one-on-one/group meetings or conference calls, investor luncheons,local/overseas roadshows and conferences;
(v) site, property and mall visits; (vi) annual reports; (vii) news releases and statements; (viii) notices of, and explanatory
memoranda for AGMs and EGMs; and
(ix) corporate website (www.capitaland.com).
Investors’ Communication4.2 CapitaLand meets with
investors, the media and analysts at appropriate times and participates in investor roadshows, and sector conferences throughout the year.
4.3 Upon the release of half-year and full-year financial results, CapitaLand will hold media and analysts’ briefings. “Live” webcasts of the briefings are recorded and archived on the corporate website within a reasonable timeafter the relevant briefing.
Shareholders’ Meetings4.4 CapitaLand’s AGMs
are the principal communication channels with its Shareholders and for Shareholders’ participation.
4.5 All Shareholders are sent a copy of CapitaLand’s summary report with notice of AGM prior to the AGM. As and when an EGM of the
Shareholders is to be held, each Shareholder will be sent a copy of a circular with notice of EGM which contains details of the matters to be proposed for Shareholders’ consideration and approval.
4.6 Notices for general meetings, setting out all items of business to be transacted at the general meeting, are also announced via SGXNET to SGX-ST.
4.7 Members of the Board, CapitaLand’s senior management and the external auditors of the organisation are in attendance at all general meetings to address Shareholders’ queries. Shareholders are given the opportunity to communicate their views on various matters affecting CapitaLand. A Shareholderis allowed to appoint up to two proxies to attend and vote at the general meetings in his/her stead.
4.8 CapitaLand supports voting by poll at all general meetings and the poll results are announced via SGXNET to SGX-ST on the same day of each Shareholders’ meeting.
Corporate Website4.9 CapitaLand maintains
a corporate website (www.capitaland.com). CapitaLand’s business developments and operations, financial reports, announcements,
news releases and other information are posted on its corporate website. Both current information and archives of previously released information including presentationslides and announcements can be found in the “Investor Relations” section of the corporate website.
5. COMPANY CONTACTS5.1 Shareholders can contact
our Singapore Share Registrars at the following address:
M & C Services Private Limited112 Robinson Road #05-01Singapore 068902Telephone: +65 6227 6660Fax: +65 6225 1452
5.2 Shareholders and the investment community can contact CapitaLand’s investor relations team by telephone at +65 6713 2888, or by fax at +65 6820 2202 or by email at [email protected].
6. SHAREHOLDERS’ PRIVACY CapitaLand recognises the
importance of Shareholders’ privacy and will not disclose Shareholders’ information without their consent unless required by law.
67Corporate Governance& Transparency
Manager Report
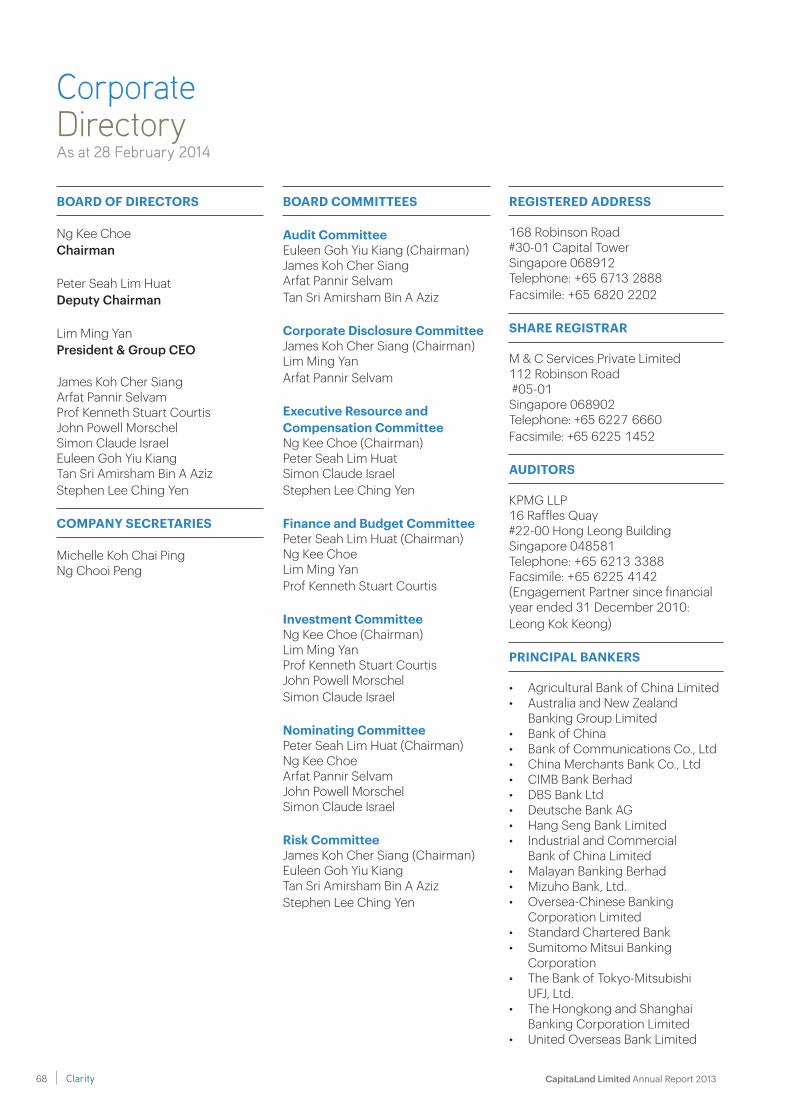
CorporateDirectoryAs at 28 February 2014
BOARD OF DIRECTORS
Ng Kee ChoeChairman
Peter Seah Lim HuatDeputy Chairman
Lim Ming YanPresident & Group CEO
James Koh Cher SiangArfat Pannir SelvamProf Kenneth Stuart CourtisJohn Powell MorschelSimon Claude IsraelEuleen Goh Yiu KiangTan Sri Amirsham Bin A AzizStephen Lee Ching Yen
COMPANY SECRETARIES
Michelle Koh Chai PingNg Chooi Peng
BOARD COMMITTEES
Audit CommitteeEuleen Goh Yiu Kiang (Chairman)James Koh Cher SiangArfat Pannir SelvamTan Sri Amirsham Bin A Aziz
Corporate Disclosure CommitteeJames Koh Cher Siang (Chairman)Lim Ming YanArfat Pannir Selvam
Executive Resource and Compensation CommitteeNg Kee Choe (Chairman)Peter Seah Lim HuatSimon Claude IsraelStephen Lee Ching Yen
Finance and Budget CommitteePeter Seah Lim Huat (Chairman)Ng Kee ChoeLim Ming YanProf Kenneth Stuart Courtis
Investment CommitteeNg Kee Choe (Chairman)Lim Ming YanProf Kenneth Stuart CourtisJohn Powell MorschelSimon Claude Israel
Nominating CommitteePeter Seah Lim Huat (Chairman)Ng Kee Choe Arfat Pannir SelvamJohn Powell MorschelSimon Claude Israel
Risk CommitteeJames Koh Cher Siang (Chairman)Euleen Goh Yiu KiangTan Sri Amirsham Bin A AzizStephen Lee Ching Yen
REGISTERED ADDRESS
168 Robinson Road#30-01 Capital TowerSingapore 068912Telephone: +65 6713 2888Facsimile: +65 6820 2202
SHARE REGISTRAR
M & C Services Private Limited112 Robinson Road #05-01Singapore 068902Telephone: +65 6227 6660 Facsimile: +65 6225 1452
AUDITORS
KPMG LLP16 Raffles Quay#22-00 Hong Leong BuildingSingapore 048581Telephone: +65 6213 3388Facsimile: +65 6225 4142(Engagement Partner since financial year ended 31 December 2010: Leong Kok Keong)
PRINCIPAL BANKERS
• Agricultural Bank of China Limited• Australia and New Zealand
Banking Group Limited• Bank of China • Bank of Communications Co., Ltd• China Merchants Bank Co., Ltd• CIMB Bank Berhad• DBS Bank Ltd• Deutsche Bank AG• Hang Seng Bank Limited• Industrial and Commercial
Bank of China Limited• Malayan Banking Berhad• Mizuho Bank, Ltd.• Oversea-Chinese Banking
Corporation Limited• Standard Chartered Bank• Sumitomo Mitsui Banking
Corporation• The Bank of Tokyo-Mitsubishi
UFJ, Ltd.• The Hongkong and Shanghai
Banking Corporation Limited• United Overseas Bank Limited
CapitaLand Limited Annual Report 2013 68 Clarity
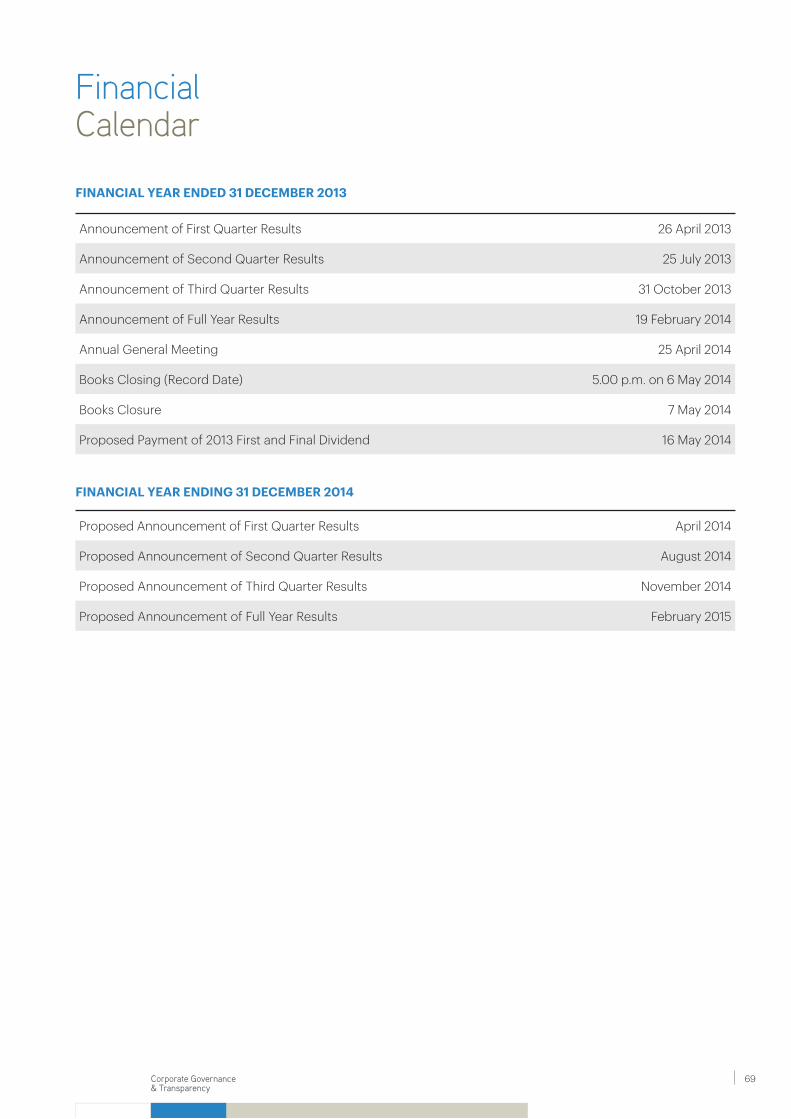
FinancialCalendar
FINANCIAL YEAR ENDED 31 DECEMBER 2013
FINANCIAL YEAR ENDING 31 DECEMBER 2014
Proposed Announcement of First Quarter Results April 2014
Proposed Announcement of Second Quarter Results August 2014
Proposed Announcement of Third Quarter Results November 2014
Proposed Announcement of Full Year Results February 2015
Announcement of First Quarter Results 26 April 2013
Announcement of Second Quarter Results 25 July 2013
Announcement of Third Quarter Results 31 October 2013
Announcement of Full Year Results 19 February 2014
Annual General Meeting 25 April 2014
Books Closing (Record Date) 5.00 p.m. on 6 May 2014
Books Closure 7 May 2014
Proposed Payment of 2013 First and Final Dividend 16 May 2014
69Corporate Governance& Transparency
Manager Report
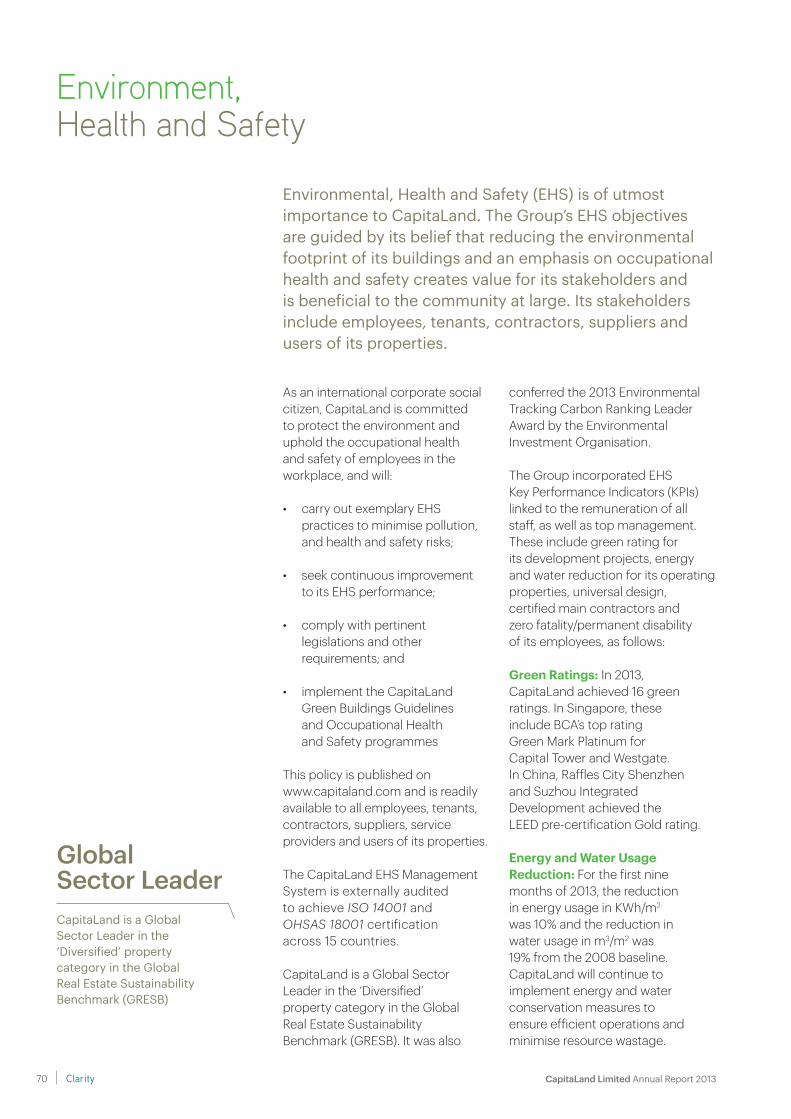
Environment, Health and Safety
As an international corporate social citizen, CapitaLand is committed to protect the environment and uphold the occupational health and safety of employees in the workplace, and will:
• carry out exemplary EHS practices to minimise pollution, and health and safety risks;
• seek continuous improvement to its EHS performance;
• comply with pertinent legislations and other requirements; and
• implement the CapitaLand Green Buildings Guidelines and Occupational Health and Safety programmes
This policy is published on www.capitaland.com and is readily available to all employees, tenants, contractors, suppliers, service providers and users of its properties.
The CapitaLand EHS Management System is externally audited to achieve ISO 14001 and OHSAS 18001 certification across 15 countries.
CapitaLand is a Global Sector Leader in the ‘Diversified’ property category in the Global Real Estate Sustainability Benchmark (GRESB). It was also
Environmental, Health and Safety (EHS) is of utmost importance to CapitaLand. The Group’s EHS objectives are guided by its belief that reducing the environmental footprint of its buildings and an emphasis on occupational health and safety creates value for its stakeholders and is beneficial to the community at large. Its stakeholders include employees, tenants, contractors, suppliers and users of its properties.
conferred the 2013 Environmental Tracking Carbon Ranking Leader Award by the Environmental Investment Organisation.
The Group incorporated EHS Key Performance Indicators (KPIs) linked to the remuneration of all staff, as well as top management. These include green rating for its development projects, energy and water reduction for its operating properties, universal design, certified main contractors and zero fatality/permanent disability of its employees, as follows:
Green Ratings: In 2013, CapitaLand achieved 16 green ratings. In Singapore, these include BCA’s top rating Green Mark Platinum for Capital Tower and Westgate. In China, Raffles City Shenzhen and Suzhou Integrated Development achieved the LEED pre-certification Gold rating.
Energy and Water Usage Reduction: For the first nine months of 2013, the reduction in energy usage in KWh/m2 was 10% and the reduction in water usage in m3/m2 was 19% from the 2008 baseline. CapitaLand will continue to implement energy and water conservation measures to ensure efficient operations and minimise resource wastage.
CapitaLand is a Global Sector Leader in the ‘Diversified’ property category in the Global Real Estate Sustainability Benchmark (GRESB)
Global Sector Leader
CapitaLand Limited Annual Report 2013 70 Clarity
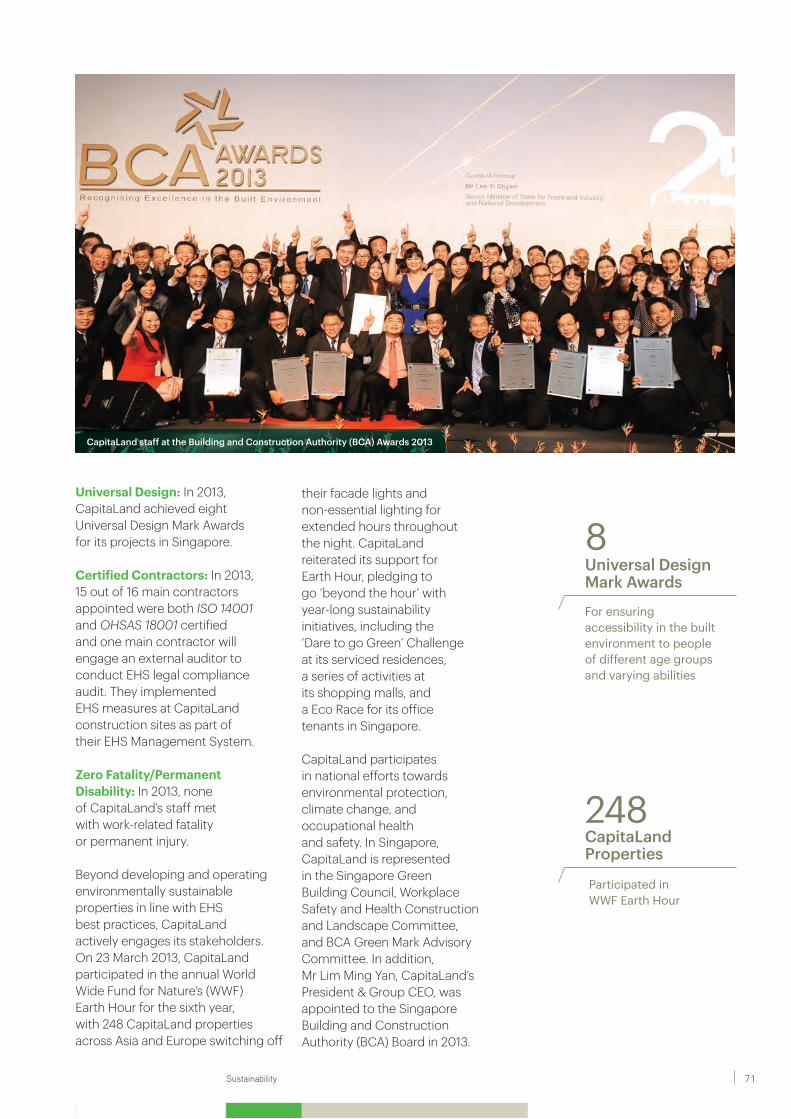
CapitaLand staff at the Building and Construction Authority (BCA) Awards 2013
Universal Design: In 2013, CapitaLand achieved eight Universal Design Mark Awards for its projects in Singapore.
Certified Contractors: In 2013, 15 out of 16 main contractors appointed were both ISO 14001 and OHSAS 18001 certified and one main contractor will engage an external auditor to conduct EHS legal compliance audit. They implemented EHS measures at CapitaLand construction sites as part of their EHS Management System.
Zero Fatality/Permanent Disability: In 2013, none of CapitaLand’s staff met with work-related fatality or permanent injury.
Beyond developing and operating environmentally sustainable properties in line with EHS best practices, CapitaLand actively engages its stakeholders. On 23 March 2013, CapitaLand participated in the annual World Wide Fund for Nature’s (WWF) Earth Hour for the sixth year, with 248 CapitaLand properties across Asia and Europe switching off
their facade lights and non-essential lighting for extended hours throughout the night. CapitaLand reiterated its support for Earth Hour, pledging to go ‘beyond the hour’ with year-long sustainability initiatives, including the ‘Dare to go Green’ Challenge at its serviced residences, a series of activities at its shopping malls, and a Eco Race for its office tenants in Singapore.
CapitaLand participates in national efforts towards environmental protection, climate change, and occupational health and safety. In Singapore, CapitaLand is represented in the Singapore Green Building Council, Workplace Safety and Health Construction and Landscape Committee, and BCA Green Mark Advisory Committee. In addition, Mr Lim Ming Yan, CapitaLand’s President & Group CEO, was appointed to the Singapore Building and Construction Authority (BCA) Board in 2013.
For ensuring accessibility in the built environment to people of different age groups and varying abilities
Universal Design Mark Awards
8
Participated in WWF Earth Hour
248CapitaLand Properties
71Management Reports Sustainability
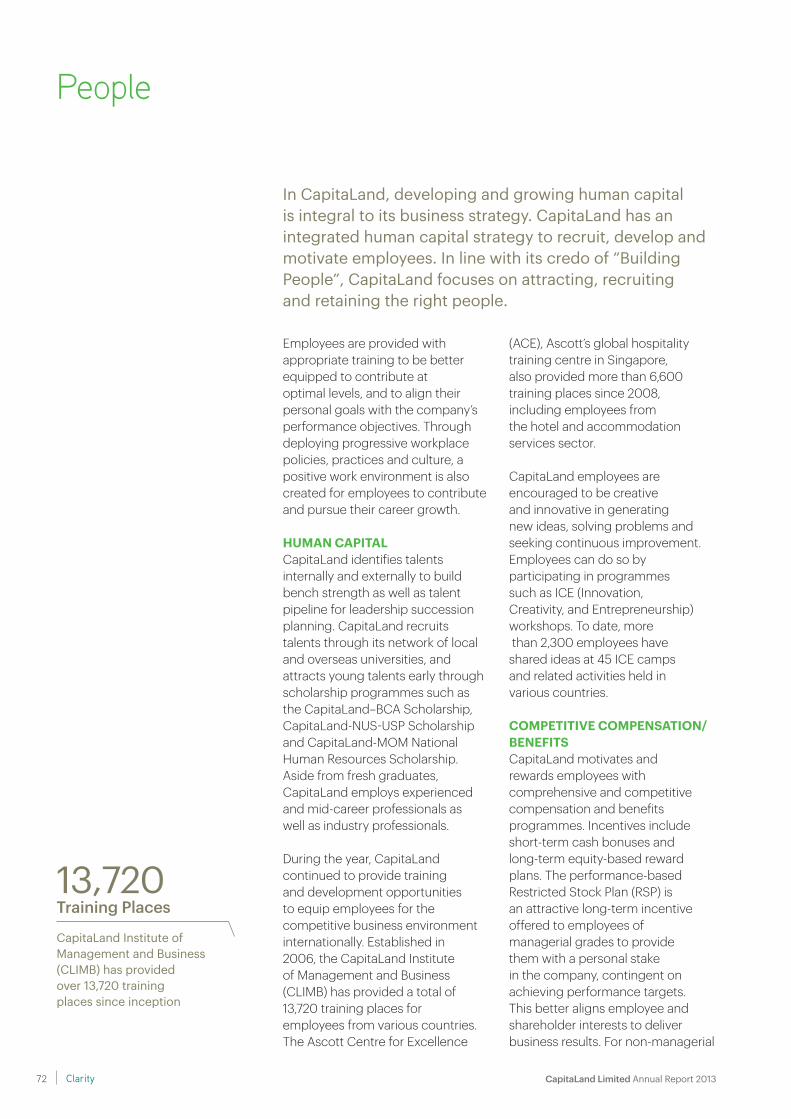
People
Employees are provided with appropriate training to be better equipped to contribute at optimal levels, and to align their personal goals with the company’s performance objectives. Through deploying progressive workplace policies, practices and culture, a positive work environment is also created for employees to contribute and pursue their career growth.
HUMAN CAPITALCapitaLand identifies talents internally and externally to build bench strength as well as talent pipeline for leadership succession planning. CapitaLand recruits talents through its network of local and overseas universities, and attracts young talents early through scholarship programmes such as the CapitaLand–BCA Scholarship, CapitaLand-NUS-USP Scholarship and CapitaLand-MOM National Human Resources Scholarship. Aside from fresh graduates, CapitaLand employs experienced and mid-career professionals as well as industry professionals.
During the year, CapitaLand continued to provide training and development opportunities to equip employees for the competitive business environment internationally. Established in 2006, the CapitaLand Institute of Management and Business (CLIMB) has provided a total of 13,720 training places for employees from various countries. The Ascott Centre for Excellence
In CapitaLand, developing and growing human capital is integral to its business strategy. CapitaLand has an integrated human capital strategy to recruit, develop and motivate employees. In line with its credo of “Building People”, CapitaLand focuses on attracting, recruiting and retaining the right people.
(ACE), Ascott’s global hospitality training centre in Singapore, also provided more than 6,600 training places since 2008, including employees from the hotel and accommodation services sector.
CapitaLand employees are encouraged to be creative and innovative in generating new ideas, solving problems and seeking continuous improvement. Employees can do so by participating in programmes such as ICE (Innovation, Creativity, and Entrepreneurship) workshops. To date, more than 2,300 employees have shared ideas at 45 ICE camps and related activities held in various countries.
COMPETITIVE COMPENSATION/ BENEFITSCapitaLand motivates and rewards employees with comprehensive and competitive compensation and benefits programmes. Incentives include short-term cash bonuses and long-term equity-based reward plans. The performance-based Restricted Stock Plan (RSP) is an attractive long-term incentive offered to employees of managerial grades to provide them with a personal stake in the company, contingent on achieving performance targets. This better aligns employee and shareholder interests to deliver business results. For non-managerial
13,720CapitaLand Institute ofManagement and Business (CLIMB) has provided over 13,720 training places since inception
Training Places
CapitaLand Limited Annual Report 2013 72 Clarity
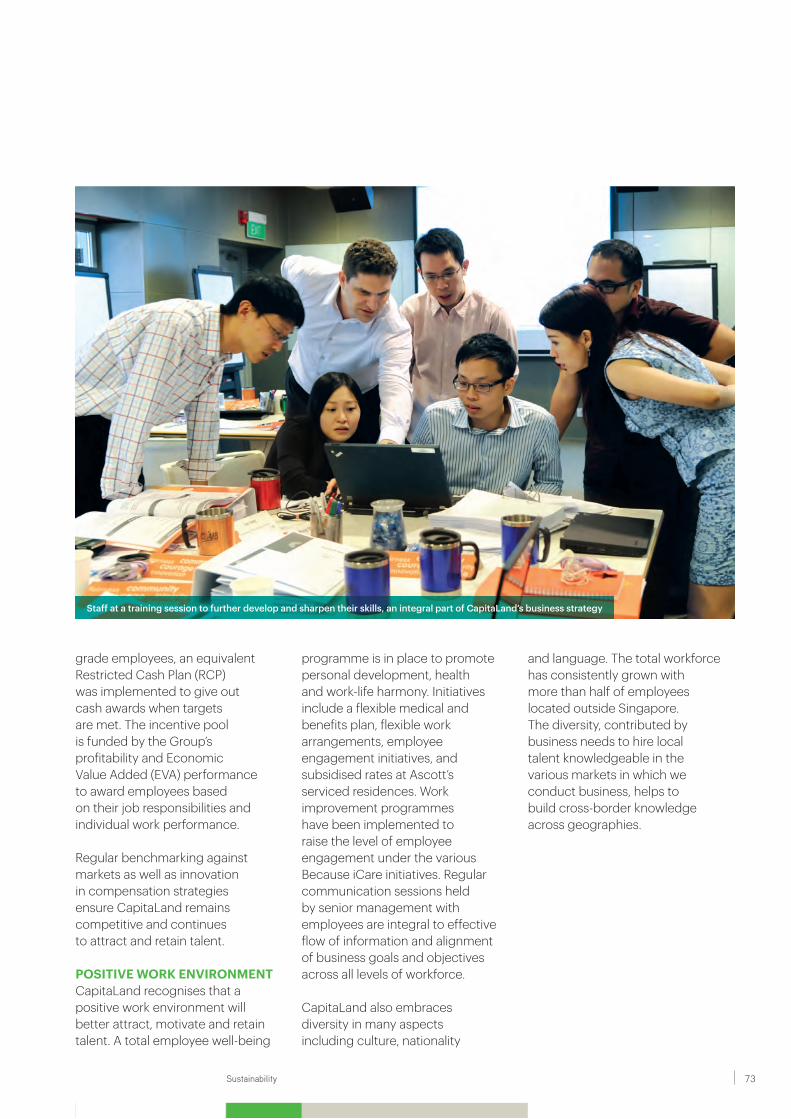
Staff at a training session to further develop and sharpen their skills, an integral part of CapitaLand’s business strategy
grade employees, an equivalent Restricted Cash Plan (RCP) was implemented to give out cash awards when targets are met. The incentive pool is funded by the Group’s profitability and Economic Value Added (EVA) performance to award employees based on their job responsibilities and individual work performance.
Regular benchmarking against markets as well as innovation in compensation strategies ensure CapitaLand remains competitive and continues to attract and retain talent.
POSITIVE WORK ENVIRONMENTCapitaLand recognises that a positive work environment will better attract, motivate and retain talent. A total employee well-being
programme is in place to promote personal development, health and work-life harmony. Initiatives include a flexible medical and benefits plan, flexible work arrangements, employee engagement initiatives, and subsidised rates at Ascott’s serviced residences. Work improvement programmes have been implemented to raise the level of employee engagement under the various Because iCare initiatives. Regular communication sessions held by senior management with employees are integral to effective flow of information and alignment of business goals and objectives across all levels of workforce.
CapitaLand also embraces diversity in many aspects including culture, nationality
and language. The total workforce has consistently grown with more than half of employees located outside Singapore. The diversity, contributed by business needs to hire local talent knowledgeable in the various markets in which we conduct business, helps to build cross-border knowledge across geographies.
73Management Reports Sustainability
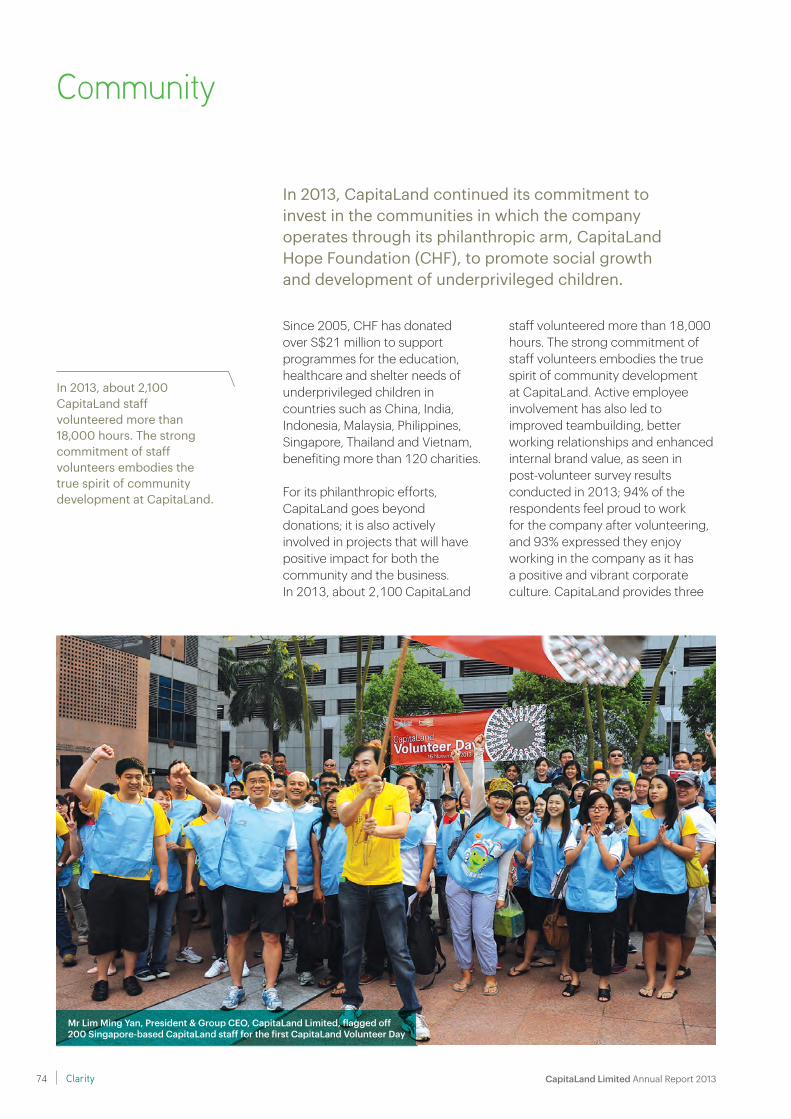
Community
Since 2005, CHF has donated over S$21 million to support programmes for the education, healthcare and shelter needs of underprivileged children in countries such as China, India, Indonesia, Malaysia, Philippines, Singapore, Thailand and Vietnam, benefiting more than 120 charities.
For its philanthropic efforts, CapitaLand goes beyond donations; it is also actively involved in projects that will have positive impact for both the community and the business. In 2013, about 2,100 CapitaLand
In 2013, CapitaLand continued its commitment to invest in the communities in which the company operates through its philanthropic arm, CapitaLand Hope Foundation (CHF), to promote social growth and development of underprivileged children.
staff volunteered more than 18,000 hours. The strong commitment of staff volunteers embodies the true spirit of community development at CapitaLand. Active employee involvement has also led to improved teambuilding, better working relationships and enhanced internal brand value, as seen in post-volunteer survey results conducted in 2013; 94% of the respondents feel proud to work for the company after volunteering, and 93% expressed they enjoy working in the company as it has a positive and vibrant corporate culture. CapitaLand provides three
Mr Lim Ming Yan, President & Group CEO, CapitaLand Limited, flagged off 200 Singapore-based CapitaLand staff for the first CapitaLand Volunteer Day
In 2013, about 2,100CapitaLand staff volunteered more than 18,000 hours. The strong commitment of staff volunteers embodies the true spirit of community development at CapitaLand.
CapitaLand Limited Annual Report 2013 74 Clarity
days of Volunteer Service Leave (VSL) to every staff each year. In 2013, more than 1,700 days of VSL were taken, translating into an estimated salary cost of over S$276,000.
For its efforts, CapitaLand was awarded Best Strategic Corporate Social Responsibility for the second consecutive year in the 3rd Annual SEA Institutional Investor Corporate Awards by the Alpha Southeast Asia Magazine. It was also awarded Best Corporate Social Responsibility in Singapore by the FinanceAsia 2013 Annual Poll. In addition, CHF’s series of educational programmes for underprivileged children in China was lauded as one of “2013 Excellent CSR Cases of China and Foreign Corporations” by China Foundation for Poverty Alleviation and Tsinghua University’s Research Institute of Innovation and Social Responsibility. CapitaLand was also conferred “China Best Corporate Citizen Award” for the sixth consecutive year by the China Committee of Corporate Citizenship and CCTV2 in recognition of its excellent CSR practices.
Some key community development projects conducted in 2013 include the fourth run of the CapitaLand Kids’ Food Fund programme. Partnering the five Community Development Councils (CDCs) in Singapore for the first time for the programme, CHF funded S$500,000 for the CDCs to provide 1,000 underprivileged children beneficiaries across Singapore with at least one healthy meal every school day throughout 2014. CHF also funded about S$500,000 for My Schoolbag programme in 2013, where approximately 21,000 underprivileged schoolchildren in five Asian countries received schoolbags containing school
and daily necessities. CapitaLand continued to extend its reachto underprivileged children through S.E.N.D for Hope initiatives during Lunar New Year and Christmas festive seasons in 2013. For every electronic greeting card (e-card) sent, CHF donated S$2 to a designated charity. Over 25,000 e-cards were sent and S$50,000 was donated towards the upgrading of Canossaville Children’s Home in Singapore as well as to World Vision to aid disaster relief efforts towards victims of Typhoon Haiyan in the Philippines.
To bolster CapitaLand’s community development efforts in China, CHF partnered China Foundation for Poverty Alleviation to set up a RMB3.5 million (S$735,000) special fund. It is the first comprehensive special charity fund set up by a foreign real estate company in China, focusing on support for underprivileged children aged 16 and below, in areas of education, healthcare and shelter. The CapitaLand Rehabilitation Therapy for Children Project is one of the programmes supported by the fund, and to date it has benefited 60 underprivileged children with physical disabilities.
To further promote the spirit of volunteerism in staff, CapitaLand held its inaugural CapitaLand Volunteer Day in conjunction with the company’s 13th anniversary in November. It was a full-day volunteer event involving 200 CapitaLand staff, including senior management, to revamp homes of 20 underprivileged families in Singapore to create a conducive learning environment for the children.
Over 100 staff from Australia, China, Japan, Malaysia, Philippines, Singapore and Vietnam also participated in two international volunteer expeditions in 2013. In Tanay, Rizal Province of Philippines, CapitaLand staff embarked on a five-day staff volunteer expedition to support the rebuilding efforts of Gawad Kalinga, in building homes for 300 children who have been left homeless since Typhoon Ondoy struck in 2009. Over in the Sichuan Province of China, CapitaLand donated S$100,000 and partnered Habitat for Humanity to provide disaster relief for children and their families affected by the devastating earthquake in April. Staff volunteers put in four days of hard work to help build safe homes that can withstand earthquakes of up to 8.0-magnitude around Tiantaishan Town.
CapitaLand strongly believes every child has the potential for greatness, which if nurtured and built upon, can bring significant value to future societies. Every year, CapitaLand donates up to 0.5% of its net profit to CHF to further the company’s commitment in building for tomorrow.
75Management Reports Sustainability
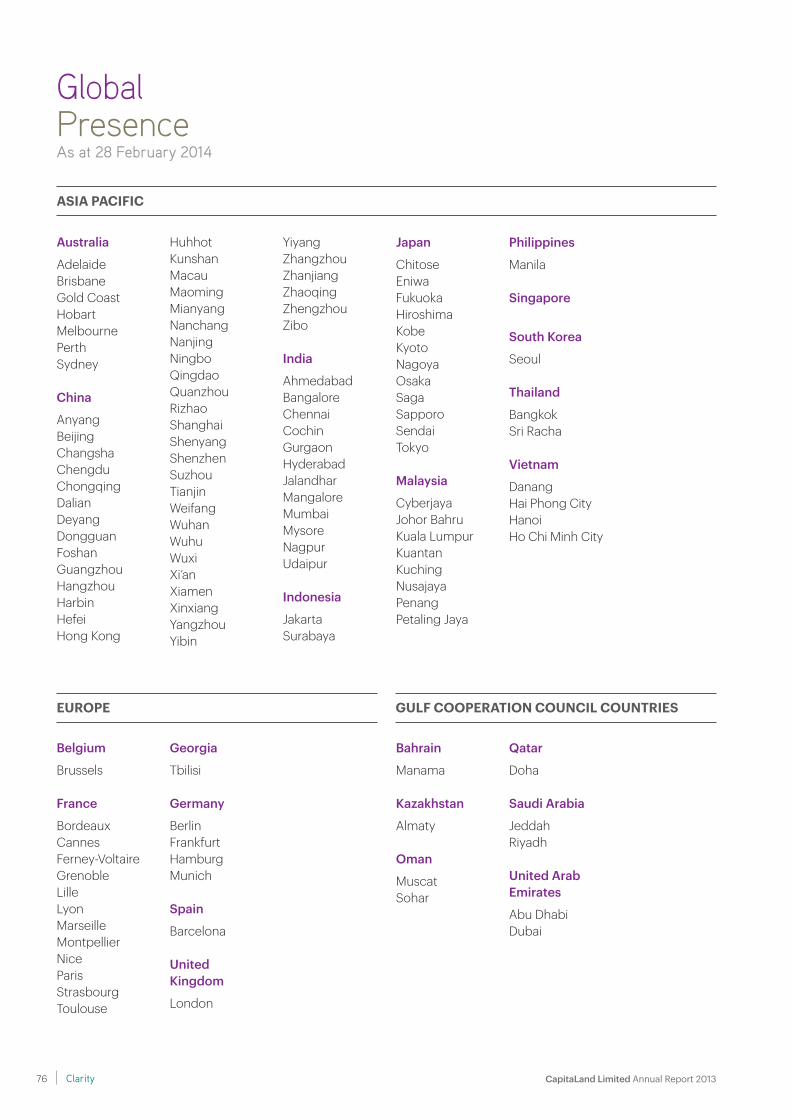
EUROPE
ASIA PACIFIC
Australia
AdelaideBrisbaneGold Coast HobartMelbournePerth Sydney
China
AnyangBeijingChangshaChengduChongqingDalianDeyangDongguanFoshanGuangzhouHangzhouHarbinHefeiHong Kong
GULF COOPERATION COUNCIL COUNTRIES
Belgium
Brussels
France
BordeauxCannesFerney-VoltaireGrenobleLilleLyonMarseilleMontpellierNiceParisStrasbourgToulouse
Georgia
Tbilisi
Germany
BerlinFrankfurtHamburgMunich
Spain
Barcelona
UnitedKingdom
London
Bahrain
Manama
Kazakhstan
Almaty
Oman
MuscatSohar
Qatar
Doha
Saudi Arabia
JeddahRiyadh
United Arab Emirates
Abu DhabiDubai
GlobalPresenceAs at 28 February 2014
HuhhotKunshanMacauMaomingMianyangNanchangNanjingNingboQingdaoQuanzhouRizhaoShanghaiShenyangShenzhenSuzhouTianjinWeifangWuhanWuhuWuxiXi’anXiamenXinxiangYangzhouYibin
YiyangZhangzhouZhanjiangZhaoqingZhengzhouZibo
India
AhmedabadBangaloreChennaiCochin GurgaonHyderabadJalandharMangaloreMumbaiMysoreNagpurUdaipur
Indonesia
JakartaSurabaya
Japan
ChitoseEniwaFukuokaHiroshimaKobeKyotoNagoyaOsakaSagaSapporoSendaiTokyo
Malaysia
CyberjayaJohor BahruKuala LumpurKuantanKuchingNusajayaPenangPetaling Jaya
Philippines
Manila
Singapore
South Korea
Seoul
Thailand
BangkokSri Racha
Vietnam
DanangHai Phong CityHanoiHo Chi Minh City
CapitaLand Limited Annual Report 2013 76 Clarity
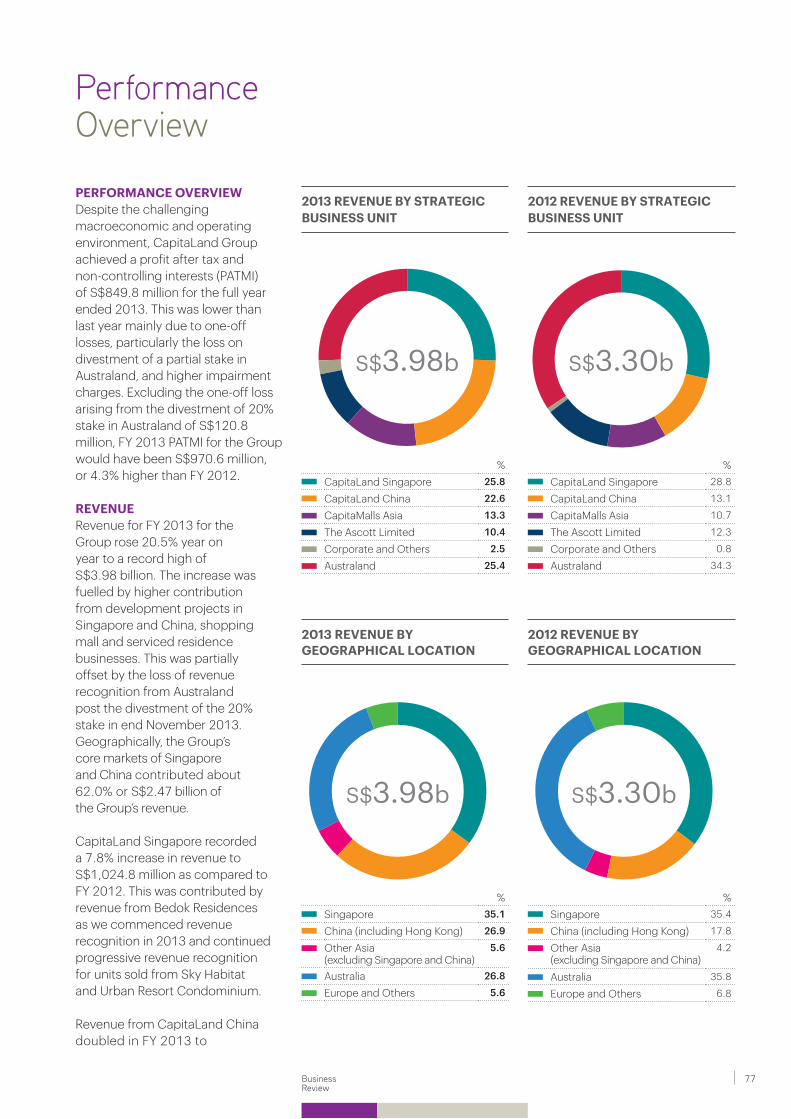
Performance Overview
PERFORMANCE OVERVIEWDespite the challenging macroeconomic and operating environment, CapitaLand Group achieved a profit after tax and non-controlling interests (PATMI) of S$849.8 million for the full year ended 2013. This was lower than last year mainly due to one-off losses, particularly the loss on divestment of a partial stake in Australand, and higher impairment charges. Excluding the one-off loss arising from the divestment of 20% stake in Australand of S$120.8 million, FY 2013 PATMI for the Group would have been S$970.6 million, or 4.3% higher than FY 2012.
REVENUERevenue for FY 2013 for the Group rose 20.5% year on year to a record high of S$3.98 billion. The increase was fuelled by higher contribution from development projects in Singapore and China, shopping mall and serviced residence businesses. This was partially offset by the loss of revenue recognition from Australand post the divestment of the 20% stake in end November 2013. Geographically, the Group’s core markets of Singapore and China contributed about 62.0% or S$2.47 billion of the Group’s revenue.
CapitaLand Singapore recorded a 7.8% increase in revenue to S$1,024.8 million as compared to FY 2012. This was contributed by revenue from Bedok Residences as we commenced revenue recognition in 2013 and continued progressive revenue recognition for units sold from Sky Habitat and Urban Resort Condominium.
Revenue from CapitaLand China doubled in FY 2013 to
%Singapore 35.4
China (including Hong Kong) 17.8
Other Asia (excluding Singapore and China)
4.2
Australia 35.8
Europe and Others 6.8
2012 REVENUE BY GEOGRAPHICAL LOCATION
S$3.30b
2013 REVENUE BY GEOGRAPHICAL LOCATION
%Singapore 35.1
China (including Hong Kong) 26.9
Other Asia (excluding Singapore and China)
5.6
Australia 26.8
Europe and Others 5.6
S$3.98b
%CapitaLand Singapore 25.8
CapitaLand China 22.6
CapitaMalls Asia 13.3
The Ascott Limited 10.4
Corporate and Others 2.5
Australand 25.4
2013 REVENUE BY STRATEGIC BUSINESS UNIT
S$3.98b
%CapitaLand Singapore 28.8
CapitaLand China 13.1
CapitaMalls Asia 10.7
The Ascott Limited 12.3
Corporate and Others 0.8
Australand 34.3
2012 REVENUE BY STRATEGIC BUSINESS UNIT
S$3.30b
77Business Review

S$899.0 million as more unitswere handed over to buyers. The units handed over during the year were mainly for The Metropolis in Kunshan, The Pinnacle and The Paragon in Shanghai and iPark in Shenzhen.
CapitaMalls Asia’s revenue also grew 49.3% to S$528.0 million, driven by revenue of units sold in Bedok Residences and full year contributions from Olinas Mall and The Star Vista. Olinas Mall was acquired in April 2012 while The Star Vista opened in September 2012.
Ascott’s revenue improved modestly by 1.9% to S$412.8 million, despite having divested a few properties in 2012. The increase came about as contributions from a newly acquired serviced residence in Hong Kong and better performance from Europe properties mitigated the absence of contributions from divested properties.
Revenue contribution from Australand decreased by 10.7% to S$1,010.5 million in FY 2013 mainly as a result of its deconsolidation from the Group’s accounts from December 2013 as it ceased to be a subsidiary of the Group. At Australand’s level, it reported a 4% increase in full year revenue on account of higher sales from development projects and higher rental income from investment properties.
Corporate and Others includes Corporate Office, Surbana (Consultancy), StorHub, Financial Services and other regional investments in Vietnam, Japan and Gulf Cooperation Council
Operating profits in FY 2013 were higher by 5.8% at S$1,338.0 million; driven by improved operating performance from development projects in China and the shopping mall business. At the EBIT level, the Group incurred a net divestment loss of S$4.2 million as compared to a gain of S$239.7 million in FY 2012. The divestment losses arose mainly from the sale of the 20% stake in Australand. Other investments divested during the year included a residential development, three serviced residences and a shopping mall development in China, our interests in 11 rental housing properties in Japan, our stake in three investment properties in United Kingdom and one property in Singapore.
In terms of revaluation gains, the Group recorded a net fair value gain of S$653.7 million
countries. Revenue from Corporate and Others increased to S$102.5 million and this came mainly from Vietnam where sales were higher on improved
EARNINGS BEFORE INTEREST AND TAX (EBIT) ANALYSISThe Group achieved EBIT of S$1.80 billion which was 10.9% lower than FY 2012’s EBIT of S$2.02 billion.
The details of the Group’s EBIT are as follows:
FY 2013 FY 2012S$ million % S$ million %
Operating profits 1,338.0 74 1,268.9 63Portfolio (losses)/gains (4.2) – 239.7 12Revaluation gains 653.7 36 611.9 30Impairments (189.5) (10) (103.1) (5)Total EBIT 1,798.0 100 2,017.4 100
economic sentiment and StorHub whose revenue was augmented by the acquisition of Big Orange Self-Storage in July 2013.
at the EBIT level as compared to S$611.9 million in FY 2012. The fair value gains from investment properties in Singapore and China were higher, but this was partially offset by lower fair value gains from investment properties in Australia, Malaysia and Japan. The Group took impairment charges for certain development projects and investments that were affected by slow sales and weak market conditions in specific areas. The impairment losses were comparatively higher than last year and were mainly in respect of specific projects in Australia, China and India. Singapore and China markets remain the key contributors to EBIT, accounting for 88.1% of total EBIT (FY 2012: 76.9%). Singapore EBIT was S$847.9 million or 47.2% while China EBIT was S$735.1 million or 40.9%.
PerformanceOverview
CapitaLand Limited Annual Report 2013 Clarity78
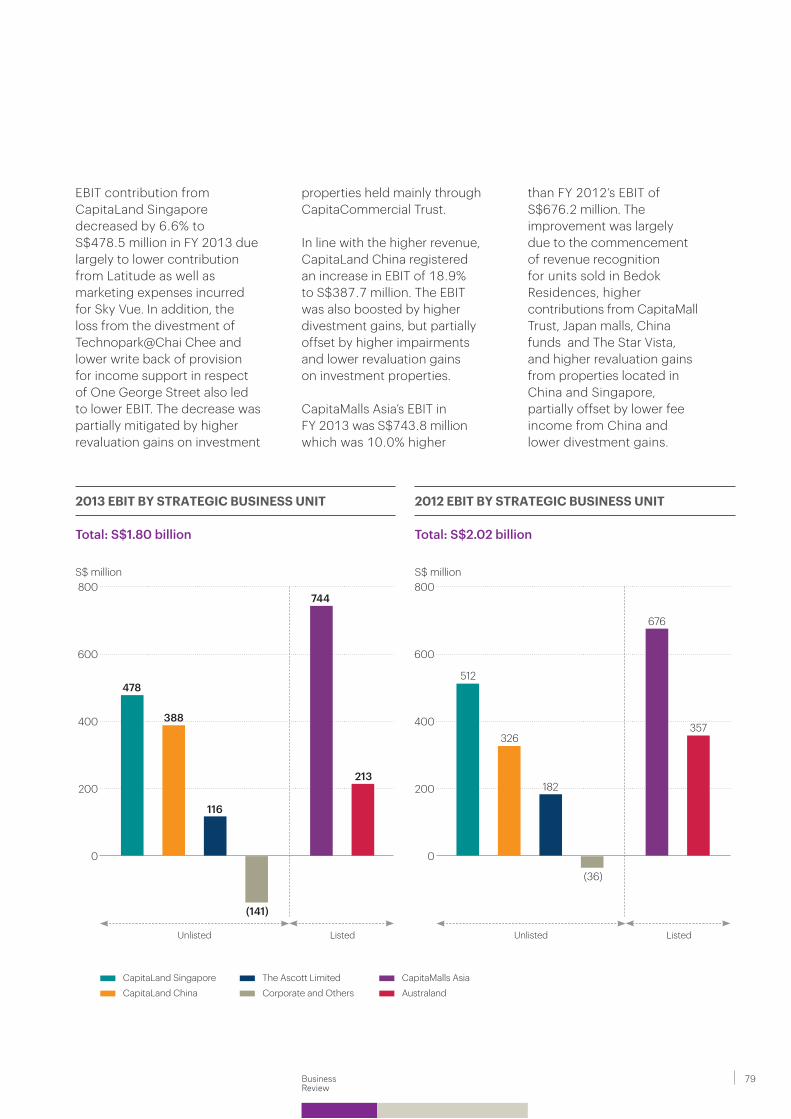
EBIT contribution from CapitaLand Singapore decreased by 6.6% to S$478.5 million in FY 2013 due largely to lower contribution from Latitude as well as marketing expenses incurred for Sky Vue. In addition, the loss from the divestment of Technopark@Chai Chee and lower write back of provision for income support in respect of One George Street also led to lower EBIT. The decrease was partially mitigated by higher revaluation gains on investment
properties held mainly through CapitaCommercial Trust.
In line with the higher revenue, CapitaLand China registered an increase in EBIT of 18.9% to S$387.7 million. The EBIT was also boosted by higher divestment gains, but partially offset by higher impairments and lower revaluation gains on investment properties.
CapitaMalls Asia’s EBIT in FY 2013 was S$743.8 million which was 10.0% higher
2013 EBIT BY STRATEGIC BUSINESS UNIT
Total: S$1.80 billion
CapitaLand Singapore The Ascott Limited CapitaMalls Asia
CapitaLand China Corporate and Others Australand
than FY 2012’s EBIT of S$676.2 million. The improvement was largely due to the commencement of revenue recognition for units sold in Bedok Residences, higher contributions from CapitaMall Trust, Japan malls, China funds and The Star Vista, and higher revaluation gains from properties located in China and Singapore, partially offset by lower fee income from China and lower divestment gains.
2012 EBIT BY STRATEGIC BUSINESS UNIT
Total: S$2.02 billion
800
600
400
200
0
Unlisted Listed
357
676
182
326
512
(36)
800
600
400
200
0
Unlisted Listed
213
744
116
388
478
(141)
S$ million S$ million
79Business Review
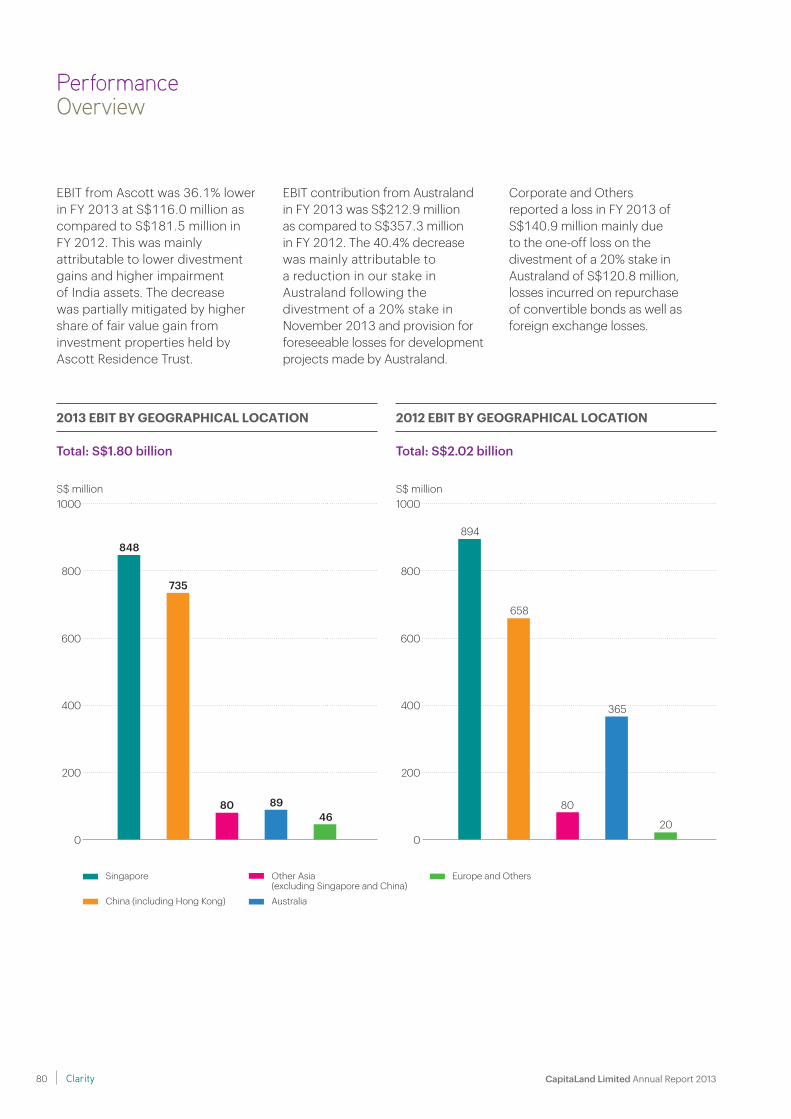
1000
800
600
400
200
0
848
735
8046
89
2013 EBIT BY GEOGRAPHICAL LOCATION
Total: S$1.80 billion
EBIT from Ascott was 36.1% lower in FY 2013 at S$116.0 million as compared to S$181.5 million inFY 2012. This was mainly attributable to lower divestment gains and higher impairment of India assets. The decrease was partially mitigated by higher share of fair value gain from investment properties held by Ascott Residence Trust.
EBIT contribution from Australand in FY 2013 was S$212.9 million as compared to S$357.3 million in FY 2012. The 40.4% decrease was mainly attributable to a reduction in our stake in Australand following the divestment of a 20% stake in November 2013 and provision for foreseeable losses for development projects made by Australand.
Corporate and Others reported a loss in FY 2013 of S$140.9 million mainly due to the one-off loss on the divestment of a 20% stake in Australand of S$120.8 million, losses incurred on repurchase of convertible bonds as well as foreign exchange losses.
S$ million1000
800
600
400
200
0
894
658
80
20
365
2012 EBIT BY GEOGRAPHICAL LOCATION
Total: S$2.02 billion
S$ million
Singapore Other Asia (excluding Singapore and China)
Europe and Others
China (including Hong Kong) Australia
PerformanceOverview
CapitaLand Limited Annual Report 2013 80 Clarity
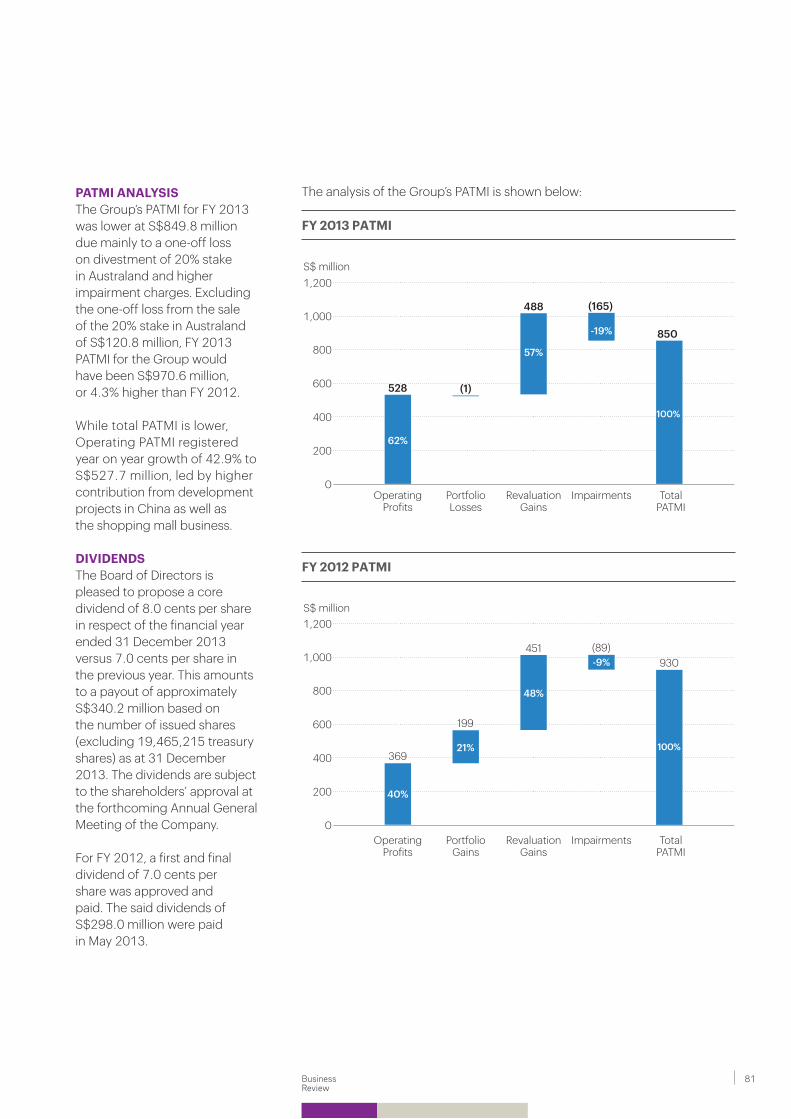
PATMI ANALYSIS The Group’s PATMI for FY 2013 was lower at S$849.8 million due mainly to a one-off loss on divestment of 20% stake in Australand and higher impairment charges. Excluding the one-off loss from the sale of the 20% stake in Australand of S$120.8 million, FY 2013 PATMI for the Group would have been S$970.6 million, or 4.3% higher than FY 2012.
While total PATMI is lower, Operating PATMI registeredyear on year growth of 42.9% to S$527.7 million, led by higher contribution from development projects in China as well as the shopping mall business.
DIVIDENDSThe Board of Directors is pleased to propose a core dividend of 8.0 cents per share in respect of the financial year ended 31 December 2013 versus 7.0 cents per share in the previous year. This amounts to a payout of approximately S$340.2 million based on the number of issued shares (excluding 19,465,215 treasury shares) as at 31 December 2013. The dividends are subject to the shareholders’ approval at the forthcoming Annual General Meeting of the Company.
For FY 2012, a first and final dividend of 7.0 cents per share was approved and paid. The said dividends of S$298.0 million were paid in May 2013.
The analysis of the Group’s PATMI is shown below:
FY 2012 PATMI
FY 2013 PATMI
1,200
1,000
800
600
400
200
0Operating
ProfitsPortfolio Losses
Revaluation Gains
Total PATMI
Impairments
488
57%
(165)
-19% 850
100%
(1)528
62%
S$ million
1,200
1,000
800
600
400
200
0Operating
ProfitsPortfolio
GainsRevaluation
GainsTotal
PATMIImpairments
451 (89)930
199
369
-9%
S$ million
21%
40%
48%
100%
81Business Review
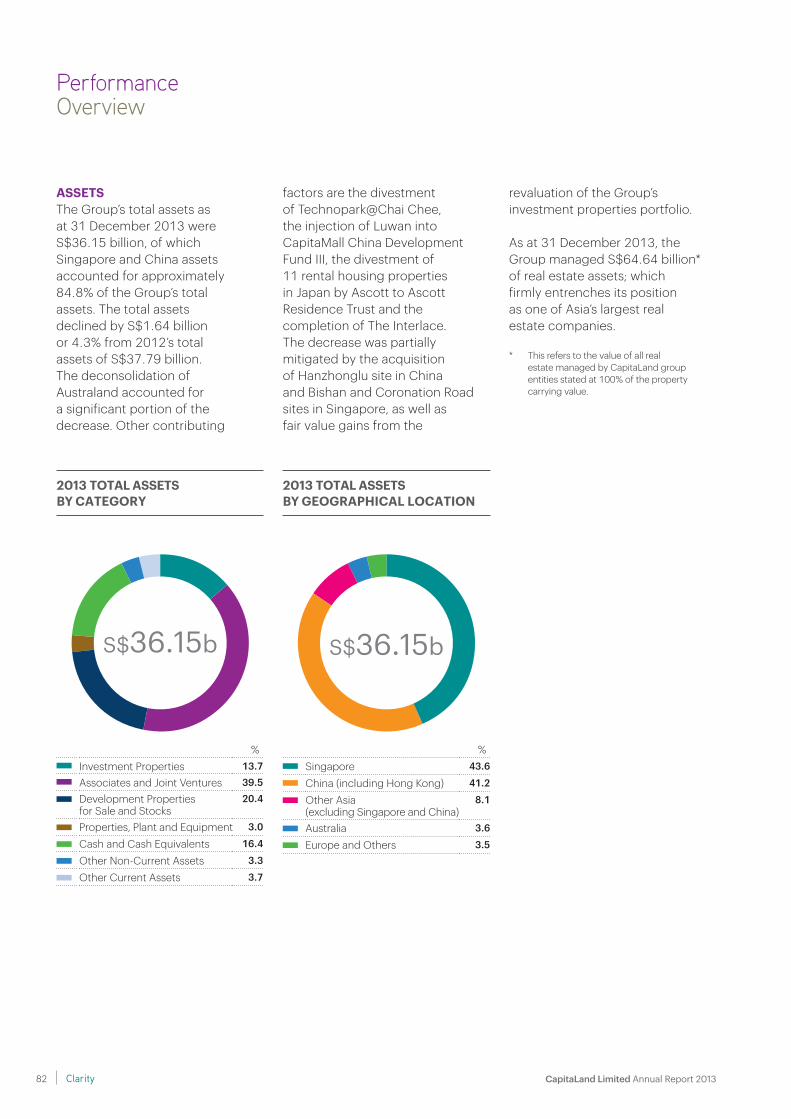
ASSETSThe Group’s total assets as at 31 December 2013 were S$36.15 billion, of which Singapore and China assets accounted for approximately 84.8% of the Group’s total assets. The total assets declined by S$1.64 billion or 4.3% from 2012’s total assets of S$37.79 billion. The deconsolidation of Australand accounted for a significant portion of the decrease. Other contributing
PerformanceOverview
%Singapore 43.6
China (including Hong Kong) 41.2
Other Asia (excluding Singapore and China)
8.1
Australia 3.6
Europe and Others 3.5
2013 TOTAL ASSETS BY GEOGRAPHICAL LOCATION
S$36.15b
%Investment Properties 13.7Associates and Joint Ventures 39.5Development Properties for Sale and Stocks
20.4
Properties, Plant and Equipment 3.0
Cash and Cash Equivalents 16.4
Other Non-Current Assets 3.3
Other Current Assets 3.7
2013 TOTAL ASSETS BY CATEGORY
S$36.15b
factors are the divestment of Technopark@Chai Chee, the injection of Luwan into CapitaMall China Development Fund III, the divestment of 11 rental housing properties in Japan by Ascott to Ascott Residence Trust and the completion of The Interlace. The decrease was partially mitigated by the acquisition of Hanzhonglu site in China and Bishan and Coronation Road sites in Singapore, as well as fair value gains from the
revaluation of the Group’s investment properties portfolio.
As at 31 December 2013, the Group managed S$64.64 billion* of real estate assets; which firmly entrenches its position as one of Asia’s largest real estate companies.
* This refers to the value of all real estate managed by CapitaLand group entities stated at 100% of the property carrying value.
CapitaLand Limited Annual Report 2013 82 Clarity
BORROWINGSAs at 31 December 2013, the Group’s gross debt stood at S$12.56 billion, a decrease of S$1.62 billion from 31 December 2012’s gross debt. The reduction is mainly a result of deconsolidation of Australand’s debt from the Group’s balance sheet. During the year, the Group also issued two new tranches of convertible bonds totaling S$1.45 billion to refinance as well as buyback some existing convertible bonds.
SHAREHOLDERS’ EQUITYAs at 31 December 2013, issued and paid-up ordinary share capital (excluding treasury shares) of the Company comprised 4.25 billion shares at S$6.30 billion. The Group’s total reserves increased from S$8.78 billion in December 2012 to S$9.77 billion in December 2013. This increase was mainly contributed by the S$849.8 million net profit for the year and exchange gains arising from the translation of foreign operations, partially offset by payment of the 2012 dividends during the year.
As a result of the increase in total reserves, the shareholders’ funds rose to S$16.07 billion as at end 2013 compared to S$15.08 billion in 2012. Accordingly, the Group’s net tangible assets per share increased to S$3.67 as at 31 December 2013.
83Business Review
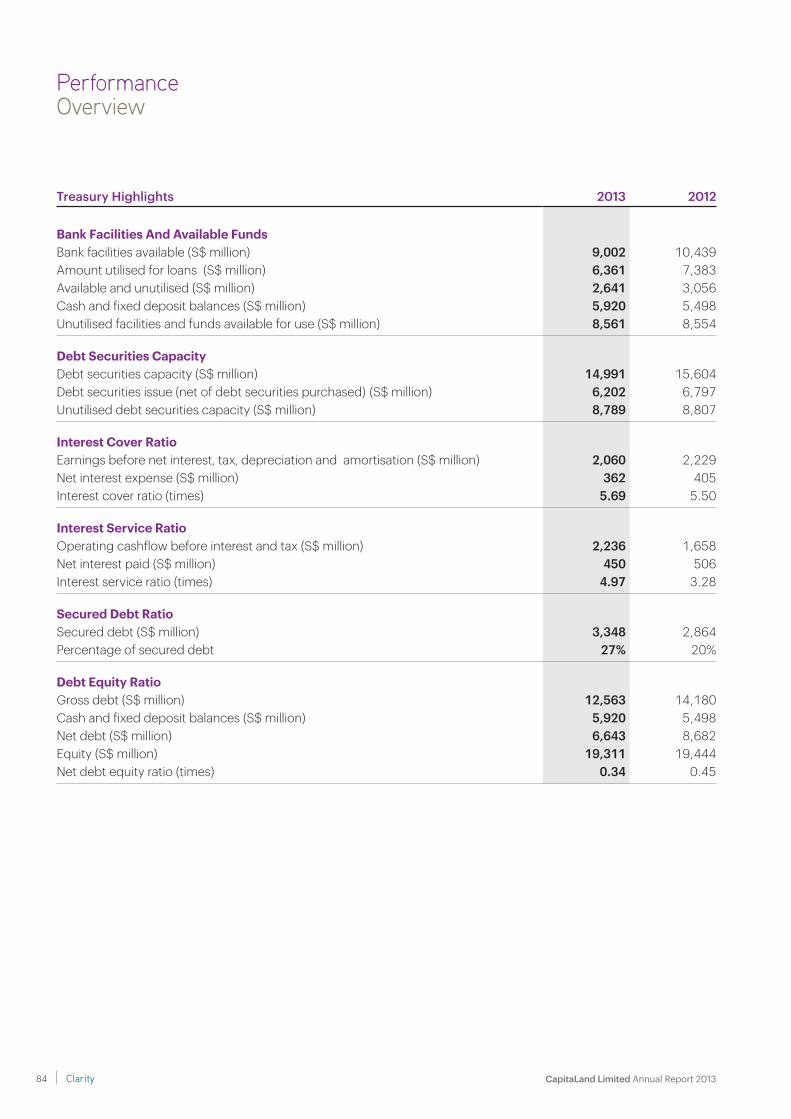
Treasury Highlights 2013 2012
Bank Facilities And Available Funds Bank facilities available (S$ million) 9,002 10,439Amount utilised for loans (S$ million) 6,361 7,383Available and unutilised (S$ million) 2,641 3,056Cash and fixed deposit balances (S$ million) 5,920 5,498Unutilised facilities and funds available for use (S$ million) 8,561 8,554
Debt Securities Capacity Debt securities capacity (S$ million) 14,991 15,604Debt securities issue (net of debt securities purchased) (S$ million) 6,202 6,797Unutilised debt securities capacity (S$ million) 8,789 8,807
Interest Cover Ratio Earnings before net interest, tax, depreciation and amortisation (S$ million) 2,060 2,229Net interest expense (S$ million) 362 405Interest cover ratio (times) 5.69 5.50
Interest Service Ratio Operating cashflow before interest and tax (S$ million) 2,236 1,658Net interest paid (S$ million) 450 506Interest service ratio (times) 4.97 3.28
Secured Debt Ratio Secured debt (S$ million) 3,348 2,864Percentage of secured debt 27% 20%
Debt Equity Ratio Gross debt (S$ million) 12,563 14,180Cash and fixed deposit balances (S$ million) 5,920 5,498Net debt (S$ million) 6,643 8,682Equity (S$ million) 19,311 19,444Net debt equity ratio (times) 0.34 0.45
PerformanceOverview
CapitaLand Limited Annual Report 2013 84 Clarity
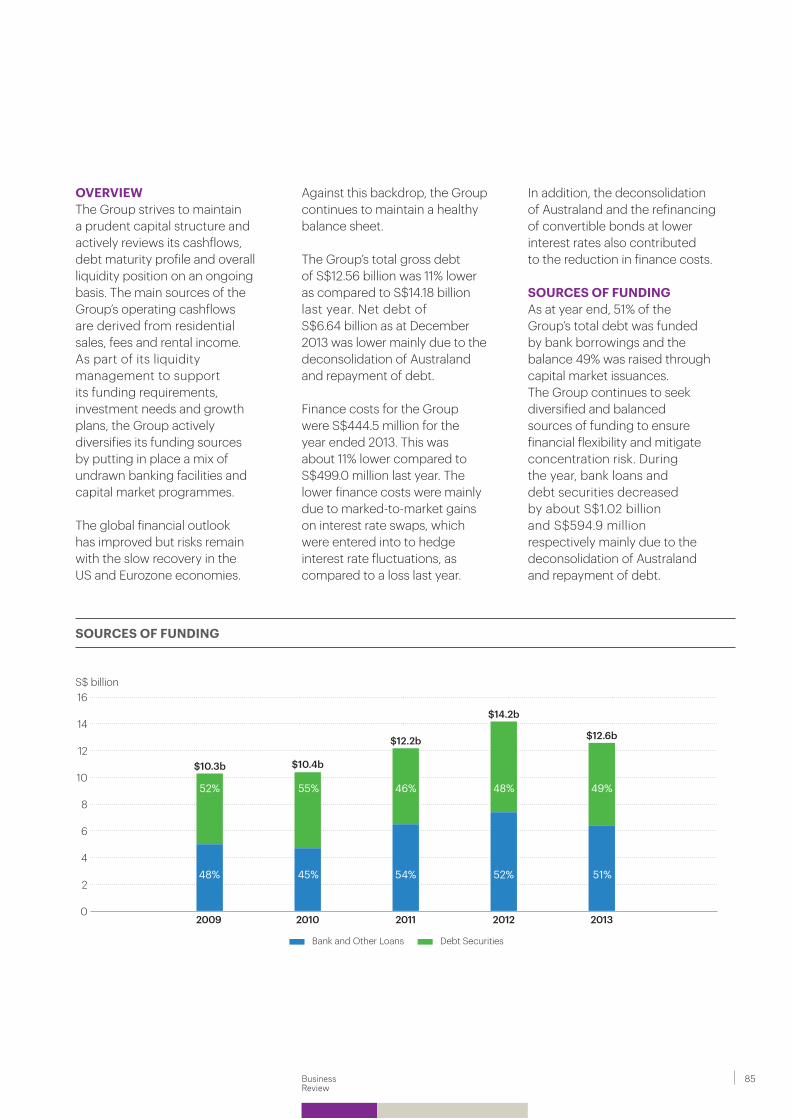
16
14
12
10
8
6
4
2
020132012201120102009
48% 45%
55% 46% 48% 49%
51%54% 52%
52%
$10.3b $10.4b
$12.2b
$14.2b
$12.6b
Bank and Other Loans Debt Securities
SOURCES OF FUNDING
S$ billion
OVERVIEW The Group strives to maintain a prudent capital structure and actively reviews its cashflows, debt maturity profile and overall liquidity position on an ongoing basis. The main sources of the Group’s operating cashflows are derived from residential sales, fees and rental income. As part of its liquidity management to support its funding requirements, investment needs and growth plans, the Group actively diversifies its funding sources by putting in place a mix of undrawn banking facilities and capital market programmes. The global financial outlook has improved but risks remain with the slow recovery in the US and Eurozone economies.
Against this backdrop, the Group continues to maintain a healthy balance sheet. The Group’s total gross debt of S$12.56 billion was 11% lower as compared to S$14.18 billion last year. Net debt of S$6.64 billion as at December 2013 was lower mainly due to the deconsolidation of Australand and repayment of debt.
Finance costs for the Group were S$444.5 million for the year ended 2013. This was about 11% lower compared to S$499.0 million last year. The lower finance costs were mainly due to marked-to-market gains on interest rate swaps, which were entered into to hedge interest rate fluctuations, as compared to a loss last year.
In addition, the deconsolidation of Australand and the refinancing of convertible bonds at lower interest rates also contributed to the reduction in finance costs.
SOURCES OF FUNDINGAs at year end, 51% of the Group’s total debt was funded by bank borrowings and the balance 49% was raised through capital market issuances. The Group continues to seek diversified and balanced sources of funding to ensure financial flexibility and mitigate concentration risk. During the year, bank loans and debt securities decreased by about S$1.02 billion and S$594.9 million respectively mainly due to the deconsolidation of Australand and repayment of debt.
85Business Review
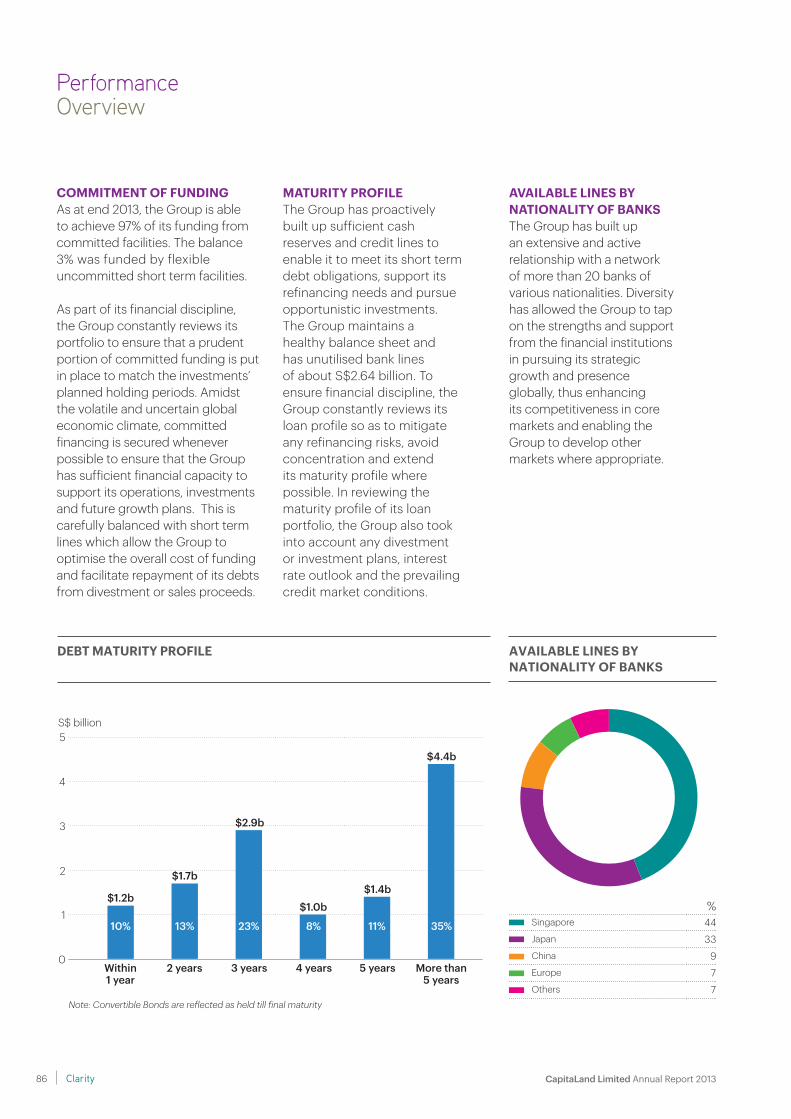
PerformanceOverview
COMMITMENT OF FUNDINGAs at end 2013, the Group is able to achieve 97% of its funding from committed facilities. The balance 3% was funded by flexible uncommitted short term facilities.
As part of its financial discipline, the Group constantly reviews its portfolio to ensure that a prudent portion of committed funding is put in place to match the investments’ planned holding periods. Amidst the volatile and uncertain global economic climate, committed financing is secured whenever possible to ensure that the Group has sufficient financial capacity to support its operations, investments and future growth plans. This is carefully balanced with short term lines which allow the Group to optimise the overall cost of funding and facilitate repayment of its debts from divestment or sales proceeds.
MATURITY PROFILEThe Group has proactively built up sufficient cash reserves and credit lines to enable it to meet its short term debt obligations, support its refinancing needs and pursue opportunistic investments. The Group maintains a healthy balance sheet and has unutilised bank lines of about S$2.64 billion. To ensure financial discipline, the Group constantly reviews its loan profile so as to mitigate any refinancing risks, avoid concentration and extend its maturity profile where possible. In reviewing the maturity profile of its loan portfolio, the Group also took into account any divestment or investment plans, interest rate outlook and the prevailing credit market conditions.
AVAILABLE LINES BY NATIONALITY OF BANKS The Group has built up an extensive and active relationship with a network of more than 20 banks of various nationalities. Diversity has allowed the Group to tap on the strengths and support from the financial institutions in pursuing its strategic growth and presence globally, thus enhancing its competitiveness in core markets and enabling the Group to develop other markets where appropriate.
5
4
3
2
1
0
DEBT MATURITY PROFILE
S$ billion
Within 1 year
2 years 3 years More than 5 years
4 years 5 years
10%
$1.2b$1.0b
$1.4b
$4.4b
$1.7b
$2.9b
13% 23% 8% 11% 35%
Note: Convertible Bonds are reflected as held till final maturity
%Singapore 44Japan 33China 9Europe 7Others 7
AVAILABLE LINES BY NATIONALITY OF BANKS
CapitaLand Limited Annual Report 2013 86 Clarity
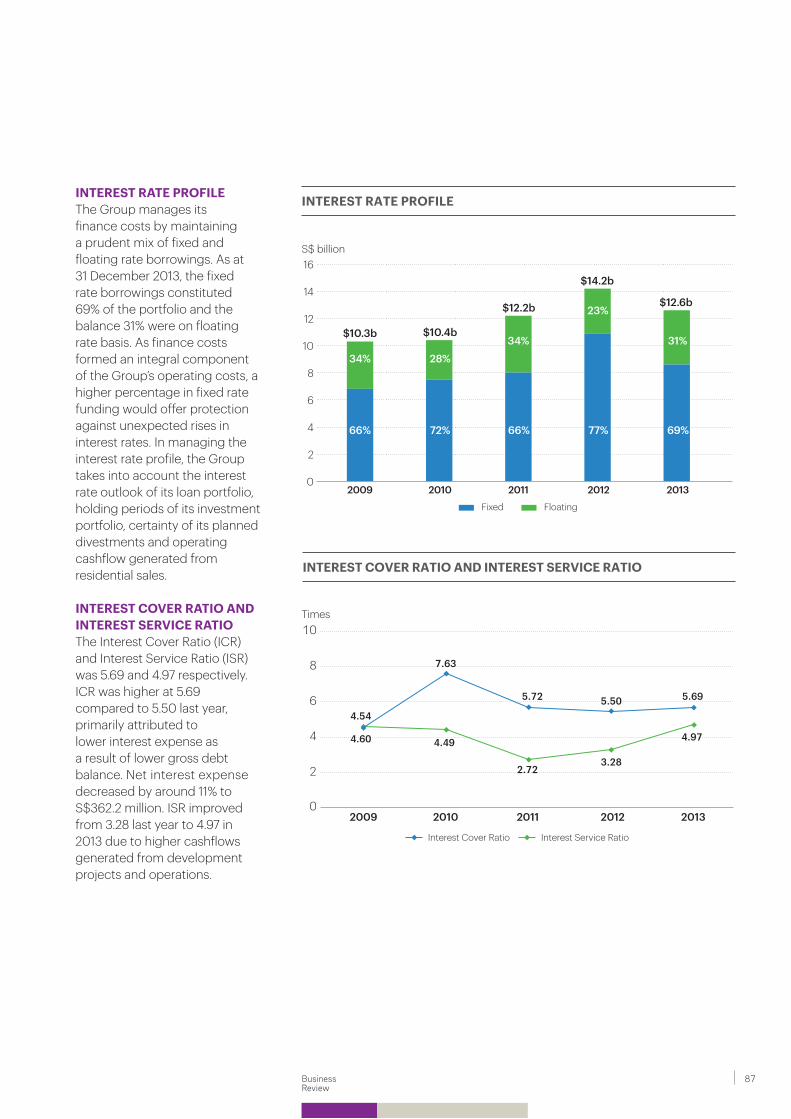
INTEREST COVER RATIO AND INTEREST SERVICE RATIO
10
8
6
4
2
020122009 2010 2011 2013
4.54
4.60 4.49
2.723.28
4.97
7.63
5.72 5.695.50
Interest Cover Ratio Interest Service Ratio
INTEREST RATE PROFILE The Group manages its finance costs by maintaining a prudent mix of fixed and floating rate borrowings. As at 31 December 2013, the fixed rate borrowings constituted 69% of the portfolio and the balance 31% were on floating rate basis. As finance costs formed an integral component of the Group’s operating costs, a higher percentage in fixed rate funding would offer protection against unexpected rises in interest rates. In managing the interest rate profile, the Group takes into account the interest rate outlook of its loan portfolio, holding periods of its investment portfolio, certainty of its planned divestments and operating cashflow generated from residential sales.
INTEREST COVER RATIO AND INTEREST SERVICE RATIO The Interest Cover Ratio (ICR)and Interest Service Ratio (ISR) was 5.69 and 4.97 respectively. ICR was higher at 5.69 compared to 5.50 last year, primarily attributed to lower interest expense as a result of lower gross debt balance. Net interest expense decreased by around 11% to S$362.2 million. ISR improved from 3.28 last year to 4.97 in 2013 due to higher cashflows generated from development projects and operations.
Times
16
14
12
10
8
6
4
2
0
INTEREST RATE PROFILE
Fixed Floating
2009 2010 2011 2012 2013
$10.3b $10.4b
$12.2b
$14.2b
$12.6b
66% 72% 66% 69%77%
34% 28%34% 31%
23%
S$ billion
87Business Review
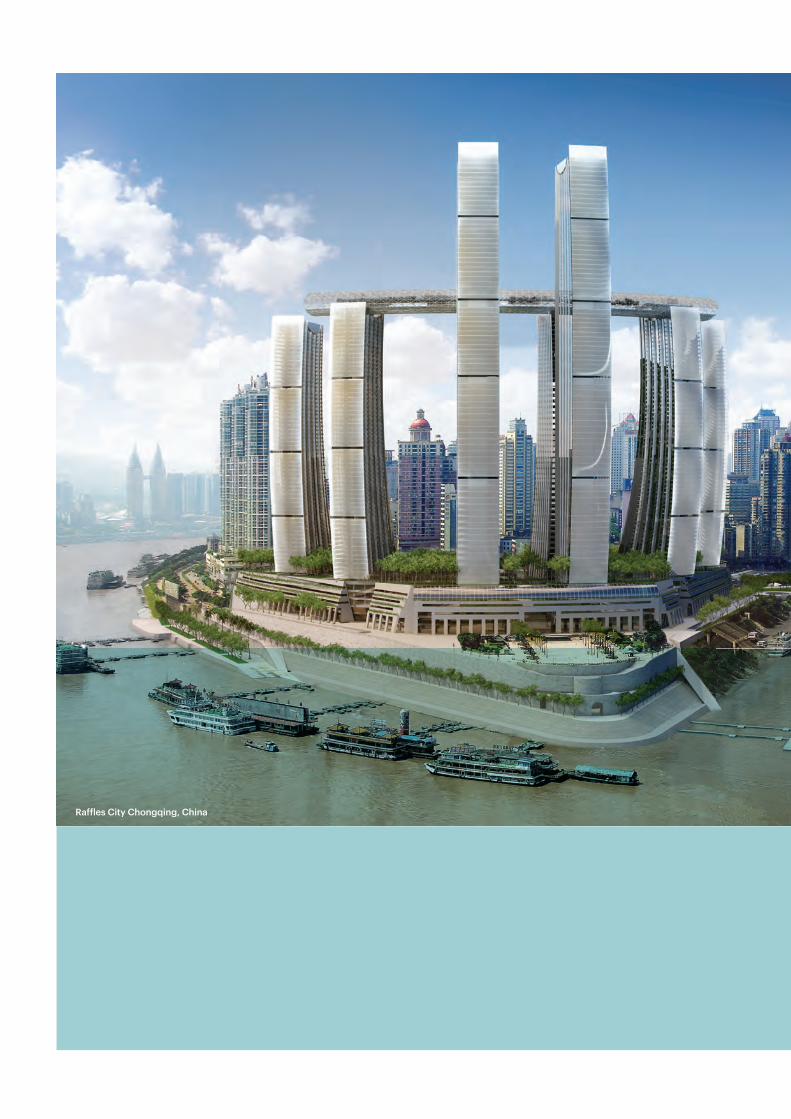
Raffles City Chongqing, China
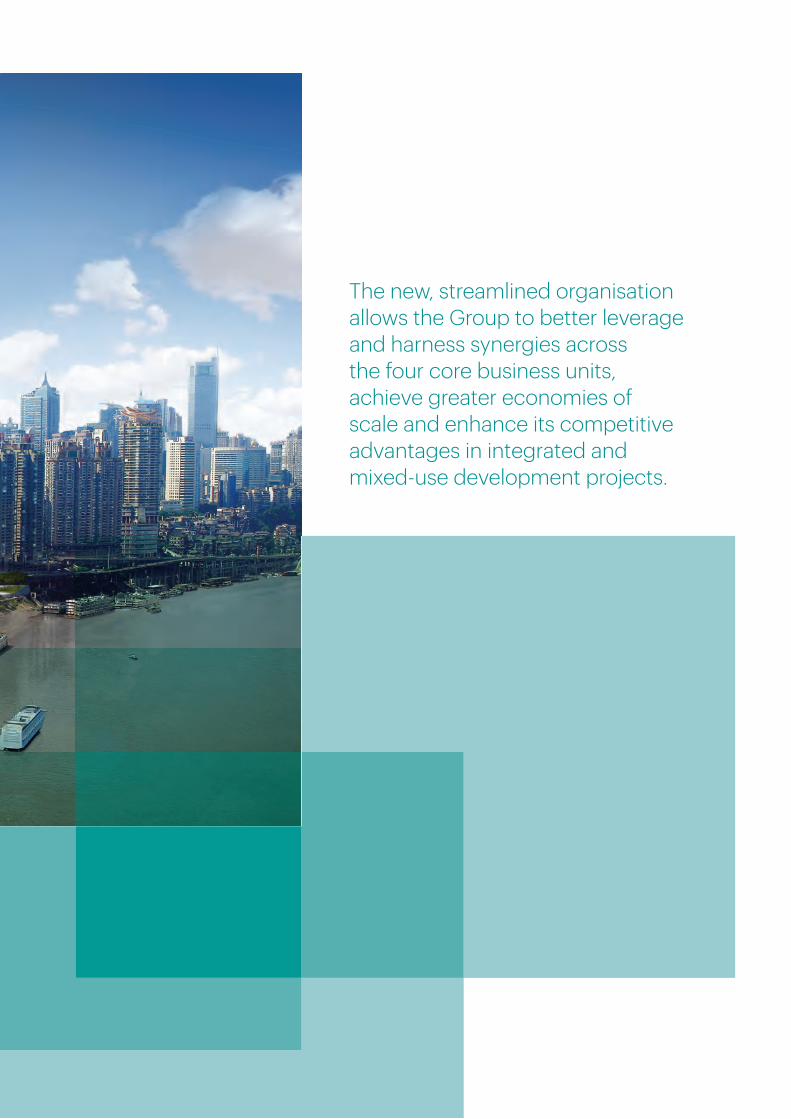
The new, streamlined organisation allows the Group to better leverage and harness synergies across the four core business units, achieve greater economies of scale and enhance its competitive advantages in integrated and mixed-use development projects.
GroupBusinesses
ORGANISATIONAL SIMPLIFICATIONOn 3 January 2013, CapitaLand streamlined and simplified its organisational structure into four main businesses to sharpen its focus on key markets and to realise its growth potential. The four main businesses are CapitaLand Singapore, CapitaLand China, CapitaMalls Asia and The Ascott Limited.
The following is a broad overview of the four businesses:
1. CAPITALAND SINGAPORE CapitaLand Singapore, a wholly-
owned subsidiary of CapitaLand Limited, is one of Singapore’s leading developers, managers and owners of homes, offices and integrated developments in Singapore and Malaysia. In Singapore, it has completed more than 13,000 homes, including units under development.
CapitaLand Singapore is also the sponsor and manager of CapitaCommercial Trust (CCT), the first commercial real estate investment trust (REIT) listed in Singapore which owns and invests in premier commercial properties in Singapore. With a total asset size of S$7.2 billion as at 31 December 2013, CCT owns and manages over 3 million square feet of net lettable area in Singapore.
2. CAPITALAND CHINA CapitaLand China, a leading foreign
real estate developer in China, is a wholly-owned subsidiary of CapitaLand, one of Asia’s largest real estate companies. CapitaLand China’s operations, which began in Shanghai in 1994, span across the nation today. It has establishedcore businesses in homes, commercial and mixed-use developments and real estate fund management, with a total development area of 16 million square metres. CapitaLand China manages seven real estate funds in China.
In line with its credo of ‘Building People’, CapitaLand China is committed to staff development
and creating a positive work environment where everyone can contribute effectively. CapitaLand China also makes effort to contribute positively to the Chinese community throughits commitment to corporate social responsibilities.
3. CAPITAMALLS ASIA CapitaMalls Asia is one of the
largest listed shopping mall developers, owners and managers in Asia by total property value of assets and geographic reach. CapitaMalls Asia has an integrated shopping mall business model encompassing retail real estate investment, development, mall operations, asset management and fund management capabilities. It has interests in and manages a pan-Asian portfolio of 105 shopping malls across 53 cities in the five countries of Singapore, China, Malaysia, Japan and India, with a total property value of approximately S$34.3 billion and a total GFA of approximately 98.5 million sq feet as at 31 December 2013.
CapitaMalls Asia’s principal business strategy is to investin, develop and manage a diversified portfolio of real estate used primarily for retail purposes in Asia, and to strengthen its market position as a leading developer, owner and manager of shopping malls in Asia.
CapitaMalls Asia’s wholly-owned subsidiary, CapitaMall Trust Management Limited, manages CapitaMall Trust, the first and largest REIT in Singapore. Separately, CapitaMalls Asia’s indirect wholly-owned subsidiary, CapitaRetail China Trust Management Limited, manages CapitaRetail China Trust, the first and only China shopping mall REIT in Singapore. In addition, CapitaMalls Asia’s joint venture in Malaysia, CapitaMalls Malaysia REIT Management Sdn. Bhd., manages CapitaMalls Malaysia Trust, the only “pure play” shopping mall REIT in Malaysia with an income- and geographically-diversified portfolio of shopping malls.
4. THE ASCOTT LIMITED The Ascott Limited is a Singapore
company that has grown to be the world’s largest international serviced residence owner-operator. It has about 23,000 operating serviced residence units in key cities of Asia Pacific, Europe and the Gulf region, as well as over 10,000 units which are under development, making a total of more than 33,000 units in over 200 properties.
The company operates three brands – Ascott, Citadines and Somerset. Its portfolio spans 82 cities across more than 20 countries, 21 of which are new cities in Ascott’s portfolio where its serviced residences are being developed.
The company is also the manager of Ascott Residence Trust, a REIT investing in serviced residences, rental housing properties and other hospitality assets, and listed in Singapore. Ascott Residence Trust has an asset size of S$3.4 billion comprising 81 properties with 8,692 units in 32 cities across 12 countries in Asia Pacific and Europe.
In addition, there are two areas which fall under CapitaLand Group Headquarters, namely Regional Investments and Financial Products & Services.
CapitaLand’s Regional Investments unit invests in and/or manages regional real estate investments that fall outside the four main business units. These include Australand, CapitaLand Vietnam, StorHub and Surbana International Consultants.
The Financial Products & Services unit provides oversight over the Group’s REITs and private equity funds. It also creates and provides real estate financial products and services. It has an established track record in originating and structuring real estate financial products through providing credit enhancements for financing arrangement in relation to real estate assets. Its areas of focus also include originating, structuring and raising private real estate funds as well as listed REITs.
CapitaLand Limited Annual Report 2013 90 Clarity
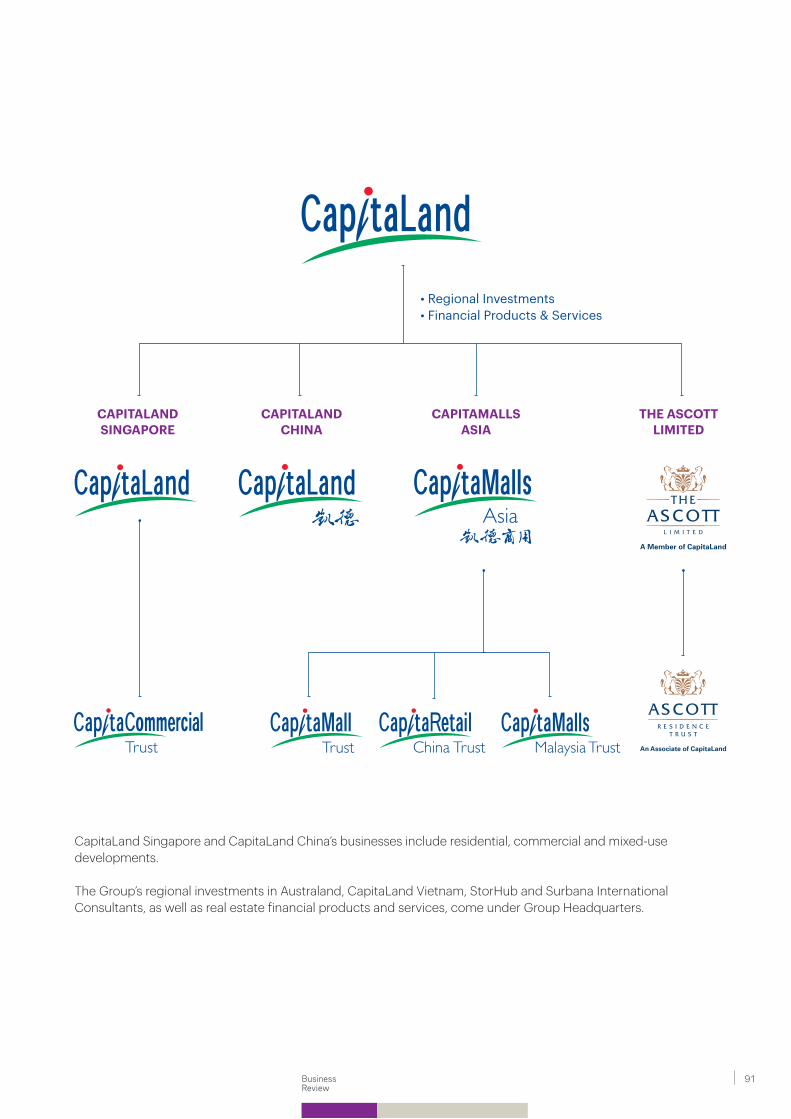
CAPITALAND SINGAPORE
CAPITAMALLSASIA
CAPITALAND CHINA
THE ASCOTTLIMITED
• Regional Investments• Financial Products & Services
CapitaLand Singapore and CapitaLand China’s businesses include residential, commercial and mixed-use developments.
The Group’s regional investments in Australand, CapitaLand Vietnam, StorHub and Surbana International Consultants, as well as real estate financial products and services, come under Group Headquarters.
91Business Review
CapitaCommercial Trust, CapitaLand’s listed commercial REIT grew its portfolio to a total asset size of S$7.22 billion as at end 2013 due to the portfolio’s higher rental income
Total Asset SizeS$7.22b
CapitaLandSingapore
SINGAPORE PROPERTY MARKETSingapore’s residential market turned in home sales of 14,948 units in 2013, down 33% from the record 22,197 units sold in 2012. Price growth moderated from 2.8% in 2012 to 1.1% in 2013. This is due to the impact of several rounds of property cooling measures and the Total Debt Servicing Ratio policy which took effect from 29 June 2013.
Singapore’s Central Business District (CBD) Grade A office rents registered a growth rate of 2.1% in 2013. The core CBD occupancy rate increased to 95.2% as at end 2013 compared to 92.2% a year ago. Given the limited supply of new CBD office space in the next two years, and improving market occupancy rate, office rents are expected to continue to increase.
QUALITY HOMES CATERING TO DIFFERENT MARKET SEGMENTSCapitaLand achieved strong residential sales in 2013, moving 1,260 homes with total sales value amounting to S$2.44 billion despite the challenging market conditions. During the year, the launch of Sky Vue, a joint venture development with Mitsubishi Estate Asia Pte Ltd, received overwhelming response. Over the launch weekend, 86% of the 505 units launched were sold, making Sky Vue the top selling project in Singapore in September 2013, and one of the top selling projects for the year. Located in the city fringe in Bishan, Sky Vue offers a selection of unit types, layouts and finishes. The convenience of being near an MRT and bus interchange as well as a shopping mall enhances
its appeal to first-time homeowners and upgraders.
In June 2013, CapitaLand successfully bid for a landed residential site in Coronation Road in a government land sales tender. Located in the prime Bukit Timah residential district and next to the Victoria Park good class bungalow area, the 37,441 sq m site will be developed into a premium landed housing development comprising semi-detached houses and bungalows.
In 2013, Temporary Occupation Permit (TOP) was obtained for a total of 1,269 units at Urban Resort Condominium, Urban Suites and The Interlace. To celebrate the early completion of the 1,040-unit The Interlace, CapitaLand organised a first-ever, large-scale TOP party in Singapore for owners and their families in September 2013 and it was well-attended.
In 2014, three projects will be launch-ready, namely, Marine Blue, a freehold lifestyle condominium in Marine Parade Road, a branded residential development in Cairnhill Road and a prestigious landed housing development in Coronation Road.
ENHANCING OFFICE PORTFOLIO IN SINGAPOREIn 2013, CapitaLand enhanced the value of its investments in Singapore’s commercial properties through active portfolio management, asset upgrading and capital recycling.
CapitaLand Singapore is one of Singapore’s leading developers, managers and owners of homes, offices and mixed-use developments.
CapitaLand achieved strong sales in 2013, moving 1,260 homes with total sales value of S$2.44 billion
Sales ValueS$2.44b
CapitaLand Limited Annual Report 2013 92 Clarity
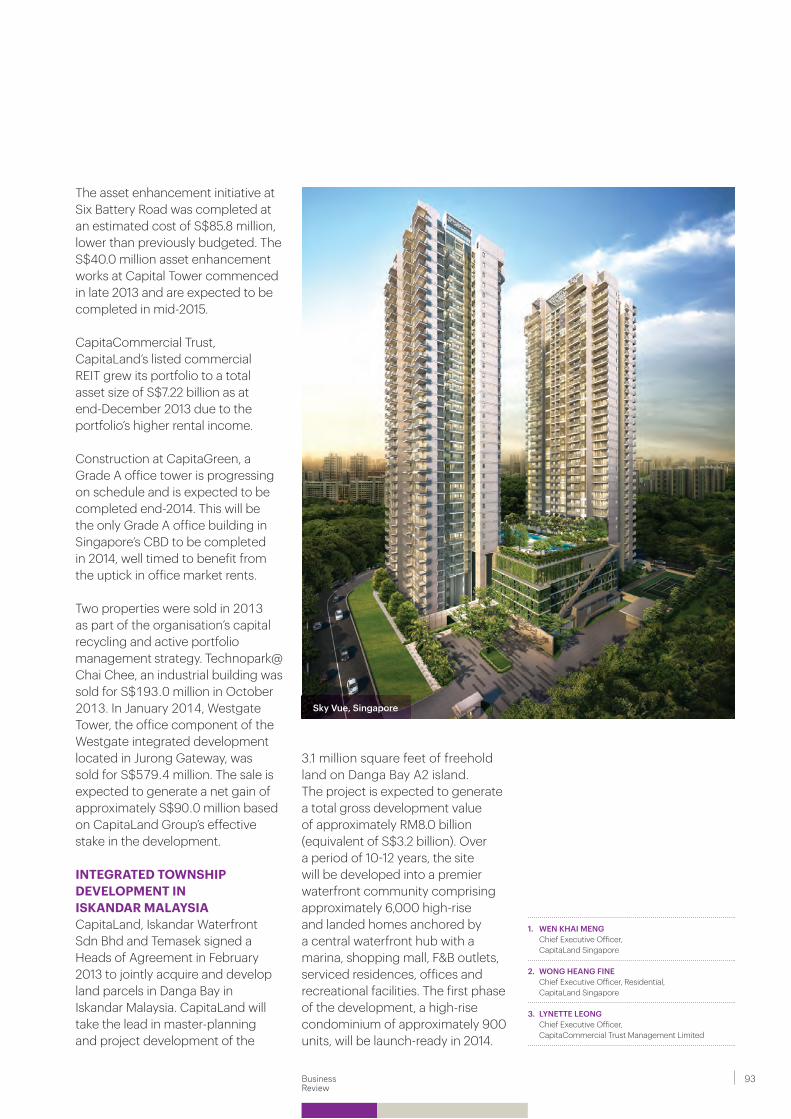
Sky Vue, Singapore
The asset enhancement initiative at Six Battery Road was completed at an estimated cost of S$85.8 million, lower than previously budgeted. The S$40.0 million asset enhancement works at Capital Tower commenced in late 2013 and are expected to be completed in mid-2015.
CapitaCommercial Trust, CapitaLand’s listed commercial REIT grew its portfolio to a total asset size of S$7.22 billion as at end-December 2013 due to the portfolio’s higher rental income.
Construction at CapitaGreen, a Grade A office tower is progressing on schedule and is expected to be completed end-2014. This will be the only Grade A office building in Singapore’s CBD to be completed in 2014, well timed to benefit from the uptick in office market rents. Two properties were sold in 2013 as part of the organisation’s capital recycling and active portfolio management strategy. Technopark@Chai Chee, an industrial building was sold for S$193.0 million in October 2013. In January 2014, Westgate Tower, the office component of the Westgate integrated development located in Jurong Gateway, was sold for S$579.4 million. The sale is expected to generate a net gain of approximately S$90.0 million based on CapitaLand Group’s effective stake in the development. INTEGRATED TOWNSHIP DEVELOPMENT IN ISKANDAR MALAYSIACapitaLand, Iskandar Waterfront Sdn Bhd and Temasek signed a Heads of Agreement in February 2013 to jointly acquire and develop land parcels in Danga Bay in Iskandar Malaysia. CapitaLand will take the lead in master-planning and project development of the
3.1 million square feet of freehold land on Danga Bay A2 island. The project is expected to generate a total gross development value of approximately RM8.0 billion (equivalent of S$3.2 billion). Over a period of 10-12 years, the site will be developed into a premier waterfront community comprising approximately 6,000 high-rise and landed homes anchored by a central waterfront hub with a marina, shopping mall, F&B outlets, serviced residences, offices and recreational facilities. The first phase of the development, a high-rise condominium of approximately 900 units, will be launch-ready in 2014.
1. WEN KHAI MENG Chief Executive Officer,
CapitaLand Singapore
2. WONG HEANG FINE Chief Executive Officer, Residential,
CapitaLand Singapore
3. LYNETTE LEONG Chief Executive Officer,
CapitaCommercial Trust Management Limited
93Management Reports Business Review
Following the integration, CapitaLand China has a pipeline of approximately 70,000 residential units
Residential Units70,000
CapitaLandChina
In 2013, both CapitaValue Homes and Surbana’s residential development business were integrated into CapitaLand China’s business to allow for better synergy and economies of scale. Following the integration, CapitaLand China has a pipeline of approximately 70,000 residential units.
STABLE RESIDENTIAL SALES CapitaLand China is positive about the property market in the long-term as urbanisation, growing affluence and increasing domestic consumption will generate demand. By end 2013, CapitaLand China sold more than 7,600 residential units including those from the township business with a total sales value of RMB8.5 billion (S$1.70 billion), translating into an increase of approximately 16% year-on-year in terms of units sold. The residential sales were mainly from The Loft in Chengdu, The Metropolis in Kunshan, Dolce Vita in Guangzhou, La Botanica in Xi’an and The Botanica in Chengdu. 272 residential units of The Metropolis in Kunshan were launched in 4Q 2013, and fully sold during the launch.
COMPETITIVE EDGE WITH MIXED-USE DEVELOPMENTSBy leveraging its core competencies in homes, offices, shopping malls and serviced residences, CapitaLand will focus on mixed-use development projects in China to increase its competitive advantage. Currently it has eight Raffles City branded developments in China,
with a construction floor area of approximately 3.1 million sqm.
Raffles City Shanghai and Raffles City Beijing continue with stable performance and strong rental growth. Raffles City Ningbo (RCN) and Raffles City Chengdu (RCC) which opened in 2012 performed well last year. RCN had a 97% committed occupancy of its retail mall and an average monthly traffic of approximately 500,000 shoppers. RCC held its first year anniversary celebration in September 2013 and opened Ascott Raffles City Chengdu in 4Q 2013. RCC’s retail mall achieved an average traffic of approximately 700,000 shoppers per month. Separately, Raffles City Shenzhen (RCSZ) Phase 1 - iPark (Block B) was handed over, while the development’s shopping mall is targeted to open in 2016. RCSZ shopping mall and the international Grade A office were conferred the Leadership in Energy and Environmental Design (LEED) Gold-level Pre-Certification. Raffles City Hangzhou has achieved 80% structural completion and will open in 2015. The construction of Raffles City Changning and Raffles City Chongqing is in progress and the developments are targeted to open in 2016 and 2018 respectively.
CapitaLand China acquired 70% stake in Shanghai Guang Chuan Property Co., Ltd. which owns two plots of land with a total GFA of
CapitaLand has grown to become one of the largest foreign real estate developers by GFA in China with a diversified real estate portfolio including homes, offices, shopping malls, serviced residences, mixed-use developments and real estate fund management.
CapitaLand will focus on mixed-use development projects in China to increase its competitive advantage
CapitaLand Limited Annual Report 2013 94 Clarity
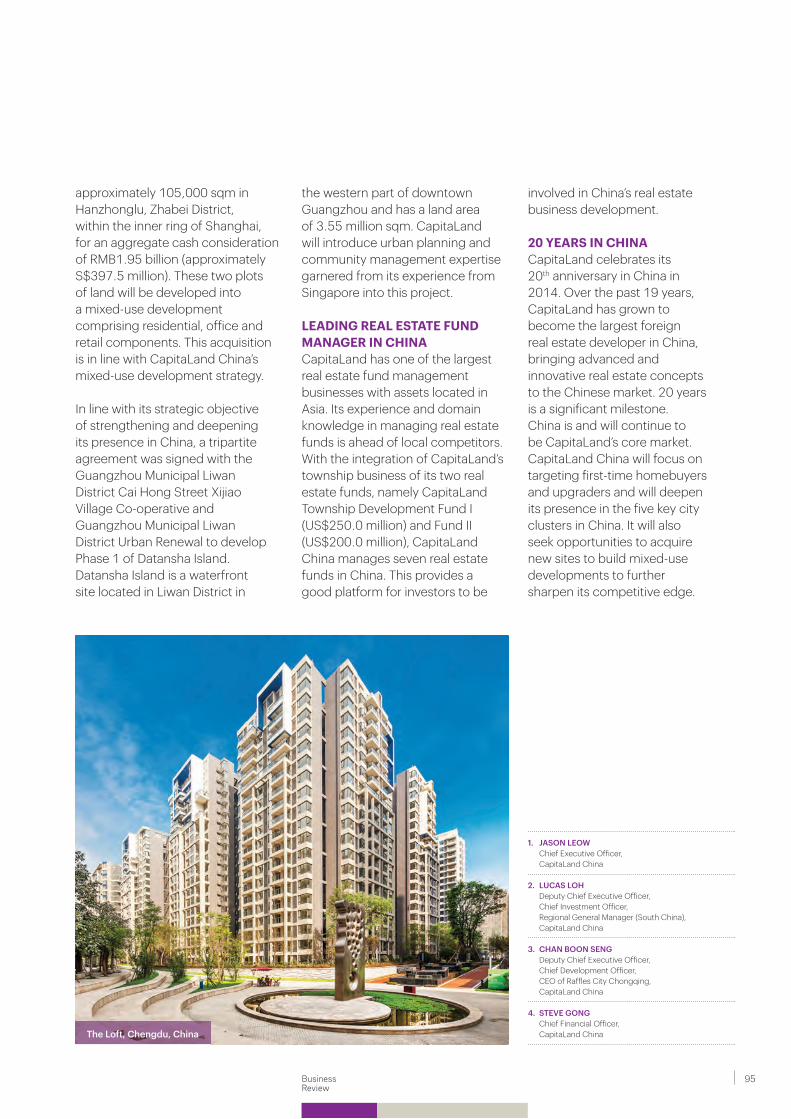
The Loft, Chengdu, China
1. JASON LEOW Chief Executive Officer,
CapitaLand China
2. LUCAS LOH Deputy Chief Executive Officer, Chief Investment Officer, Regional General Manager (South China), CapitaLand China
3. CHAN BOON SENG Deputy Chief Executive Officer, Chief Development Officer, CEO of Raffles City Chongqing, CapitaLand China
4. STEVE GONG Chief Financial Officer,
CapitaLand China
approximately 105,000 sqm in Hanzhonglu, Zhabei District, within the inner ring of Shanghai, for an aggregate cash consideration of RMB1.95 billion (approximately S$397.5 million). These two plots of land will be developed into a mixed-use development comprising residential, office and retail components. This acquisition is in line with CapitaLand China’s mixed-use development strategy.
In line with its strategic objective of strengthening and deepening its presence in China, a tripartite agreement was signed with the Guangzhou Municipal Liwan District Cai Hong Street Xijiao Village Co-operative and Guangzhou Municipal Liwan District Urban Renewal to develop Phase 1 of Datansha Island. Datansha Island is a waterfront site located in Liwan District in
the western part of downtown Guangzhou and has a land area of 3.55 million sqm. CapitaLand will introduce urban planning and community management expertise garnered from its experience from Singapore into this project.
LEADING REAL ESTATE FUND MANAGER IN CHINA CapitaLand has one of the largest real estate fund management businesses with assets located in Asia. Its experience and domain knowledge in managing real estate funds is ahead of local competitors. With the integration of CapitaLand’s township business of its two real estate funds, namely CapitaLand Township Development Fund I(US$250.0 million) and Fund II (US$200.0 million), CapitaLand China manages seven real estate funds in China. This provides a good platform for investors to be
involved in China’s real estate business development.
20 YEARS IN CHINACapitaLand celebrates its 20th anniversary in China in 2014. Over the past 19 years, CapitaLand has grown to become the largest foreign real estate developer in China, bringing advanced and innovative real estate concepts to the Chinese market. 20 yearsis a significant milestone. China is and will continue to be CapitaLand’s core market. CapitaLand China will focus on targeting first-time homebuyers and upgraders and will deepenits presence in the five key city clusters in China. It will also seek opportunities to acquire new sites to build mixed-use developments to further sharpen its competitive edge.
95Business Review
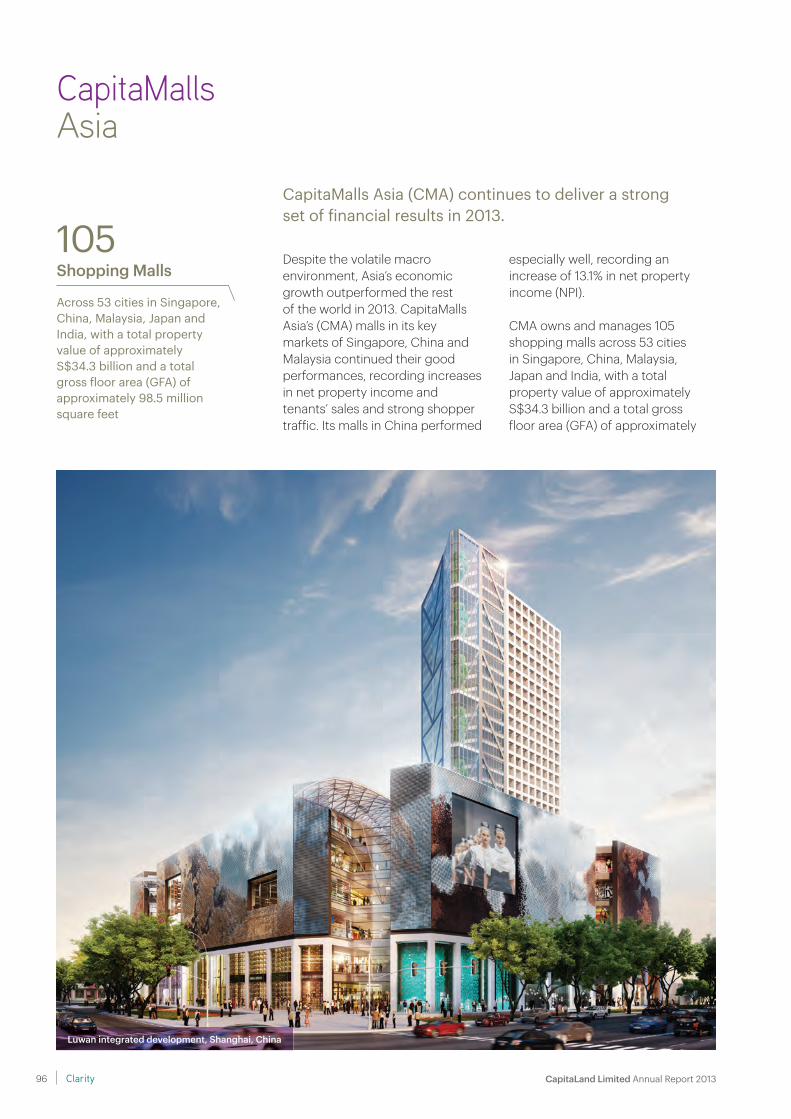
CapitaMallsAsia
Despite the volatile macro environment, Asia’s economic growth outperformed the rest of the world in 2013. CapitaMalls Asia’s (CMA) malls in its key markets of Singapore, China and Malaysia continued their good performances, recording increases in net property income and tenants’ sales and strong shopper traffic. Its malls in China performed
especially well, recording an increase of 13.1% in net property income (NPI).
CMA owns and manages 105 shopping malls across 53 citiesin Singapore, China, Malaysia, Japan and India, with a total property value of approximately S$34.3 billion and a total gross floor area (GFA) of approximately
CapitaMalls Asia (CMA) continues to deliver a strong set of financial results in 2013.
Luwan integrated development, Shanghai, China
Across 53 cities in Singapore, China, Malaysia, Japan and India, with a total property value of approximately S$34.3 billion and a total gross floor area (GFA) of approximately 98.5 million square feet
Shopping Malls105
CapitaLand Limited Annual Report 2013 96 Clarity
To continue its growth and build relevant scale, particularly in the key gateway cities in China, CMA committed a total of more than S$2.2 billion innew investments in 2013
Total of more than
in new investmentsS$2.2b
98.5 million square feet. Of these, 85 malls are operational while the other 20 are under development.
BUILDING ON INFLECTION POINTBuilding on its inflection point in 2012 – when more than 50% of its malls in China by net asset value became operational – CMA continued to expand its base for recurring earnings by opening four CapitaMalls in 2013, bringing the total number of operational malls in Singapore and China to 70. These were Westgate and Bedok Mall in Singapore, and CapitaMall Meilicheng and the second phase of CapitaMall Jinniu – which is 1.5 times the size of the first phase – in Chengdu, China.
To continue its growth and build relevant scale, particularlyin the key gateway cities in China, CMA committed a total of more than S$2.2 billion in new investments in 2013. These were for acquisitions of stakes in four malls: one in Singapore (Project Jewel, a 49:51 joint venture with Changi Airport Group to develop an iconic mixed-use development at Changi Airport) and three in China (CapitaMall SKY+ in Guangzhou – its first mall in the strategic first-tier city; a mall at Gutian in Wuhan – its fourth in the provincial capital, which is a major transport and commercial hub in Central China; and CapitaMall Grand Canyon in Beijing, which was acquired by CapitaRetail China Trust, as CMA’s 10th mall in the capital).
To further optimise its balance sheet, CMA recycled capital by injecting three China malls under
development – CapitaMall 1818 in Wuhan, CapitaMall Xinduxin in Qingdao and its integrated development in the Luwan district in Shanghai – by transferring its stakes to CapitaMalls China Development Fund III. This is CMA’s largest private equity fund, and its fourth fund on China.
MOVING FORWARDCMA looks ahead to 2014 with confidence, as its key markets of Singapore, China and Malaysia are poised for continued growth. In 2014, CMA targets to open four new CapitaMalls: two each in China – CapitaMall Tianfu in Chengdu and CapitaMall SKY+ – and India (in Hyderabad and Mangalore).
CMA remains focused on sharpening its execution to secure and grow stable and resilient underlying income. It will continue to deepen its presence in key gateway cities and to grow scale, to ride on Asia’s consumption growth.
1. LIM BENG CHEE Chief Executive Officer,
CapitaMalls Asia Limited
2. SIMON HO Deputy Chief Executive Officer,
CapitaMalls Asia Limited
3. NG KOK SIONG Chief Financial Officer,
CapitaMalls Asia Limited
4. WILSON TAN Chief Executive Officer,
CapitaMall Trust Management Limited
5. TONY TAN Chief Executive Officer,
CapitaRetail China Trust Management Limited
6. SHARON LIM Chief Executive Officer,
CapitaMalls Malaysia REIT Management Sdn Bhd
97Management Reports Business Review
Ascott
ACQUISITIONS AND CAPITAL RECYCLING FOR OPTIMAL RETURNS Ascott continued to seize market opportunities to optimise returns by pursuing acquisitions. In August 2013, it acquired an operating serviced residence in Hong Kong for HK$462.3 million (approximately S$74.9 million), further expanding its footprint in Hong Kong. Ascott adopts a prudent approach towards acquisitions, focusing on key gateway cities where it is able to add real estate value through asset reconfiguration and repositioning. Its geographically diversified business allows it to maintain a counter cyclicalapproach towards its investments.
Ascott China Fund, which is 36.1% owned by Ascott, also made its maiden divestment to Ascott’s 45.3% owned associate company, Ascott Residence Trust. Its share of divestment proceeds arising from the divestment of Citadines Biyun Shanghai and Somerset Heping Shenyang will enable Ascott to unlock value and reinvest in further acquisitions.
ACTIVE PORTFOLIO MANAGEMENT TO CREATE REAL ESTATE VALUE In FY 2013, Ascott continued to focus on active asset enhancement initiatives to reposition and
upgrade its products by reconfiguring the layout of public space and rooms to maximise returns and enhance experience for its customers. In FY 2013, more than S$70 million was invested to refurbish various properties owned by Ascott and its associates in Asia and Europe. It maintains a disciplined approach towards its asset enhancement initiatives and targets a payback period of no more than five years for each refurbishment it undertakes.
To date, Ascott has delivered on its asset enhancement initiatives to generate returns. For example, in Paris, Average Daily Rate (ADR) increased by approximately 40% following the refurbishment of Citadines Suites Lourve Paris, and the completion of the first phase of refurbishment for Somerset Xu Hui Shanghai lifted ADR by approximately 35% for the renovated rooms.
SHARPENING COMPETITIVENESS AND LEVERAGING ON BRAND EQUITY TO INCREASE HOSPITALITY FEE INCOME In FY 2013, Ascott secured 21 management contracts and added close to 3,700 apartment units to its portfolio. This represents a 31.0% year-on-year increase from 2,800 units in 2012.
CapitaLand’s serviced residence business unit, Ascott, has an international portfolio of quality serviced residences which it actively manages and enhances through its award winning brands and operations. In 2013, Ascott continued to deliver on its growth strategy by seizing the opportunity to acquire an operating serviced residence in Hong Kong and realised the value of some assets at the optimal time. Ascott also continued to actively focus on asset enhancement initiatives to create real estate value and enhance returns. The year ended with Ascott having achieved a milestone of over 33,700 apartment units in 231 properties across more than 82 cities in Asia Pacific, Europe and the Gulf region. Looking ahead, Ascott will actively look for investments in key gateway cities to underpin future earnings and maximise returns.
Ascott also entered into seven new cities in China, Saudi Arabia, India and Thailand.
In China, Ascott delivered on its strategy to deepen its presence and build operational scale. In November 2013, Ascott announced that it had crossed the milestone of having 10,000 apartment units in its key market of China, cementing its leadership position as the largest international serviced residence owner-operator in the country with 56 properties across 20 cities. This brings Ascott closer to its target of achieving 12,000 apartment units in China by 2015.
Partnerships with property developers such as Yuexiu Property Company Limited to manage its serviced residences is testament to Ascott’s track record in the serviced residence industry. Ascott will continue to work with property developers in China and leverage on its competitive advantage and knowledge of the China market to drive hospitality fee income.
Ascott’s award-winning properties and service improvements continue to enjoy worldwide recognition as preferred accommodation for business
CapitaLand Limited Annual Report 2013 98 Clarity
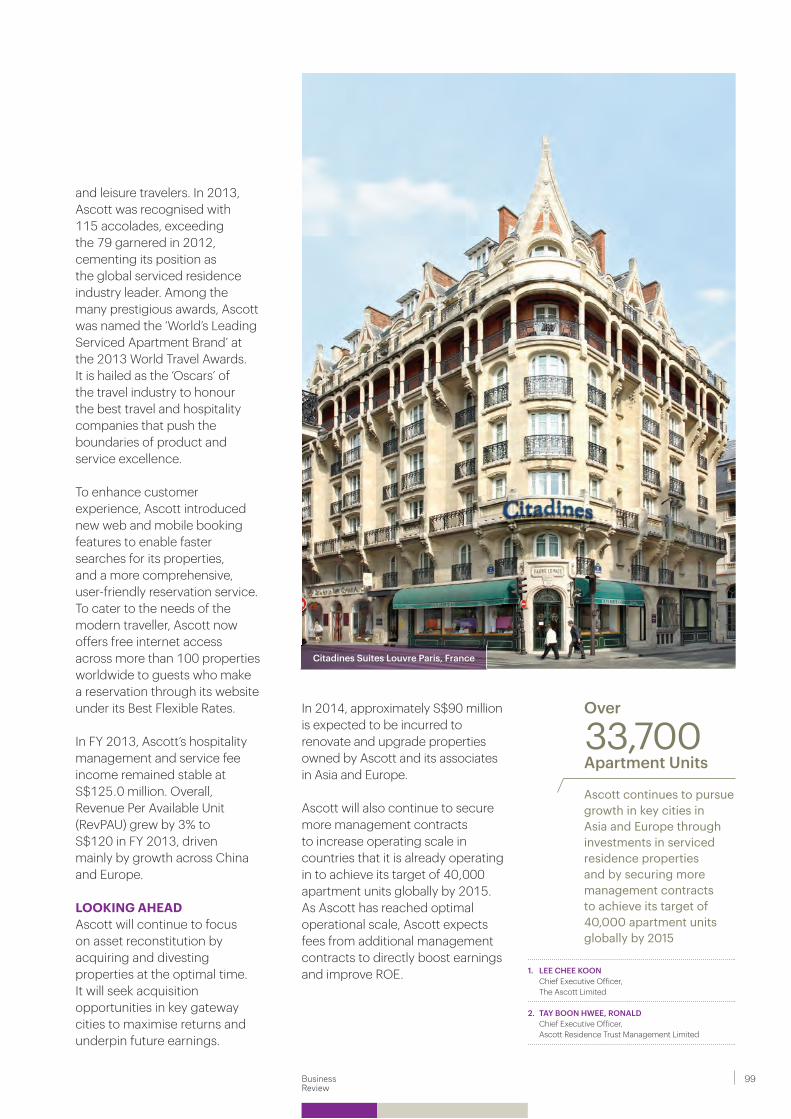
Citadines Suites Louvre Paris, France
and leisure travelers. In 2013, Ascott was recognised with 115 accolades, exceeding the 79 garnered in 2012, cementing its position as the global serviced residence industry leader. Among the many prestigious awards, Ascott was named the ‘World’s Leading Serviced Apartment Brand’ at the 2013 World Travel Awards. It is hailed as the ‘Oscars’ of the travel industry to honour the best travel and hospitality companies that push the boundaries of product and service excellence.
To enhance customer experience, Ascott introduced new web and mobile booking features to enable faster searches for its properties, and a more comprehensive, user-friendly reservation service. To cater to the needs of the modern traveller, Ascott now offers free internet access across more than 100 properties worldwide to guests who make a reservation through its website under its Best Flexible Rates.
In FY 2013, Ascott’s hospitality management and service fee income remained stable at S$125.0 million. Overall, Revenue Per Available Unit (RevPAU) grew by 3% to S$120 in FY 2013, driven mainly by growth across China and Europe.
LOOKING AHEADAscott will continue to focus on asset reconstitution by acquiring and divesting properties at the optimal time. It will seek acquisition opportunities in key gateway cities to maximise returns and underpin future earnings.
In 2014, approximately S$90 millionis expected to be incurred to renovate and upgrade properties owned by Ascott and its associates in Asia and Europe.
Ascott will also continue to secure more management contracts to increase operating scale in countries that it is already operating in to achieve its target of 40,000 apartment units globally by 2015. As Ascott has reached optimal operational scale, Ascott expects fees from additional management contracts to directly boost earnings and improve ROE. 1. LEE CHEE KOON
Chief Executive Officer, The Ascott Limited
2. TAY BOON HWEE, RONALD Chief Executive Officer,
Ascott Residence Trust Management Limited
Ascott continues to pursue growth in key cities in Asia and Europe through investments in serviced residence properties and by securing more management contracts to achieve its target of 40,000 apartment units globally by 2015
Apartment Units33,700Over
99Management Reports Business Review

Mulberry Lane, Hanoi, Vietnam
CapitaLand’s Regional Investments unit manages regional real estate investments that fall outside the four main business units. These include Australand, CapitaLand Vietnam, StorHub and Surbana International Consultants Pte Ltd.
AUSTRALAND PROPERTY GROUPAustraland Property Group successfully delivered a 4% increase in operating profit to A$147.9 million (S$169 million) in 2013. Statutory profit for the year was A$135.3 million (S$154.6 million).
The Group’s result was underpinned by growth in earnings from its A$2.4 billion
(S$2.74 billion) investment property portfolio. Equally weighted to office and industrial sectors, the investment portfolio continues to retain high quality tenants and has a long dated lease expiry profile with contracted rental growth. The development of the Rhodes F office building in Sydney was completed in 2013 and is a quality addition to the portfolio.
The Commercial & Industrial development division completed a number of new industrial/logistics facilities during the year, with an end value of approximately A$440 million (S$502.9 million),
RegionalInvestments
The Group’s result was underpinned by growth in earnings from its A$2.4 billion (S$2.74 billion) investment property portfolio
S$2.74b
CapitaLand Limited Annual Report 2013 100 Clarity
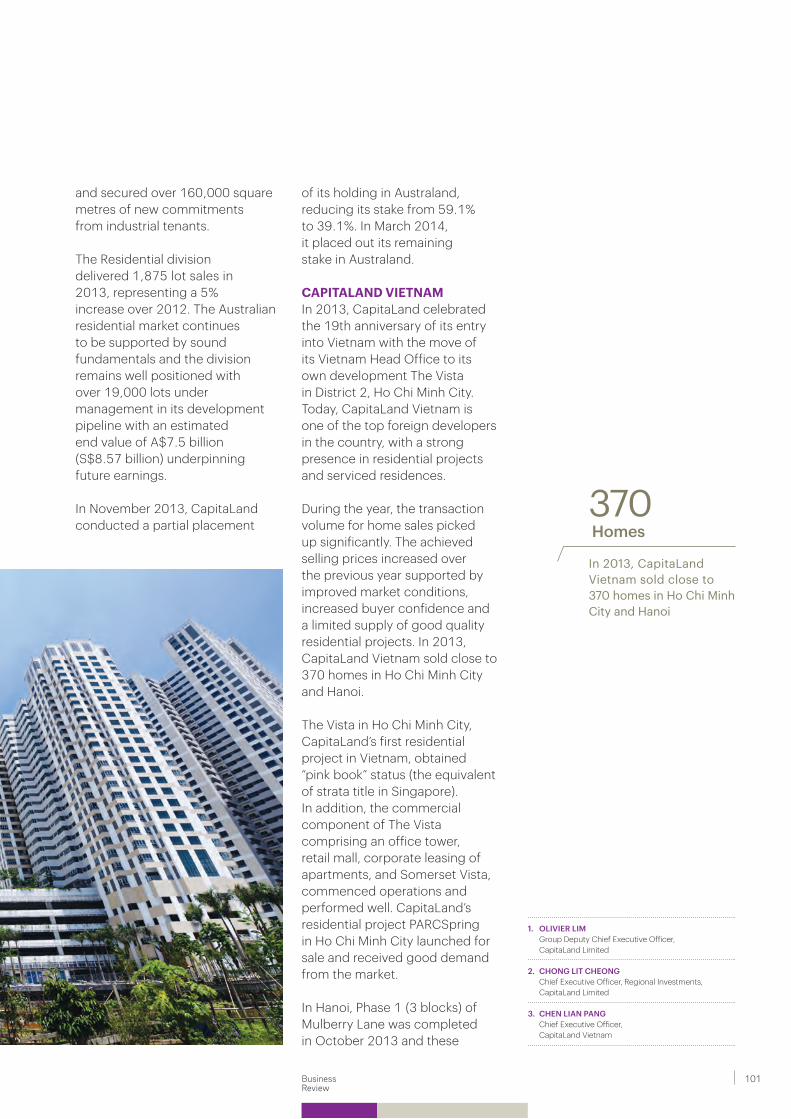
and secured over 160,000 square metres of new commitments from industrial tenants.
The Residential division delivered 1,875 lot sales in 2013, representing a 5% increase over 2012. The Australian residential market continues to be supported by sound fundamentals and the division remains well positioned with over 19,000 lots under management in its development pipeline with an estimated end value of A$7.5 billion (S$8.57 billion) underpinning future earnings.
In November 2013, CapitaLand conducted a partial placement
of its holding in Australand, reducing its stake from 59.1% to 39.1%. In March 2014, it placed out its remaining stake in Australand.
CAPITALAND VIETNAMIn 2013, CapitaLand celebrated the 19th anniversary of its entry into Vietnam with the move of its Vietnam Head Office to its own development The Vista in District 2, Ho Chi Minh City. Today, CapitaLand Vietnam is one of the top foreign developers in the country, with a strong presence in residential projects and serviced residences.
During the year, the transaction volume for home sales picked up significantly. The achieved selling prices increased over the previous year supported by improved market conditions, increased buyer confidence and a limited supply of good quality residential projects. In 2013, CapitaLand Vietnam sold close to 370 homes in Ho Chi Minh City and Hanoi.
The Vista in Ho Chi Minh City, CapitaLand’s first residential project in Vietnam, obtained “pink book” status (the equivalent of strata title in Singapore). In addition, the commercial component of The Vista comprising an office tower, retail mall, corporate leasing of apartments, and Somerset Vista, commenced operations and performed well. CapitaLand’s residential project PARCSpring in Ho Chi Minh City launched for sale and received good demand from the market.
In Hanoi, Phase 1 (3 blocks) of Mulberry Lane was completed in October 2013 and these
In 2013, CapitaLand Vietnam sold close to 370 homes in Ho Chi Minh City and Hanoi
Homes370
1. OLIVIER LIM Group Deputy Chief Executive Officer, CapitaLand Limited
2. CHONG LIT CHEONG Chief Executive Officer, Regional Investments, CapitaLand Limited
3. CHEN LIAN PANG Chief Executive Officer, CapitaLand Vietnam
101Business Review
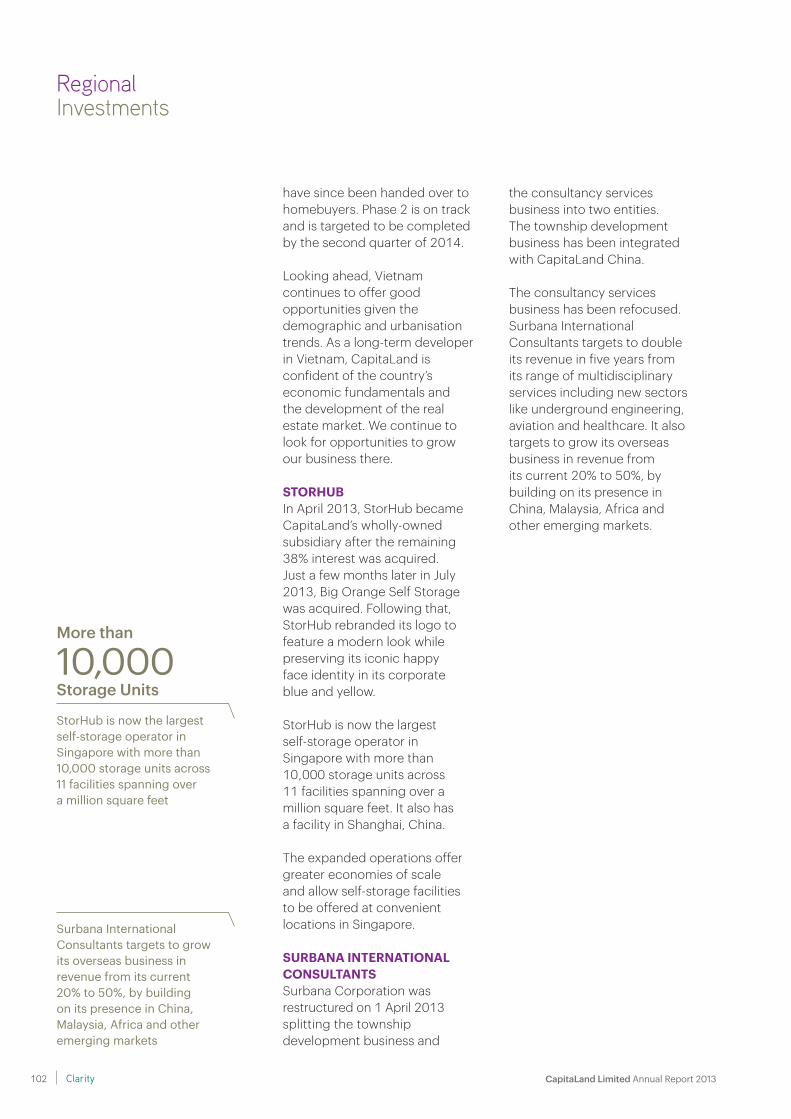
have since been handed over to homebuyers. Phase 2 is on track and is targeted to be completed by the second quarter of 2014.
Looking ahead, Vietnam continues to offer good opportunities given the demographic and urbanisation trends. As a long-term developer in Vietnam, CapitaLand is confident of the country’s economic fundamentals and the development of the real estate market. We continue to look for opportunities to grow our business there.
STORHUBIn April 2013, StorHub became CapitaLand’s wholly-owned subsidiary after the remaining 38% interest was acquired. Just a few months later in July 2013, Big Orange Self Storage was acquired. Following that, StorHub rebranded its logo to feature a modern look while preserving its iconic happy face identity in its corporate blue and yellow.
StorHub is now the largest self-storage operator in Singapore with more than 10,000 storage units across 11 facilities spanning over a million square feet. It also has a facility in Shanghai, China.
The expanded operations offer greater economies of scale and allow self-storage facilities to be offered at convenient locations in Singapore.
SURBANA INTERNATIONAL CONSULTANTSSurbana Corporation was restructured on 1 April 2013splitting the township development business and
the consultancy services business into two entities. The township development business has been integrated with CapitaLand China.
The consultancy services business has been refocused. Surbana International Consultants targets to double its revenue in five years from its range of multidisciplinary services including new sectors like underground engineering, aviation and healthcare. It also targets to grow its overseas business in revenue from its current 20% to 50%, by building on its presence in China, Malaysia, Africa and other emerging markets.
Surbana International Consultants targets to grow its overseas business in revenue from its current 20% to 50%, by building on its presence in China, Malaysia, Africa and other emerging markets
Regional Investments
StorHub is now the largest self-storage operator in Singapore with more than 10,000 storage units across 11 facilities spanning over a million square feet
10,000Storage Units
More than
CapitaLand Limited Annual Report 2013 102 Clarity
FinancialProducts & Services
CapitaLand’s Financial Products & Services unit provides oversight over the Group’s Real Estate Investment Trusts (REITs) and private equity funds. It also creates and provides real estate financial products and services. It has an established track record in originating and structuring real estate financial products including providing credit enhancements for financing arrangements in relation to real estate assets. Its areas of focus also include originating, structuring and raising private real estate funds as well as listed REITs.
The Group also works closely with capital partners including sovereign wealth funds, banks, insurance companies and family offices worldwide.
The Group manages a total of six REITs and 16 private equity (PE) funds with aggregate Assets Under Management (AUM) of S$41.0 billion. The majority of the assets are located in the core markets of Singapore (42%) and China (44%). Total management fees for PE funds and REITs received by the Group in 2013 totaled S$178.0 million.
CapitaLand’s REITs have a recognised track record of adding value through portfolio reconstitution, acquisition, development, asset enhancements, proactive leasing and capital management.
CapitaMall Trust (CMT) completed various asset enhancement works at Clarke Quay, Junction 8, IMM Building and Bugis Junction. CMT also announced that asset enhancement works at Tampines Mall will start in the first quarter of 2014. Westgate commenced mall operations on 2 December 2013 and a consortium has entered into sales and purchase agreements to purchase Westgate Tower for a
total consideration of approximately S$579.4 million.
CapitaCommercial Trust completed an asset enhancement for Six Battery Road at an estimated cost of S$85.8 million and announced a S$40.0 million asset enhancement for Capital Tower which is expected to be completed in the second quarter of 2015.
Ascott Residence Trust (ART)continued to pursue yield-accretive acquisitions in 2013 by purchasing S$287.4 million worth of assets, funded by the proceeds of S$150.0 million raised from an equity placement in January 2013. The acquired assets include three serviced apartments in China namely Somerset Heping Shenyang, Citadines Biyun Shanghai and Citadines Xinghai Suzhou, as well as 11 rental housing properties in key cities outside Tokyo, Japan. In December 2013, ART had a 1-for-5rights issue to raise approximately S$253.0 million. The rights issue proceeds will enhance ART’s financial ability to pursue potential acquisitions in key gateway cities.
CapitaRetail China Trust continued its growth with the acquisition of CapitaMall Grand Canyon in Beijing, enlarging its portfolio to 10 shopping malls. It will enjoy an uplift in returns once the major asset enhancement works that CapitaMall Minzhongleyuan is currently undergoing is completed in the second quarter of 2014.
REITs and fund management remain the cornerstone of CapitaLand’s business model. CapitaLand will continue to grow AUM through accretive acquisitions, developments and asset enhancements. It will also seek opportunities to originate new real estate PE funds and real estate financial products.
CapitaLand’s REITs have a recognised track record of adding value through portfolio reconstitution, acquisition, development, asset enhancements, proactive leasing and capital management
1. OLIVIER LIM Group Deputy Chief Executive Officer, CapitaLand Limited
2. JOHN PANG Managing Director, CapitaLand Financial Limited
103Business Review
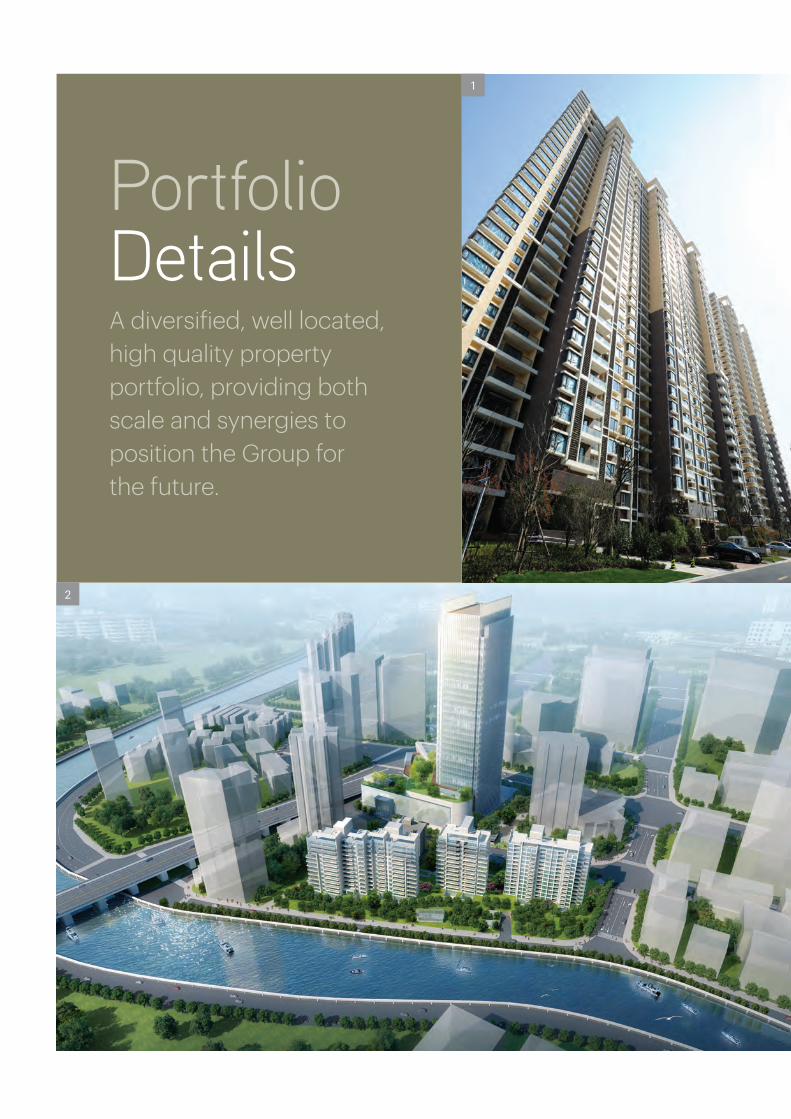
31
32
PortfolioDetails A diversified, well located, high quality property portfolio, providing both scale and synergies to position the Group for the future.
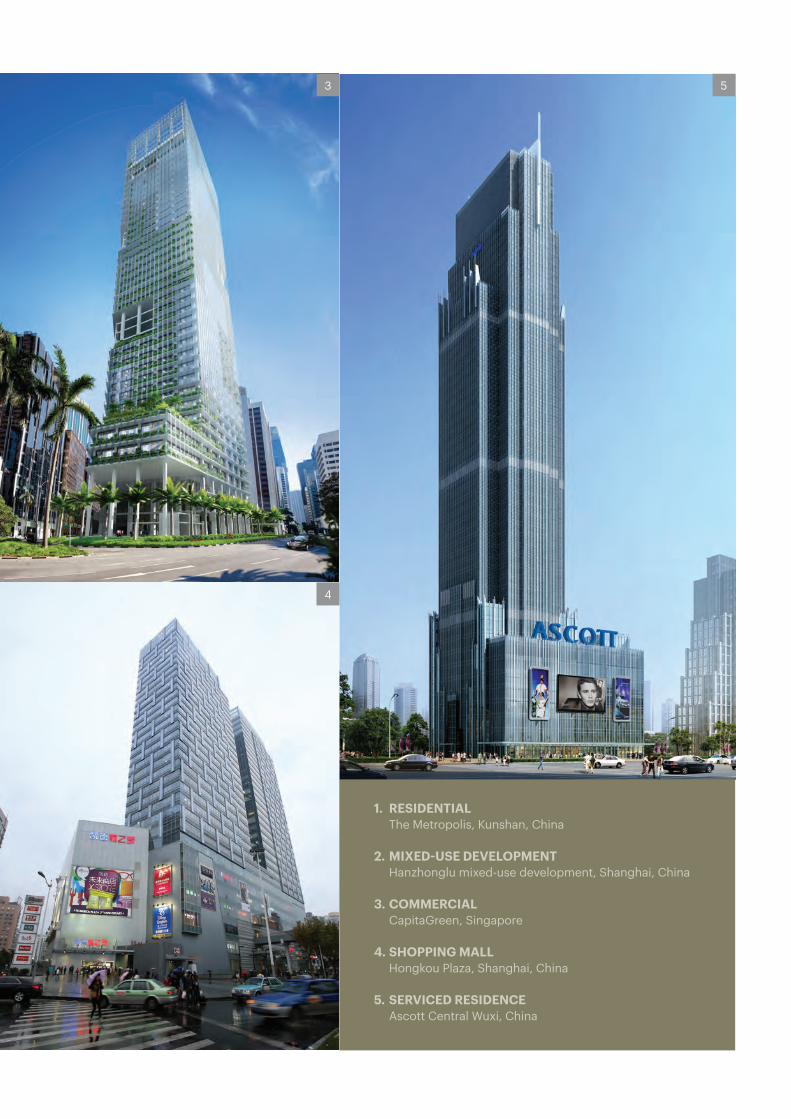
34
3 5
1. RESIDENTIAL The Metropolis, Kunshan, China
2. MIXED-USE DEVELOPMENT Hanzhonglu mixed-use development, Shanghai, China
3. COMMERCIAL CapitaGreen, Singapore
4. SHOPPING MALL Hongkou Plaza, Shanghai, China
5. SERVICED RESIDENCE Ascott Central Wuxi, China
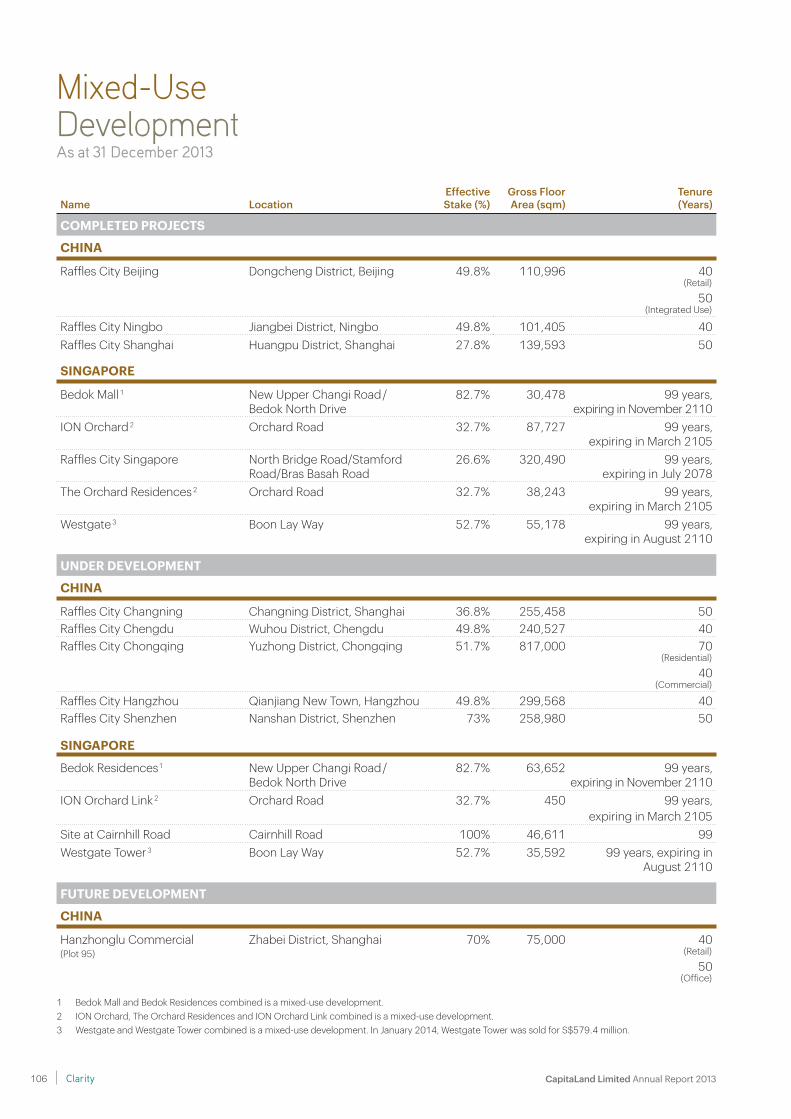
Mixed-UseDevelopmentAs at 31 December 2013
Name LocationEffective Stake (%)
Gross FloorArea (sqm)
Tenure(Years)
COMPLETED PROJECTS
CHINA
Raffles City Beijing Dongcheng District, Beijing 49.8% 110,996 40(Retail)
50(Integrated Use)
Raffles City Ningbo Jiangbei District, Ningbo 49.8% 101,405 40Raffles City Shanghai Huangpu District, Shanghai 27.8% 139,593 50
SINGAPORE
Bedok Mall 1 New Upper Changi Road / Bedok North Drive
82.7% 30,478 99 years, expiring in November 2110
ION Orchard 2 Orchard Road 32.7% 87,727 99 years, expiring in March 2105
Raffles City Singapore North Bridge Road/Stamford Road/Bras Basah Road
26.6% 320,490 99 years, expiring in July 2078
The Orchard Residences 2 Orchard Road 32.7% 38,243 99 years, expiring in March 2105
Westgate 3 Boon Lay Way 52.7% 55,178 99 years, expiring in August 2110
UNDER DEVELOPMENT
CHINA
Raffles City Changning Changning District, Shanghai 36.8% 255,458 50Raffles City Chengdu Wuhou District, Chengdu 49.8% 240,527 40Raffles City Chongqing Yuzhong District, Chongqing 51.7% 817,000 70
(Residential)
40(Commercial)
Raffles City Hangzhou Qianjiang New Town, Hangzhou 49.8% 299,568 40Raffles City Shenzhen Nanshan District, Shenzhen 73% 258,980 50
SINGAPORE
Bedok Residences 1 New Upper Changi Road / Bedok North Drive
82.7% 63,652 99 years, expiring in November 2110
ION Orchard Link 2 Orchard Road 32.7% 450 99 years, expiring in March 2105
Site at Cairnhill Road Cairnhill Road 100% 46,611 99Westgate Tower 3 Boon Lay Way 52.7% 35,592 99 years, expiring in
August 2110
FUTURE DEVELOPMENT
CHINA
Hanzhonglu Commercial(Plot 95)
Zhabei District, Shanghai 70% 75,000 40(Retail)
50(Office)
1 Bedok Mall and Bedok Residences combined is a mixed-use development.2 ION Orchard, The Orchard Residences and ION Orchard Link combined is a mixed-use development.3 Westgate and Westgate Tower combined is a mixed-use development. In January 2014, Westgate Tower was sold for S$579.4 million.
CapitaLand Limited Annual Report 2013 106 Clarity
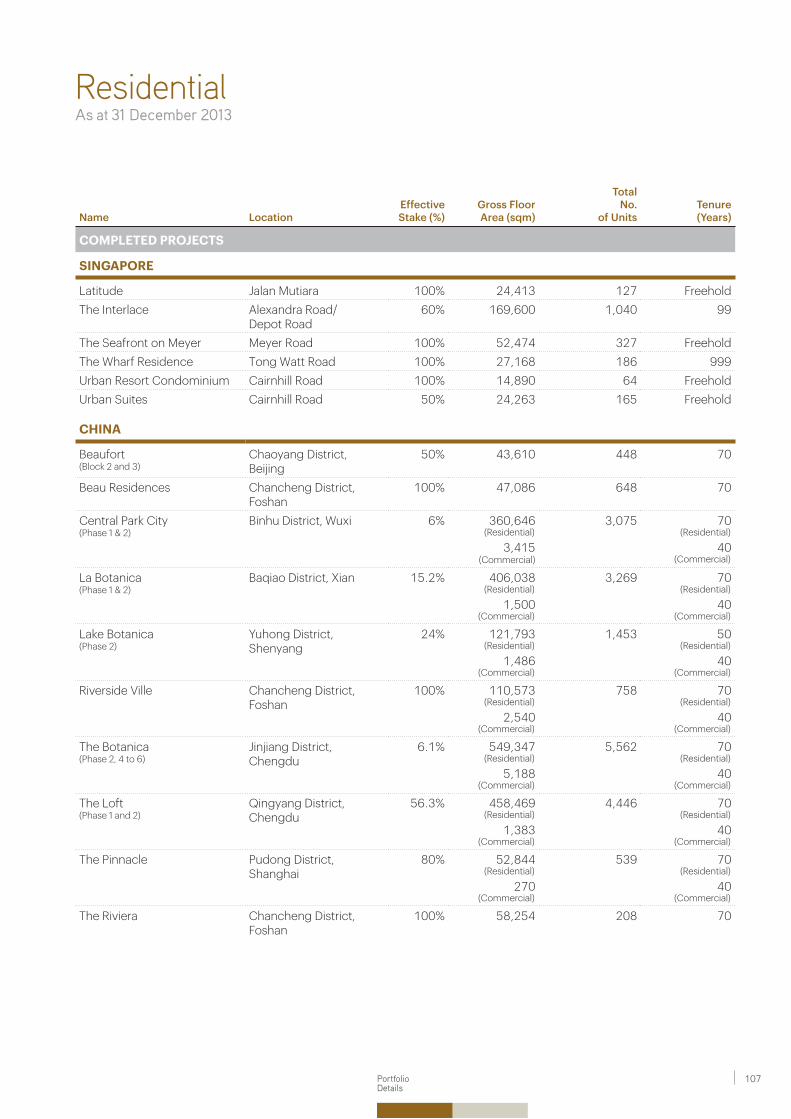
ResidentialAs at 31 December 2013
Name LocationEffective Stake (%)
Gross FloorArea (sqm)
Total No.
of UnitsTenure (Years)
COMPLETED PROJECTS
SINGAPORE
Latitude Jalan Mutiara 100% 24,413 127 FreeholdThe Interlace Alexandra Road/
Depot Road60% 169,600 1,040 99
The Seafront on Meyer Meyer Road 100% 52,474 327 FreeholdThe Wharf Residence Tong Watt Road 100% 27,168 186 999Urban Resort Condominium Cairnhill Road 100% 14,890 64 FreeholdUrban Suites Cairnhill Road 50% 24,263 165 Freehold
CHINA
Beaufort(Block 2 and 3)
Chaoyang District, Beijing
50% 43,610 448 70
Beau Residences Chancheng District, Foshan
100% 47,086 648 70
Central Park City(Phase 1 & 2)
Binhu District, Wuxi 6% 360,646 (Residential)
3,415(Commercial)
3,075 70 (Residential)
40 (Commercial)
La Botanica (Phase 1 & 2)
Baqiao District, Xian 15.2% 406,038 (Residential)
1,500 (Commercial)
3,269 70 (Residential)
40 (Commercial)
Lake Botanica(Phase 2)
Yuhong District, Shenyang
24% 121,793(Residential)
1,486 (Commercial)
1,453 50(Residential)
40(Commercial)
Riverside Ville Chancheng District, Foshan
100% 110,573 (Residential)
2,540(Commercial)
758 70 (Residential)
40 (Commercial)
The Botanica(Phase 2, 4 to 6)
Jinjiang District, Chengdu
6.1% 549,347(Residential)
5,188 (Commercial)
5,562 70 (Residential)
40 (Commercial)
The Loft (Phase 1 and 2)
Qingyang District, Chengdu
56.3% 458,469 (Residential)
1,383 (Commercial)
4,446 70 (Residential)
40 (Commercial)
The Pinnacle Pudong District, Shanghai
80% 52,844 (Residential)
270 (Commercial)
539 70 (Residential)
40 (Commercial)
The Riviera Chancheng District, Foshan
100% 58,254 208 70
107PortfolioDetails
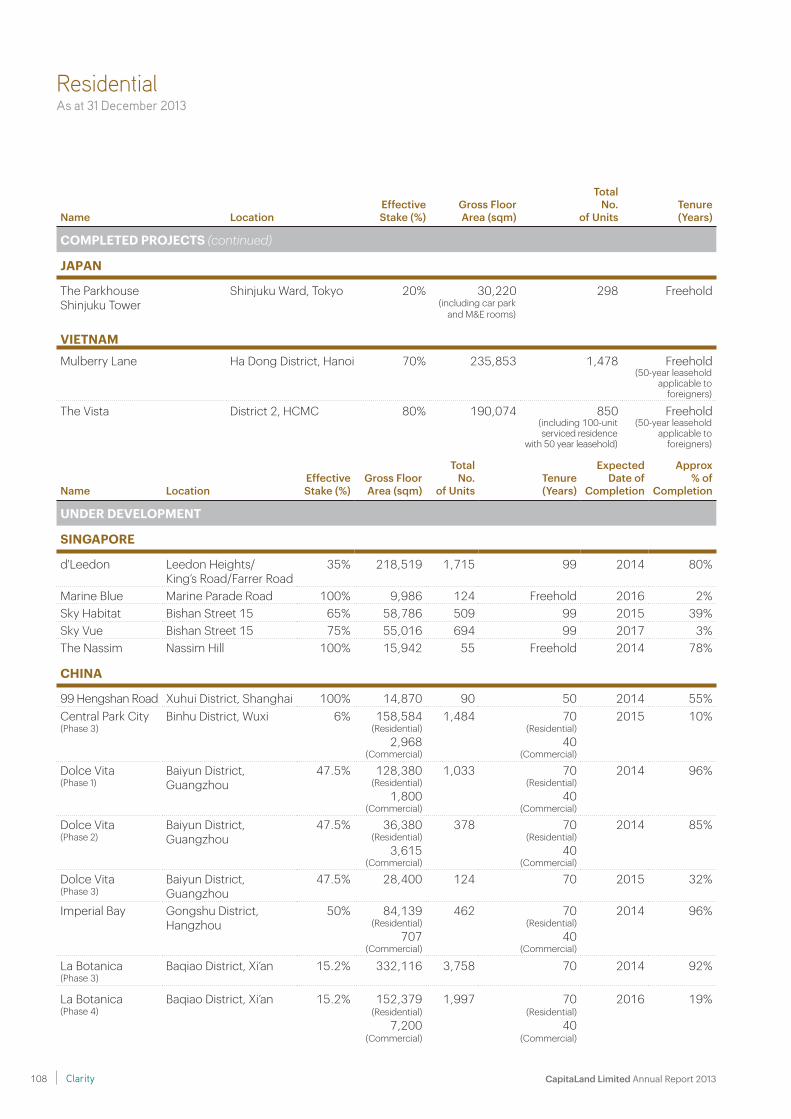
ResidentialAs at 31 December 2013
Name LocationEffective Stake (%)
Gross FloorArea (sqm)
Total No.
of UnitsTenure (Years)
COMPLETED PROJECTS (continued)
JAPAN
The Parkhouse Shinjuku Tower
Shinjuku Ward, Tokyo 20% 30,220 (including car park
and M&E rooms)
298 Freehold
VIETNAM
Mulberry Lane Ha Dong District, Hanoi 70% 235,853 1,478 Freehold(50-year leasehold
applicable to foreigners)
The Vista District 2, HCMC 80% 190,074 850(including 100-unit serviced residence
with 50 year leasehold)
Freehold(50-year leasehold
applicable to foreigners)
Name LocationEffectiveStake (%)
Gross Floor Area (sqm)
Total No.
of UnitsTenure(Years)
Expected Date of
Completion
Approx % of
Completion
UNDER DEVELOPMENT
SINGAPORE
d'Leedon Leedon Heights/King’s Road/Farrer Road
35% 218,519 1,715 99 2014 80%
Marine Blue Marine Parade Road 100% 9,986 124 Freehold 2016 2%Sky Habitat Bishan Street 15 65% 58,786 509 99 2015 39%Sky Vue Bishan Street 15 75% 55,016 694 99 2017 3%The Nassim Nassim Hill 100% 15,942 55 Freehold 2014 78%
CHINA
99 Hengshan Road Xuhui District, Shanghai 100% 14,870 90 50 2014 55%Central Park City(Phase 3)
Binhu District, Wuxi 6% 158,584(Residential)
2,968(Commercial)
1,484 70(Residential)
40(Commercial)
2015 10%
Dolce Vita (Phase 1)
Baiyun District, Guangzhou
47.5% 128,380(Residential)
1,800(Commercial)
1,033 70(Residential)
40(Commercial)
2014 96%
Dolce Vita(Phase 2)
Baiyun District, Guangzhou
47.5% 36,380(Residential)
3,615(Commercial)
378 70(Residential)
40(Commercial)
2014 85%
Dolce Vita (Phase 3)
Baiyun District, Guangzhou
47.5% 28,400 124 70 2015 32%
Imperial Bay Gongshu District, Hangzhou
50% 84,139 (Residential)
707 (Commercial)
462 70 (Residential)
40(Commercial)
2014 96%
La Botanica (Phase 3)
Baqiao District, Xi’an 15.2% 332,116 3,758 70 2014 92%
La Botanica (Phase 4)
Baqiao District, Xi’an 15.2% 152,379(Residential)
7,200(Commercial)
1,997 70(Residential)
40(Commercial)
2016 19%
CapitaLand Limited Annual Report 2013 108 Clarity
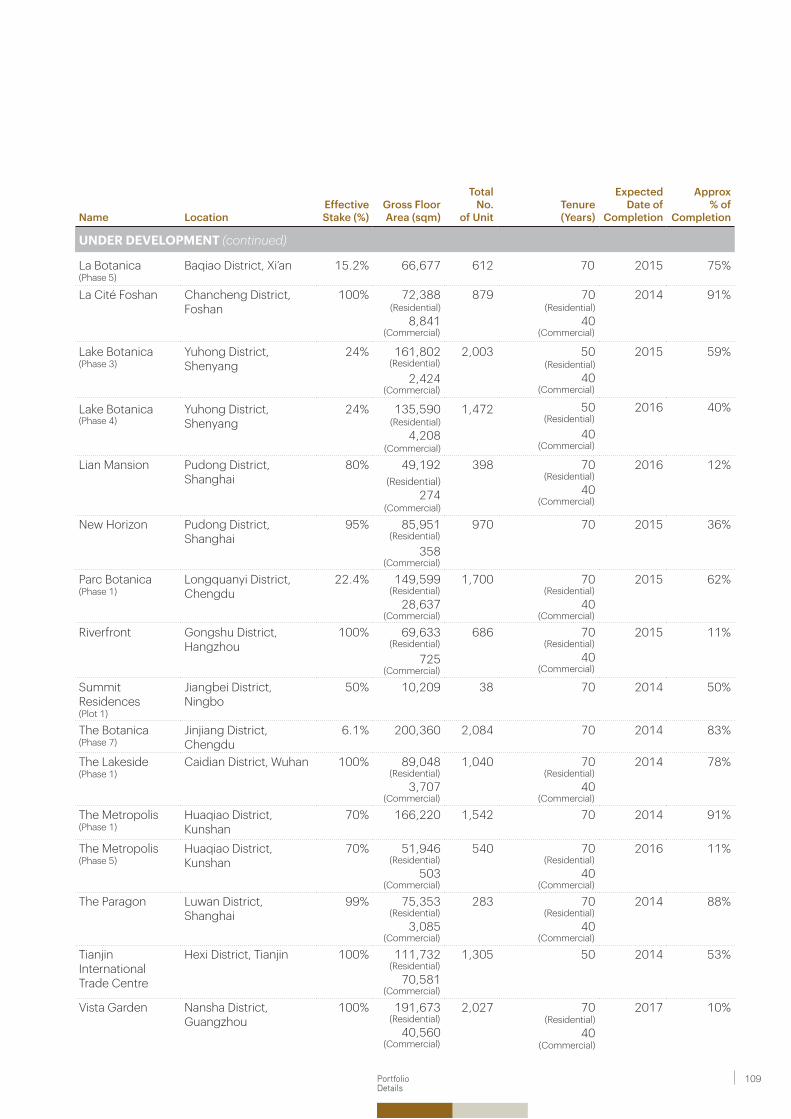
Name LocationEffectiveStake (%)
Gross Floor Area (sqm)
Total No.
of UnitTenure(Years)
Expected Date of
Completion
Approx % of
Completion
UNDER DEVELOPMENT (continued)
La Botanica (Phase 5)
Baqiao District, Xi’an 15.2% 66,677 612 70 2015 75%
La Cité Foshan Chancheng District, Foshan
100% 72,388(Residential)
8,841(Commercial)
879 70(Residential)
40(Commercial)
2014 91%
Lake Botanica(Phase 3)
Yuhong District, Shenyang
24% 161,802(Residential)
2,424(Commercial)
2,003 50(Residential)
40(Commercial)
2015 59%
Lake Botanica(Phase 4)
Yuhong District,Shenyang
24% 135,590(Residential)
4,208(Commercial)
1,472 50(Residential)
40(Commercial)
2016 40%
Lian Mansion Pudong District, Shanghai
80% 49,192(Residential)
274(Commercial)
398 70(Residential)
40(Commercial)
2016 12%
New Horizon Pudong District, Shanghai
95% 85,951(Residential)
358(Commercial)
970 70 2015 36%
Parc Botanica(Phase 1)
Longquanyi District, Chengdu
22.4% 149,599(Residential)
28,637(Commercial)
1,700 70(Residential)
40(Commercial)
2015 62%
Riverfront Gongshu District, Hangzhou
100% 69,633(Residential)
725(Commercial)
686 70(Residential)
40(Commercial)
2015 11%
Summit Residences (Plot 1)
Jiangbei District, Ningbo
50% 10,209 38 70 2014 50%
The Botanica(Phase 7)
Jinjiang District, Chengdu
6.1% 200,360 2,084 70 2014 83%
The Lakeside(Phase 1)
Caidian District, Wuhan 100% 89,048(Residential)
3,707(Commercial)
1,040 70(Residential)
40(Commercial)
2014 78%
The Metropolis(Phase 1)
Huaqiao District, Kunshan
70% 166,220 1,542 70 2014 91%
The Metropolis(Phase 5)
Huaqiao District, Kunshan
70% 51,946(Residential)
503(Commercial)
540 70(Residential)
40(Commercial)
2016 11%
The Paragon Luwan District, Shanghai
99% 75,353(Residential)
3,085(Commercial)
283 70(Residential)
40(Commercial)
2014 88%
Tianjin International Trade Centre
Hexi District, Tianjin 100% 111,732(Residential)
70,581(Commercial)
1,305 50 2014 53%
Vista Garden Nansha District, Guangzhou
100% 191,673(Residential)
40,560(Commercial)
2,027 70(Residential)
40(Commercial)
2017 10%
109PortfolioDetails
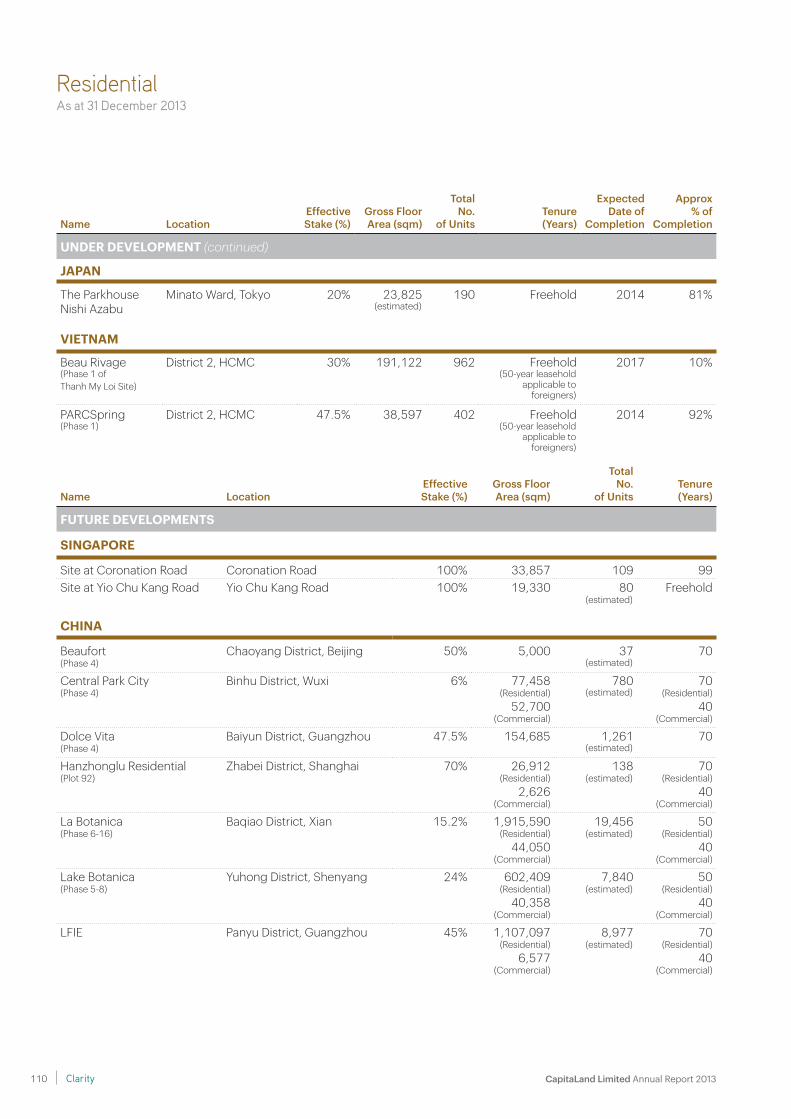
ResidentialAs at 31 December 2013
Name LocationEffectiveStake (%)
Gross Floor Area (sqm)
Total No.
of UnitsTenure(Years)
Expected Date of
Completion
Approx % of
Completion
UNDER DEVELOPMENT (continued)
JAPAN
The Parkhouse Nishi Azabu
Minato Ward, Tokyo 20% 23,825 (estimated)
190 Freehold 2014 81%
VIETNAM
Beau Rivage(Phase 1 of Thanh My Loi Site)
District 2, HCMC 30% 191,122 962 Freehold(50-year leasehold
applicable to foreigners)
2017 10%
PARCSpring(Phase 1)
District 2, HCMC 47.5% 38,597 402 Freehold(50-year leasehold
applicable to foreigners)
2014 92%
Name LocationEffective Stake (%)
Gross FloorArea (sqm)
Total No.
of UnitsTenure(Years)
FUTURE DEVELOPMENTS
SINGAPORE
Site at Coronation Road Coronation Road 100% 33,857 109 99Site at Yio Chu Kang Road Yio Chu Kang Road 100% 19,330 80
(estimated)Freehold
CHINA
Beaufort (Phase 4)
Chaoyang District, Beijing 50% 5,000 37(estimated)
70
Central Park City(Phase 4)
Binhu District, Wuxi 6% 77,458(Residential)
52,700(Commercial)
780(estimated)
70(Residential)
40(Commercial)
Dolce Vita (Phase 4)
Baiyun District, Guangzhou 47.5% 154,685 1,261(estimated)
70
Hanzhonglu Residential (Plot 92)
Zhabei District, Shanghai 70% 26,912(Residential)
2,626(Commercial)
138(estimated)
70(Residential)
40(Commercial)
La Botanica(Phase 6-16)
Baqiao District, Xian 15.2% 1,915,590(Residential)
44,050(Commercial)
19,456(estimated)
50(Residential)
40(Commercial)
Lake Botanica(Phase 5-8)
Yuhong District, Shenyang 24% 602,409(Residential)
40,358(Commercial)
7,840(estimated)
50(Residential)
40(Commercial)
LFIE Panyu District, Guangzhou 45% 1,107,097(Residential)
6,577(Commercial)
8,977(estimated)
70(Residential)
40(Commercial)
CapitaLand Limited Annual Report 2013 110 Clarity
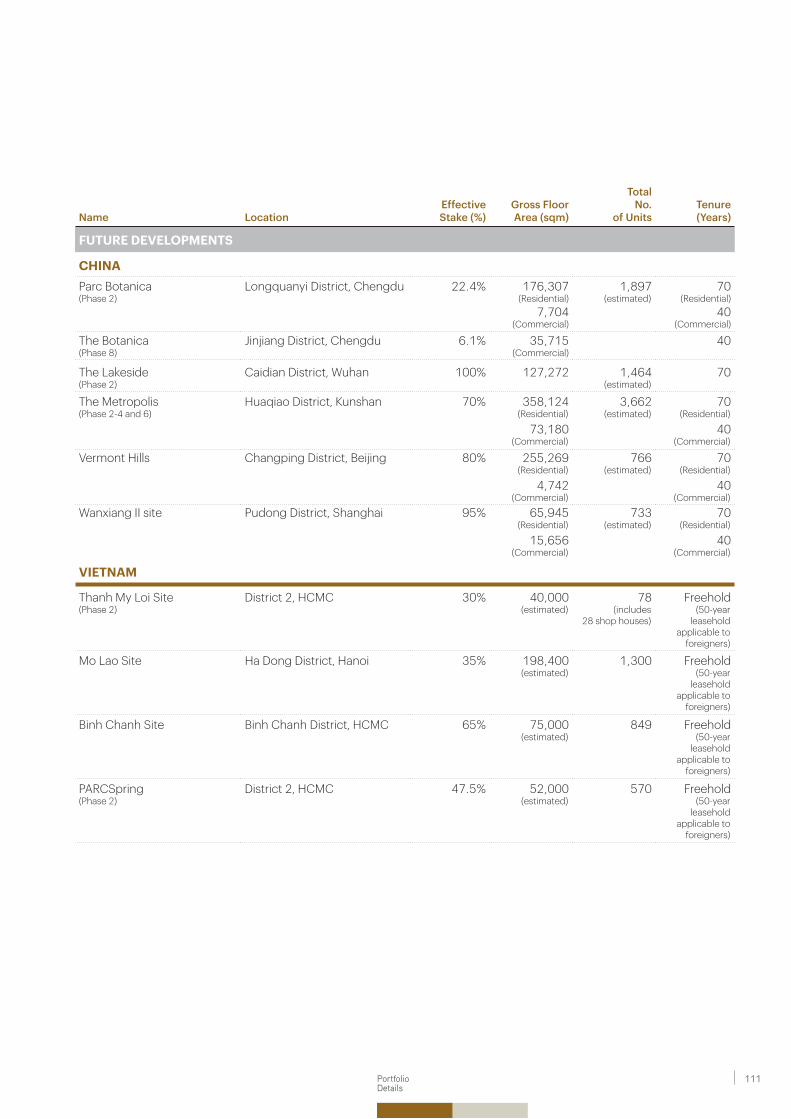
Name LocationEffective Stake (%)
Gross FloorArea (sqm)
Total No.
of UnitsTenure(Years)
FUTURE DEVELOPMENTS
CHINAParc Botanica(Phase 2)
Longquanyi District, Chengdu 22.4% 176,307(Residential)
7,704(Commercial)
1,897(estimated)
70(Residential)
40(Commercial)
The Botanica(Phase 8)
Jinjiang District, Chengdu 6.1% 35,715(Commercial)
40
The Lakeside(Phase 2)
Caidian District, Wuhan 100% 127,272 1,464 (estimated)
70
The Metropolis(Phase 2-4 and 6)
Huaqiao District, Kunshan 70% 358,124(Residential)
73,180(Commercial)
3,662(estimated)
70(Residential)
40(Commercial)
Vermont Hills Changping District, Beijing 80% 255,269(Residential)
4,742(Commercial)
766(estimated)
70(Residential)
40(Commercial)
Wanxiang II site Pudong District, Shanghai 95% 65,945(Residential)
15,656(Commercial)
733(estimated)
70(Residential)
40(Commercial)
VIETNAM
Thanh My Loi Site (Phase 2)
District 2, HCMC 30% 40,000 (estimated)
78 (includes
28 shop houses)
Freehold(50-year
leasehold applicable to
foreigners)
Mo Lao Site Ha Dong District, Hanoi 35% 198,400(estimated)
1,300 Freehold(50-year
leasehold applicable to
foreigners)
Binh Chanh Site Binh Chanh District, HCMC 65% 75,000(estimated)
849 Freehold(50-year
leasehold applicable to
foreigners)
PARCSpring(Phase 2)
District 2, HCMC 47.5% 52,000(estimated)
570 Freehold(50-year
leasehold applicable to
foreigners)
111PortfolioDetails
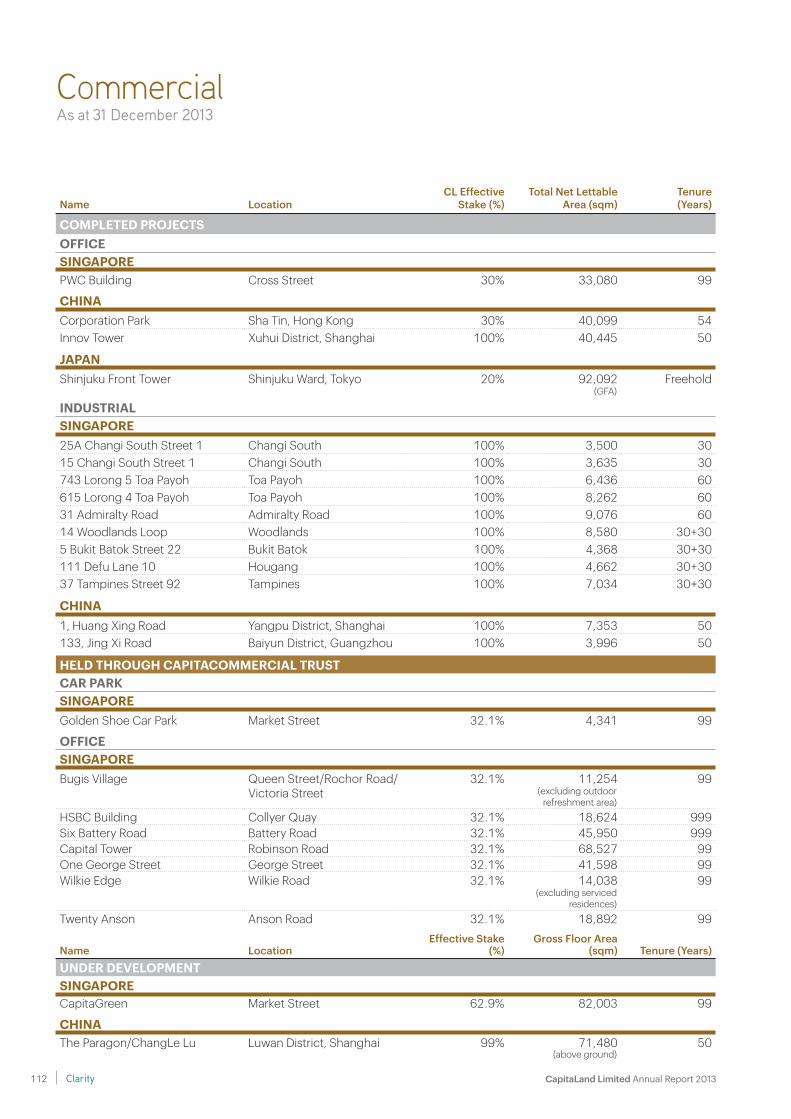
CommercialAs at 31 December 2013
Name LocationCL Effective
Stake (%)Total Net Lettable
Area (sqm)Tenure(Years)
COMPLETED PROJECTSOFFICESINGAPOREPWC Building Cross Street 30% 33,080 99
CHINACorporation Park Sha Tin, Hong Kong 30% 40,099 54Innov Tower Xuhui District, Shanghai 100% 40,445 50
JAPANShinjuku Front Tower Shinjuku Ward, Tokyo 20% 92,092
(GFA) Freehold
INDUSTRIALSINGAPORE25A Changi South Street 1 Changi South 100% 3,500 3015 Changi South Street 1 Changi South 100% 3,635 30743 Lorong 5 Toa Payoh Toa Payoh 100% 6,436 60615 Lorong 4 Toa Payoh Toa Payoh 100% 8,262 6031 Admiralty Road Admiralty Road 100% 9,076 6014 Woodlands Loop Woodlands 100% 8,580 30+305 Bukit Batok Street 22 Bukit Batok 100% 4,368 30+30111 Defu Lane 10 Hougang 100% 4,662 30+3037 Tampines Street 92 Tampines 100% 7,034 30+30
CHINA1, Huang Xing Road Yangpu District, Shanghai 100% 7,353 50133, Jing Xi Road Baiyun District, Guangzhou 100% 3,996 50
HELD THROUGH CAPITACOMMERCIAL TRUSTCAR PARKSINGAPOREGolden Shoe Car Park Market Street 32.1% 4,341 99
OFFICESINGAPOREBugis Village Queen Street/Rochor Road/
Victoria Street32.1% 11,254
(excluding outdoor refreshment area)
99
HSBC Building Collyer Quay 32.1% 18,624 999Six Battery Road Battery Road 32.1% 45,950 999Capital Tower Robinson Road 32.1% 68,527 99One George Street George Street 32.1% 41,598 99Wilkie Edge Wilkie Road 32.1% 14,038
(excluding serviced residences)
99
Twenty Anson Anson Road 32.1% 18,892 99
Name LocationEffective Stake
(%) Gross Floor Area
(sqm) Tenure (Years)UNDER DEVELOPMENTSINGAPORECapitaGreen Market Street 62.9% 82,003 99
CHINAThe Paragon/ChangLe Lu Luwan District, Shanghai 99% 71,480
(above ground)50
CapitaLand Limited Annual Report 2013 112 Clarity
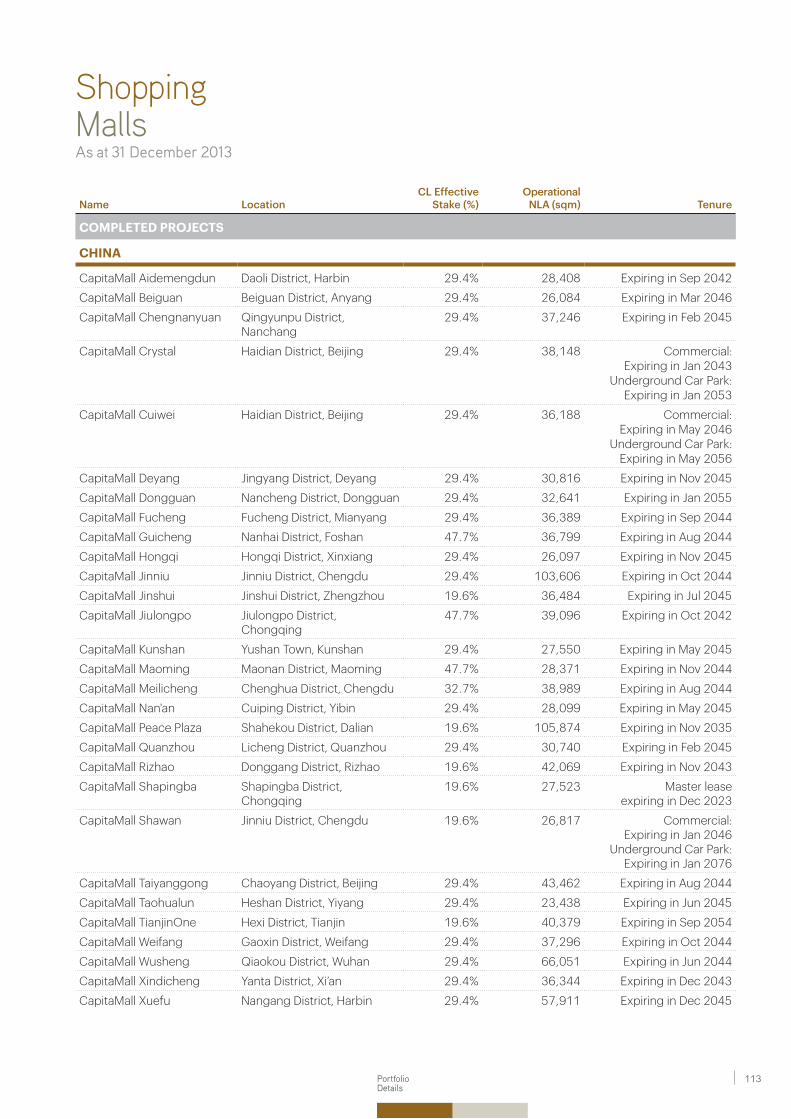
ShoppingMallsAs at 31 December 2013
Name LocationCL Effective
Stake (%)Operational
NLA (sqm) Tenure
COMPLETED PROJECTS
CHINA
CapitaMall Aidemengdun Daoli District, Harbin 29.4% 28,408 Expiring in Sep 2042
CapitaMall Beiguan Beiguan District, Anyang 29.4% 26,084 Expiring in Mar 2046
CapitaMall Chengnanyuan Qingyunpu District, Nanchang
29.4% 37,246 Expiring in Feb 2045
CapitaMall Crystal Haidian District, Beijing 29.4% 38,148 Commercial: Expiring in Jan 2043
Underground Car Park:Expiring in Jan 2053
CapitaMall Cuiwei Haidian District, Beijing 29.4% 36,188 Commercial:Expiring in May 2046
Underground Car Park:Expiring in May 2056
CapitaMall Deyang Jingyang District, Deyang 29.4% 30,816 Expiring in Nov 2045
CapitaMall Dongguan Nancheng District, Dongguan 29.4% 32,641 Expiring in Jan 2055
CapitaMall Fucheng Fucheng District, Mianyang 29.4% 36,389 Expiring in Sep 2044
CapitaMall Guicheng Nanhai District, Foshan 47.7% 36,799 Expiring in Aug 2044
CapitaMall Hongqi Hongqi District, Xinxiang 29.4% 26,097 Expiring in Nov 2045
CapitaMall Jinniu Jinniu District, Chengdu 29.4% 103,606 Expiring in Oct 2044
CapitaMall Jinshui Jinshui District, Zhengzhou 19.6% 36,484 Expiring in Jul 2045
CapitaMall Jiulongpo Jiulongpo District, Chongqing
47.7% 39,096 Expiring in Oct 2042
CapitaMall Kunshan Yushan Town, Kunshan 29.4% 27,550 Expiring in May 2045
CapitaMall Maoming Maonan District, Maoming 47.7% 28,371 Expiring in Nov 2044
CapitaMall Meilicheng Chenghua District, Chengdu 32.7% 38,989 Expiring in Aug 2044
CapitaMall Nan'an Cuiping District, Yibin 29.4% 28,099 Expiring in May 2045
CapitaMall Peace Plaza Shahekou District, Dalian 19.6% 105,874 Expiring in Nov 2035
CapitaMall Quanzhou Licheng District, Quanzhou 29.4% 30,740 Expiring in Feb 2045
CapitaMall Rizhao Donggang District, Rizhao 19.6% 42,069 Expiring in Nov 2043
CapitaMall Shapingba Shapingba District, Chongqing
19.6% 27,523 Master lease expiring in Dec 2023
CapitaMall Shawan Jinniu District, Chengdu 19.6% 26,817 Commercial:Expiring in Jan 2046
Underground Car Park:Expiring in Jan 2076
CapitaMall Taiyanggong Chaoyang District, Beijing 29.4% 43,462 Expiring in Aug 2044
CapitaMall Taohualun Heshan District, Yiyang 29.4% 23,438 Expiring in Jun 2045
CapitaMall TianjinOne Hexi District, Tianjin 19.6% 40,379 Expiring in Sep 2054
CapitaMall Weifang Gaoxin District, Weifang 29.4% 37,296 Expiring in Oct 2044
CapitaMall Wusheng Qiaokou District, Wuhan 29.4% 66,051 Expiring in Jun 2044
CapitaMall Xindicheng Yanta District, Xi’an 29.4% 36,344 Expiring in Dec 2043
CapitaMall Xuefu Nangang District, Harbin 29.4% 57,911 Expiring in Dec 2045
113PortfolioDetails
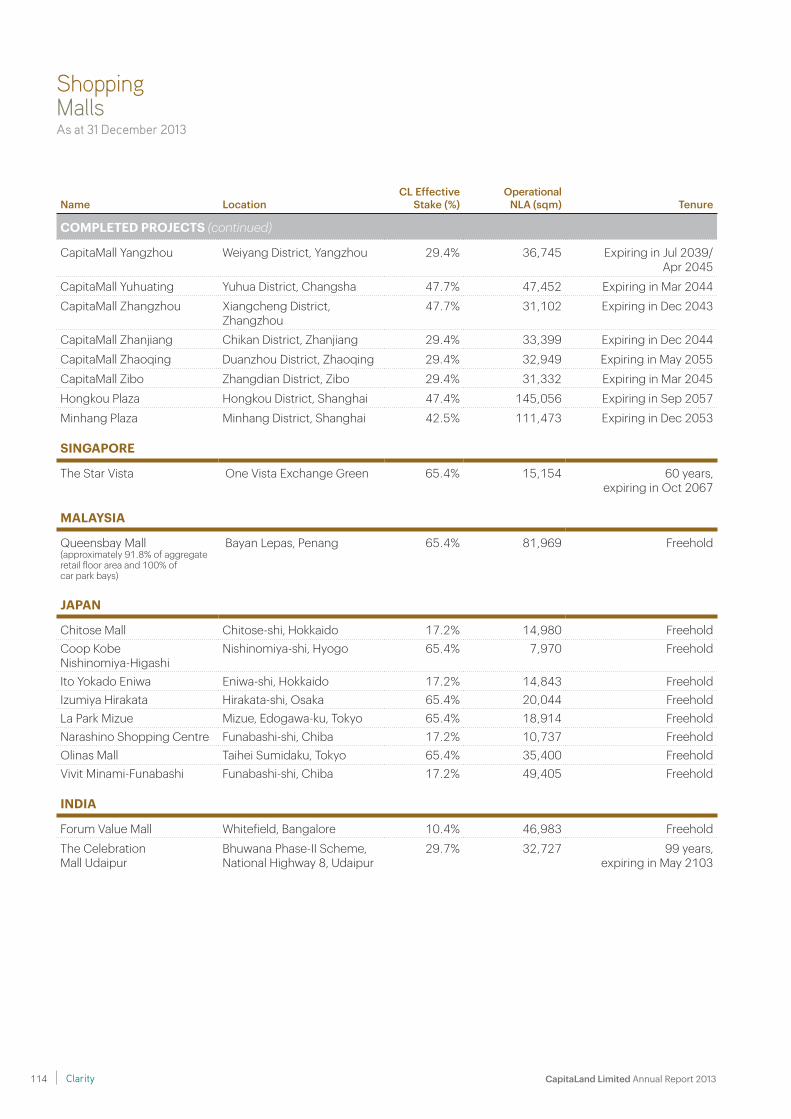
ShoppingMallsAs at 31 December 2013
Name LocationCL Effective
Stake (%)Operational
NLA (sqm) Tenure
COMPLETED PROJECTS (continued)
CapitaMall Yangzhou Weiyang District, Yangzhou 29.4% 36,745 Expiring in Jul 2039/Apr 2045
CapitaMall Yuhuating Yuhua District, Changsha 47.7% 47,452 Expiring in Mar 2044
CapitaMall Zhangzhou Xiangcheng District, Zhangzhou
47.7% 31,102 Expiring in Dec 2043
CapitaMall Zhanjiang Chikan District, Zhanjiang 29.4% 33,399 Expiring in Dec 2044
CapitaMall Zhaoqing Duanzhou District, Zhaoqing 29.4% 32,949 Expiring in May 2055
CapitaMall Zibo Zhangdian District, Zibo 29.4% 31,332 Expiring in Mar 2045
Hongkou Plaza Hongkou District, Shanghai 47.4% 145,056 Expiring in Sep 2057
Minhang Plaza Minhang District, Shanghai 42.5% 111,473 Expiring in Dec 2053
SINGAPORE
The Star Vista One Vista Exchange Green 65.4% 15,154 60 years, expiring in Oct 2067
MALAYSIA
Queensbay Mall(approximately 91.8% of aggregate retail floor area and 100% of car park bays)
Bayan Lepas, Penang 65.4% 81,969 Freehold
JAPAN
Chitose Mall Chitose-shi, Hokkaido 17.2% 14,980 FreeholdCoop Kobe Nishinomiya-Higashi
Nishinomiya-shi, Hyogo 65.4% 7,970 Freehold
Ito Yokado Eniwa Eniwa-shi, Hokkaido 17.2% 14,843 FreeholdIzumiya Hirakata Hirakata-shi, Osaka 65.4% 20,044 FreeholdLa Park Mizue Mizue, Edogawa-ku, Tokyo 65.4% 18,914 FreeholdNarashino Shopping Centre Funabashi-shi, Chiba 17.2% 10,737 FreeholdOlinas Mall Taihei Sumidaku, Tokyo 65.4% 35,400 FreeholdVivit Minami-Funabashi Funabashi-shi, Chiba 17.2% 49,405 Freehold
INDIA
Forum Value Mall Whitefield, Bangalore 10.4% 46,983 Freehold
The Celebration Mall Udaipur
Bhuwana Phase-II Scheme, National Highway 8, Udaipur
29.7% 32,727 99 years, expiring in May 2103
CapitaLand Limited Annual Report 2013 114 Clarity
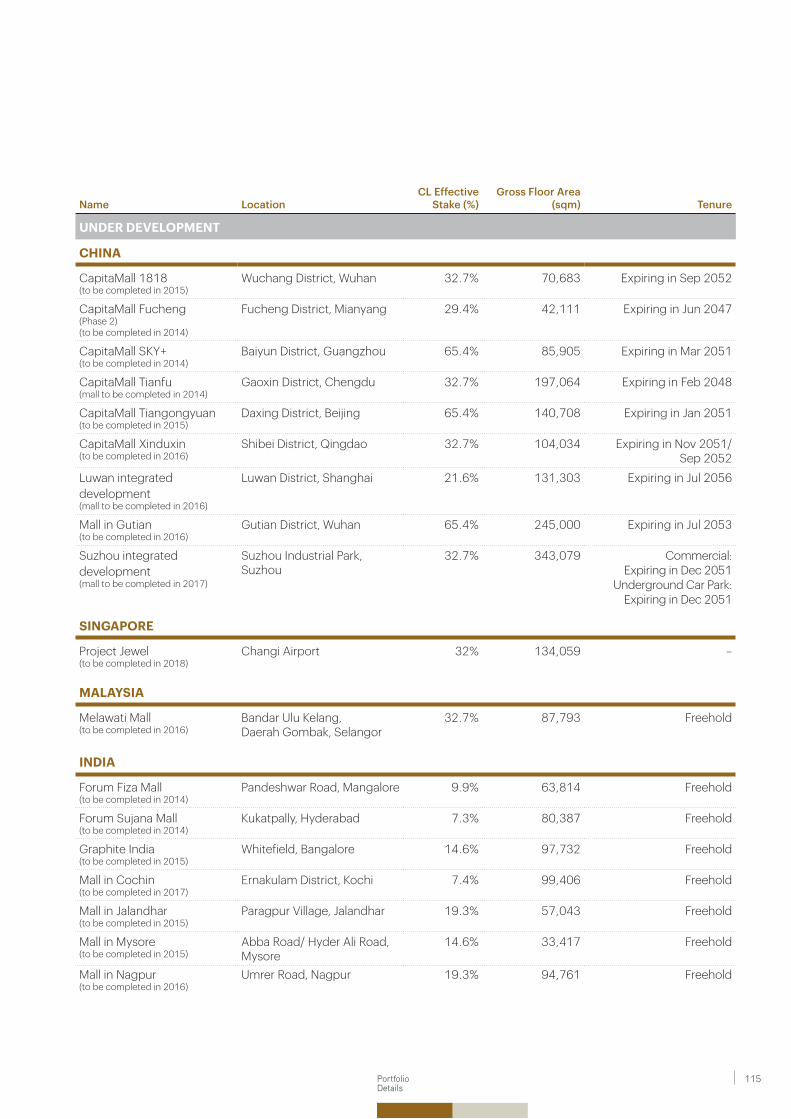
Name LocationCL Effective
Stake (%)Gross Floor Area
(sqm) Tenure
UNDER DEVELOPMENT
CHINA
CapitaMall 1818(to be completed in 2015)
Wuchang District, Wuhan 32.7% 70,683 Expiring in Sep 2052
CapitaMall Fucheng (Phase 2)(to be completed in 2014)
Fucheng District, Mianyang 29.4% 42,111 Expiring in Jun 2047
CapitaMall SKY+ (to be completed in 2014)
Baiyun District, Guangzhou 65.4% 85,905 Expiring in Mar 2051
CapitaMall Tianfu(mall to be completed in 2014)
Gaoxin District, Chengdu 32.7% 197,064 Expiring in Feb 2048
CapitaMall Tiangongyuan(to be completed in 2015)
Daxing District, Beijing 65.4% 140,708 Expiring in Jan 2051
CapitaMall Xinduxin(to be completed in 2016)
Shibei District, Qingdao 32.7% 104,034 Expiring in Nov 2051/Sep 2052
Luwan integrated development(mall to be completed in 2016)
Luwan District, Shanghai 21.6% 131,303 Expiring in Jul 2056
Mall in Gutian(to be completed in 2016)
Gutian District, Wuhan 65.4% 245,000 Expiring in Jul 2053
Suzhou integrated development(mall to be completed in 2017)
Suzhou Industrial Park, Suzhou
32.7% 343,079 Commercial: Expiring in Dec 2051
Underground Car Park: Expiring in Dec 2051
SINGAPORE
Project Jewel(to be completed in 2018)
Changi Airport 32% 134,059 –
MALAYSIA
Melawati Mall(to be completed in 2016)
Bandar Ulu Kelang, Daerah Gombak, Selangor
32.7% 87,793 Freehold
INDIA
Forum Fiza Mall(to be completed in 2014)
Pandeshwar Road, Mangalore 9.9% 63,814 Freehold
Forum Sujana Mall(to be completed in 2014)
Kukatpally, Hyderabad 7.3% 80,387 Freehold
Graphite India(to be completed in 2015)
Whitefield, Bangalore 14.6% 97,732 Freehold
Mall in Cochin(to be completed in 2017)
Ernakulam District, Kochi 7.4% 99,406 Freehold
Mall in Jalandhar (to be completed in 2015)
Paragpur Village, Jalandhar 19.3% 57,043 Freehold
Mall in Mysore (to be completed in 2015)
Abba Road/ Hyder Ali Road,Mysore
14.6% 33,417 Freehold
Mall in Nagpur (to be completed in 2016)
Umrer Road, Nagpur 19.3% 94,761 Freehold
115PortfolioDetails
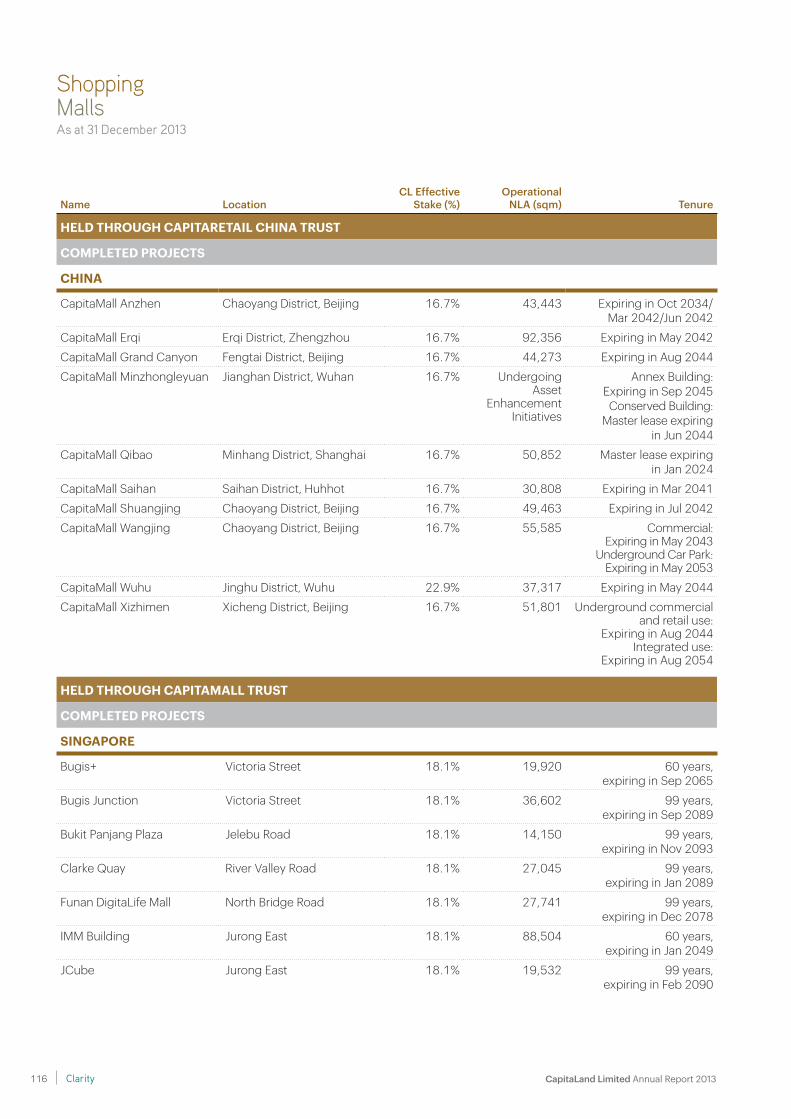
Name LocationCL Effective
Stake (%)Operational
NLA (sqm) Tenure
HELD THROUGH CAPITARETAIL CHINA TRUST
COMPLETED PROJECTS
CHINA
CapitaMall Anzhen Chaoyang District, Beijing 16.7% 43,443 Expiring in Oct 2034/Mar 2042/Jun 2042
CapitaMall Erqi Erqi District, Zhengzhou 16.7% 92,356 Expiring in May 2042
CapitaMall Grand Canyon Fengtai District, Beijing 16.7% 44,273 Expiring in Aug 2044
CapitaMall Minzhongleyuan Jianghan District, Wuhan 16.7% Undergoing Asset
Enhancement Initiatives
Annex Building: Expiring in Sep 2045 Conserved Building:
Master lease expiringin Jun 2044
CapitaMall Qibao Minhang District, Shanghai 16.7% 50,852 Master lease expiring in Jan 2024
CapitaMall Saihan Saihan District, Huhhot 16.7% 30,808 Expiring in Mar 2041
CapitaMall Shuangjing Chaoyang District, Beijing 16.7% 49,463 Expiring in Jul 2042
CapitaMall Wangjing Chaoyang District, Beijing 16.7% 55,585 Commercial: Expiring in May 2043
Underground Car Park: Expiring in May 2053
CapitaMall Wuhu Jinghu District, Wuhu 22.9% 37,317 Expiring in May 2044
CapitaMall Xizhimen Xicheng District, Beijing 16.7% 51,801 Underground commercial and retail use:
Expiring in Aug 2044 Integrated use:
Expiring in Aug 2054
HELD THROUGH CAPITAMALL TRUST
COMPLETED PROJECTS
SINGAPORE
Bugis+ Victoria Street 18.1% 19,920 60 years,expiring in Sep 2065
Bugis Junction Victoria Street 18.1% 36,602 99 years,expiring in Sep 2089
Bukit Panjang Plaza Jelebu Road 18.1% 14,150 99 years,expiring in Nov 2093
Clarke Quay River Valley Road 18.1% 27,045 99 years,expiring in Jan 2089
Funan DigitaLife Mall North Bridge Road 18.1% 27,741 99 years,expiring in Dec 2078
IMM Building Jurong East 18.1% 88,504 60 years,expiring in Jan 2049
JCube Jurong East 18.1% 19,532 99 years,expiring in Feb 2090
ShoppingMallsAs at 31 December 2013
CapitaLand Limited Annual Report 2013 116 Clarity
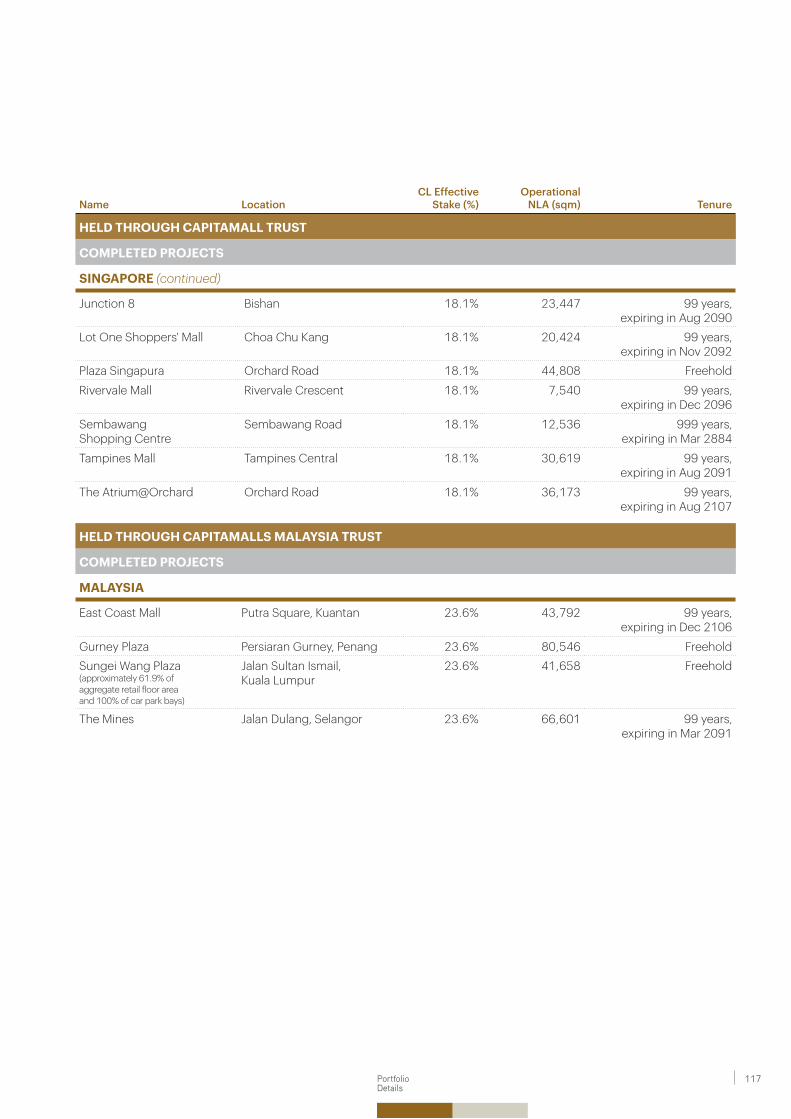
Name LocationCL Effective
Stake (%)Operational
NLA (sqm) Tenure
HELD THROUGH CAPITAMALL TRUST
COMPLETED PROJECTS
SINGAPORE (continued)
Junction 8 Bishan 18.1% 23,447 99 years,expiring in Aug 2090
Lot One Shoppers' Mall Choa Chu Kang 18.1% 20,424 99 years,expiring in Nov 2092
Plaza Singapura Orchard Road 18.1% 44,808 Freehold
Rivervale Mall Rivervale Crescent 18.1% 7,540 99 years,expiring in Dec 2096
Sembawang Shopping Centre
Sembawang Road 18.1% 12,536 999 years,expiring in Mar 2884
Tampines Mall Tampines Central 18.1% 30,619 99 years,expiring in Aug 2091
The Atrium@Orchard Orchard Road 18.1% 36,173 99 years,expiring in Aug 2107
HELD THROUGH CAPITAMALLS MALAYSIA TRUST
COMPLETED PROJECTS
MALAYSIA
East Coast Mall Putra Square, Kuantan 23.6% 43,792 99 years,expiring in Dec 2106
Gurney Plaza Persiaran Gurney, Penang 23.6% 80,546 FreeholdSungei Wang Plaza (approximately 61.9% of aggregate retail floor area and 100% of car park bays)
Jalan Sultan Ismail, Kuala Lumpur
23.6% 41,658 Freehold
The Mines Jalan Dulang, Selangor 23.6% 66,601 99 years,expiring in Mar 2091
117PortfolioDetails
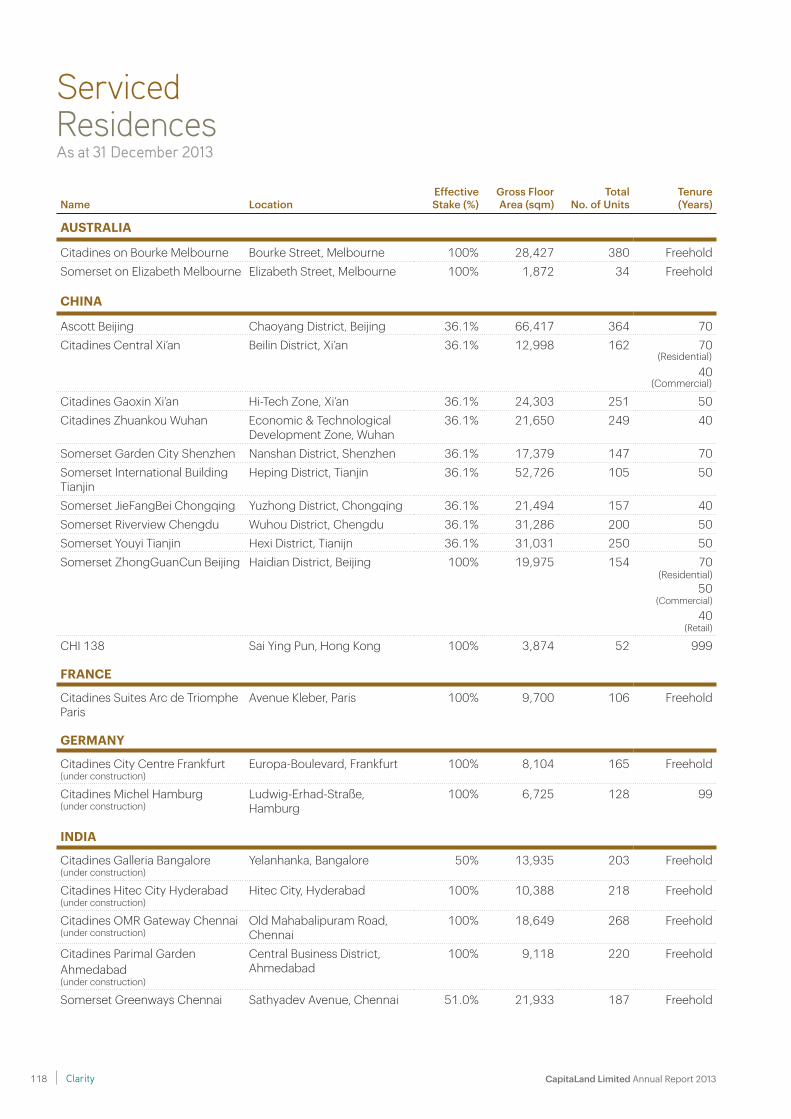
ServicedResidencesAs at 31 December 2013
Name LocationEffective Stake (%)
Gross Floor Area (sqm)
Total No. of Units
Tenure(Years)
AUSTRALIA
Citadines on Bourke Melbourne Bourke Street, Melbourne 100% 28,427 380 FreeholdSomerset on Elizabeth Melbourne Elizabeth Street, Melbourne 100% 1,872 34 Freehold
CHINA
Ascott Beijing Chaoyang District, Beijing 36.1% 66,417 364 70Citadines Central Xi’an Beilin District, Xi’an 36.1% 12,998 162 70
(Residential)
40 (Commercial)
Citadines Gaoxin Xi’an Hi-Tech Zone, Xi’an 36.1% 24,303 251 50Citadines Zhuankou Wuhan Economic & Technological
Development Zone, Wuhan36.1% 21,650 249 40
Somerset Garden City Shenzhen Nanshan District, Shenzhen 36.1% 17,379 147 70Somerset International Building Tianjin
Heping District, Tianjin 36.1% 52,726 105 50
Somerset JieFangBei Chongqing Yuzhong District, Chongqing 36.1% 21,494 157 40Somerset Riverview Chengdu Wuhou District, Chengdu 36.1% 31,286 200 50Somerset Youyi Tianjin Hexi District, Tianijn 36.1% 31,031 250 50Somerset ZhongGuanCun Beijing Haidian District, Beijing 100% 19,975 154 70
(Residential)50
(Commercial)
40 (Retail)
CHI 138 Sai Ying Pun, Hong Kong 100% 3,874 52 999
FRANCE
Citadines Suites Arc de Triomphe Paris
Avenue Kleber, Paris 100% 9,700 106 Freehold
GERMANY
Citadines City Centre Frankfurt (under construction)
Europa-Boulevard, Frankfurt 100% 8,104 165 Freehold
Citadines Michel Hamburg (under construction)
Ludwig-Erhad-Straße, Hamburg
100% 6,725 128 99
INDIA
Citadines Galleria Bangalore (under construction)
Yelanhanka, Bangalore 50% 13,935 203 Freehold
Citadines Hitec City Hyderabad (under construction)
Hitec City, Hyderabad 100% 10,388 218 Freehold
Citadines OMR Gateway Chennai (under construction)
Old Mahabalipuram Road, Chennai
100% 18,649 268 Freehold
Citadines Parimal Garden Ahmedabad (under construction)
Central Business District, Ahmedabad
100% 9,118 220 Freehold
Somerset Greenways Chennai Sathyadev Avenue, Chennai 51.0% 21,933 187 Freehold
CapitaLand Limited Annual Report 2013 118 Clarity
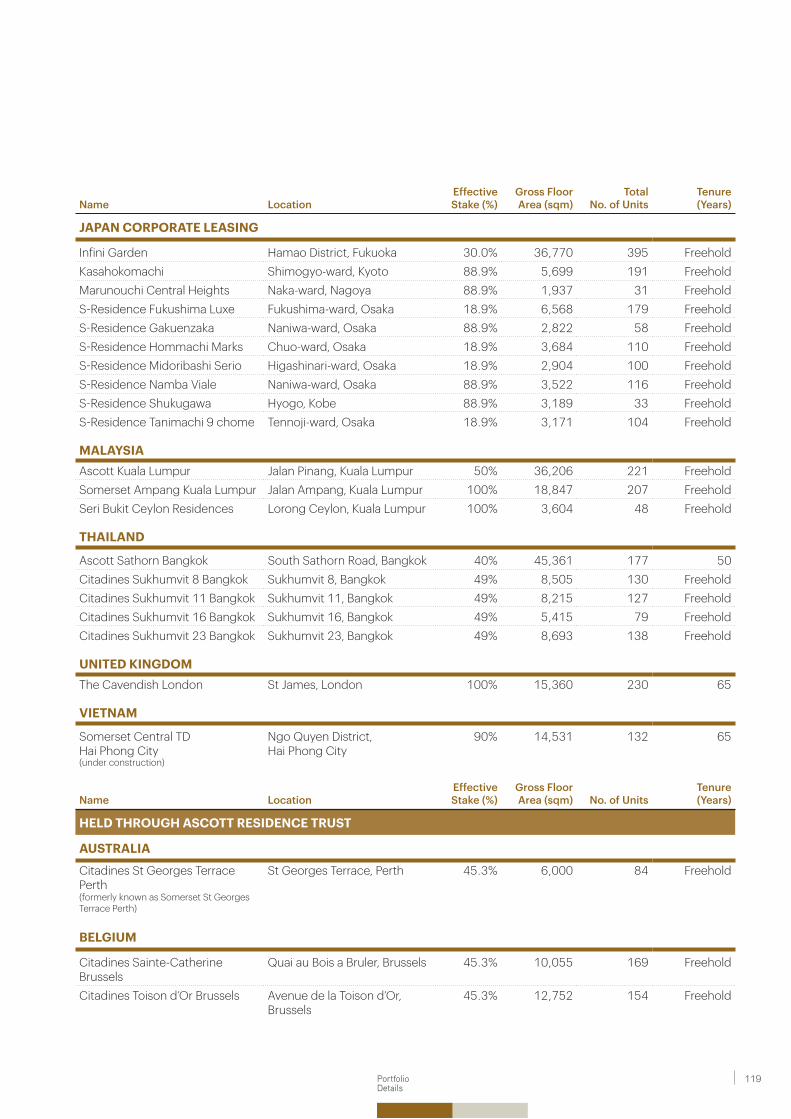
Name LocationEffective Stake (%)
Gross Floor Area (sqm)
Total No. of Units
Tenure(Years)
JAPAN CORPORATE LEASING
Infini Garden Hamao District, Fukuoka 30.0% 36,770 395 FreeholdKasahokomachi Shimogyo-ward, Kyoto 88.9% 5,699 191 FreeholdMarunouchi Central Heights Naka-ward, Nagoya 88.9% 1,937 31 FreeholdS-Residence Fukushima Luxe Fukushima-ward, Osaka 18.9% 6,568 179 FreeholdS-Residence Gakuenzaka Naniwa-ward, Osaka 88.9% 2,822 58 FreeholdS-Residence Hommachi Marks Chuo-ward, Osaka 18.9% 3,684 110 FreeholdS-Residence Midoribashi Serio Higashinari-ward, Osaka 18.9% 2,904 100 FreeholdS-Residence Namba Viale Naniwa-ward, Osaka 88.9% 3,522 116 FreeholdS-Residence Shukugawa Hyogo, Kobe 88.9% 3,189 33 FreeholdS-Residence Tanimachi 9 chome Tennoji-ward, Osaka 18.9% 3,171 104 Freehold
MALAYSIAAscott Kuala Lumpur Jalan Pinang, Kuala Lumpur 50% 36,206 221 FreeholdSomerset Ampang Kuala Lumpur Jalan Ampang, Kuala Lumpur 100% 18,847 207 FreeholdSeri Bukit Ceylon Residences Lorong Ceylon, Kuala Lumpur 100% 3,604 48 Freehold
THAILAND
Ascott Sathorn Bangkok South Sathorn Road, Bangkok 40% 45,361 177 50Citadines Sukhumvit 8 Bangkok Sukhumvit 8, Bangkok 49% 8,505 130 FreeholdCitadines Sukhumvit 11 Bangkok Sukhumvit 11, Bangkok 49% 8,215 127 FreeholdCitadines Sukhumvit 16 Bangkok Sukhumvit 16, Bangkok 49% 5,415 79 FreeholdCitadines Sukhumvit 23 Bangkok Sukhumvit 23, Bangkok 49% 8,693 138 Freehold
UNITED KINGDOMThe Cavendish London St James, London 100% 15,360 230 65
VIETNAM
Somerset Central TD Hai Phong City (under construction)
Ngo Quyen District, Hai Phong City
90% 14,531 132 65
Name LocationEffective Stake (%)
Gross Floor Area (sqm) No. of Units
Tenure(Years)
HELD THROUGH ASCOTT RESIDENCE TRUST
AUSTRALIA
Citadines St Georges Terrace Perth(formerly known as Somerset St Georges Terrace Perth)
St Georges Terrace, Perth 45.3% 6,000 84 Freehold
BELGIUM
Citadines Sainte-Catherine Brussels
Quai au Bois a Bruler, Brussels 45.3% 10,055 169 Freehold
Citadines Toison d’Or Brussels Avenue de la Toison d’Or, Brussels
45.3% 12,752 154 Freehold
119PortfolioDetails
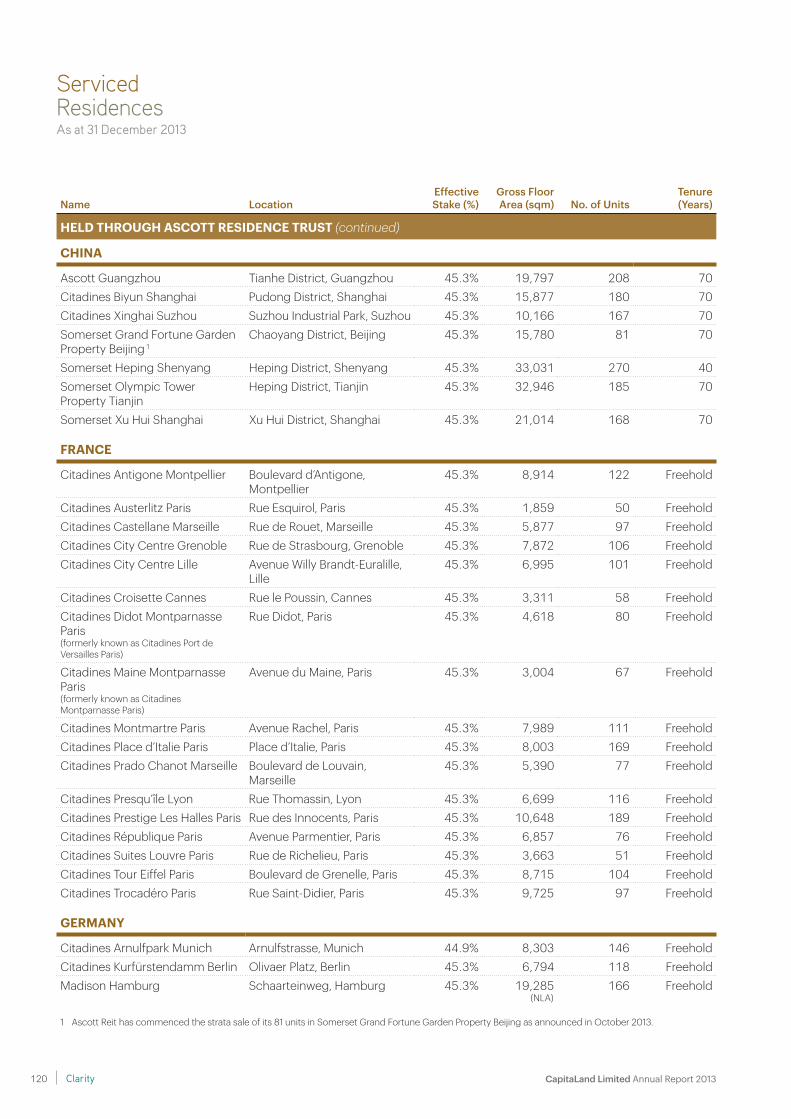
Name LocationEffective Stake (%)
Gross Floor Area (sqm) No. of Units
Tenure(Years)
HELD THROUGH ASCOTT RESIDENCE TRUST (continued)
CHINA
Ascott Guangzhou Tianhe District, Guangzhou 45.3% 19,797 208 70Citadines Biyun Shanghai Pudong District, Shanghai 45.3% 15,877 180 70Citadines Xinghai Suzhou Suzhou Industrial Park, Suzhou 45.3% 10,166 167 70Somerset Grand Fortune Garden Property Beijing 1
Chaoyang District, Beijing 45.3% 15,780 81 70
Somerset Heping Shenyang Heping District, Shenyang 45.3% 33,031 270 40Somerset Olympic Tower Property Tianjin
Heping District, Tianjin 45.3% 32,946 185 70
Somerset Xu Hui Shanghai Xu Hui District, Shanghai 45.3% 21,014 168 70
FRANCE
Citadines Antigone Montpellier Boulevard d’Antigone, Montpellier
45.3% 8,914 122 Freehold
Citadines Austerlitz Paris Rue Esquirol, Paris 45.3% 1,859 50 FreeholdCitadines Castellane Marseille Rue de Rouet, Marseille 45.3% 5,877 97 FreeholdCitadines City Centre Grenoble Rue de Strasbourg, Grenoble 45.3% 7,872 106 FreeholdCitadines City Centre Lille Avenue Willy Brandt-Euralille,
Lille45.3% 6,995 101 Freehold
Citadines Croisette Cannes Rue le Poussin, Cannes 45.3% 3,311 58 FreeholdCitadines Didot Montparnasse Paris(formerly known as Citadines Port de Versailles Paris)
Rue Didot, Paris 45.3% 4,618 80 Freehold
Citadines Maine Montparnasse Paris (formerly known as Citadines Montparnasse Paris)
Avenue du Maine, Paris 45.3% 3,004 67 Freehold
Citadines Montmartre Paris Avenue Rachel, Paris 45.3% 7,989 111 FreeholdCitadines Place d’Italie Paris Place d’Italie, Paris 45.3% 8,003 169 FreeholdCitadines Prado Chanot Marseille Boulevard de Louvain,
Marseille45.3% 5,390 77 Freehold
Citadines Presqu’île Lyon Rue Thomassin, Lyon 45.3% 6,699 116 FreeholdCitadines Prestige Les Halles Paris Rue des Innocents, Paris 45.3% 10,648 189 FreeholdCitadines République Paris Avenue Parmentier, Paris 45.3% 6,857 76 FreeholdCitadines Suites Louvre Paris Rue de Richelieu, Paris 45.3% 3,663 51 FreeholdCitadines Tour Eiffel Paris Boulevard de Grenelle, Paris 45.3% 8,715 104 FreeholdCitadines Trocadéro Paris Rue Saint-Didier, Paris 45.3% 9,725 97 Freehold
GERMANY
Citadines Arnulfpark Munich Arnulfstrasse, Munich 44.9% 8,303 146 FreeholdCitadines Kurfürstendamm Berlin Olivaer Platz, Berlin 45.3% 6,794 118 FreeholdMadison Hamburg Schaarteinweg, Hamburg 45.3% 19,285
(NLA)166 Freehold
1 Ascott Reit has commenced the strata sale of its 81 units in Somerset Grand Fortune Garden Property Beijing as announced in October 2013.
ServicedResidencesAs at 31 December 2013
CapitaLand Limited Annual Report 2013 120 Clarity
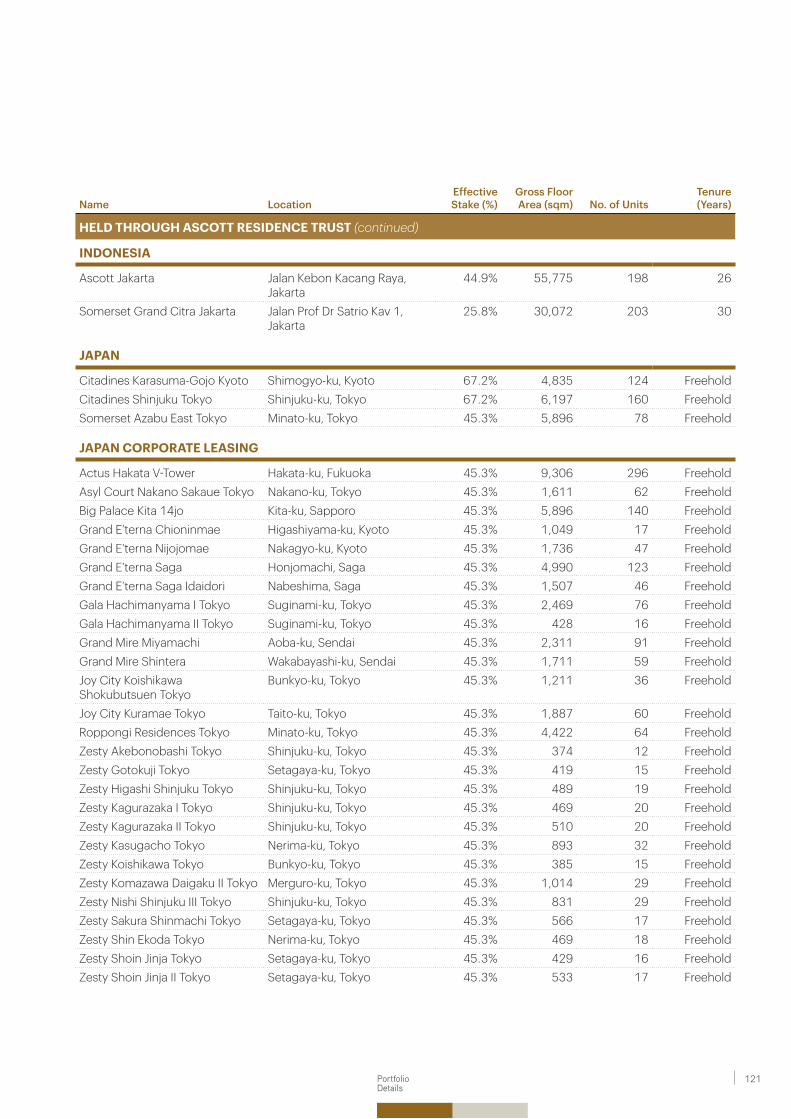
Name LocationEffective Stake (%)
Gross Floor Area (sqm) No. of Units
Tenure(Years)
HELD THROUGH ASCOTT RESIDENCE TRUST (continued)
INDONESIA
Ascott Jakarta Jalan Kebon Kacang Raya, Jakarta
44.9% 55,775 198 26
Somerset Grand Citra Jakarta Jalan Prof Dr Satrio Kav 1, Jakarta
25.8% 30,072 203 30
JAPAN
Citadines Karasuma-Gojo Kyoto Shimogyo-ku, Kyoto 67.2% 4,835 124 FreeholdCitadines Shinjuku Tokyo Shinjuku-ku, Tokyo 67.2% 6,197 160 FreeholdSomerset Azabu East Tokyo Minato-ku, Tokyo 45.3% 5,896 78 Freehold
JAPAN CORPORATE LEASING
Actus Hakata V-Tower Hakata-ku, Fukuoka 45.3% 9,306 296 FreeholdAsyl Court Nakano Sakaue Tokyo Nakano-ku, Tokyo 45.3% 1,611 62 FreeholdBig Palace Kita 14jo Kita-ku, Sapporo 45.3% 5,896 140 FreeholdGrand E’terna Chioninmae Higashiyama-ku, Kyoto 45.3% 1,049 17 FreeholdGrand E’terna Nijojomae Nakagyo-ku, Kyoto 45.3% 1,736 47 FreeholdGrand E’terna Saga Honjomachi, Saga 45.3% 4,990 123 FreeholdGrand E’terna Saga Idaidori Nabeshima, Saga 45.3% 1,507 46 FreeholdGala Hachimanyama I Tokyo Suginami-ku, Tokyo 45.3% 2,469 76 FreeholdGala Hachimanyama II Tokyo Suginami-ku, Tokyo 45.3% 428 16 FreeholdGrand Mire Miyamachi Aoba-ku, Sendai 45.3% 2,311 91 FreeholdGrand Mire Shintera Wakabayashi-ku, Sendai 45.3% 1,711 59 FreeholdJoy City Koishikawa Shokubutsuen Tokyo
Bunkyo-ku, Tokyo 45.3% 1,211 36 Freehold
Joy City Kuramae Tokyo Taito-ku, Tokyo 45.3% 1,887 60 FreeholdRoppongi Residences Tokyo Minato-ku, Tokyo 45.3% 4,422 64 FreeholdZesty Akebonobashi Tokyo Shinjuku-ku, Tokyo 45.3% 374 12 FreeholdZesty Gotokuji Tokyo Setagaya-ku, Tokyo 45.3% 419 15 FreeholdZesty Higashi Shinjuku Tokyo Shinjuku-ku, Tokyo 45.3% 489 19 FreeholdZesty Kagurazaka I Tokyo Shinjuku-ku, Tokyo 45.3% 469 20 FreeholdZesty Kagurazaka II Tokyo Shinjuku-ku, Tokyo 45.3% 510 20 FreeholdZesty Kasugacho Tokyo Nerima-ku, Tokyo 45.3% 893 32 FreeholdZesty Koishikawa Tokyo Bunkyo-ku, Tokyo 45.3% 385 15 FreeholdZesty Komazawa Daigaku II Tokyo Merguro-ku, Tokyo 45.3% 1,014 29 FreeholdZesty Nishi Shinjuku III Tokyo Shinjuku-ku, Tokyo 45.3% 831 29 FreeholdZesty Sakura Shinmachi Tokyo Setagaya-ku, Tokyo 45.3% 566 17 FreeholdZesty Shin Ekoda Tokyo Nerima-ku, Tokyo 45.3% 469 18 FreeholdZesty Shoin Jinja Tokyo Setagaya-ku, Tokyo 45.3% 429 16 FreeholdZesty Shoin Jinja II Tokyo Setagaya-ku, Tokyo 45.3% 533 17 Freehold
121PortfolioDetails
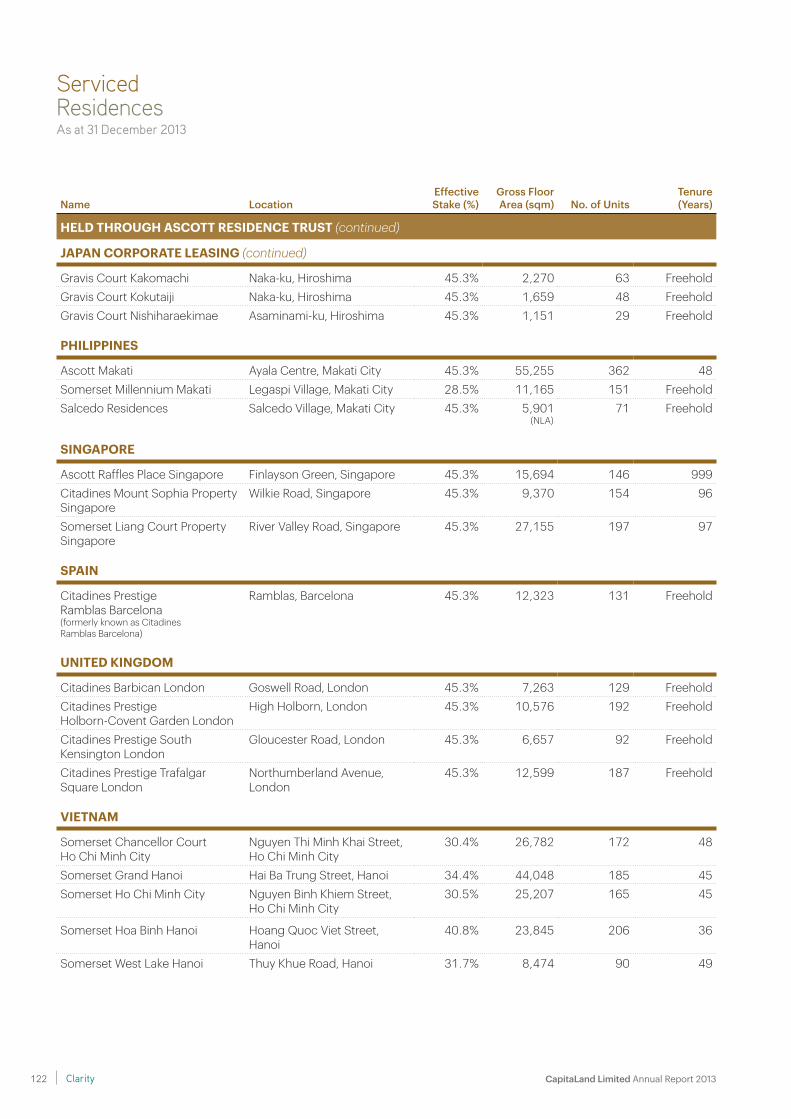
ServicedResidencesAs at 31 December 2013
Name LocationEffective Stake (%)
Gross Floor Area (sqm) No. of Units
Tenure(Years)
HELD THROUGH ASCOTT RESIDENCE TRUST (continued)
JAPAN CORPORATE LEASING (continued)
Gravis Court Kakomachi Naka-ku, Hiroshima 45.3% 2,270 63 FreeholdGravis Court Kokutaiji Naka-ku, Hiroshima 45.3% 1,659 48 FreeholdGravis Court Nishiharaekimae Asaminami-ku, Hiroshima 45.3% 1,151 29 Freehold
PHILIPPINES
Ascott Makati Ayala Centre, Makati City 45.3% 55,255 362 48Somerset Millennium Makati Legaspi Village, Makati City 28.5% 11,165 151 FreeholdSalcedo Residences Salcedo Village, Makati City 45.3% 5,901
(NLA)71 Freehold
SINGAPORE
Ascott Raffles Place Singapore Finlayson Green, Singapore 45.3% 15,694 146 999Citadines Mount Sophia Property Singapore
Wilkie Road, Singapore 45.3% 9,370 154 96
Somerset Liang Court Property Singapore
River Valley Road, Singapore 45.3% 27,155 197 97
SPAIN
Citadines Prestige Ramblas Barcelona (formerly known as Citadines Ramblas Barcelona)
Ramblas, Barcelona 45.3% 12,323 131 Freehold
UNITED KINGDOM
Citadines Barbican London Goswell Road, London 45.3% 7,263 129 FreeholdCitadines Prestige Holborn-Covent Garden London
High Holborn, London 45.3% 10,576 192 Freehold
Citadines Prestige South Kensington London
Gloucester Road, London 45.3% 6,657 92 Freehold
Citadines Prestige Trafalgar Square London
Northumberland Avenue, London
45.3% 12,599 187 Freehold
VIETNAM
Somerset Chancellor Court Ho Chi Minh City
Nguyen Thi Minh Khai Street, Ho Chi Minh City
30.4% 26,782 172 48
Somerset Grand Hanoi Hai Ba Trung Street, Hanoi 34.4% 44,048 185 45Somerset Ho Chi Minh City Nguyen Binh Khiem Street,
Ho Chi Minh City30.5% 25,207 165 45
Somerset Hoa Binh Hanoi Hoang Quoc Viet Street, Hanoi
40.8% 23,845 206 36
Somerset West Lake Hanoi Thuy Khue Road, Hanoi 31.7% 8,474 90 49
CapitaLand Limited Annual Report 2013 122 Clarity
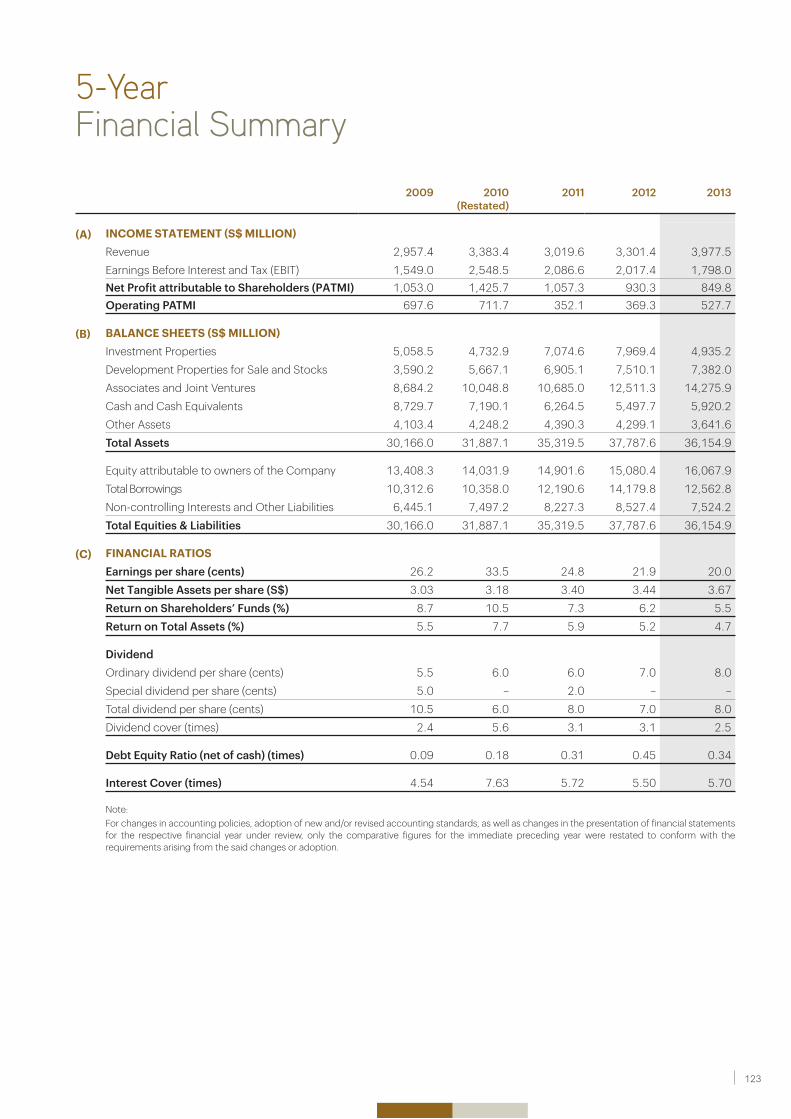
5-YearFinancial Summary
2009 2010 2011 2012 2013(Restated)
(A) INCOME STATEMENT (S$ MILLION)Revenue 2,957.4 3,383.4 3,019.6 3,301.4 3,977.5Earnings Before Interest and Tax (EBIT) 1,549.0 2,548.5 2,086.6 2,017.4 1,798.0Net Profit attributable to Shareholders (PATMI) 1,053.0 1,425.7 1,057.3 930.3 849.8Operating PATMI 697.6 711.7 352.1 369.3 527.7
(B) BALANCE SHEETS (S$ MILLION)Investment Properties 5,058.5 4,732.9 7,074.6 7,969.4 4,935.2Development Properties for Sale and Stocks 3,590.2 5,667.1 6,905.1 7,510.1 7,382.0Associates and Joint Ventures 8,684.2 10,048.8 10,685.0 12,511.3 14,275.9Cash and Cash Equivalents 8,729.7 7,190.1 6,264.5 5,497.7 5,920.2Other Assets 4,103.4 4,248.2 4,390.3 4,299.1 3,641.6Total Assets 30,166.0 31,887.1 35,319.5 37,787.6 36,154.9
Equity attributable to owners of the Company 13,408.3 14,031.9 14,901.6 15,080.4 16,067.9Total Borrowings 10,312.6 10,358.0 12,190.6 14,179.8 12,562.8Non-controlling Interests and Other Liabilities 6,445.1 7,497.2 8,227.3 8,527.4 7,524.2Total Equities & Liabilities 30,166.0 31,887.1 35,319.5 37,787.6 36,154.9
(C) FINANCIAL RATIOSEarnings per share (cents) 26.2 33.5 24.8 21.9 20.0Net Tangible Assets per share (S$) 3.03 3.18 3.40 3.44 3.67Return on Shareholders’ Funds (%) 8.7 10.5 7.3 6.2 5.5Return on Total Assets (%) 5.5 7.7 5.9 5.2 4.7
DividendOrdinary dividend per share (cents) 5.5 6.0 6.0 7.0 8.0Special dividend per share (cents) 5.0 – 2.0 – –Total dividend per share (cents) 10.5 6.0 8.0 7.0 8.0Dividend cover (times) 2.4 5.6 3.1 3.1 2.5
Debt Equity Ratio (net of cash) (times) 0.09 0.18 0.31 0.45 0.34
Interest Cover (times) 4.54 7.63 5.72 5.50 5.70
Note: For changes in accounting policies, adoption of new and/or revised accounting standards, as well as changes in the presentation of financial statements
for the respective financial year under review, only the comparative figures for the immediate preceding year were restated to conform with the requirements arising from the said changes or adoption.
123
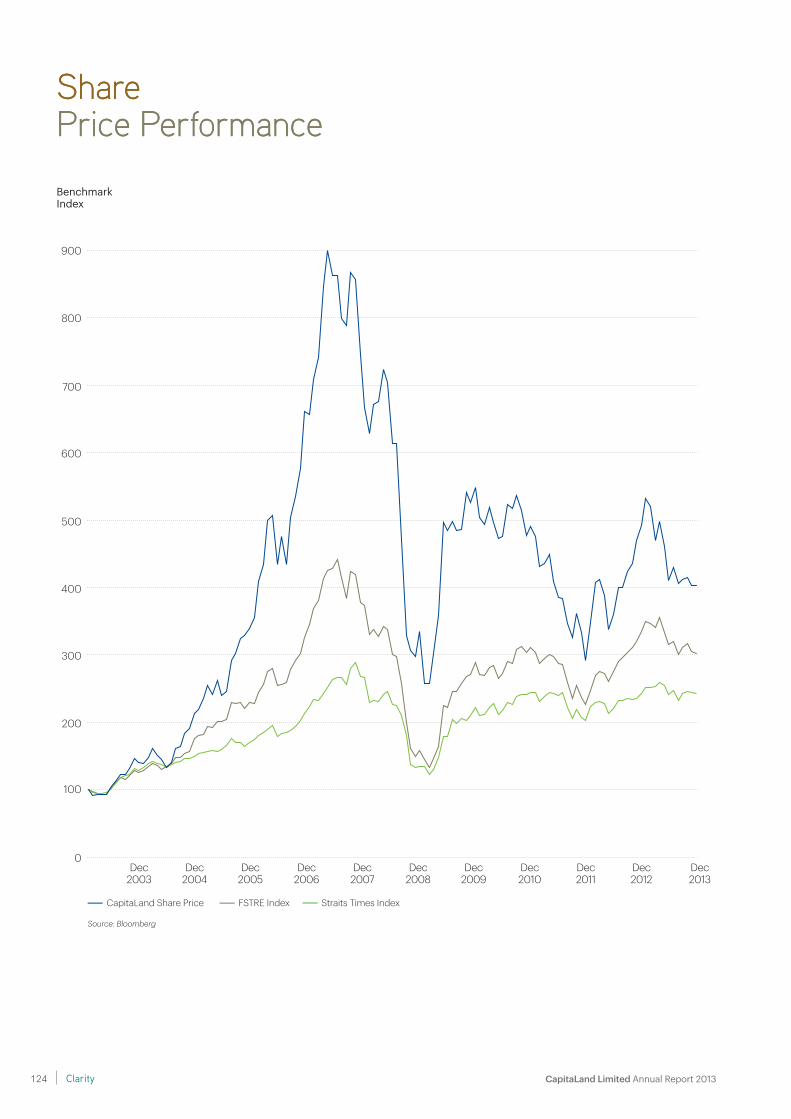
SharePrice PerformanceSharePrice Performance
CapitaLand Share Price FSTRE Index Straits Times Index
Source: Bloomberg
900
800
700
600
500
400
300
200
100
0
BenchmarkIndex
Dec2012
Dec2013
Dec2003
Dec2004
Dec2005
Dec2006
Dec2007
Dec2008
Dec2009
Dec2010
Dec2011
CapitaLand Limited Annual Report 2013 124 Clarity
Directors’ Report 126Statement by Directors 136Independent Auditors’ Report 137Balance Sheets 138Income Statements 139Statements of Comprehensive Income 140Statements of Changes in Equity 141Consolidated Statement of Cash Flows 144Notes to the Financial Statements 146
StatutoryAccounts
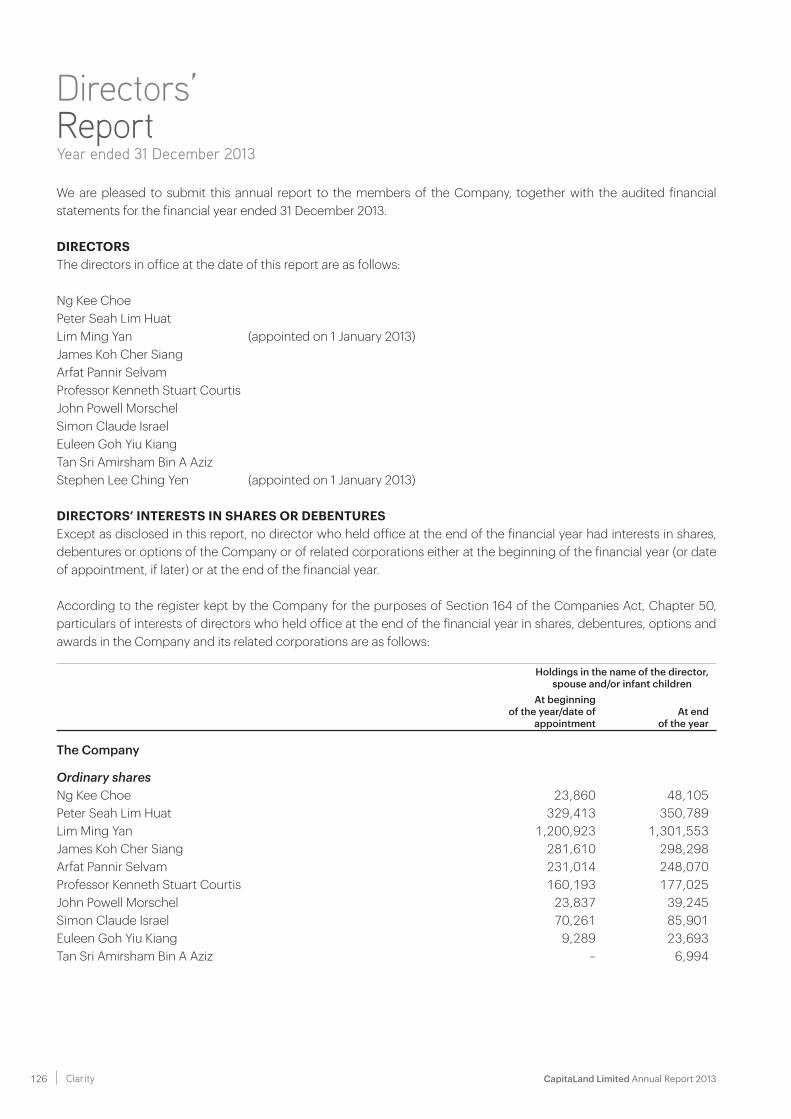
CapitaLand Limited Annual Report 2013 126 Clarity
Directors’ ReportYear ended 31 December 2013
We are pleased to submit this annual report to the members of the Company, together with the audited financial statements for the financial year ended 31 December 2013.
DIRECTORSThe directors in office at the date of this report are as follows:
Ng Kee ChoePeter Seah Lim HuatLim Ming Yan (appointed on 1 January 2013)James Koh Cher SiangArfat Pannir SelvamProfessor Kenneth Stuart CourtisJohn Powell MorschelSimon Claude IsraelEuleen Goh Yiu KiangTan Sri Amirsham Bin A Aziz Stephen Lee Ching Yen (appointed on 1 January 2013)
DIRECTORS’ INTERESTS IN SHARES OR DEBENTURESExcept as disclosed in this report, no director who held office at the end of the financial year had interests in shares, debentures or options of the Company or of related corporations either at the beginning of the financial year (or date of appointment, if later) or at the end of the financial year.
According to the register kept by the Company for the purposes of Section 164 of the Companies Act, Chapter 50, particulars of interests of directors who held office at the end of the financial year in shares, debentures, options and awards in the Company and its related corporations are as follows:
Holdings in the name of the director,spouse and/or infant children
At beginningof the year/date of
appointmentAt end
of the year
The Company
Ordinary sharesNg Kee Choe 23,860 48,105Peter Seah Lim Huat 329,413 350,789Lim Ming Yan 1,200,923 1,301,553James Koh Cher Siang 281,610 298,298Arfat Pannir Selvam 231,014 248,070Professor Kenneth Stuart Courtis 160,193 177,025John Powell Morschel 23,837 39,245Simon Claude Israel 70,261 85,901Euleen Goh Yiu Kiang 9,289 23,693Tan Sri Amirsham Bin A Aziz – 6,994
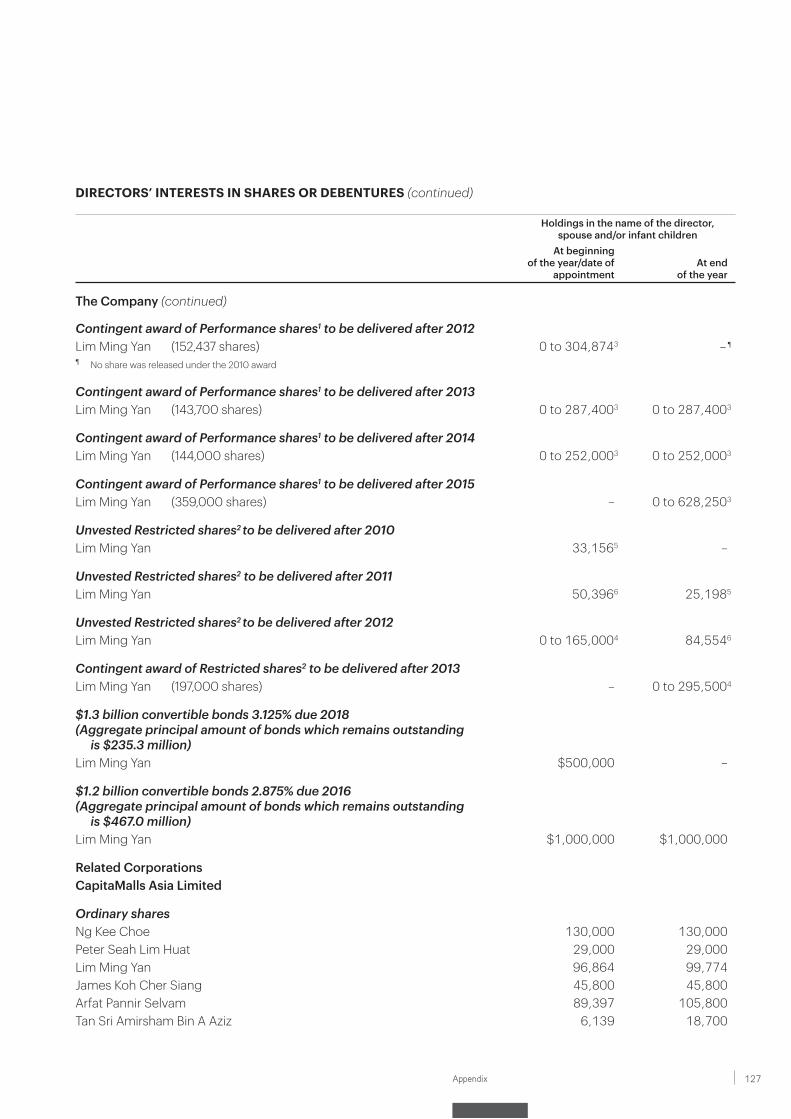
127Appendix
DIRECTORS’ INTERESTS IN SHARES OR DEBENTURES (continued)
Holdings in the name of the director,spouse and/or infant children
At beginningof the year/date of
appointmentAt end
of the year
The Company (continued)
Contingent award of Performance shares1 to be delivered after 2012Lim Ming Yan (152,437 shares) 0 to 304,8743 – ¶¶ No share was released under the 2010 award
Contingent award of Performance shares1 to be delivered after 2013Lim Ming Yan (143,700 shares) 0 to 287,4003 0 to 287,4003
Contingent award of Performance shares1 to be delivered after 2014Lim Ming Yan (144,000 shares) 0 to 252,0003 0 to 252,0003
Contingent award of Performance shares1 to be delivered after 2015Lim Ming Yan (359,000 shares) – 0 to 628,2503
Unvested Restricted shares2 to be delivered after 2010Lim Ming Yan 33,1565 –
Unvested Restricted shares2 to be delivered after 2011Lim Ming Yan 50,3966 25,1985
Unvested Restricted shares2 to be delivered after 2012Lim Ming Yan 0 to 165,0004 84,5546
Contingent award of Restricted shares2 to be delivered after 2013Lim Ming Yan (197,000 shares) – 0 to 295,5004
$1.3 billion convertible bonds 3.125% due 2018 (Aggregate principal amount of bonds which remains outstanding
is $235.3 million)Lim Ming Yan $500,000 –
$1.2 billion convertible bonds 2.875% due 2016 (Aggregate principal amount of bonds which remains outstanding
is $467.0 million)Lim Ming Yan $1,000,000 $1,000,000
Related CorporationsCapitaMalls Asia Limited
Ordinary sharesNg Kee Choe 130,000 130,000Peter Seah Lim Huat 29,000 29,000Lim Ming Yan 96,864 99,774James Koh Cher Siang 45,800 45,800Arfat Pannir Selvam 89,397 105,800Tan Sri Amirsham Bin A Aziz 6,139 18,700
CapitaLand Limited Annual Report 2013 128 Clarity
DIRECTORS’ INTERESTS IN SHARES OR DEBENTURES (continued)
Holdings in the name of the director,spouse and/or infant children
At beginningof the year/date of
appointmentAt end
of the year
Related Corporations (continued)CapitaLand Treasury Limited
$350 million 4.30% Fixed Rate Notes due 2020Euleen Goh Yiu Kiang $250,000 $250,000
Footnotes:1 Performance shares are shares under awards pursuant to the CapitaLand Performance Share Plan 2000 and CapitaLand Performance Share Plan 2010
(collectively referred to as CapitaLand Performance Share Plan).2 Restricted shares are shares under awards pursuant to the CapitaLand Restricted Stock Plan 2000 and CapitaLand Restricted Share Plan 2010 (collectively
referred to as CapitaLand Restricted Stock/Share Plan).3 The final number of shares released will depend on the achievement of pre-determined targets over a three-year performance period. No share will be
released if the threshold targets are not met at the end of the performance period. On the other hand, if superior targets are met, more shares than the baseline award could be released. For awards granted prior to 2012, the maximum is 200% of the baseline award. From 2012, the maximum will be 175% of the baseline award.
4 The final number of shares released will depend on the achievement of pre-determined targets at the end of a one-year performance period and the release will be over a vesting period of three years. No share will be released if the threshold targets are not met at the end of the performance period. On the other hand, if superior targets are met, more shares than the baseline award could be delivered up to a maximum of 150% of the baseline award.
5 Being the unvested one-third of the award.6 Being the unvested two-thirds of the award.
There was no change in any of the above-mentioned directors’ interests in the Company between the end of the financial year and 21 January 2014.
DIRECTORS’ INTERESTS IN CONTRACTSDuring the financial year, Mr Lim Ming Yan, a director of the Company who was the holder of $500,000 aggregate principal amount of the $1.3 billion convertible bonds 3.125% due 2018 validly tendered his holdings in connection with the invitation to tender for repurchase by the Company. The amount tendered was accepted by the Company at a price of 111.5%. Mr Lim Ming Yan had abstained from the voting and approval of this tender exercise.
Save as disclosed above, since the end of the last financial year, no other director has received or become entitled to receive a benefit by reason of a contract made by the Company or a related corporation with the director, or with a firm of which he is a member or with a company in which he has a substantial financial interest.
Directors’ emoluments are disclosed in “Directors’ Remuneration”.
ARRANGEMENTS TO ENABLE DIRECTORS TO ACQUIRE SHARES AND DEBENTURESExcept as disclosed under the Directors’ Interests in Shares or Debentures and Share Plans sections of this report, neither at the end of nor at any time during the financial year was the Company a party to any arrangement whose objects are, or one of whose objects is, to enable the directors of the Company to acquire benefits by means of the acquisition of shares in or debentures of the Company or any other body corporate.
SHARE PLANSThe Executive Resource and Compensation Committee (ERCC) of the Company has been designated as the Committee responsible for the administration of the Share Plans. The ERCC members at the date of this report are Mr Peter Seah Lim Huat (Chairman), Mr Ng Kee Choe, Mr Simon Claude Israel and Mr Stephen Lee Ching Yen.
Directors’ ReportYear ended 31 December 2013
129Appendix
SHARE PLANS (continued)(a) CapitaLand Share Option Plan, Performance Share Plan and Restricted Stock/Share Plan At the Extraordinary General Meeting held on 16 April 2010, shareholders approved a new CapitaLand Performance
Share Plan 2010 (PSP 2010) and CapitaLand Restricted Share Plan 2010 (RSP 2010). These plans replaced the CapitaLand Performance Share Plan 2000 and CapitaLand Restricted Stock Plan 2000 which were terminated. The Company did not extend the duration of, or replace, the CapitaLand Share Option Plan. All awards granted under the previous share plans prior to its termination will continue to be valid and be subject to the terms and conditions of the plans. The first grant of award under the new share plans was made in March 2011. The duration of each share plan is 10 years commencing on 16 April 2010.
Under the PSP 2010, the awards granted are conditional on performance targets set based on medium-term corporate objectives. Awards represent the right of a participant to receive fully paid shares, their equivalent cash value or combinations thereof, free of charge, upon the Company achieving prescribed performance target(s). Awards are released once the ERCC is satisfied that the prescribed target(s) have been achieved. There are no vesting periods beyond the performance achievement periods.
Under the RSP 2010, awards granted to eligible participants vest only after the satisfactory completion of time-based service conditions or where the award is performance-related, after a further period of service beyond the performance target completion date (performance-based restricted awards).
Awards granted under the RSP 2010 differ from awards granted under the PSP 2010 in that an extended vesting period is normally imposed beyond the performance target completion date, that is, they also incorporate a time-based service condition as well, to encourage participants to continue serving the Group beyond the achievement date of the pre-determined performance target(s). In addition, the RSP 2010 also enable grants of fully paid shares to be made to non-executive directors as part of their remuneration in respect of their office as such in lieu of cash.
The ERCC of the Company has instituted a set of share ownership guidelines for senior management who receives shares under the CapitaLand Restricted Share Plan and CapitaLand Performance Share Plan. Under these guidelines, members of the senior management team are required to retain a portion of the total number of CapitaLand shares received under the two aforementioned share-based plans, which will vary according to their job grades and base salaries.
The aggregate number of new shares which may be allotted, issued and/or delivered pursuant to awards granted under the Share Plans on any date, when aggregated with existing shares (including shares held in treasury and cash equivalents) delivered and/or to be delivered, pursuant to the Shares Plans, and all shares, options or awards granted under any other share schemes of the Company then in force, shall not exceed 8% of the total number of issued shares (excluding treasury shares) from time to time.
(b) Options Exercised The Company ceased to grant options under the CapitaLand Share Option Plan since 2007. During the financial
year, there were new ordinary shares issued for cash in the capital of the Company pursuant to the exercise of options granted:
Name of CompanyExercise Price
(per share)Number of Shares
Issued
CapitaLand Limited $0.30 to $3.18 871,704
Save as disclosed above, there were no shares issued during the financial year by virtue of the exercise of options to take up unissued shares of the Company and its subsidiary.
CapitaLand Limited Annual Report 2013 130 Clarity
SHARE PLANS (continued)(c) Unissued Shares under Options At the end of the financial year, there were the following unissued ordinary shares of the Company under options:
Number ofHolders
ExpiryDate
Exercise Price(per share)
$
Number ofUnissued Shares
under Options
The CompanyGroup Executives 35 27/02/2014 0.50 136,895
5 27/08/2014 0.85 15,120112 25/02/2015 1.72 1,023,220
18 26/08/2015 2.15 72,290320 24/02/2016 3.18 5,239,922
1 19/06/2016 3.65 87,35042 01/09/2016 4.09 593,548
Total 7,168,345
The aggregate number of options granted since the commencement of the CapitaLand Share Option Plan to the end of the financial year is as follows:
Participants
Aggregate options granted since the
commencementof the CapitaLand Share Option Plan
Aggregate options
exercised
Aggregate options lapsed/
cancelled
Aggregate options
outstanding
Directors of the Company 2,467,178 (2,467,178) – –Former directors of the Company/
Non-Executive Directors of subsidiaries 17,893,730 (17,137,320) (756,410) –
Group Executives (excluding Lim Ming Yan) 136,418,917 (94,649,084) (34,601,488) 7,168,345
Parent Group Executives and others 2,662,482 (2,232,834) (429,648) –Total 159,442,307 (116,486,416) (35,787,546) 7,168,345
Save as disclosed above, there were no unissued shares of the Company or its subsidiary under options as at the end of the financial year.
(d) Awards under the CapitaLand Performance Share Plan During the financial year, the ERCC of the Company has granted awards which are conditional on targets set for
a performance period, currently prescribed to be a three-year performance period. A specified number of shares will only be released by the ERCC to the recipient at the end of the qualifying performance period, provided the threshold targets are achieved. An initial number of shares (baseline award) is allocated equally according to the following performance conditions:• Group’s Absolute Total Shareholder Return measured as a multiple of Cost of Equity; and• Group’s Relative Total Shareholder Return measured as the outperformance against the MSCI Asia Pacific
ex-Japan Real Estate Index.
The above performance measures are selected as key measurements of wealth creation for shareholders. The final number of shares to be released will depend on the achievement of pre-determined targets over a three-year performance period. No share will be released if the threshold targets are not met at the end of the performance period. Conversely, if superior targets are met, more shares than the baseline award could be released. For awards granted prior to 2012, the maximum is 200% of the baseline award. From 2012, the maximum will be 175% of the baseline award.
Directors’ ReportYear ended 31 December 2013
131Appendix
SHARE PLANS (continued)(d) Awards under the CapitaLand Performance Share Plan (continued) Details of the movement in the awards of the Company during the year were as follows:
<-- Movements during the year -->Balance as at
1 January 2013 GrantedLapsed/
CancelledBalance as at
31 December 2013Year of Award
No. of holders
No. of shares
No. of shares
No. of shares
No. of holders
No. of shares
2010 49 2,778,016 – (2,778,016) – –2011 59 3,022,926 – (258,328) 55 2,764,5982012 63 3,398,000 – (414,369) 59 2,983,6312013 – – 3,565,000 (301,868) 62 3,263,132
9,198,942 3,565,000 (3,752,581) 9,011,361
(e) Awards under the CapitaLand Restricted Stock/Share Plan During the financial year, the ERCC of the Company has granted awards which are conditional on targets set for
a performance period, currently prescribed to be a one-year performance period. A specified number of shares will only be released by the ERCC to the recipients at the end of the qualifying performance period, provided the threshold targets are achieved. An initial number of shares (baseline award) is allocated equally according to the following performance conditions:• Group’s Earnings Before Interest and Tax; and• Group’s Return on Total Assets.
The above performance measures are selected as they are the key drivers of shareholder value and are aligned to the Company’s business objectives. The final number of shares to be released will depend on the achievement of pre-determined targets at the end of a one-year performance period. No share will be released if the threshold targets are not met at the end of the performance period. On the other hand, if superior targets are met, more shares than the baseline award could be delivered up to a maximum of 150% of the baseline award. Once the final number of shares has been determined, it will be released over a vesting period of three years. Recipients can receive fully paid shares, their equivalent cash value or combinations thereof, at no cost. From 2012, cash-settled award plan for non-managerial grade employees in Singapore, Malaysia and Japan has been replaced by a Restricted Cash Plan (RCP). Under RCP, a cash bonus is distributed to eligible employee at the end of each financial year based on the Group’s financial performance and achievement of performance targets, as well as individual performance.
With effect from 2011, the awards to non-executive directors form part of the directors’ fees and will be an outright grant with no performance and vesting conditions.
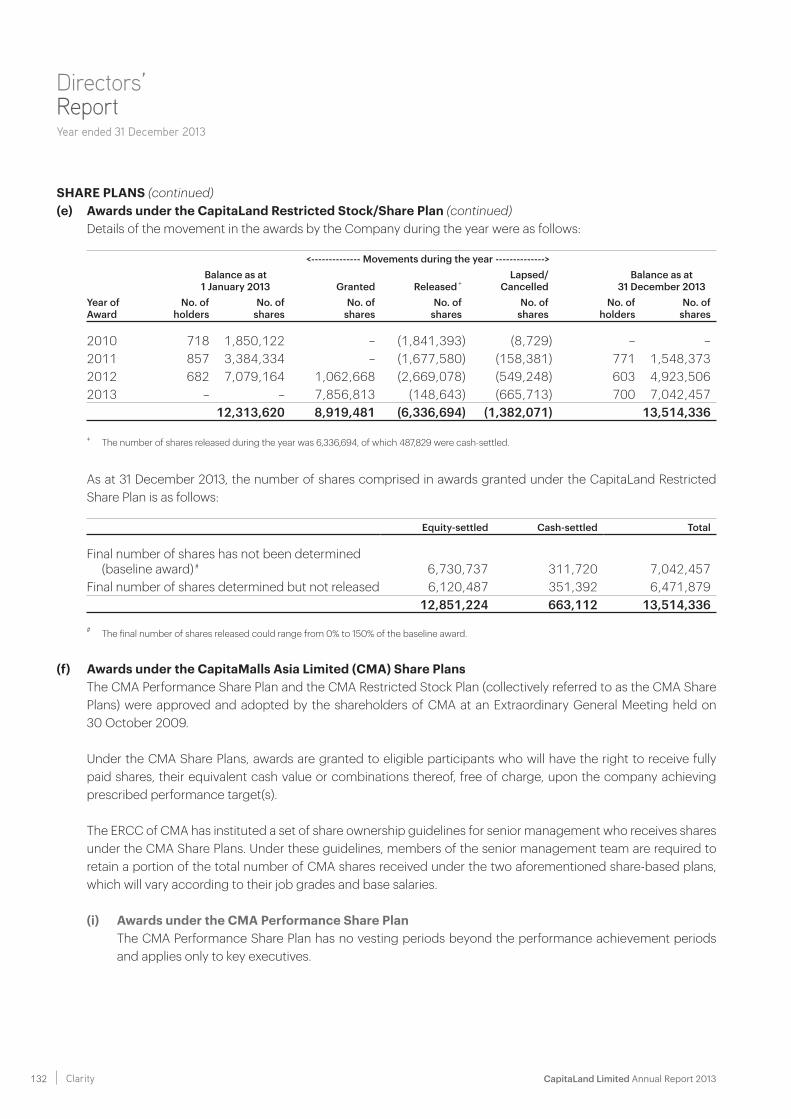
CapitaLand Limited Annual Report 2013 132 Clarity
SHARE PLANS (continued)(e) Awards under the CapitaLand Restricted Stock/Share Plan (continued) Details of the movement in the awards by the Company during the year were as follows:
<-------------- Movements during the year -------------->Balance as at
1 January 2013 Granted Released +Lapsed/
Cancelled Balance as at
31 December 2013Year ofAward
No. ofholders
No. ofshares
No. of shares
No. of shares
No. of shares
No. ofholders
No. ofshares
2010 718 1,850,122 – (1,841,393) (8,729) – –2011 857 3,384,334 – (1,677,580) (158,381) 771 1,548,3732012 682 7,079,164 1,062,668 (2,669,078) (549,248) 603 4,923,5062013 – – 7,856,813 (148,643) (665,713) 700 7,042,457
12,313,620 8,919,481 (6,336,694) (1,382,071) 13,514,336
+ The number of shares released during the year was 6,336,694, of which 487,829 were cash-settled.
As at 31 December 2013, the number of shares comprised in awards granted under the CapitaLand Restricted Share Plan is as follows:
Equity-settled Cash-settled Total
Final number of shares has not been determined (baseline award) # 6,730,737 311,720 7,042,457
Final number of shares determined but not released 6,120,487 351,392 6,471,87912,851,224 663,112 13,514,336
# The final number of shares released could range from 0% to 150% of the baseline award.
(f) Awards under the CapitaMalls Asia Limited (CMA) Share Plans The CMA Performance Share Plan and the CMA Restricted Stock Plan (collectively referred to as the CMA Share
Plans) were approved and adopted by the shareholders of CMA at an Extraordinary General Meeting held on 30 October 2009.
Under the CMA Share Plans, awards are granted to eligible participants who will have the right to receive fully paid shares, their equivalent cash value or combinations thereof, free of charge, upon the company achieving prescribed performance target(s).
The ERCC of CMA has instituted a set of share ownership guidelines for senior management who receives shares under the CMA Share Plans. Under these guidelines, members of the senior management team are required to retain a portion of the total number of CMA shares received under the two aforementioned share-based plans, which will vary according to their job grades and base salaries.
(i) Awards under the CMA Performance Share Plan The CMA Performance Share Plan has no vesting periods beyond the performance achievement periods
and applies only to key executives.
Directors’ ReportYear ended 31 December 2013
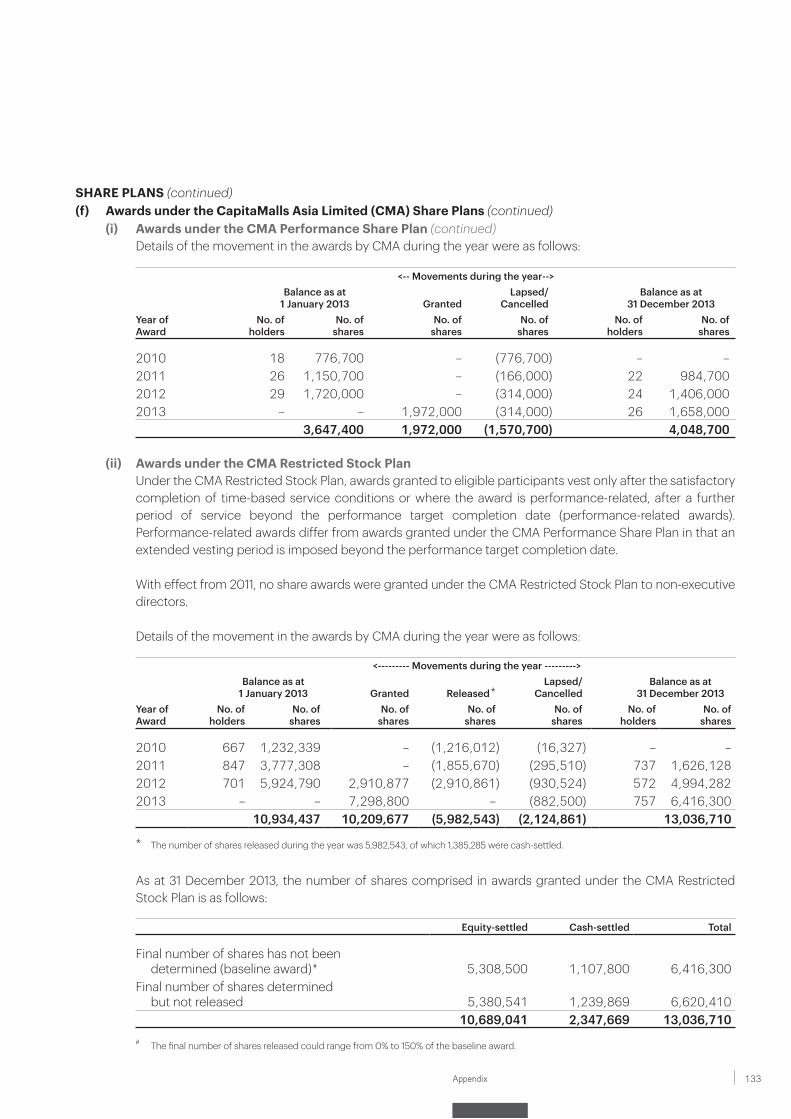
133Appendix
SHARE PLANS (continued)(f) Awards under the CapitaMalls Asia Limited (CMA) Share Plans (continued)
(i) Awards under the CMA Performance Share Plan (continued) Details of the movement in the awards by CMA during the year were as follows:
<-- Movements during the year-->Balance as at
1 January 2013 Granted Lapsed/
Cancelled Balance as at
31 December 2013Year ofAward
No. ofholders
No. ofshares
No. ofshares
No. ofshares
No. ofholders
No. ofshares
2010 18 776,700 – (776,700) – –2011 26 1,150,700 – (166,000) 22 984,7002012 29 1,720,000 – (314,000) 24 1,406,0002013 – – 1,972,000 (314,000) 26 1,658,000
3,647,400 1,972,000 (1,570,700) 4,048,700
(ii) Awards under the CMA Restricted Stock Plan Under the CMA Restricted Stock Plan, awards granted to eligible participants vest only after the satisfactory
completion of time-based service conditions or where the award is performance-related, after a further period of service beyond the performance target completion date (performance-related awards). Performance-related awards differ from awards granted under the CMA Performance Share Plan in that an extended vesting period is imposed beyond the performance target completion date.
With effect from 2011, no share awards were granted under the CMA Restricted Stock Plan to non-executive directors.
Details of the movement in the awards by CMA during the year were as follows:
<--------- Movements during the year --------->Balance as at
1 January 2013 Granted Released *Lapsed/
Cancelled Balance as at
31 December 2013Year ofAward
No. ofholders
No. ofshares
No. ofshares
No. ofshares
No. ofshares
No. ofholders
No. ofshares
2010 667 1,232,339 – (1,216,012) (16,327) – –2011 847 3,777,308 – (1,855,670) (295,510) 737 1,626,1282012 701 5,924,790 2,910,877 (2,910,861) (930,524) 572 4,994,2822013 – – 7,298,800 – (882,500) 757 6,416,300
10,934,437 10,209,677 (5,982,543) (2,124,861) 13,036,710
* The number of shares released during the year was 5,982,543, of which 1,385,285 were cash-settled.
As at 31 December 2013, the number of shares comprised in awards granted under the CMA Restricted Stock Plan is as follows:
Equity-settled Cash-settled Total
Final number of shares has not been determined (baseline award) # 5,308,500 1,107,800 6,416,300
Final number of shares determined but not released 5,380,541 1,239,869 6,620,410
10,689,041 2,347,669 13,036,710# The final number of shares released could range from 0% to 150% of the baseline award.
CapitaLand Limited Annual Report 2013 134 Clarity
AUDIT COMMITTEEThe Audit Committee members at the date of this report are Ms Euleen Goh Yiu Kiang (Chairman), Mr James Koh Cher Siang, Mrs Arfat Pannir Selvam and Tan Sri Amirsham Bin A Aziz.
The Audit Committee performs the functions specified by Section 201B of the Companies Act, Chapter 50 (the Act), the Listing Manual of the SGX-ST, and the Code of Corporate Governance.
The principal responsibility of the Audit Committee is to assist the Board of Directors in fulfilling its oversight responsibilities. Areas of review by the Audit Committee include:
• the reliability and integrity of the financial statements;
• the impact of new, revised or proposed changes in accounting policies or regulatory requirements on the financial statements;
• the compliance with laws and regulations, particularly those of the Act and the Listing Manual of the SGX-ST;
• the appropriateness of quarterly and full year announcements and reports;
• the adequacy of internal controls and evaluation of adherence to such controls;
• the effectiveness and efficiency of internal and external audits;
• the appointment and re-appointment of external auditors and the level of auditors’ remuneration;
• the nature and extent of non-audit services and their impact on independence and objectivity of the external auditors;
• interested person transactions;
• the findings of internal investigation, if any;
• the framework and processes established for the implementation of the terms of the collaboration agreement with CMA in order to ensure that such framework and processes remain appropriate;
• the processes put in place to manage any material conflicts of interest within the Group; and
• all conflicts of interest matters referred to it.
The Audit Committee also reviews arrangements by which employees of the Company may, in confidence, raise concerns about possible improprieties in matters of financial reporting or other matters. Pursuant to this, the Audit Committee has introduced a Whistle Blowing Policy where employees may raise improprieties to the Audit Committee Chairman in good faith, with the confidence that employees making such reports will be treated fairly and be protected from reprisal.
Directors’ ReportYear ended 31 December 2013
135Appendix
AUDIT COMMITTEE (continued)The Audit Committee met four times in 2013. Specific functions performed during the year included reviewing the scope of work and strategies of both the internal and external auditors, and the results arising therefrom, including their evaluation of the system of internal controls. The Audit Committee also reviewed the assistance given by the Company’s officers to the auditors. The financial statements of the Group and the Company were reviewed by the Audit Committee prior to the submission to the Board of Directors of the Company for adoption. The Audit Committee also met with the internal and external auditors, without the presence of management, to discuss issues of concern to them.
The Audit Committee has, in accordance with Chapter 9 of the Listing Manual of the SGX-ST, reviewed the requirements for approval and disclosure of interested person transactions, reviewed the procedures set by the Group and the Company to identify and report and where necessary, seek approval for interested person transactions and, with the assistance of the internal auditors, reviewed interested person transactions.
The Audit Committee also undertook quarterly reviews of all non-audit services provided by KPMG LLP and its member firms and was satisfied that they did not affect their independence as external auditors of the Company.
The Audit Committee has recommended to the Board of Directors that the auditors, KPMG LLP, be nominated for re-appointment as auditors at the forthcoming Annual General Meeting of the Company.
AUDITORSThe auditors, KPMG LLP, have indicated their willingness to accept re-appointment.
On behalf of the Board of Directors
NG KEE CHOEDirector
LIM MING YANDirector
Singapore28 February 2014
CapitaLand Limited Annual Report 2013 136 Clarity
In our opinion:
(a) the financial statements set out on pages 138 to 247 are drawn up so as to give a true and fair view of the state of affairs of the Group and of the Company as at 31 December 2013, and of the results and changes in equity of the Group and of the Company, and of the cash flows of the Group for the year ended on that date in accordance with the provisions of the Singapore Companies Act, Chapter 50 and Singapore Financial Reporting Standards; and
(b) at the date of this statement, there are reasonable grounds to believe that the Company will be able to pay its debts as and when they fall due.
The Board of Directors has, on the date of this statement, authorised these financial statements for issue.
On behalf of the Board of Directors
NG KEE CHOEDirector
LIM MING YANDirector
Singapore28 February 2014
Statement by Directors
137Appendix
We have audited the accompanying financial statements of CapitaLand Limited (the Company) and its subsidiaries (the Group), which comprise the balance sheets of the Group and the Company as at 31 December 2013, the income statements, statements of comprehensive income and statements of changes in equity of the Group and the Company and the statement of cash flows of the Group for the year then ended, and a summary of significant accounting policies and other explanatory information, as set out on pages 138 to 247.
MANAGEMENT’S RESPONSIBILITY FOR THE FINANCIAL STATEMENTSManagement is responsible for the preparation of financial statements that give a true and fair view in accordance with the provisions of the Singapore Companies Act, Chapter 50 (the Act) and Singapore Financial Reporting Standards, and for devising and maintaining a system of internal accounting controls sufficient to provide a reasonable assurance that assets are safeguarded against loss from unauthorised use or disposition; and transactions are properly authorised and that they are recorded as necessary to permit the preparation of true and fair profit and loss accounts and balance sheets and to maintain accountability of assets.
AUDITORS’ RESPONSIBILITYOur responsibility is to express an opinion on these financial statements based on our audit. We conducted our audit in accordance with Singapore Standards on Auditing. Those standards require that we comply with ethical requirements and plan and perform the audit to obtain reasonable assurance about whether the financial statements are free from material misstatement.
An audit involves performing procedures to obtain audit evidence about the amounts and disclosures in the financial statements. The procedures selected depend on the auditor’s judgement, including the assessment of the risks of material misstatement of the financial statements, whether due to fraud or error. In making those risk assessments, the auditor considers internal control relevant to the entity’s preparation of the financial statements that give a true and fair view in order to design audit procedures that are appropriate in the circumstances, but not for the purpose of expressing an opinion on the effectiveness of the entity’s internal control. An audit also includes evaluating the appropriateness of accounting policies used and the reasonableness of accounting estimates made by management, as well as evaluating the overall presentation of the financial statements.
We believe that the audit evidence we have obtained is sufficient and appropriate to provide a basis for our audit opinion.
OPINIONIn our opinion, the consolidated financial statements of the Group and the balance sheet, income statement, statement of comprehensive income and statement of changes in equity of the Company are properly drawn up in accordance with the provisions of the Act and Singapore Financial Reporting Standards to give a true and fair view of the state of affairs of the Group and of the Company as at 31 December 2013 and the results and changes in equity of the Group and the Company and cash flows of the Group for the year ended on that date.
REPORT ON OTHER LEGAL AND REGULATORY REQUIREMENTSIn our opinion, the accounting and other records required by the Act to be kept by the Company and by those subsidiaries incorporated in Singapore of which we are the auditors have been properly kept in accordance with the provisions of the Act.
KPMG LLPPublic Accountants andChartered Accountants
Singapore28 February 2014
Independent Auditors’ Report To the members of CapitaLand Limited
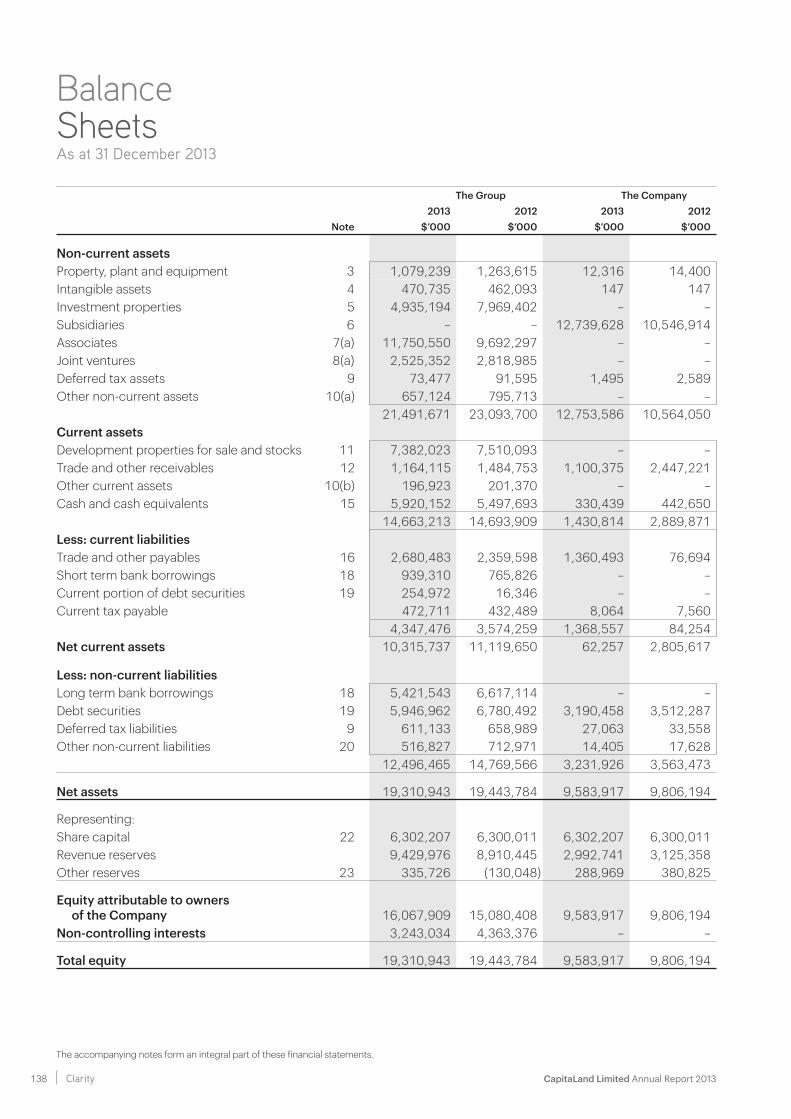
CapitaLand Limited Annual Report 2013 138 Clarity
The Group The Company2013 2012 2013 2012
Note $’000 $’000 $’000 $’000
Non-current assetsProperty, plant and equipment 3 1,079,239 1,263,615 12,316 14,400Intangible assets 4 470,735 462,093 147 147Investment properties 5 4,935,194 7,969,402 – – Subsidiaries 6 – – 12,739,628 10,546,914Associates 7(a) 11,750,550 9,692,297 – –Joint ventures 8(a) 2,525,352 2,818,985 – –Deferred tax assets 9 73,477 91,595 1,495 2,589Other non-current assets 10(a) 657,124 795,713 – –
21,491,671 23,093,700 12,753,586 10,564,050Current assetsDevelopment properties for sale and stocks 11 7,382,023 7,510,093 – –Trade and other receivables 12 1,164,115 1,484,753 1,100,375 2,447,221Other current assets 10(b) 196,923 201,370 – –Cash and cash equivalents 15 5,920,152 5,497,693 330,439 442,650
14,663,213 14,693,909 1,430,814 2,889,871Less: current liabilitiesTrade and other payables 16 2,680,483 2,359,598 1,360,493 76,694Short term bank borrowings 18 939,310 765,826 – –Current portion of debt securities 19 254,972 16,346 – –Current tax payable 472,711 432,489 8,064 7,560
4,347,476 3,574,259 1,368,557 84,254Net current assets 10,315,737 11,119,650 62,257 2,805,617
Less: non-current liabilitiesLong term bank borrowings 18 5,421,543 6,617,114 – –Debt securities 19 5,946,962 6,780,492 3,190,458 3,512,287Deferred tax liabilities 9 611,133 658,989 27,063 33,558Other non-current liabilities 20 516,827 712,971 14,405 17,628
12,496,465 14,769,566 3,231,926 3,563,473
Net assets 19,310,943 19,443,784 9,583,917 9,806,194
Representing:Share capital 22 6,302,207 6,300,011 6,302,207 6,300,011Revenue reserves 9,429,976 8,910,445 2,992,741 3,125,358Other reserves 23 335,726 (130,048) 288,969 380,825
Equity attributable to owners of the Company 16,067,909 15,080,408 9,583,917 9,806,194
Non-controlling interests 3,243,034 4,363,376 – –
Total equity 19,310,943 19,443,784 9,583,917 9,806,194
Balance SheetsAs at 31 December 2013
The accompanying notes form an integral part of these financial statements.
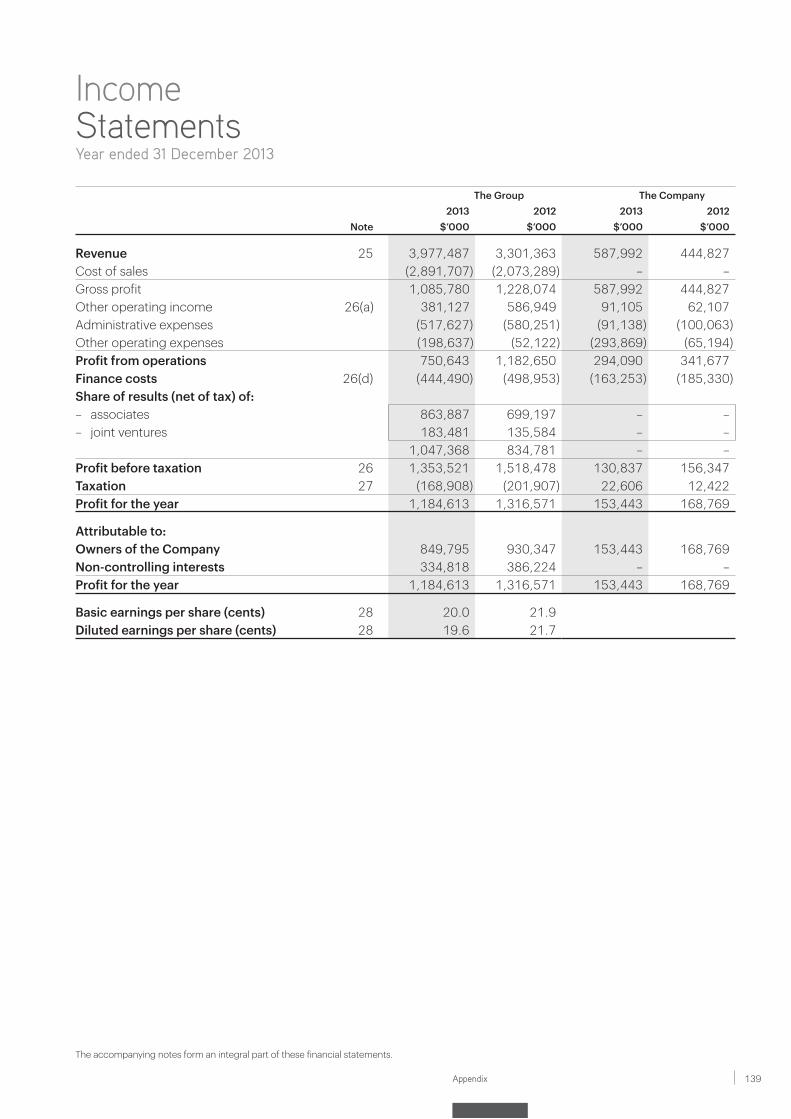
139Appendix
The Group The Company2013 2012 2013 2012
Note $’000 $’000 $’000 $’000
Revenue 25 3,977,487 3,301,363 587,992 444,827Cost of sales (2,891,707) (2,073,289) – –Gross profit 1,085,780 1,228,074 587,992 444,827Other operating income 26(a) 381,127 586,949 91,105 62,107Administrative expenses (517,627) (580,251) (91,138) (100,063)Other operating expenses (198,637) (52,122) (293,869) (65,194)Profit from operations 750,643 1,182,650 294,090 341,677Finance costs 26(d) (444,490) (498,953) (163,253) (185,330)Share of results (net of tax) of:– associates 863,887 699,197 – –– joint ventures 183,481 135,584 – –
1,047,368 834,781 – –Profit before taxation 26 1,353,521 1,518,478 130,837 156,347Taxation 27 (168,908) (201,907) 22,606 12,422Profit for the year 1,184,613 1,316,571 153,443 168,769
Attributable to:Owners of the Company 849,795 930,347 153,443 168,769Non-controlling interests 334,818 386,224 – –Profit for the year 1,184,613 1,316,571 153,443 168,769
Basic earnings per share (cents) 28 20.0 21.9Diluted earnings per share (cents) 28 19.6 21.7
Income StatementsYear ended 31 December 2013
The accompanying notes form an integral part of these financial statements.
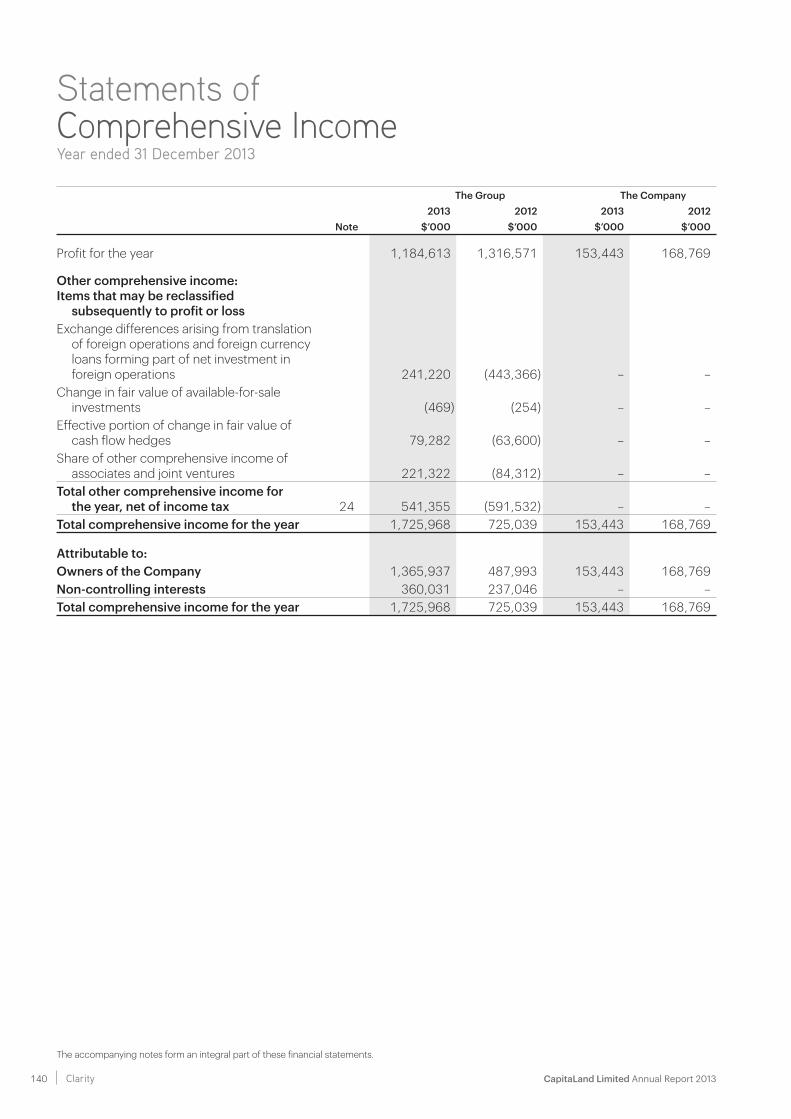
CapitaLand Limited Annual Report 2013 140 Clarity
The Group The Company2013 2012 2013 2012
Note $’000 $’000 $’000 $’000
Profit for the year 1,184,613 1,316,571 153,443 168,769
Other comprehensive income:Items that may be reclassified
subsequently to profit or lossExchange differences arising from translation
of foreign operations and foreign currency loans forming part of net investment in foreign operations 241,220 (443,366) – –
Change in fair value of available-for-sale investments (469) (254) – –
Effective portion of change in fair value of cash flow hedges 79,282 (63,600) – –
Share of other comprehensive income of associates and joint ventures 221,322 (84,312) – –
Total other comprehensive income for the year, net of income tax 24 541,355 (591,532) – –
Total comprehensive income for the year 1,725,968 725,039 153,443 168,769
Attributable to:Owners of the Company 1,365,937 487,993 153,443 168,769Non-controlling interests 360,031 237,046 – –Total comprehensive income for the year 1,725,968 725,039 153,443 168,769
The accompanying notes form an integral part of these financial statements.
Statements of Comprehensive IncomeYear ended 31 December 2013
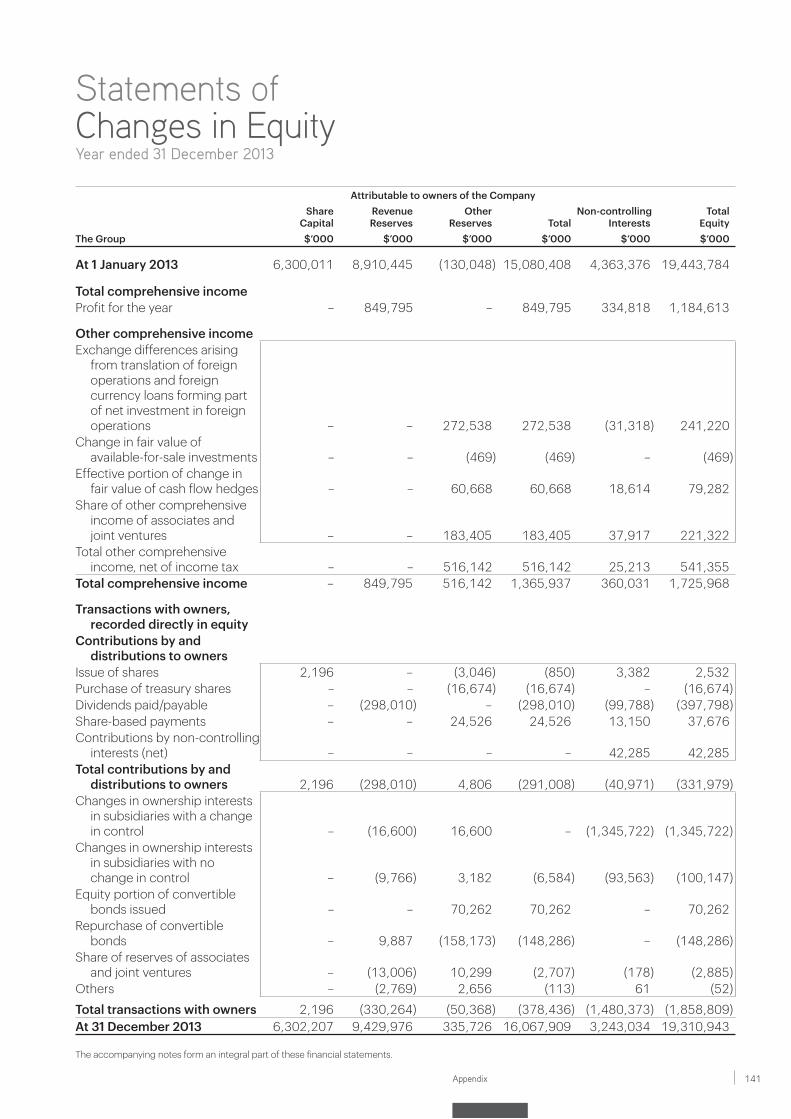
141Appendix
The accompanying notes form an integral part of these financial statements.
Attributable to owners of the CompanyShare
CapitalRevenueReserves
OtherReserves Total
Non-controllingInterests
TotalEquity
The Group $’000 $’000 $’000 $’000 $’000 $’000
At 1 January 2013 6,300,011 8,910,445 (130,048) 15,080,408 4,363,376 19,443,784
Total comprehensive incomeProfit for the year – 849,795 – 849,795 334,818 1,184,613
Other comprehensive incomeExchange differences arising
from translation of foreign operations and foreign currency loans forming part of net investment in foreign operations – – 272,538 272,538 (31,318) 241,220
Change in fair value of available-for-sale investments – – (469) (469) – (469)
Effective portion of change in fair value of cash flow hedges – – 60,668 60,668 18,614 79,282
Share of other comprehensive income of associates and joint ventures – – 183,405 183,405 37,917 221,322
Total other comprehensive income, net of income tax – – 516,142 516,142 25,213 541,355
Total comprehensive income – 849,795 516,142 1,365,937 360,031 1,725,968
Transactions with owners, recorded directly in equity
Contributions by and distributions to owners
Issue of shares 2,196 – (3,046) (850) 3,382 2,532Purchase of treasury shares – – (16,674) (16,674) – (16,674)Dividends paid/payable – (298,010) – (298,010) (99,788) (397,798)Share-based payments – – 24,526 24,526 13,150 37,676Contributions by non-controlling
interests (net) – – – – 42,285 42,285Total contributions by and
distributions to owners 2,196 (298,010) 4,806 (291,008) (40,971) (331,979)Changes in ownership interests
in subsidiaries with a change in control – (16,600) 16,600 – (1,345,722) (1,345,722)
Changes in ownership interests in subsidiaries with no change in control – (9,766) 3,182 (6,584) (93,563) (100,147)
Equity portion of convertible bonds issued – – 70,262 70,262 – 70,262
Repurchase of convertible bonds – 9,887 (158,173) (148,286) – (148,286)
Share of reserves of associates and joint ventures – (13,006) 10,299 (2,707) (178) (2,885)
Others – (2,769) 2,656 (113) 61 (52)
Total transactions with owners 2,196 (330,264) (50,368) (378,436) (1,480,373) (1,858,809)At 31 December 2013 6,302,207 9,429,976 335,726 16,067,909 3,243,034 19,310,943
Statements of Changes in EquityYear ended 31 December 2013
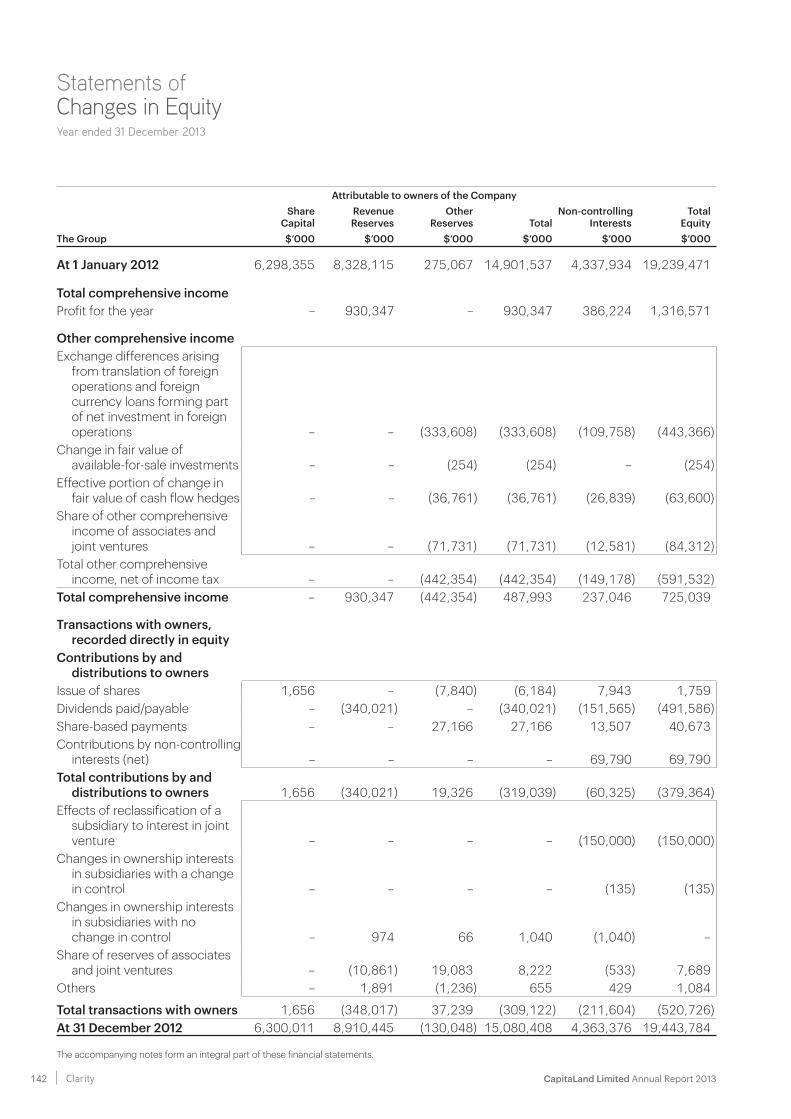
CapitaLand Limited Annual Report 2013 142 Clarity
The accompanying notes form an integral part of these financial statements.
Attributable to owners of the CompanyShare
CapitalRevenueReserves
OtherReserves Total
Non-controllingInterests
TotalEquity
The Group $’000 $’000 $’000 $’000 $’000 $’000
At 1 January 2012 6,298,355 8,328,115 275,067 14,901,537 4,337,934 19,239,471
Total comprehensive incomeProfit for the year – 930,347 – 930,347 386,224 1,316,571
Other comprehensive incomeExchange differences arising
from translation of foreign operations and foreign currency loans forming part of net investment in foreign operations – – (333,608) (333,608) (109,758) (443,366)
Change in fair value of available-for-sale investments – – (254) (254) – (254)
Effective portion of change in fair value of cash flow hedges – – (36,761) (36,761) (26,839) (63,600)
Share of other comprehensive income of associates and joint ventures – – (71,731) (71,731) (12,581) (84,312)
Total other comprehensive income, net of income tax – – (442,354) (442,354) (149,178) (591,532)
Total comprehensive income – 930,347 (442,354) 487,993 237,046 725,039
Transactions with owners, recorded directly in equity
Contributions by and distributions to owners
Issue of shares 1,656 – (7,840) (6,184) 7,943 1,759Dividends paid/payable – (340,021) – (340,021) (151,565) (491,586)Share-based payments – – 27,166 27,166 13,507 40,673Contributions by non-controlling
interests (net) – – – – 69,790 69,790Total contributions by and
distributions to owners 1,656 (340,021) 19,326 (319,039) (60,325) (379,364)Effects of reclassification of a
subsidiary to interest in joint venture – – – – (150,000) (150,000)
Changes in ownership interests in subsidiaries with a change in control – – – – (135) (135)
Changes in ownership interests in subsidiaries with no change in control – 974 66 1,040 (1,040) –
Share of reserves of associates and joint ventures – (10,861) 19,083 8,222 (533) 7,689
Others – 1,891 (1,236) 655 429 1,084
Total transactions with owners 1,656 (348,017) 37,239 (309,122) (211,604) (520,726)At 31 December 2012 6,300,011 8,910,445 (130,048) 15,080,408 4,363,376 19,443,784
Statements of Changes in EquityYear ended 31 December 2013
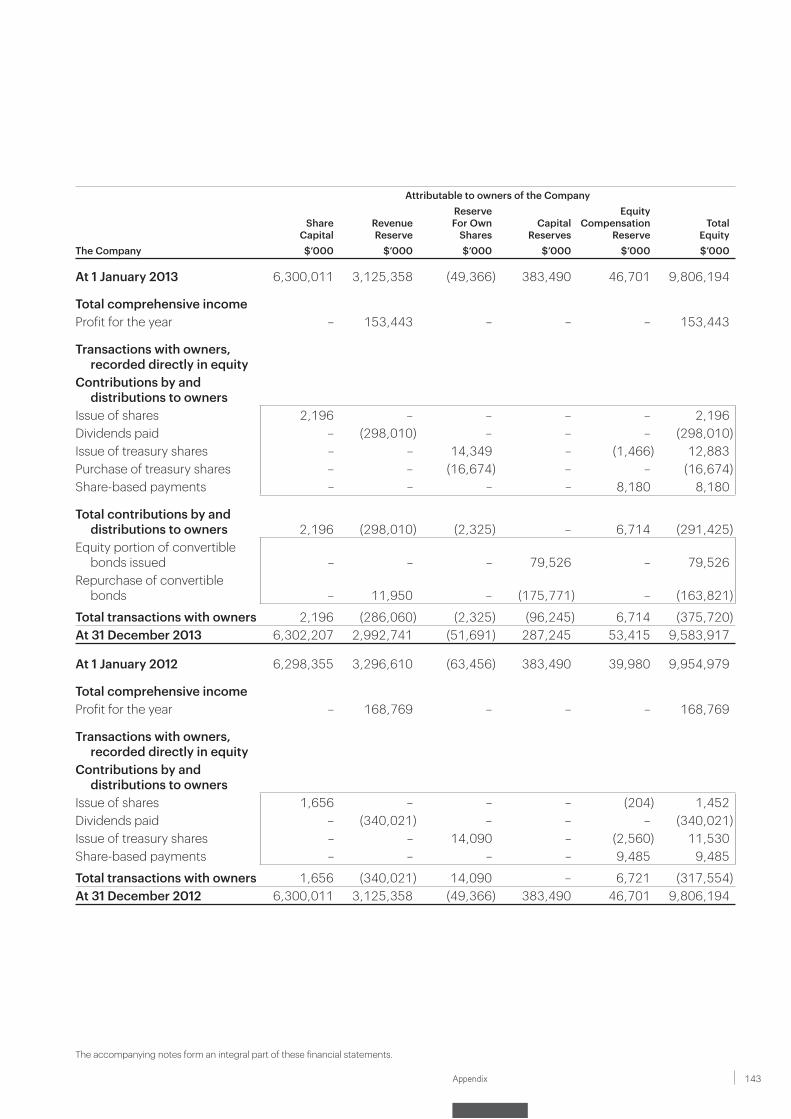
143Appendix
The accompanying notes form an integral part of these financial statements.
Attributable to owners of the Company
ShareCapital
Revenue Reserve
Reserve For Own
SharesCapital
Reserves
Equity Compensation
ReserveTotal
EquityThe Company $’000 $’000 $’000 $’000 $’000 $’000
At 1 January 2013 6,300,011 3,125,358 (49,366) 383,490 46,701 9,806,194
Total comprehensive incomeProfit for the year – 153,443 – – – 153,443
Transactions with owners, recorded directly in equity
Contributions by and distributions to owners
Issue of shares 2,196 – – – – 2,196Dividends paid – (298,010) – – – (298,010)Issue of treasury shares – – 14,349 – (1,466) 12,883Purchase of treasury shares – – (16,674) – – (16,674)Share-based payments – – – – 8,180 8,180
Total contributions by and distributions to owners 2,196 (298,010) (2,325) – 6,714 (291,425)
Equity portion of convertible bonds issued – – – 79,526 – 79,526
Repurchase of convertible bonds – 11,950 – (175,771) – (163,821)
Total transactions with owners 2,196 (286,060) (2,325) (96,245) 6,714 (375,720)At 31 December 2013 6,302,207 2,992,741 (51,691) 287,245 53,415 9,583,917
At 1 January 2012 6,298,355 3,296,610 (63,456) 383,490 39,980 9,954,979
Total comprehensive incomeProfit for the year – 168,769 – – – 168,769
Transactions with owners, recorded directly in equity
Contributions by and distributions to owners
Issue of shares 1,656 – – – (204) 1,452Dividends paid – (340,021) – – – (340,021)Issue of treasury shares – – 14,090 – (2,560) 11,530Share-based payments – – – – 9,485 9,485
Total transactions with owners 1,656 (340,021) 14,090 – 6,721 (317,554)At 31 December 2012 6,300,011 3,125,358 (49,366) 383,490 46,701 9,806,194
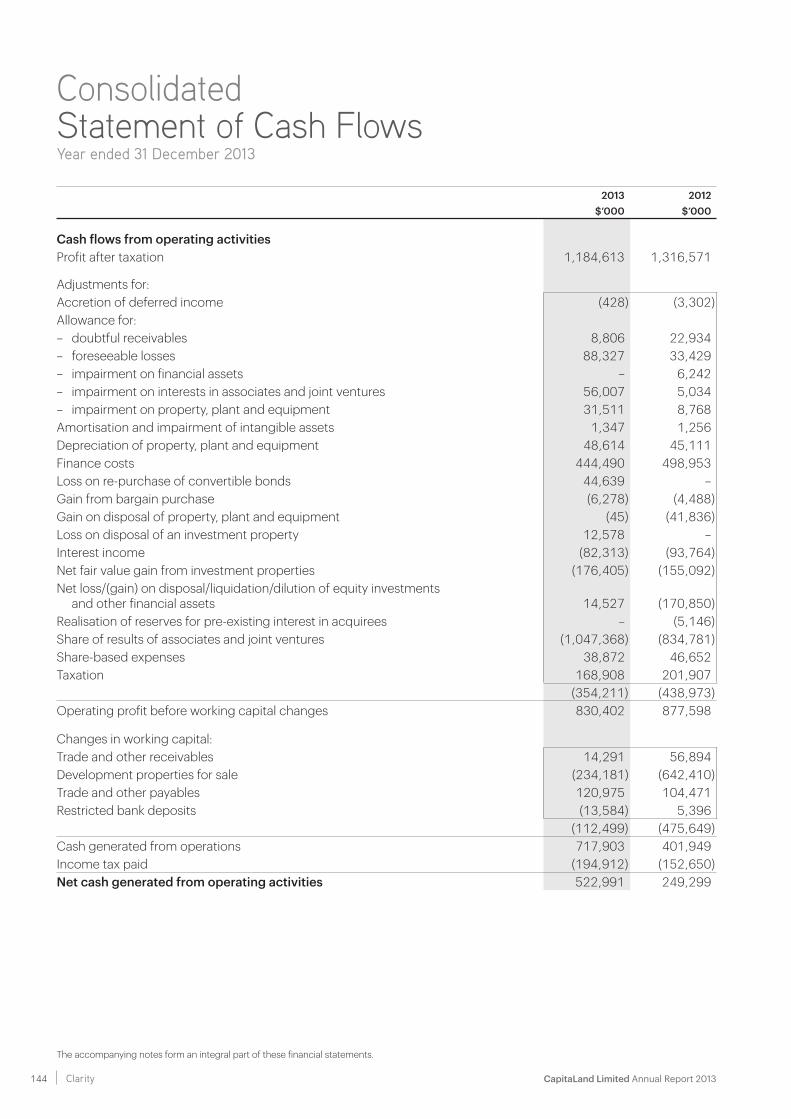
CapitaLand Limited Annual Report 2013 144 Clarity
The accompanying notes form an integral part of these financial statements.
2013 2012$’000 $’000
Cash flows from operating activitiesProfit after taxation 1,184,613 1,316,571
Adjustments for:Accretion of deferred income (428) (3,302)Allowance for:– doubtful receivables 8,806 22,934– foreseeable losses 88,327 33,429– impairment on financial assets – 6,242– impairment on interests in associates and joint ventures 56,007 5,034– impairment on property, plant and equipment 31,511 8,768Amortisation and impairment of intangible assets 1,347 1,256Depreciation of property, plant and equipment 48,614 45,111Finance costs 444,490 498,953Loss on re-purchase of convertible bonds 44,639 –Gain from bargain purchase (6,278) (4,488)Gain on disposal of property, plant and equipment (45) (41,836)Loss on disposal of an investment property 12,578 –Interest income (82,313) (93,764)Net fair value gain from investment properties (176,405) (155,092)Net loss/(gain) on disposal/liquidation/dilution of equity investments
and other financial assets 14,527 (170,850)Realisation of reserves for pre-existing interest in acquirees – (5,146)Share of results of associates and joint ventures (1,047,368) (834,781)Share-based expenses 38,872 46,652Taxation 168,908 201,907
(354,211) (438,973)Operating profit before working capital changes 830,402 877,598
Changes in working capital:Trade and other receivables 14,291 56,894Development properties for sale (234,181) (642,410)Trade and other payables 120,975 104,471Restricted bank deposits (13,584) 5,396
(112,499) (475,649)Cash generated from operations 717,903 401,949Income tax paid (194,912) (152,650)Net cash generated from operating activities 522,991 249,299
Consolidated Statement of Cash FlowsYear ended 31 December 2013
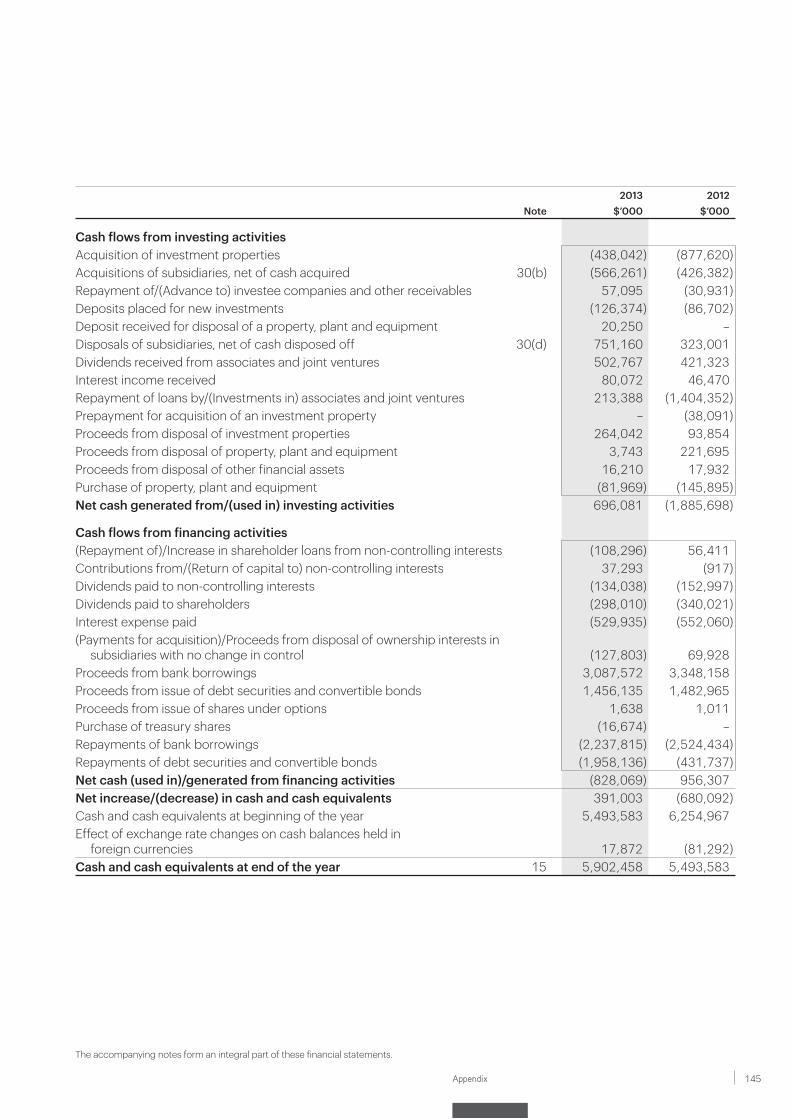
145Appendix
The accompanying notes form an integral part of these financial statements.
2013 2012Note $’000 $’000
Cash flows from investing activitiesAcquisition of investment properties (438,042) (877,620)Acquisitions of subsidiaries, net of cash acquired 30(b) (566,261) (426,382)Repayment of/(Advance to) investee companies and other receivables 57,095 (30,931)Deposits placed for new investments (126,374) (86,702)Deposit received for disposal of a property, plant and equipment 20,250 –Disposals of subsidiaries, net of cash disposed off 30(d) 751,160 323,001Dividends received from associates and joint ventures 502,767 421,323Interest income received 80,072 46,470Repayment of loans by/(Investments in) associates and joint ventures 213,388 (1,404,352)Prepayment for acquisition of an investment property – (38,091)Proceeds from disposal of investment properties 264,042 93,854Proceeds from disposal of property, plant and equipment 3,743 221,695Proceeds from disposal of other financial assets 16,210 17,932Purchase of property, plant and equipment (81,969) (145,895)Net cash generated from/(used in) investing activities 696,081 (1,885,698)
Cash flows from financing activities(Repayment of)/Increase in shareholder loans from non-controlling interests (108,296) 56,411Contributions from/(Return of capital to) non-controlling interests 37,293 (917)Dividends paid to non-controlling interests (134,038) (152,997)Dividends paid to shareholders (298,010) (340,021)Interest expense paid (529,935) (552,060)(Payments for acquisition)/Proceeds from disposal of ownership interests in
subsidiaries with no change in control (127,803) 69,928Proceeds from bank borrowings 3,087,572 3,348,158Proceeds from issue of debt securities and convertible bonds 1,456,135 1,482,965Proceeds from issue of shares under options 1,638 1,011Purchase of treasury shares (16,674) –Repayments of bank borrowings (2,237,815) (2,524,434)Repayments of debt securities and convertible bonds (1,958,136) (431,737)Net cash (used in)/generated from financing activities (828,069) 956,307Net increase/(decrease) in cash and cash equivalents 391,003 (680,092)Cash and cash equivalents at beginning of the year 5,493,583 6,254,967Effect of exchange rate changes on cash balances held in foreign currencies 17,872 (81,292)Cash and cash equivalents at end of the year 15 5,902,458 5,493,583
CapitaLand Limited Annual Report 2013 146 Clarity
These notes form an integral part of the financial statements.
The financial statements were authorised for issue by the Board of Directors on 28 February 2014.
1 DOMICILE AND ACTIVITIES CapitaLand Limited (the Company) is incorporated in the Republic of Singapore and has its registered office at
168 Robinson Road, #30-01, Capital Tower, Singapore 068912.
The principal activities of the Company during the financial year are those relating to investment holding and consultancy services as well as the corporate headquarters which gives direction, provides management support services and integrates the activities of its subsidiaries.
The principal activities of the significant subsidiaries are those relating to investment holding, real estate development, investment in real estate financial products and real estate assets, investment advisory and management services as well as management of serviced residences.
The consolidated financial statements relate to the Company and its subsidiaries (the Group) and the Group’s interests in associates and joint ventures.
2 SUMMARY OF SIGNIFICANT ACCOUNTING POLICIES(a) Basis of preparation The financial statements have been prepared in accordance with the Singapore Financial Reporting
Standards (FRS).
The financial statements have been prepared on the historical cost basis except as disclosed in the accounting policies below.
These financial statements are presented in Singapore Dollars, which is the Company’s functional currency. All financial information presented in Singapore Dollars have been rounded to the nearest thousand, unless otherwise stated.
The preparation of the financial statements in conformity with FRSs requires management to make judgements, estimates and assumptions that affect the application of accounting policies and the reported amounts of assets, liabilities, income and expenses. Actual results may differ from these estimates.
Estimates and underlying assumptions are reviewed on an ongoing basis. Revisions to accounting estimates are recognised in the period in which the estimates are revised and in any future periods affected.
Information about critical judgements in applying accounting policies that have the most significant effect on the amount recognised in the financial statements are described in the following notes:
Note 9 – recognition of deferred tax assets
Note 2(f), Note 5 – classification of investment properties
Notes to the Financial StatementsYear ended 31 December 2013
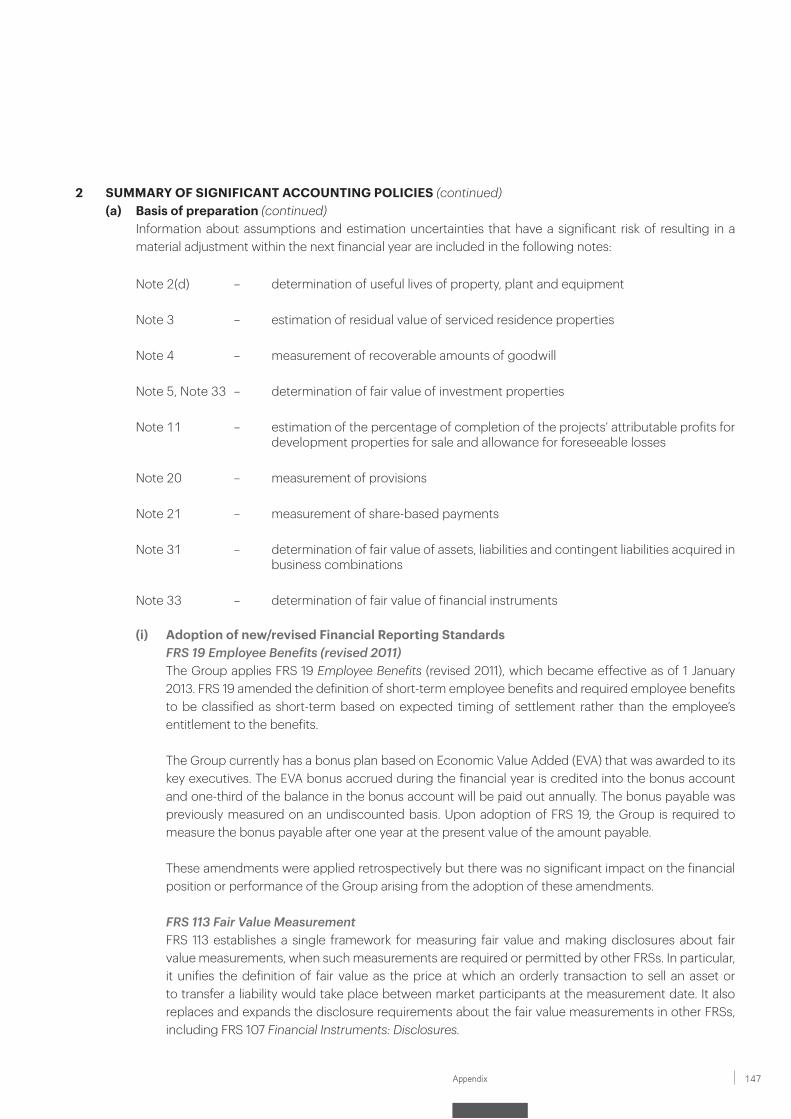
147Appendix
2 SUMMARY OF SIGNIFICANT ACCOUNTING POLICIES (continued)(a) Basis of preparation (continued) Information about assumptions and estimation uncertainties that have a significant risk of resulting in a
material adjustment within the next financial year are included in the following notes:
Note 2(d) – determination of useful lives of property, plant and equipment
Note 3 – estimation of residual value of serviced residence properties
Note 4 – measurement of recoverable amounts of goodwill
Note 5, Note 33 – determination of fair value of investment properties
Note 11 – estimation of the percentage of completion of the projects’ attributable profits for development properties for sale and allowance for foreseeable losses
Note 20 – measurement of provisions
Note 21 – measurement of share-based payments
Note 31 – determination of fair value of assets, liabilities and contingent liabilities acquired in business combinations
Note 33 – determination of fair value of financial instruments
(i) Adoption of new/revised Financial Reporting StandardsFRS 19 Employee Benefits (revised 2011)
The Group applies FRS 19 Employee Benefits (revised 2011), which became effective as of 1 January 2013. FRS 19 amended the definition of short-term employee benefits and required employee benefits to be classified as short-term based on expected timing of settlement rather than the employee’s entitlement to the benefits.
The Group currently has a bonus plan based on Economic Value Added (EVA) that was awarded to its key executives. The EVA bonus accrued during the financial year is credited into the bonus account and one-third of the balance in the bonus account will be paid out annually. The bonus payable was previously measured on an undiscounted basis. Upon adoption of FRS 19, the Group is required to measure the bonus payable after one year at the present value of the amount payable.
These amendments were applied retrospectively but there was no significant impact on the financial position or performance of the Group arising from the adoption of these amendments.
FRS 113 Fair Value Measurement FRS 113 establishes a single framework for measuring fair value and making disclosures about fair
value measurements, when such measurements are required or permitted by other FRSs. In particular, it unifies the definition of fair value as the price at which an orderly transaction to sell an asset or to transfer a liability would take place between market participants at the measurement date. It also replaces and expands the disclosure requirements about the fair value measurements in other FRSs, including FRS 107 Financial Instruments: Disclosures.
CapitaLand Limited Annual Report 2013 148 Clarity
Notes to the Financial Statements
2 SUMMARY OF SIGNIFICANT ACCOUNTING POLICIES (continued)(a) Basis of preparation (continued)
(i) Adoption of new/revised Financial Reporting Standards (continued)FRS 113 Fair Value Measurement (continued)
From 1 January 2013, in accordance with the transitional provisions of FRS 113, the Group has applied the new fair value measurement guidance prospectively, and has not provided any comparative information for new disclosures. Notwithstanding the above, the change had no significant impact on the measurements of the Group’s assets and liabilities. The additional disclosure required as a result of the adoption of this standard has been included in note 33.
Amendments to FRS 1 Presentation of Financial Statements From 1 January 2013, as a result of the amendments to FRS 1 Presentation of Financial Statements,
the Group has modified the presentation of items of other comprehensive income in its consolidated statement of comprehensive income, to present separately items that would be reclassified to profit or loss in the future from those that would never be. Comparative information has also been re-presented accordingly. The adoption of the amendments to FRS 1 has no impact on the recognised assets, liabilities and comprehensive income of the Group.
Except for the above changes, the accounting policies set out below have been applied consistently by the Group to all periods presented in these financial statements and have been applied consistently by the entities in the Group.
(b) Basis of consolidation(i) Business combinations Business combinations are accounted for using the acquisition method as at the acquisition date,
which is the date on which control is transferred to the Group. Control is the power to govern the financial and operating policies of an entity so as to obtain benefits from its activities. In assessing control, the Group takes into consideration potential voting rights that are currently exercisable.
The consideration transferred does not include amounts related to the settlement of pre-existing relationships. Such amounts are generally recognised in the profit or loss.
Any contingent consideration payable is recognised at fair value at the acquisition date and included in the consideration transferred. If the contingent consideration is classified as equity, it is not re-measured and settlement is accounted for within equity. Otherwise, subsequent changes to the fair value of the contingent consideration are recognised in the profit or loss.
Costs related to the acquisition, other than those associated with the issue of debt or equity securities,
that the Group incurs in connection with a business combination are expensed as incurred.
Non-controlling interests that are present ownership interests and entitle their holders to a proportionate share of the acquiree’s net assets in the event of liquidation are measured either at fair value or at the non-controlling interests’ proportionate share of the recognised amounts of the acquiree’s identifiable net assets, at the acquisition date. The measurement basis taken is elected on a transaction-by-transaction basis. All other non-controlling interests are measured at acquisition-date fair value, unless another measurement basis is required by FRSs. If the business combination is achieved in stages, the Group’s previously held equity interest in the acquiree is re-measured to fair value at each acquisition date and any changes are taken to the profit or loss.
149Appendix
2 SUMMARY OF SIGNIFICANT ACCOUNTING POLICIES (continued)(b) Basis of consolidation (continued)
(ii) Subsidiaries Subsidiaries are entities controlled by the Group. The financial statements of subsidiaries are included
in the consolidated financial statements from the date that control commences until the date that control ceases. Losses applicable to the non-controlling interests in a subsidiary are allocated to the non-controlling interests even if this results in the non-controlling interests having a deficit balance.
Changes in the Group’s interests in subsidiaries that do not result in a loss of control are accounted for as transactions with owners and therefore no adjustments are made to goodwill and no gain or loss is recognised in profit or loss. Upon the loss of control of a subsidiary, the Group derecognises the assets and liabilities of the subsidiary, any non-controlling interests and the other components of equity related to the subsidiary. Any surplus or deficit arising from the loss of control is recognised in the profit or loss. If the Group retains any interest in the previous subsidiary, then such interest is measured at fair value at the date that control is lost. Subsequently, it is accounted for as an equity-accounted investee or as an available-for-sale financial asset depending on the level of influence retained.
(iii) Associates and joint ventures Associates are those entities in which the Group has significant influence, but not control, over their
financial and operating policies of these entities. Significant influence is presumed to exist when the Group holds between 20% and 50% of the voting power of another entity. Joint ventures are entities over whose activities the Group has joint control, established by contractual agreement and requiring unanimous consent for strategic financial and operating decisions.
Associates and joint ventures are accounted for using the equity method (collectively referred to as equity-accounted investees) and are recognised initially at cost. The cost of the investments includes transaction costs. The Group’s investments in equity-accounted investees include goodwill identified on acquisition, net of any accumulated impairment losses. The consolidated financial statements include the Group’s share of the profit or loss and other comprehensive income of the equity-accounted investees, after adjustments to align the accounting policies of the equity-accounted investees with those of the Group, from the date that significant influence or joint control commences until the date that significant influence or joint control ceases.
When the Group’s share of losses exceeds its interest in an equity-accounted investee, the carrying
amount of the investment, together with any long-term interests that form part thereof, is reduced to zero and the recognition of further losses is discontinued except to the extent that the Group has an obligation to fund the investee’s operation or has made payments on behalf of the investee.
(iv) Transactions eliminated on consolidation Intra-group balances and transactions, and any unrealised income and expenses arising from intra-
group transactions, are eliminated in preparing the consolidated financial statements. Unrealised gains arising from transactions with equity-accounted investees are eliminated against the investment to the extent of the Group’s interest in the investee. Unrealised losses are eliminated in the same way as unrealised gains, but only to the extent that there is no evidence of impairment.
CapitaLand Limited Annual Report 2013 150 Clarity
Notes to the Financial Statements
2 SUMMARY OF SIGNIFICANT ACCOUNTING POLICIES (continued)(b) Basis of consolidation (continued)
(v) Accounting for subsidiaries, associates and joint ventures by the Company Investments in subsidiaries, associates and joint ventures are stated in the Company’s balance sheet
at cost less accumulated impairment losses.
(c) Foreign currenciesForeign currency transactions
Items included in the financial statements of each entity in the Group are measured using the currency that best reflects the economic substance of the underlying events and circumstances relevant to that entity (the functional currency).
Transactions in foreign currencies are translated to the respective functional currencies of the Group’s entities at the exchange rates at the dates of the transactions. Monetary assets and liabilities denominated in foreign currencies at the end of the reporting period are retranslated to the functional currency at the exchange rate prevailing at that date. Non-monetary assets and liabilities denominated in foreign currencies that are measured at fair value are retranslated to the functional currency at the exchange rate at the date on which the fair value was determined. Non-monetary items in a foreign currency that are measured in terms of historical cost are translated using the exchange rate at the date of the transaction.
Foreign currency differences arising from retranslation are recognised in the profit or loss, except for differences arising from the retranslation of monetary items that in substance form part of the Group’s net investment in a foreign operation, available-for-sale equity instruments and financial liabilities designated as hedges of net investment in a foreign operation (see note 2(g)) or qualifying cash flow hedges to the extent such hedges are effective, which are recognised in other comprehensive income.
Foreign operations The assets and liabilities of foreign operations, excluding goodwill and fair value adjustments arising on
acquisitions, are translated to Singapore Dollars at exchange rates prevailing at the end of the reporting period. The income and expenses of foreign operations are translated to Singapore Dollars at exchange rates prevailing at the dates of the transactions. Goodwill and fair value adjustments arising from the acquisition of a foreign operation are treated as assets and liabilities of the foreign operation and translated at the exchange rates at the end of the reporting period.
Foreign currency differences are recognised in other comprehensive income, and presented in the foreign currency translation reserve (translation reserve) in equity. However, if the foreign operation is not a wholly-owned subsidiary, then the relevant proportionate share of the translation difference is allocated to the non-controlling interests. When a foreign operation is disposed off such that control, significant influence or joint control is lost, the cumulative amount in the translation reserve related to that foreign operation is transferred to the profit or loss as part of the gain or loss on disposal. When the Group disposes off only part of its interest in a subsidiary that includes a foreign operation while retaining control, the relevant proportion of the cumulative amount is reattributed to non-controlling interests. When the Group disposes off only part of its investment in an associate or joint venture that includes a foreign operation while retaining significant influence or joint control, the relevant proportion of the cumulative amount is transferred to the profit or loss.
151Appendix
2 SUMMARY OF SIGNIFICANT ACCOUNTING POLICIES (continued)(c) Foreign currencies (continued)
Net investment in a foreign operation When the settlement of a monetary item receivable from or payable to a foreign operation is neither planned
nor likely to occur in the foreseeable future, foreign exchange gains and losses arising from such a monetary item are considered to form part of a net investment in a foreign operation. These are recognised in other comprehensive income and are presented in the translation reserve in equity.
(d) Property, plant and equipment Property, plant and equipment are measured at cost less accumulated depreciation and accumulated
impairment losses. Cost includes expenditure that is directly attributable to the acquisition of the asset. Certain of the Group’s property, plant and equipment acquired through interests in subsidiaries, are accounted for as acquisition of assets.
Subsequent expenditure relating to property, plant and equipment that has already been recognised is added to the carrying amount of the asset if it is probable that future economic benefits, in excess of the originally assessed standard of performance of the existing asset, will flow to the Group and its cost can be measured reliably. All other subsequent expenditure is recognised as an expense in the period in which it is incurred.
Depreciation is recognised from the date that the property, plant and equipment are installed and are ready
for use. Depreciation on property, plant and equipment is recognised in the profit or loss on a straight-line basis over the estimated useful lives of each component of an item of property, plant and equipment as follows:
Leasehold land and buildings Lease period ranging from (excluding serviced residence properties) 30 years to 50 years Hospitality plant, machinery and improvements, furniture, fittings and equipment 1 to 10 years Plant, machinery and improvements 3 to 10 years Motor vehicles 5 years Furniture, fittings and equipment 2 to 5 years
For serviced residence properties where the residual value at the end of the intended holding period is lower than the carrying amount, the difference in value is depreciated over the Group’s intended holding period. The intended holding period (the period from the date of commencement of serviced residence operations to the date of expected strategic divestment of the properties) ranges from three to nine years. No depreciation is recognised where the residual value is higher than the carrying amount.
Assets under construction are stated at cost and are not depreciated. Expenditure relating to assets under construction (including borrowing costs) are capitalised when incurred. Depreciation will commence when the development is completed.
The assets’ residual values, useful lives and depreciation methods are reviewed at each reporting date, and adjusted if appropriate.
CapitaLand Limited Annual Report 2013 152 Clarity
Notes to the Financial Statements
2 SUMMARY OF SIGNIFICANT ACCOUNTING POLICIES (continued)(e) Intangible assets
(i) GoodwillAcquisition on or after 1 January 2010
For business combinations on or after 1 January 2010, the Group measures goodwill as at acquisition date based on the fair value of the consideration transferred (including the fair value of any pre-existing equity interest in the acquiree) and the recognised amount of any non-controlling interests in the acquiree, less the net recognised amount (generally fair value) of the identifiable assets acquired and liabilities assumed. When the amount is negative, a bargain purchase gain is recognised in the profit or loss. Goodwill is subsequently measured at cost less accumulated impairment losses.
Goodwill arising from the acquisition of subsidiaries is included in intangible assets. Goodwill arising from the acquisition of associates and joint ventures is presented together with interests in associates and joint ventures.
Acquisition up to 31 December 2009 Prior to 1 January 2010, goodwill is measured at cost less accumulated impairment losses. Goodwill is
tested for impairment as described in note 2(j). Negative goodwill is credited to the profit or loss in the period of the acquisition.
Acquisition of non-controlling interests From 1 January 2010, acquisitions of non-controlling interests are accounted for as transactions with
owners in their capacity as owners and therefore no goodwill is recognised. Previously, goodwill arising on the acquisition of non-controlling interests in a subsidiary has been recognised, and represented the excess of the cost of the additional investment over the carrying amount of the interest in the net assets acquired at the date of the transaction.
(ii) Other intangible assets Other intangible assets with finite useful lives are measured at cost less accumulated amortisation and
accumulated impairment losses. These are amortised in the profit or loss on a straight-line basis over their estimated useful lives of one to 10 years, from the date on which the assets are available for use.
Other intangible assets with indefinite useful lives are not amortised and are measured at cost less accumulated impairment losses.
(f) Investment properties and investment properties under development Investment properties are properties held either to earn rental or for capital appreciation or both. Investment
properties under development are properties being constructed or developed for future use as investment properties. Certain of the Group’s investment properties acquired through interests in subsidiaries, are accounted for as acquisition of assets. Investment properties and investment properties under development are initially recognised at cost, including transaction costs, and subsequently at fair value with any change therein recognised in the profit or loss. Cost includes expenditure that is directly attributable to the acquisition of the investment property. The cost of self-constructed investment property includes the cost of materials and direct labour, any other costs directly attributable to bringing the investment property to a working condition for their intended use and capitalised borrowing costs. The fair value is determined based on internal valuation or independent professional valuation. Independent professional valuation is obtained at least once every three years.
153Appendix
2 SUMMARY OF SIGNIFICANT ACCOUNTING POLICIES (continued)(f) Investment properties and investment properties under development (continued) When an investment property or investment property under development is disposed off, the resulting gain
or loss recognised in the profit or loss is the difference between the net disposal proceed and the carrying amount of the property.
Transfers to, or from, investment properties are made where there is a change in use, evidenced by:• development with a view to sell, for a transfer from investment properties to development properties
for sale;• commencement of owner-occupation, for a transfer from investment properties to property, plant and
equipment; and• end of owner-occupation, for a transfer from property, plant and equipment to investment properties.
(g) Financial instruments(i) Non-derivative financial assets Non-derivative financial assets comprise investments in equity and debt securities, trade and other
receivables and cash and cash equivalents. A financial asset is recognised if the Group becomes a party to the contractual provisions of the
financial asset. Financial assets are derecognised if the Group’s contractual rights to the cash flows from the financial assets expire or if the Group transfers the financial assets to another party without retaining control or transfers substantially all the risks and rewards of the assets. Regular way purchases and sales of financial assets are accounted for at trade date, i.e., the date that the Group commits itself to purchase or sell the asset.
Financial assets and liabilities are offset and the net amount presented in the statement of financial position when, and only when, the Group has a legal right to offset the amounts and intends either to settle on a net basis or to realise the asset and settle the liability simultaneously.
Financial assets at fair value through profit or loss A financial asset is classified as fair value through profit or loss if it is held for trading or is designated
as such upon initial recognition. Financial assets are designated as fair value through profit or loss if the Group manages such investments and makes purchase and sale decisions based on their fair value. Upon initial recognition, attributable transaction costs are recognised in the profit or loss when incurred. Financial assets at fair value through profit or loss are measured at fair value, and changes therein, which takes into account any dividend income, are recognised in the profit or loss.
Available-for-sale financial assets The Group’s investments in equity securities and certain debt securities are classified as available-for-
sale financial assets and are recognised initially at fair value plus any directly attributable transaction costs. Subsequent to initial recognition, they are measured at fair value and changes therein, other than for impairment losses (see note 2(g)(v)) and foreign exchange gains and losses on available-for-sale monetary items (see note 2(c)), are recognised directly in other comprehensive income and presented in the available-for-sale reserve in equity. When an investment is derecognised, the cumulative gain or loss in equity is reclassified to the profit or loss.
Investments in equity securities whose fair value cannot be reliably measured are measured at cost less accumulated impairment loss.
CapitaLand Limited Annual Report 2013 154 Clarity
Notes to the Financial Statements
2 SUMMARY OF SIGNIFICANT ACCOUNTING POLICIES (continued)(g) Financial instruments (continued)
(i) Non-derivative financial assets (continued)Loans and receivables
Loans and receivables are financial assets with fixed or determinable payments that are not quoted in an active market. Such assets are recognised initially at fair value plus any directly attributable transaction costs. Subsequent to initial recognition, loans and receivables are measured at amortised cost using the effective interest method, less any impairment losses. Loans and receivables comprise cash and cash equivalents, and trade and other receivables.
Cash and cash equivalents Cash and cash equivalents comprise cash balances and bank deposits. For the purpose of the
statement of cash flows, pledged deposits are excluded whilst bank overdrafts that are repayable on demand and form an integral part of the Group’s cash management are included as a component of cash and cash equivalents.
Non-derivative financial liabilities The Group initially recognises debt securities issued and subordinated liabilities on the date that they
are originated. Financial liabilities for contingent consideration payable in a business combination are recognised at the acquisition date. All other financial liabilities (including liabilities designated at fair value through profit or loss) are recognised initially on the trade date, which is the date that the Group becomes a party to the contractual provisions of the instrument.
The Group derecognises a financial liability when its contractual obligations are discharged, cancelled or expired.
Financial liabilities for contingent consideration payable in a business combination are initially measured at fair value. Subsequent changes in the fair value of the contingent consideration are recognised in profit or loss.
Financial assets and liabilities are offset and the net amount presented in the statement of financial position when, and only when, the Group has a legal right to offset the amounts and intends either to settle on a net basis or to realise the asset and settle the liability simultaneously.
The Group classifies non-derivative financial liabilities under the other financial liabilities category. Such financial liabilities are recognised initially at fair value plus any directly attributable transaction costs. Subsequent to initial recognition, these financial liabilities are measured at amortised cost using the effective interest rate method.
Other financial liabilities comprise loans and borrowings and trade and other payables.
(ii) Derivative financial instruments and hedging activities The Group holds derivative financial instruments to hedge its foreign currency and interest rate risk
exposures. Embedded derivatives are separated from the host contract and accounted for separately if the economic characteristics and risks of the host contract and the embedded derivative are not closely related, a separate instrument with the same terms as the embedded derivative would meet the definition of a derivative, and the combined instrument is not measured at fair value through profit or loss.
155Appendix
2 SUMMARY OF SIGNIFICANT ACCOUNTING POLICIES (continued)(g) Financial instruments (continued)
(ii) Derivative financial instruments and hedging activities (continued) On initial designation of the derivative as the hedging instrument, the Group formally documents
the relationship between the hedging instrument and hedged item, including the risk management objectives and strategy in undertaking the hedge transaction and the hedged risk, together with the methods that will be used to assess the effectiveness of the hedging relationship. The Group makes an assessment, both at the inception of the hedge relationship as well as on an ongoing basis, of whether the hedging instruments are expected to be highly effective in offsetting the changes in the fair value or cash flows of the respective hedged items attributable to the hedged risk, and whether the actual results of each hedge are within a range of 80%-125%. For a cash flow hedge of a forecast transaction, the transaction should be highly probable to occur and should present an exposure to variations in cash flows that could ultimately affect reported profit or loss.
Derivatives are recognised initially at fair value; attributable transaction costs are recognised in the profit or loss when incurred. Subsequent to initial recognition, derivatives are measured at fair value, and changes therein are accounted for as described below.
Cash flow hedges Changes in the fair value of the derivative hedging instrument designated as a cash flow hedge are
recognised directly in other comprehensive income and presented in the hedging reserve in equity to the extent that the hedge is effective. Any ineffective portion of changes in the fair value of the derivative is recognised immediately in the profit or loss. If the hedging instrument no longer meets the criteria for hedge accounting, expires or is sold, terminated or exercised, hedge accounting is discontinued prospectively. If the forecast transaction is no longer expected to occur, then the balance is reclassified to profit or loss.
When the hedged item is a non-financial asset, the amount accumulated in equity is included in the carrying amount of the asset when the asset is recognised. In other cases, the amount accumulated in equity is reclassified to the profit or loss in the same period that the hedged item affects profit or loss.
Fair value hedges Changes in the fair value of a derivative hedging instrument designated as a fair value hedge are
recognised in the profit or loss. The hedged item is adjusted to reflect change in its fair value in respect of the risk being hedged, with any gain or loss being recognised in the profit or loss.
Hedge of net investment in a foreign operation In the Company’s financial statements, foreign currency differences arising from the retranslation of
a financial liability designated as a hedge of a net investment in a foreign operation are recognised in the profit or loss. On consolidation, such differences are recognised directly in other comprehensive income and presented in the foreign currency translation reserve in equity, to the extent that the hedge is effective. To the extent that the hedge is ineffective, such differences are recognised in the profit or loss. When the hedged net investment is disposed off, the cumulative amount in other comprehensive income is transferred to the profit or loss.
CapitaLand Limited Annual Report 2013 156 Clarity
Notes to the Financial Statements
2 SUMMARY OF SIGNIFICANT ACCOUNTING POLICIES (continued)(g) Financial instruments (continued)
(ii) Derivative financial instruments and hedging activities (continued)Separable embedded derivatives
Changes in the fair value of separated embedded derivatives are recognised immediately in the profit or loss.
Other non-trading derivatives When a derivative financial instrument is not designated in a hedge relationship that qualifies for hedge
accounting, all changes in its fair value are recognised immediately in the profit or loss.
(iii) Convertible bonds Convertible bonds that can be converted into share capital where the number of shares issued does not
vary with changes in the fair value of the bonds are accounted for as compound financial instruments. The gross proceeds are allocated to the equity and liability components, with the equity component being assigned the residual amount after deducting the fair value of the liability component from the fair value of the compound financial instrument.
Subsequent to initial recognition, the liability component of convertible bonds is measured at amortised cost using the effective interest method. The equity component of convertible bonds is not re-measured. When the conversion option is exercised, its carrying amount will be transferred to the share capital. When the conversion option lapses, its carrying amount will be transferred to revenue reserve.
When a convertible bond is being repurchased before its maturity date, the purchase consideration (including directly attributable costs, net of tax effects) is allocated to the liability and equity components of the instrument at the date of transaction. Any resulting gain or loss relating to the liability component is recognised in the profit or loss. In an exchange of convertible bond, the difference between the net proceeds of new convertible bond and the carrying value of the existing convertible bond (including its equity component) is recognised in the profit or loss.
(iv) Financial guarantees Financial guarantee contracts are classified as financial liabilities unless the Group or the Company has
previously asserted explicitly that it regards such contracts as insurance contracts and accounted for them as such.
Financial guarantees classified as financial liabilities Such financial guarantees are recognised initially at fair value and are classified as financial liabilities.
Subsequent to initial measurement, the financial guarantees are stated at the higher of the initial fair value less cumulative amortisation and the amount that would be recognised if they were accounted for as contingent liabilities. When financial guarantees are terminated before their original expiry date, the carrying amount of the financial guarantees is transferred to the profit or loss.
Financial guarantees classified as insurance contracts These financial guarantees are accounted for as insurance contracts. Provision is recognised based on
the Group’s or the Company’s estimate of the ultimate cost of settling all claims incurred but unpaid at the end of the reporting period.
157Appendix
2 SUMMARY OF SIGNIFICANT ACCOUNTING POLICIES (continued)(g) Financial instruments (continued)
(iv) Financial guarantees (continued)Financial guarantees classified as insurance contracts (continued)
The provision is assessed by reviewing individual claims and tested for adequacy by comparing the amount recognised and the amount that would be required to settle the guarantee contract.
(v) Impairment of financial assets A financial asset not carried at fair value through profit or loss is assessed at each reporting period
to determine whether there is any objective evidence that it is impaired. A financial asset is impaired if objective evidence indicates that a loss event has been occurred after the initial recognition of the asset, and that the loss event had a negative effect on the estimated future cash flows of that asset that can be estimated reliably. Objective evidence that financial assets (including equity securities) are impaired can include default or delinquency by a debtor, restructuring of an amount due to the Group on terms that the Group would not consider otherwise, indications that a debtor or issuer will enter bankruptcy, adverse changes in the payment status of borrowers or issuers in the group, economic conditions that correlate with defaults or the disappearance of an active market for a security.
All individually significant financial assets are assessed for specific impairment on an individual basis. All individually significant financial assets found not to be specifically impaired are then collectively assessed for any impairment that has incurred but not yet identified. The remaining financial assets that are not individually significant are collectively assessed for impairment by grouping together such instruments with similar risk characteristics.
In assessing collective impairment, the Group uses historical trends of the probability of default, timing of recoveries and the amount of loss incurred, adjusted for management’s judgement as to whether current economic and credit conditions are such that the actual losses are likely to be greater or lesser than that suggested by historical trends.
An impairment loss in respect of a financial asset measured at amortised cost is calculated as the difference between its carrying amount, and the present value of the estimated future cash flows discounted at the original effective interest rate. Losses are recognised in the profit or loss and reflected as an allowance account against receivables. When a subsequent event causes the amount of impairment loss to decrease, the decrease in impairment loss is reversed through profit or loss.
Impairment losses on available-for-sale financial assets are recognised by reclassifying the losses accumulated in the available-for-sale reserve in equity to profit or loss. The cumulative loss that is reclassified from equity to profit or loss is the difference between the acquisition cost, net of any principal repayment and amortisation, and the current fair value, less any impairment loss recognised previously in the profit or loss. Changes in impairment provision attributable to application of the effective interest method are reflected as a component of interest income.
If, in a subsequent period, the fair value of an impaired available-for-sale debt security increases and the increase can be related objectively to an event occurring after the impairment loss was recognised in the profit or loss, then the impairment loss is reversed, with the amount of the reversal recognised in the profit or loss. However, any subsequent recovery in the fair value of an impaired available-for-sale equity security is recognised in other comprehensive income.
CapitaLand Limited Annual Report 2013 158 Clarity
Notes to the Financial Statements
2 SUMMARY OF SIGNIFICANT ACCOUNTING POLICIES (continued)(h) Share capital Ordinary shares are classified as equity.
Incremental costs directly attributable to the issue of ordinary shares and options are recognised as a deduction from equity.
Where share capital recognised as equity is repurchased (treasury shares), the amount of the consideration paid, including directly attributable costs, is recognised as a deduction from equity. Repurchased shares are classified as treasury shares and are presented in reserve for own shares account. Where treasury shares are subsequently reissued, sold or cancelled, the consideration received is recognised as an increase in equity, and the resulting surplus or deficit on the transaction is presented in non-distributable capital reserve.
(i) Development properties for sale and stocks Development properties for sale and stocks are stated at the lower of cost plus, where appropriate (see
note 2(n)), a portion of the attributable profit, and estimated net realisable value, net of progress billings. Net realisable value represents the estimated selling price less costs to be incurred in selling the property.
The cost of properties under development comprises specifically identified costs, including acquisition costs, development expenditure, borrowing costs and other related expenditure. Borrowing costs payable on loans funding a development property are also capitalised, on a specific identification basis, as part of the cost of the development property until the completion of development.
(j) Impairment of non-financial assets The carrying amounts of the Group’s non-financial assets, other than investment properties, development
properties for sale and stocks and deferred tax assets, are reviewed at each reporting date to determine whether there is any indication of impairment. If any such indication exists, the assets’ recoverable amounts are estimated. For goodwill, the recoverable amount is estimated at each reporting date, and as and when indicators of impairment are identified, an impairment loss is recognised if the carrying amount of an asset or its related cash-generating unit (CGU) exceeds its estimated recoverable amount.
The recoverable amount of an asset or CGU is the greater of its value in use and its fair value less costs to sell. In assessing value in use, the estimated future cash flows are discounted to their present value using a pre-tax discount rate that reflects current market assessments of the time value of money and the risks specific to the asset or CGU. For the purpose of impairment testing, assets that cannot be tested individually are grouped together into the smallest group of assets that generate cash inflows from continuing use that are largely independent of the cash inflows of other assets or CGU. Subject to an operating segment ceiling test, for the purposes of goodwill impairment testing, CGUs to which goodwill has been allocated are aggregated so that the level at which impairment is tested reflects the lowest level at which goodwill is monitored for internal reporting purposes. Goodwill acquired in a business combination is allocated to groups of CGU that are expected to benefit from the synergies of the combination.
159Appendix
2 SUMMARY OF SIGNIFICANT ACCOUNTING POLICIES (continued)(j) Impairment of non-financial assets (continued) An impairment loss is recognised if the carrying amount of an asset or its CGU exceeds its estimated
recoverable amount. Impairment losses are recognised in profit or loss. Impairment losses recognised in respect of CGUs are allocated first to reduce the carrying amount of any goodwill allocated to the units and then to reduce the carrying amounts of the other assets in the unit (group of units) on a pro-rata basis.
An impairment loss in respect of goodwill is not reversed. In respect of other assets, impairment losses recognised in prior periods are assessed at each reporting date for any indication that the loss has decreased or no longer exists. An impairment loss is reversed if there has been a change in the estimates used to determine the recoverable amount. An impairment loss is reversed only to the extent that the asset’s carrying amount does not exceed the carrying amount that would have been determined, net of depreciation or amortisation, if no impairment loss had been recognised.
Goodwill that forms part of the carrying amount of an investment in an associate or a joint venture is not recognised separately, and therefore is not tested for impairment separately. Instead, the entire amount of the investment in an associate or a joint venture is tested for impairment as a single asset when there is objective evidence that the investment in an associate or a joint venture may be impaired.
(k) Employee benefits All short term employee benefits, including accumulated compensated absences, are measured on an
undiscounted basis and are recognised in the period in which the employees render their services.
The Group’s obligation in respect of long-term employee benefits is the amount of future benefit that employees have earned in return for their service in the current and prior periods. That benefit is discounted to determine its present values.
A provision is recognised for the amount expected to be paid under cash bonus or profit-sharing plans if the Group has a present legal or constructive obligation to pay this amount as a result of past service provided by the employee and the obligation can be estimated reliably.
Defined contribution plans Contributions to post-employment benefits under defined contribution plans are recognised as an expense
in profit or loss in the period during which the related services are rendered by employees.
Share-based payments For equity-settled share-based payment transactions, the fair value of the services received is recognised
as an expense with a corresponding increase in equity over the vesting period during which the employees become unconditionally entitled to the equity instrument. The fair value of the services received is determined by reference to the fair value of the equity instrument granted at the grant date. At each reporting date, the number of equity instruments that are expected to be vested are estimated. The impact on the revision of original estimates is recognised as an expense and as a corresponding adjustment to equity over the remaining vesting period, unless the revision to original estimates is due to market conditions. No adjustment is made if the revision or actual outcome differs from the original estimate due to market conditions.
For cash-settled share-based payment transactions, the fair value of the goods or services received is recognised as an expense with a corresponding increase in liability. The fair value of the services received is determined by reference to the fair value of the liability. Until the liability is settled, the fair value of the liability is re-measured at each reporting date and at the date of settlement, with any changes in fair value recognised for the period.
CapitaLand Limited Annual Report 2013 160 Clarity
Notes to the Financial Statements
2 SUMMARY OF SIGNIFICANT ACCOUNTING POLICIES (continued)(k) Employee benefits (continued)
Share-based payments (continued) The proceeds received from the exercise of the equity instruments, net of any directly attributable transaction
costs, are credited to share capital when the equity instruments are exercised.
(l) Provision A provision is recognised if, as a result of a past event, the Group has a present legal or constructive obligation
that can be estimated reliably, and it is probable that an outflow of economic benefits will be required to settle the obligation.
A provision for onerous contract is recognised when the expected benefits to be derived by the Group from a contract are lower than the unavoidable cost of meeting its obligations under the contract. The provision is measured at the present value of the lower of the expected cost of terminating the contract and the expected net cost of continuing with the contract. Before a provision is established, the Group recognises any impairment loss on the assets associated with the contract.
(m) LeasesWhen entities within the Group are lessees of a finance lease
Leased assets in which the Group assumes substantially all the risks and rewards of ownership are classified as finance leases. Upon initial recognition, property, plant and equipment acquired through finance leases are capitalised at the lower of their fair value and the present value of the minimum lease payments. Subsequent to initial recognition, the asset is accounted for in accordance with the accounting policy applicable to that asset. Leased assets are depreciated over the shorter of the lease term and their useful lives. Lease payments are apportioned between finance expense and reduction of the lease liability. The finance expense is allocated to each period during the lease term so as to produce a constant periodic rate of interest over the remaining balance of the liability. Contingent lease payments are accounted for by revising the minimum lease payments over the remaining term of the lease when the lease adjustment is confirmed.
At inception, an arrangement that contains a lease is accounted for as such based on the terms and conditions even though the arrangement is not in the legal form of a lease.
When entities within the Group are lessees of an operating lease Where the Group has the use of assets under operating leases, payments made under the leases are
recognised in profit or loss on a straight-line basis over the term of the lease. Lease incentives received are recognised as an integral part of the total lease payments made. Contingent rentals are charged to the profit or loss in the accounting period in which they are incurred.
When entities within the Group are lessors of an operating lease Assets subject to operating leases are included in either property, plant and equipment (see note 2(d)) or
investment properties (see note 2(f)).
(n) Revenue recognitionRental income
Rental income receivable under operating leases is recognised on a straight-line basis over the term of the lease, except where an alternative basis is more representative of the pattern of benefits to be derived from the leased asset. Lease incentives granted are recognised as an integral part of the total rental income to be received. Contingent rentals are recognised as income in the accounting period in which they are earned.
161Appendix
2 SUMMARY OF SIGNIFICANT ACCOUNTING POLICIES (continued)(n) Revenue recognition (continued)
Development properties for sale The Group recognises income on property development projects when the significant risks and rewards of
ownership have been transferred to the purchasers. For development projects under progressive payment scheme in Singapore, whereby the legal terms in the sale contracts result in continuous transfer of work-in-progress to the purchasers, revenue is recognised based on the percentage of completion method. Under the percentage of completion method, profit is brought into profit or loss only in respect of sales procured and to the extent that such profit relates to the progress of construction work. The progress of construction work is measured by the proportion of the construction costs incurred to date to the estimated total construction costs for each project. For development projects under deferred payment scheme in Singapore and overseas development projects, the revenue will be recognised upon the transfer of significant risks and rewards of ownership, which generally coincides with the time the development units are delivered to the purchasers.
Revenue excludes goods and services or other sale taxes and is after deduction of any trade discounts. No revenue is recognised if there are significant uncertainties regarding recovery of the consideration due, associated costs or the possible return of unit sold.
Financial advisory and management fee Financial advisory and management fee is recognised as and when service is rendered.
Dividends Dividend income is recognised on the date that the Group’s right to receive payment is established.
Interest income Interest income is recognised as it accrues, using the effective interest method.
(o) Finance costs Borrowing costs are recognised in the profit or loss using the effective interest method, except to the extent
that they are capitalised as being directly attributable to the acquisition, construction or production of an asset which necessarily takes a substantial period of time to be prepared for its intended use or sale.
(p) Tax Income tax expense comprises current and deferred tax. Income tax expense is recognised in the profit or
loss except to the extent that it relates to a business combination, or items recognised directly in equity or in other comprehensive income.
Current tax is the expected tax payable or receivable on the taxable income or loss for the year, using tax rates enacted or substantively enacted at the reporting date, and any adjustment to tax payable in respect of previous years.
Deferred tax is recognised in respect of temporary differences between the carrying amounts of assets and liabilities for financial reporting purposes and the amounts used for taxation purposes. Deferred tax is not recognised for:• temporary differences on the initial recognition of assets or liabilities in a transaction that is not a
business combination and that affects neither accounting nor taxable profit or loss;
CapitaLand Limited Annual Report 2013 162 Clarity
Notes to the Financial Statements
2 SUMMARY OF SIGNIFICANT ACCOUNTING POLICIES (continued)(p) Tax (continued)
• temporary differences related to investments in subsidiaries, associates and joint ventures to the extent that the Group is able to control the timing of the reversal of the temporary difference and it is probable that they will not reverse in the foreseeable future; and
• taxable temporary differences arising on the initial recognition of goodwill.
The measurement of deferred taxes reflects the tax consequences that would follow the manner in which the Group expects, at the end of the reporting period, to recover or settle the carrying amount of its assets and liabilities. Deferred tax is measured at the tax rates that are expected to be applied to temporary differences when they reverse, based on the laws that have been enacted or substantively enacted by the reporting date.
Deferred tax assets and liabilities are offset if there is a legally enforceable right to offset current tax liabilities and assets, and they relate to income taxes levied by the same tax authority on the same taxable entity, or on different tax entities, but they intend to settle current tax liabilities and assets on a net basis or their tax assets and liabilities will be realised simultaneously.
A deferred tax asset is recognised to the extent that it is probable that future taxable profits will be available against which temporary differences can be utilised. Deferred tax assets are reviewed at each reporting date and are reduced to the extent that it is no longer probable that the related tax benefit will be realised.
In determining the amount of current and deferred tax, the Group takes into account the impact of uncertain tax positions and whether additional taxes and interest may be due. The Group believes that its accruals for tax liabilities are adequate for all open tax years based on its assessment of many factors, including interpretations of tax law and prior experience. This assessment relies on estimates and assumptions and may involve a series of judgements about future events. New information may become available that causes the Group to change its judgement regarding the adequacy of existing tax liabilities; such changes to tax liabilities will impact tax expense in the period that such a determination is made.
(q) Earnings per share The Group presents basic and diluted earnings per share (EPS) data for its ordinary shares. Basic EPS is
calculated by dividing the profit or loss attributable to owners of the Company by the weighted average number of ordinary shares outstanding during the period, adjusted for own shares held. Diluted EPS is determined by adjusting the profit or loss attributable to owners of the Company and the weighted average number of ordinary shares outstanding, adjusted for own shares held, for the effects of all dilutive potential ordinary shares, which comprise issued convertible bonds and share plans granted to employees.
(r) Operating segments An operating segment is a component of the Group that engages in business activities from which it may
earn revenues and incur expenses, including revenues and expenses that relate to transactions with any of the Group’s other components. Operating segments are reported in a manner consistent with the internal reporting provided to the chief operating decision-maker. The chief operating decision-maker has been identified as the Executive Management Council that makes strategic resource allocation decisions. The Council comprises the President & Group Chief Executive Officer (CEO), all CEOs of business units and key management officers of the Corporate Office.
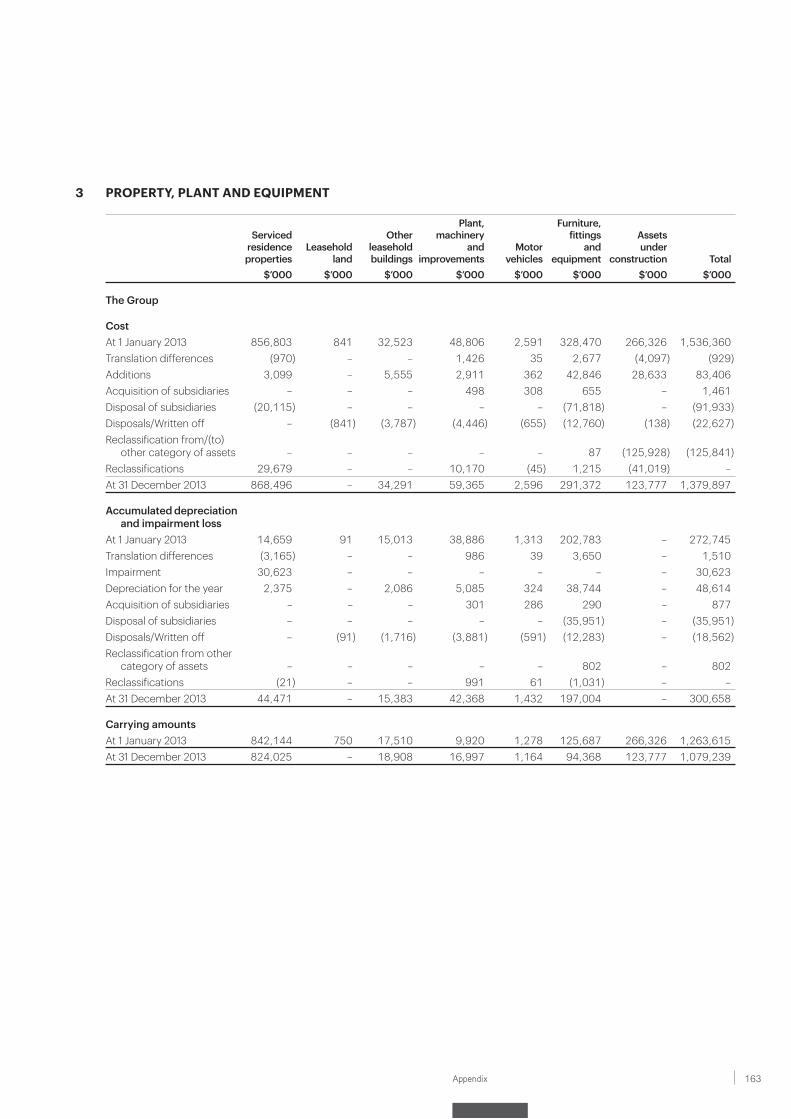
163Appendix
3 PROPERTY, PLANT AND EQUIPMENT
Serviced residence properties
Leasehold land
Other leasehold buildings
Plant, machinery
and improvements
Motorvehicles
Furniture, fittings
and equipment
Assetsunder
construction Total$’000 $’000 $’000 $’000 $’000 $’000 $’000 $’000
The Group
CostAt 1 January 2013 856,803 841 32,523 48,806 2,591 328,470 266,326 1,536,360Translation differences (970) – – 1,426 35 2,677 (4,097) (929)Additions 3,099 – 5,555 2,911 362 42,846 28,633 83,406Acquisition of subsidiaries – – – 498 308 655 – 1,461Disposal of subsidiaries (20,115) – – – – (71,818) – (91,933)Disposals/Written off – (841) (3,787) (4,446) (655) (12,760) (138) (22,627)Reclassification from/(to)
other category of assets – – – – – 87 (125,928) (125,841)Reclassifications 29,679 – – 10,170 (45) 1,215 (41,019) –At 31 December 2013 868,496 – 34,291 59,365 2,596 291,372 123,777 1,379,897
Accumulated depreciation and impairment loss
At 1 January 2013 14,659 91 15,013 38,886 1,313 202,783 – 272,745Translation differences (3,165) – – 986 39 3,650 – 1,510Impairment 30,623 – – – – – – 30,623Depreciation for the year 2,375 – 2,086 5,085 324 38,744 – 48,614Acquisition of subsidiaries – – – 301 286 290 – 877Disposal of subsidiaries – – – – – (35,951) – (35,951)Disposals/Written off – (91) (1,716) (3,881) (591) (12,283) – (18,562)Reclassification from other
category of assets – – – – – 802 – 802Reclassifications (21) – – 991 61 (1,031) – –At 31 December 2013 44,471 – 15,383 42,368 1,432 197,004 – 300,658
Carrying amountsAt 1 January 2013 842,144 750 17,510 9,920 1,278 125,687 266,326 1,263,615At 31 December 2013 824,025 – 18,908 16,997 1,164 94,368 123,777 1,079,239
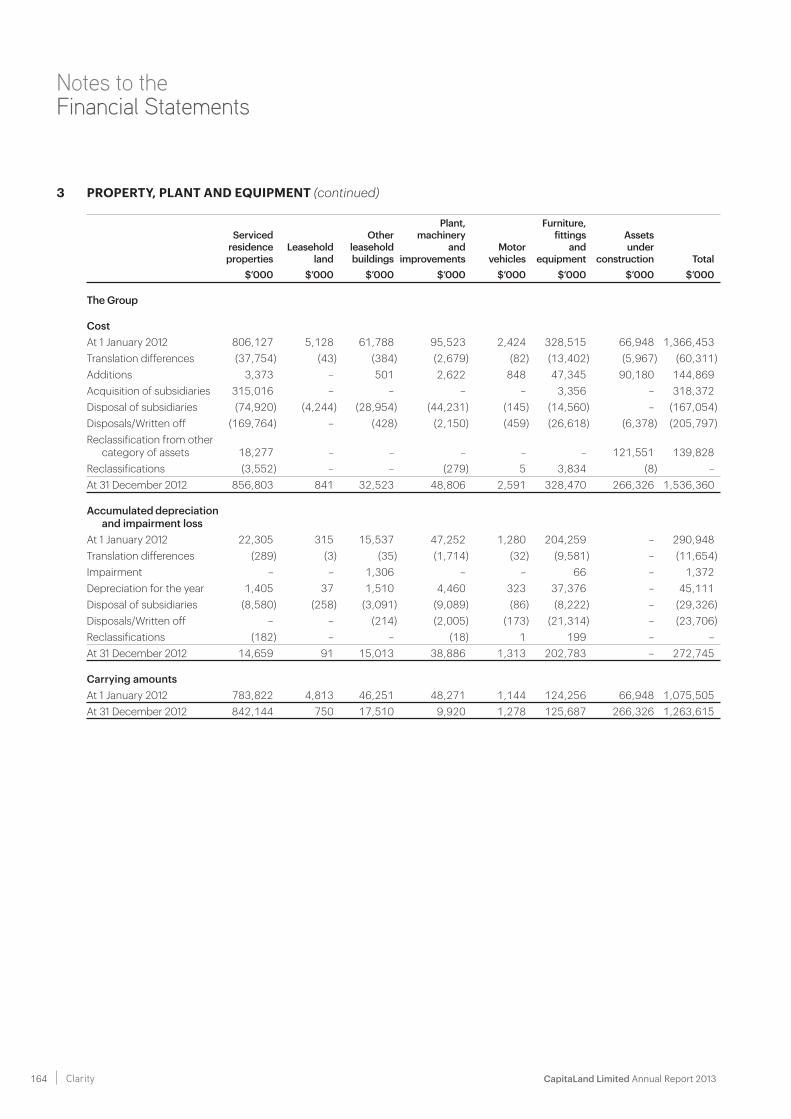
CapitaLand Limited Annual Report 2013 164 Clarity
Notes to the Financial Statements
3 PROPERTY, PLANT AND EQUIPMENT (continued)
Serviced residence properties
Leasehold land
Other leasehold buildings
Plant, machinery
and improvements
Motorvehicles
Furniture, fittings
and equipment
Assetsunder
construction Total$’000 $’000 $’000 $’000 $’000 $’000 $’000 $’000
The Group
CostAt 1 January 2012 806,127 5,128 61,788 95,523 2,424 328,515 66,948 1,366,453Translation differences (37,754) (43) (384) (2,679) (82) (13,402) (5,967) (60,311)Additions 3,373 – 501 2,622 848 47,345 90,180 144,869Acquisition of subsidiaries 315,016 – – – – 3,356 – 318,372Disposal of subsidiaries (74,920) (4,244) (28,954) (44,231) (145) (14,560) – (167,054)Disposals/Written off (169,764) – (428) (2,150) (459) (26,618) (6,378) (205,797)Reclassification from other
category of assets 18,277 – – – – – 121,551 139,828Reclassifications (3,552) – – (279) 5 3,834 (8) –At 31 December 2012 856,803 841 32,523 48,806 2,591 328,470 266,326 1,536,360
Accumulated depreciation and impairment loss
At 1 January 2012 22,305 315 15,537 47,252 1,280 204,259 – 290,948Translation differences (289) (3) (35) (1,714) (32) (9,581) – (11,654)Impairment – – 1,306 – – 66 – 1,372Depreciation for the year 1,405 37 1,510 4,460 323 37,376 – 45,111Disposal of subsidiaries (8,580) (258) (3,091) (9,089) (86) (8,222) – (29,326)Disposals/Written off – – (214) (2,005) (173) (21,314) – (23,706)Reclassifications (182) – – (18) 1 199 – –At 31 December 2012 14,659 91 15,013 38,886 1,313 202,783 – 272,745
Carrying amountsAt 1 January 2012 783,822 4,813 46,251 48,271 1,144 124,256 66,948 1,075,505At 31 December 2012 842,144 750 17,510 9,920 1,278 125,687 266,326 1,263,615
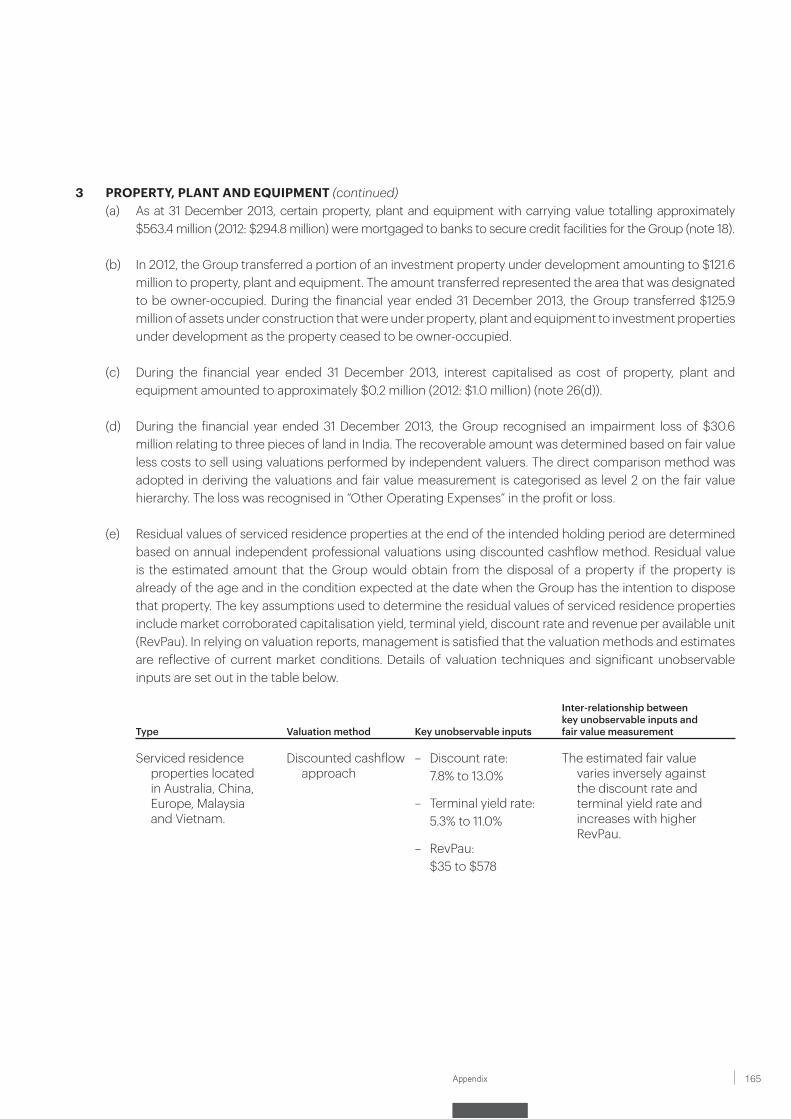
165Appendix
3 PROPERTY, PLANT AND EQUIPMENT (continued)(a) As at 31 December 2013, certain property, plant and equipment with carrying value totalling approximately
$563.4 million (2012: $294.8 million) were mortgaged to banks to secure credit facilities for the Group (note 18).
(b) In 2012, the Group transferred a portion of an investment property under development amounting to $121.6 million to property, plant and equipment. The amount transferred represented the area that was designated to be owner-occupied. During the financial year ended 31 December 2013, the Group transferred $125.9 million of assets under construction that were under property, plant and equipment to investment properties under development as the property ceased to be owner-occupied.
(c) During the financial year ended 31 December 2013, interest capitalised as cost of property, plant and equipment amounted to approximately $0.2 million (2012: $1.0 million) (note 26(d)).
(d) During the financial year ended 31 December 2013, the Group recognised an impairment loss of $30.6 million relating to three pieces of land in India. The recoverable amount was determined based on fair value less costs to sell using valuations performed by independent valuers. The direct comparison method was adopted in deriving the valuations and fair value measurement is categorised as level 2 on the fair value hierarchy. The loss was recognised in “Other Operating Expenses” in the profit or loss.
(e) Residual values of serviced residence properties at the end of the intended holding period are determined based on annual independent professional valuations using discounted cashflow method. Residual value is the estimated amount that the Group would obtain from the disposal of a property if the property is already of the age and in the condition expected at the date when the Group has the intention to dispose that property. The key assumptions used to determine the residual values of serviced residence properties include market corroborated capitalisation yield, terminal yield, discount rate and revenue per available unit (RevPau). In relying on valuation reports, management is satisfied that the valuation methods and estimates are reflective of current market conditions. Details of valuation techniques and significant unobservable inputs are set out in the table below.
Type Valuation method Key unobservable inputs
Inter-relationship between key unobservable inputs and fair value measurement
Serviced residence properties located in Australia, China, Europe, Malaysia and Vietnam.
Discounted cashflow approach
– Discount rate: The estimated fair value varies inversely against the discount rate and terminal yield rate and increases with higher RevPau.
7.8% to 13.0%
– Terminal yield rate: 5.3% to 11.0%
– RevPau: $35 to $578
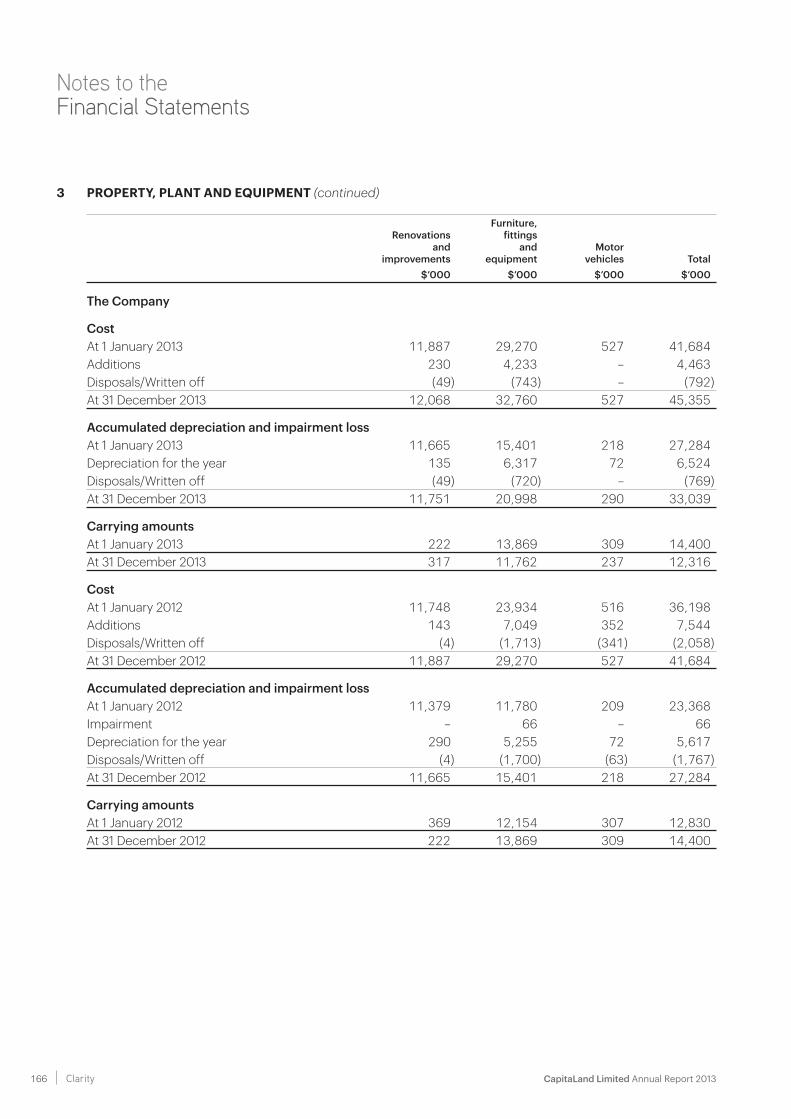
CapitaLand Limited Annual Report 2013 166 Clarity
Notes to the Financial Statements
3 PROPERTY, PLANT AND EQUIPMENT (continued)
Renovationsand
improvements
Furniture,fittings
andequipment
Motorvehicles Total
$’000 $’000 $’000 $’000
The Company
CostAt 1 January 2013 11,887 29,270 527 41,684Additions 230 4,233 – 4,463Disposals/Written off (49) (743) – (792)At 31 December 2013 12,068 32,760 527 45,355
Accumulated depreciation and impairment lossAt 1 January 2013 11,665 15,401 218 27,284Depreciation for the year 135 6,317 72 6,524Disposals/Written off (49) (720) – (769)At 31 December 2013 11,751 20,998 290 33,039
Carrying amountsAt 1 January 2013 222 13,869 309 14,400At 31 December 2013 317 11,762 237 12,316
CostAt 1 January 2012 11,748 23,934 516 36,198Additions 143 7,049 352 7,544Disposals/Written off (4) (1,713) (341) (2,058)At 31 December 2012 11,887 29,270 527 41,684
Accumulated depreciation and impairment lossAt 1 January 2012 11,379 11,780 209 23,368Impairment – 66 – 66Depreciation for the year 290 5,255 72 5,617Disposals/Written off (4) (1,700) (63) (1,767)At 31 December 2012 11,665 15,401 218 27,284
Carrying amountsAt 1 January 2012 369 12,154 307 12,830At 31 December 2012 222 13,869 309 14,400
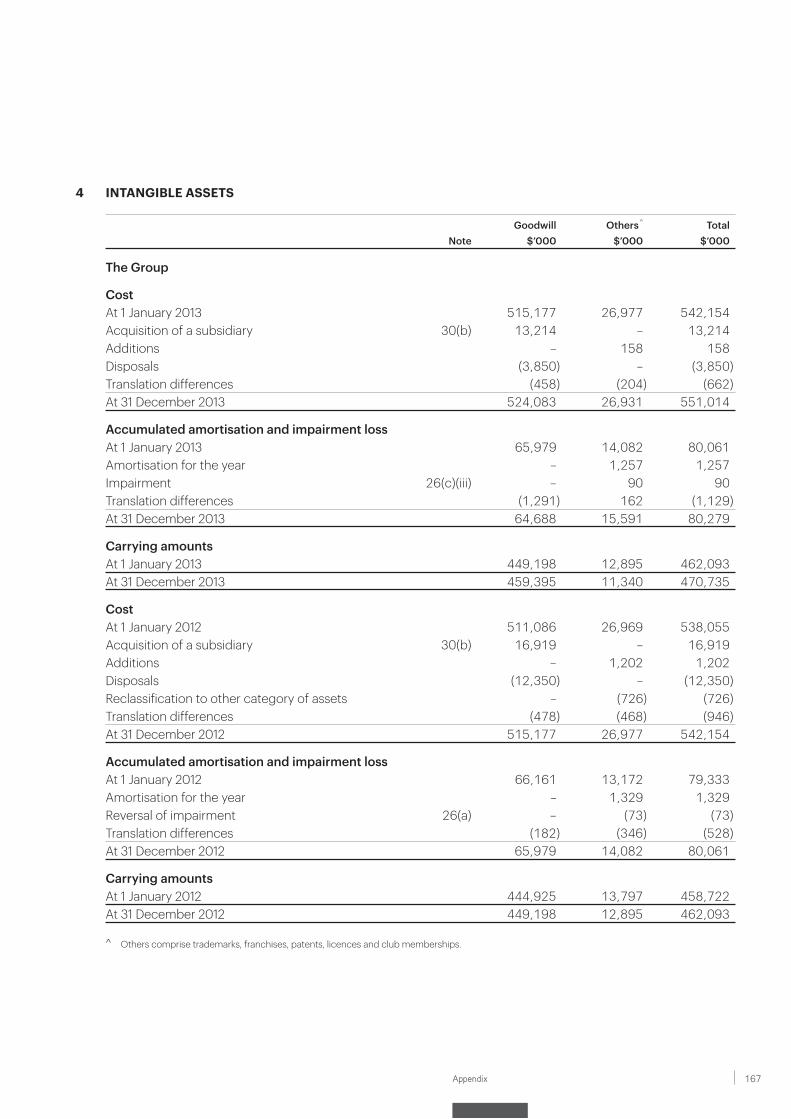
167Appendix
4 INTANGIBLE ASSETS
Goodwill Others ^ TotalNote $’000 $’000 $’000
The Group
CostAt 1 January 2013 515,177 26,977 542,154Acquisition of a subsidiary 30(b) 13,214 – 13,214Additions – 158 158Disposals (3,850) – (3,850)Translation differences (458) (204) (662)At 31 December 2013 524,083 26,931 551,014
Accumulated amortisation and impairment lossAt 1 January 2013 65,979 14,082 80,061Amortisation for the year – 1,257 1,257Impairment 26(c)(iii) – 90 90Translation differences (1,291) 162 (1,129)At 31 December 2013 64,688 15,591 80,279
Carrying amountsAt 1 January 2013 449,198 12,895 462,093At 31 December 2013 459,395 11,340 470,735
CostAt 1 January 2012 511,086 26,969 538,055Acquisition of a subsidiary 30(b) 16,919 – 16,919Additions – 1,202 1,202Disposals (12,350) – (12,350)Reclassification to other category of assets – (726) (726)Translation differences (478) (468) (946)At 31 December 2012 515,177 26,977 542,154
Accumulated amortisation and impairment lossAt 1 January 2012 66,161 13,172 79,333Amortisation for the year – 1,329 1,329Reversal of impairment 26(a) – (73) (73)Translation differences (182) (346) (528)At 31 December 2012 65,979 14,082 80,061
Carrying amountsAt 1 January 2012 444,925 13,797 458,722At 31 December 2012 449,198 12,895 462,093
^ Others comprise trademarks, franchises, patents, licences and club memberships.
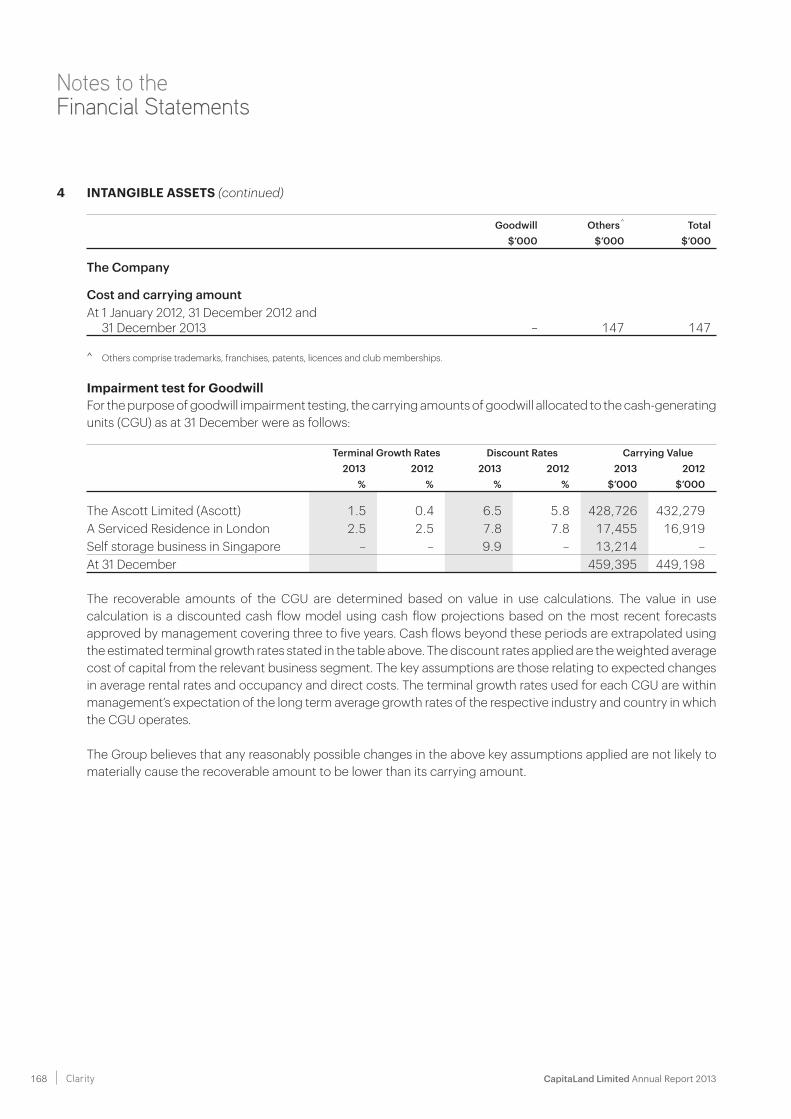
CapitaLand Limited Annual Report 2013 168 Clarity
Notes to the Financial Statements
4 INTANGIBLE ASSETS (continued)
Goodwill Others ^ Total$’000 $’000 $’000
The Company
Cost and carrying amountAt 1 January 2012, 31 December 2012 and
31 December 2013 – 147 147
^ Others comprise trademarks, franchises, patents, licences and club memberships.
Impairment test for Goodwill For the purpose of goodwill impairment testing, the carrying amounts of goodwill allocated to the cash-generating
units (CGU) as at 31 December were as follows:
Terminal Growth Rates Discount Rates Carrying Value2013 2012 2013 2012 2013 2012
% % % % $’000 $’000
The Ascott Limited (Ascott) 1.5 0.4 6.5 5.8 428,726 432,279A Serviced Residence in London 2.5 2.5 7.8 7.8 17,455 16,919Self storage business in Singapore – – 9.9 – 13,214 –At 31 December 459,395 449,198
The recoverable amounts of the CGU are determined based on value in use calculations. The value in use calculation is a discounted cash flow model using cash flow projections based on the most recent forecasts approved by management covering three to five years. Cash flows beyond these periods are extrapolated using the estimated terminal growth rates stated in the table above. The discount rates applied are the weighted average cost of capital from the relevant business segment. The key assumptions are those relating to expected changes in average rental rates and occupancy and direct costs. The terminal growth rates used for each CGU are within management’s expectation of the long term average growth rates of the respective industry and country in which the CGU operates.
The Group believes that any reasonably possible changes in the above key assumptions applied are not likely to materially cause the recoverable amount to be lower than its carrying amount.
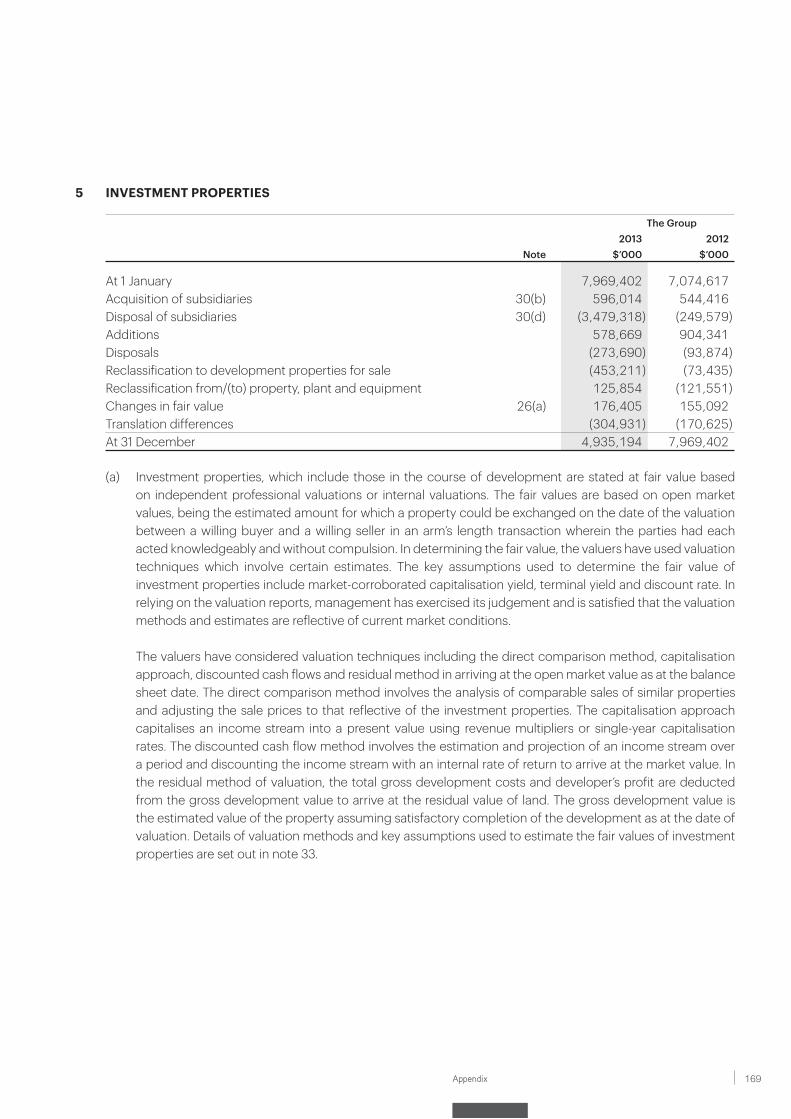
169Appendix
5 INVESTMENT PROPERTIES
The Group2013 2012
Note $’000 $’000
At 1 January 7,969,402 7,074,617Acquisition of subsidiaries 30(b) 596,014 544,416Disposal of subsidiaries 30(d) (3,479,318) (249,579)Additions 578,669 904,341Disposals (273,690) (93,874)Reclassification to development properties for sale (453,211) (73,435)Reclassification from/(to) property, plant and equipment 125,854 (121,551)Changes in fair value 26(a) 176,405 155,092Translation differences (304,931) (170,625)At 31 December 4,935,194 7,969,402
(a) Investment properties, which include those in the course of development are stated at fair value based on independent professional valuations or internal valuations. The fair values are based on open market values, being the estimated amount for which a property could be exchanged on the date of the valuation between a willing buyer and a willing seller in an arm’s length transaction wherein the parties had each acted knowledgeably and without compulsion. In determining the fair value, the valuers have used valuation techniques which involve certain estimates. The key assumptions used to determine the fair value of investment properties include market-corroborated capitalisation yield, terminal yield and discount rate. In relying on the valuation reports, management has exercised its judgement and is satisfied that the valuation methods and estimates are reflective of current market conditions.
The valuers have considered valuation techniques including the direct comparison method, capitalisation approach, discounted cash flows and residual method in arriving at the open market value as at the balance sheet date. The direct comparison method involves the analysis of comparable sales of similar properties and adjusting the sale prices to that reflective of the investment properties. The capitalisation approach capitalises an income stream into a present value using revenue multipliers or single-year capitalisation rates. The discounted cash flow method involves the estimation and projection of an income stream over a period and discounting the income stream with an internal rate of return to arrive at the market value. In the residual method of valuation, the total gross development costs and developer’s profit are deducted from the gross development value to arrive at the residual value of land. The gross development value is the estimated value of the property assuming satisfactory completion of the development as at the date of valuation. Details of valuation methods and key assumptions used to estimate the fair values of investment properties are set out in note 33.
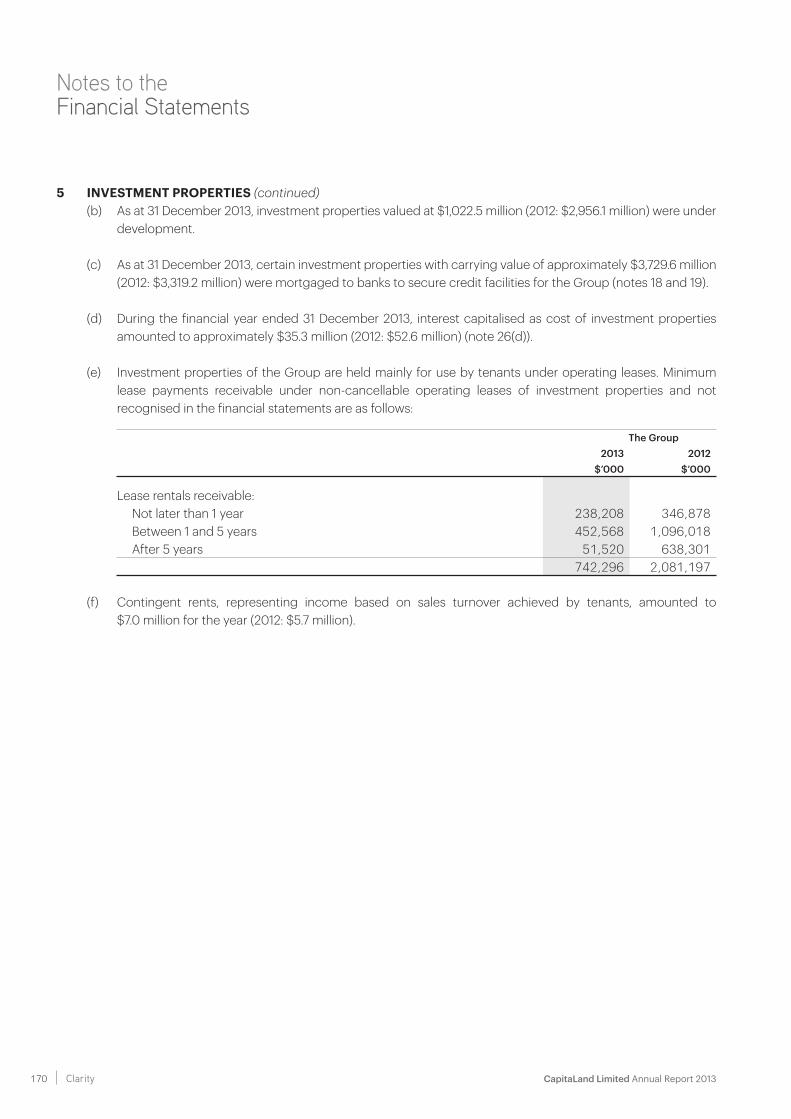
CapitaLand Limited Annual Report 2013 170 Clarity
Notes to the Financial Statements
5 INVESTMENT PROPERTIES (continued)(b) As at 31 December 2013, investment properties valued at $1,022.5 million (2012: $2,956.1 million) were under
development.
(c) As at 31 December 2013, certain investment properties with carrying value of approximately $3,729.6 million (2012: $3,319.2 million) were mortgaged to banks to secure credit facilities for the Group (notes 18 and 19).
(d) During the financial year ended 31 December 2013, interest capitalised as cost of investment properties amounted to approximately $35.3 million (2012: $52.6 million) (note 26(d)).
(e) Investment properties of the Group are held mainly for use by tenants under operating leases. Minimum lease payments receivable under non-cancellable operating leases of investment properties and not recognised in the financial statements are as follows:
The Group2013 2012
$’000 $’000
Lease rentals receivable: Not later than 1 year 238,208 346,878 Between 1 and 5 years 452,568 1,096,018 After 5 years 51,520 638,301
742,296 2,081,197
(f) Contingent rents, representing income based on sales turnover achieved by tenants, amounted to $7.0 million for the year (2012: $5.7 million).
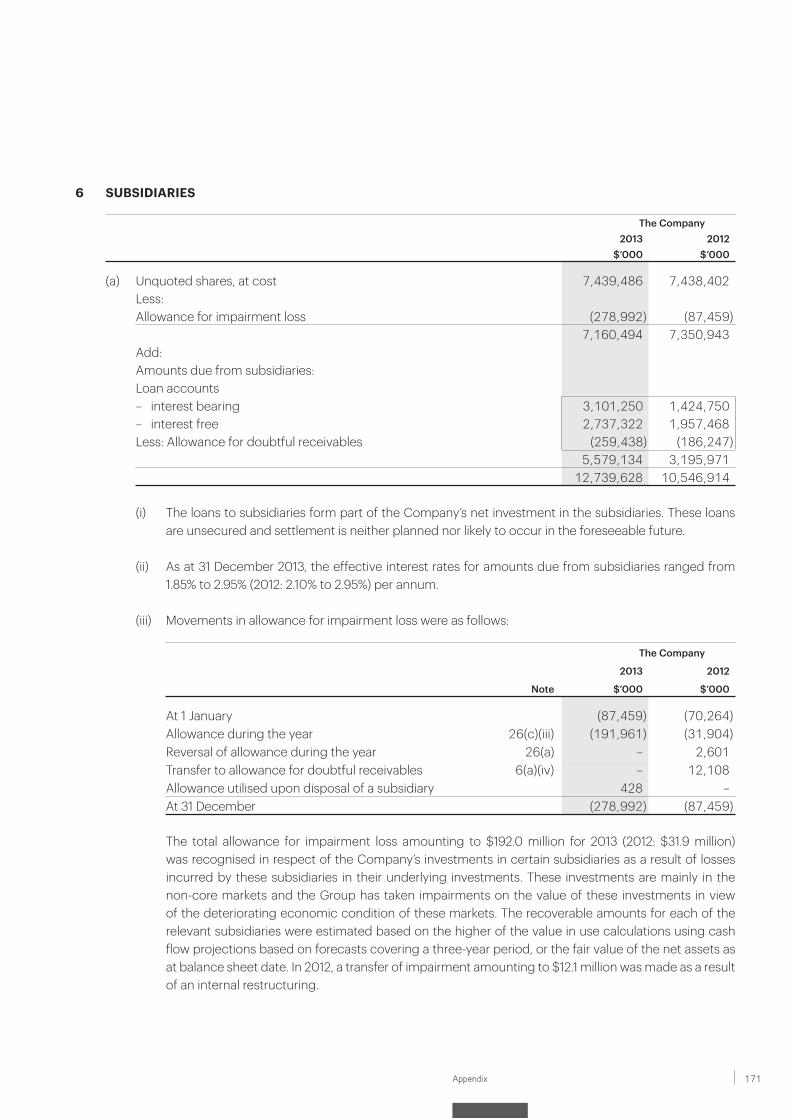
171Appendix
6 SUBSIDIARIES
The Company2013 2012
$’000 $’000
(a) Unquoted shares, at cost 7,439,486 7,438,402Less:Allowance for impairment loss (278,992) (87,459)
7,160,494 7,350,943Add:Amounts due from subsidiaries:Loan accounts– interest bearing 3,101,250 1,424,750– interest free 2,737,322 1,957,468Less: Allowance for doubtful receivables (259,438) (186,247)
5,579,134 3,195,97112,739,628 10,546,914
(i) The loans to subsidiaries form part of the Company’s net investment in the subsidiaries. These loans are unsecured and settlement is neither planned nor likely to occur in the foreseeable future.
(ii) As at 31 December 2013, the effective interest rates for amounts due from subsidiaries ranged from 1.85% to 2.95% (2012: 2.10% to 2.95%) per annum.
(iii) Movements in allowance for impairment loss were as follows:
The Company
2013 2012
Note $’000 $’000
At 1 January (87,459) (70,264)Allowance during the year 26(c)(iii) (191,961) (31,904)Reversal of allowance during the year 26(a) – 2,601Transfer to allowance for doubtful receivables 6(a)(iv) – 12,108Allowance utilised upon disposal of a subsidiary 428 –At 31 December (278,992) (87,459)
The total allowance for impairment loss amounting to $192.0 million for 2013 (2012: $31.9 million) was recognised in respect of the Company’s investments in certain subsidiaries as a result of losses incurred by these subsidiaries in their underlying investments. These investments are mainly in the non-core markets and the Group has taken impairments on the value of these investments in view of the deteriorating economic condition of these markets. The recoverable amounts for each of the relevant subsidiaries were estimated based on the higher of the value in use calculations using cash flow projections based on forecasts covering a three-year period, or the fair value of the net assets as at balance sheet date. In 2012, a transfer of impairment amounting to $12.1 million was made as a result of an internal restructuring.
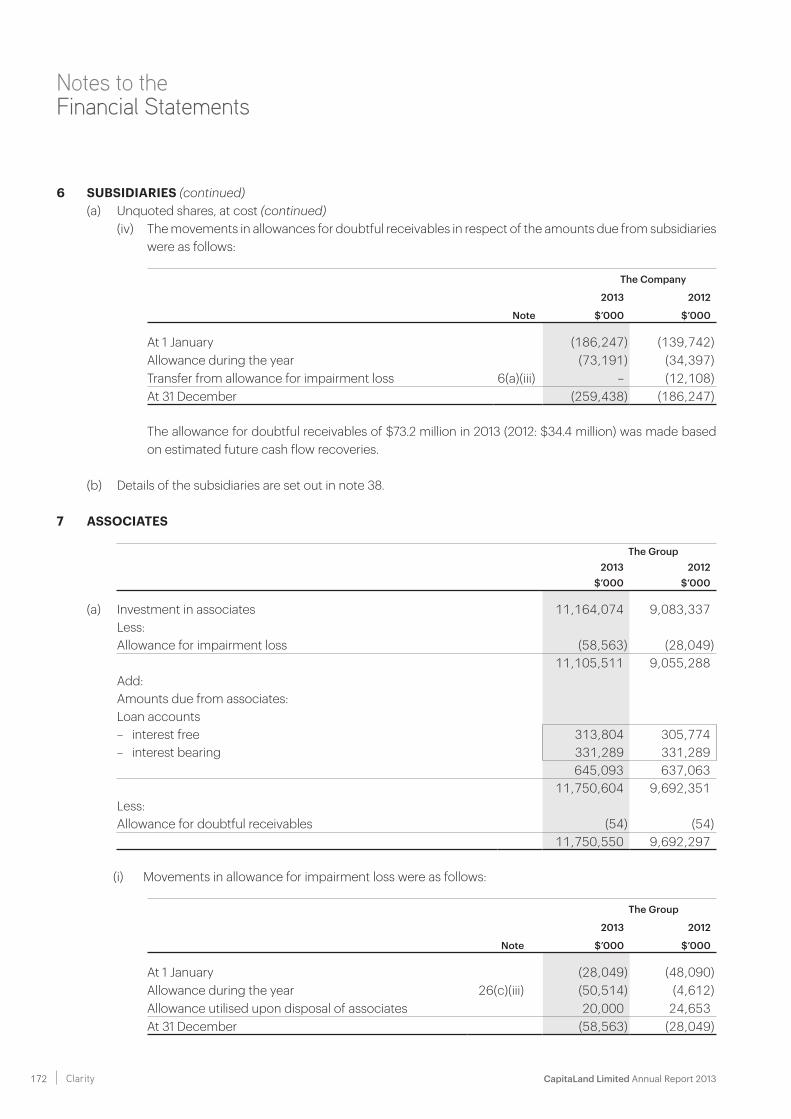
CapitaLand Limited Annual Report 2013 172 Clarity
Notes to the Financial Statements
6 SUBSIDIARIES (continued)(a) Unquoted shares, at cost (continued)
(iv) The movements in allowances for doubtful receivables in respect of the amounts due from subsidiaries were as follows:
The Company
2013 2012
Note $’000 $’000
At 1 January (186,247) (139,742)Allowance during the year (73,191) (34,397)Transfer from allowance for impairment loss 6(a)(iii) – (12,108)At 31 December (259,438) (186,247)
The allowance for doubtful receivables of $73.2 million in 2013 (2012: $34.4 million) was made based on estimated future cash flow recoveries.
(b) Details of the subsidiaries are set out in note 38.
7 ASSOCIATES
The Group2013 2012
$’000 $’000
(a) Investment in associates 11,164,074 9,083,337Less:Allowance for impairment loss (58,563) (28,049)
11,105,511 9,055,288Add:Amounts due from associates:Loan accounts– interest free 313,804 305,774– interest bearing 331,289 331,289
645,093 637,06311,750,604 9,692,351
Less: Allowance for doubtful receivables (54) (54)
11,750,550 9,692,297
(i) Movements in allowance for impairment loss were as follows:
The Group
2013 2012
Note $’000 $’000
At 1 January (28,049) (48,090)Allowance during the year 26(c)(iii) (50,514) (4,612)Allowance utilised upon disposal of associates 20,000 24,653At 31 December (58,563) (28,049)
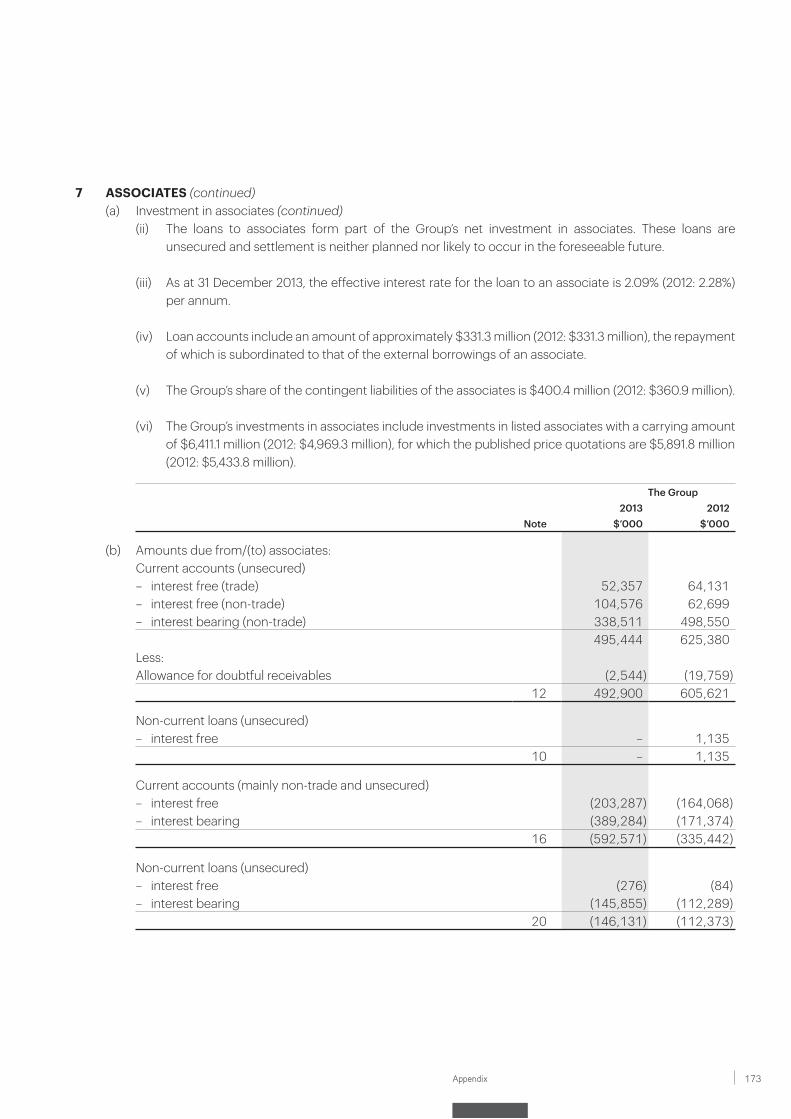
173Appendix
7 ASSOCIATES (continued)(a) Investment in associates (continued)
(ii) The loans to associates form part of the Group’s net investment in associates. These loans are unsecured and settlement is neither planned nor likely to occur in the foreseeable future.
(iii) As at 31 December 2013, the effective interest rate for the loan to an associate is 2.09% (2012: 2.28%) per annum.
(iv) Loan accounts include an amount of approximately $331.3 million (2012: $331.3 million), the repayment of which is subordinated to that of the external borrowings of an associate.
(v) The Group’s share of the contingent liabilities of the associates is $400.4 million (2012: $360.9 million).
(vi) The Group’s investments in associates include investments in listed associates with a carrying amount of $6,411.1 million (2012: $4,969.3 million), for which the published price quotations are $5,891.8 million (2012: $5,433.8 million).
The Group2013 2012
Note $’000 $’000
(b) Amounts due from/(to) associates:Current accounts (unsecured)– interest free (trade) 52,357 64,131– interest free (non-trade) 104,576 62,699– interest bearing (non-trade) 338,511 498,550
495,444 625,380Less:Allowance for doubtful receivables (2,544) (19,759)
12 492,900 605,621
Non-current loans (unsecured)– interest free – 1,135
10 – 1,135
Current accounts (mainly non-trade and unsecured)– interest free (203,287) (164,068)– interest bearing (389,284) (171,374)
16 (592,571) (335,442)
Non-current loans (unsecured)– interest free (276) (84)– interest bearing (145,855) (112,289)
20 (146,131) (112,373)
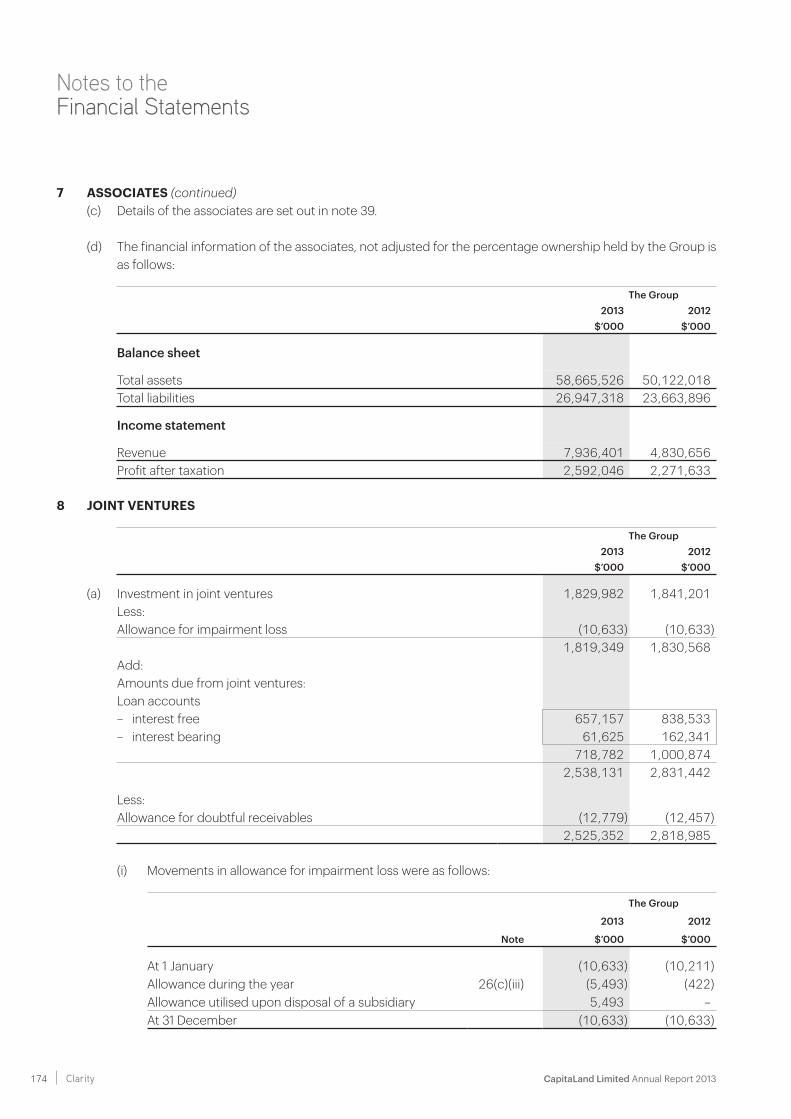
CapitaLand Limited Annual Report 2013 174 Clarity
Notes to the Financial Statements
7 ASSOCIATES (continued)(c) Details of the associates are set out in note 39.
(d) The financial information of the associates, not adjusted for the percentage ownership held by the Group is as follows:
The Group2013 2012
$’000 $’000
Balance sheet
Total assets 58,665,526 50,122,018Total liabilities 26,947,318 23,663,896
Income statement
Revenue 7,936,401 4,830,656Profit after taxation 2,592,046 2,271,633
8 JOINT VENTURES
The Group2013 2012
$’000 $’000
(a) Investment in joint ventures 1,829,982 1,841,201Less:Allowance for impairment loss (10,633) (10,633) 1,819,349 1,830,568Add:Amounts due from joint ventures:Loan accounts– interest free 657,157 838,533– interest bearing 61,625 162,341
718,782 1,000,8742,538,131 2,831,442
Less:Allowance for doubtful receivables (12,779) (12,457)
2,525,352 2,818,985
(i) Movements in allowance for impairment loss were as follows:
The Group
2013 2012
Note $’000 $’000
At 1 January (10,633) (10,211)Allowance during the year 26(c)(iii) (5,493) (422)Allowance utilised upon disposal of a subsidiary 5,493 –At 31 December (10,633) (10,633)
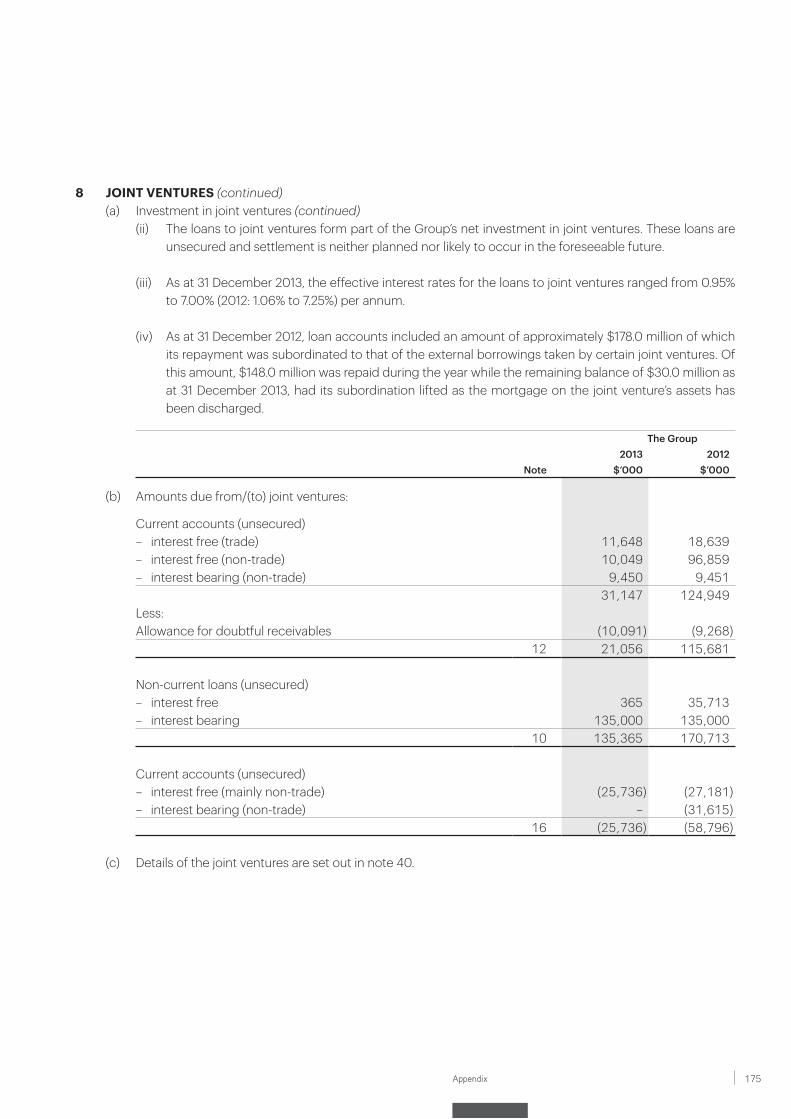
175Appendix
8 JOINT VENTURES (continued)(a) Investment in joint ventures (continued)
(ii) The loans to joint ventures form part of the Group’s net investment in joint ventures. These loans areunsecured and settlement is neither planned nor likely to occur in the foreseeable future.
(iii) As at 31 December 2013, the effective interest rates for the loans to joint ventures ranged from 0.95% to 7.00% (2012: 1.06% to 7.25%) per annum.
(iv) As at 31 December 2012, loan accounts included an amount of approximately $178.0 million of which
its repayment was subordinated to that of the external borrowings taken by certain joint ventures. Of this amount, $148.0 million was repaid during the year while the remaining balance of $30.0 million as at 31 December 2013, had its subordination lifted as the mortgage on the joint venture’s assets has been discharged.
The Group2013 2012
Note $’000 $’000
(b) Amounts due from/(to) joint ventures:
Current accounts (unsecured)– interest free (trade) 11,648 18,639– interest free (non-trade) 10,049 96,859– interest bearing (non-trade) 9,450 9,451
31,147 124,949Less:Allowance for doubtful receivables (10,091) (9,268)
12 21,056 115,681
Non-current loans (unsecured)– interest free 365 35,713– interest bearing 135,000 135,000
10 135,365 170,713
Current accounts (unsecured)– interest free (mainly non-trade) (25,736) (27,181)– interest bearing (non-trade) – (31,615)
16 (25,736) (58,796)
(c) Details of the joint ventures are set out in note 40.
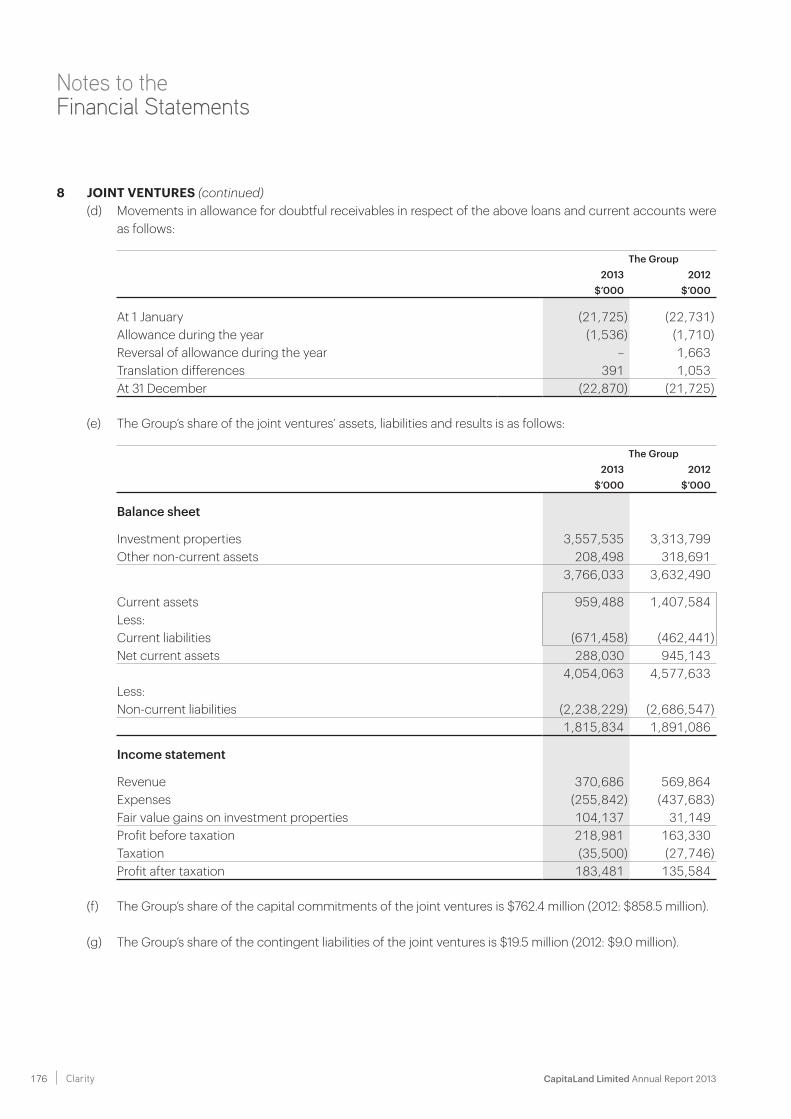
CapitaLand Limited Annual Report 2013 176 Clarity
Notes to the Financial Statements
8 JOINT VENTURES (continued)(d) Movements in allowance for doubtful receivables in respect of the above loans and current accounts were
as follows:
The Group2013 2012
$’000 $’000
At 1 January (21,725) (22,731)Allowance during the year (1,536) (1,710)Reversal of allowance during the year – 1,663Translation differences 391 1,053At 31 December (22,870) (21,725)
(e) The Group’s share of the joint ventures’ assets, liabilities and results is as follows:
The Group2013 2012
$’000 $’000
Balance sheet
Investment properties 3,557,535 3,313,799Other non-current assets 208,498 318,691
3,766,033 3,632,490
Current assets 959,488 1,407,584Less:Current liabilities (671,458) (462,441)Net current assets 288,030 945,143
4,054,063 4,577,633Less:Non-current liabilities (2,238,229) (2,686,547)
1,815,834 1,891,086
Income statement
Revenue 370,686 569,864Expenses (255,842) (437,683)Fair value gains on investment properties 104,137 31,149Profit before taxation 218,981 163,330Taxation (35,500) (27,746)Profit after taxation 183,481 135,584
(f) The Group’s share of the capital commitments of the joint ventures is $762.4 million (2012: $858.5 million).
(g) The Group’s share of the contingent liabilities of the joint ventures is $19.5 million (2012: $9.0 million).
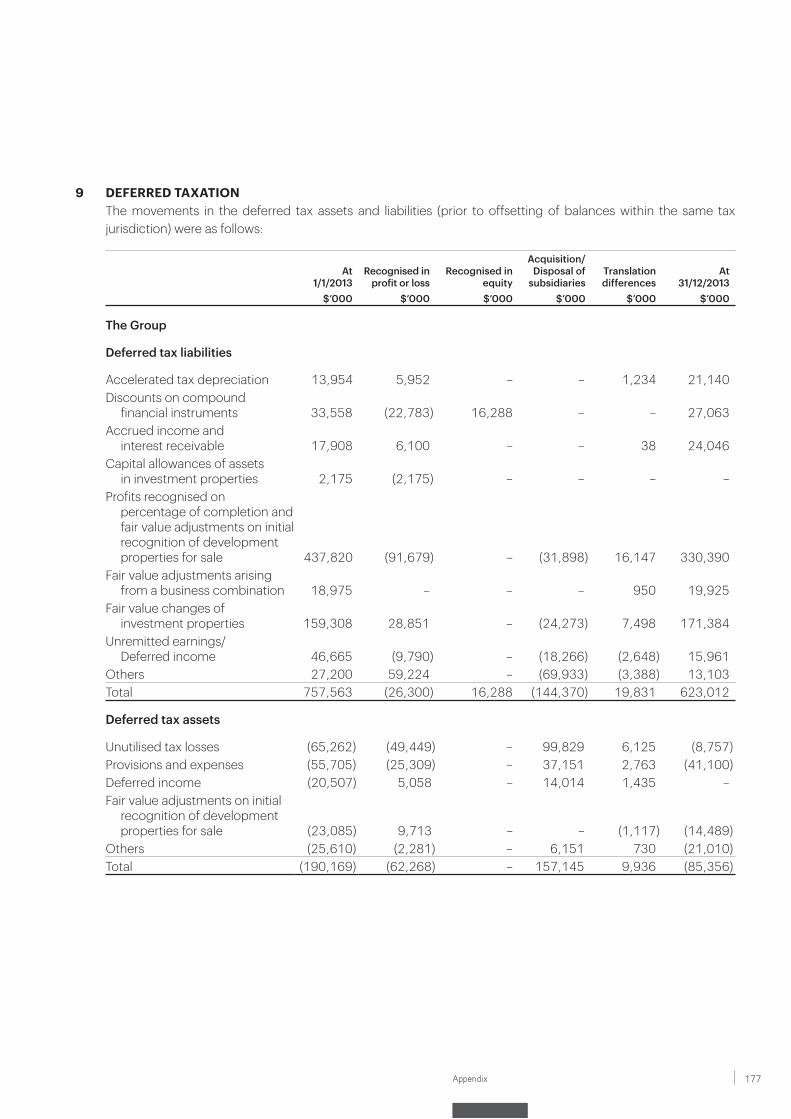
177Appendix
9 DEFERRED TAXATION The movements in the deferred tax assets and liabilities (prior to offsetting of balances within the same tax
jurisdiction) were as follows:
At1/1/2013
Recognised in profit or loss
Recognised inequity
Acquisition/Disposal of
subsidiariesTranslation differences
At 31/12/2013
$’000 $’000 $’000 $’000 $’000 $’000
The Group
Deferred tax liabilities
Accelerated tax depreciation 13,954 5,952 – – 1,234 21,140Discounts on compound
financial instruments 33,558 (22,783) 16,288 – – 27,063Accrued income and
interest receivable 17,908 6,100 – – 38 24,046Capital allowances of assets
in investment properties 2,175 (2,175) – – – –Profits recognised on
percentage of completion and fair value adjustments on initial recognition of development properties for sale 437,820 (91,679) – (31,898) 16,147 330,390
Fair value adjustments arising from a business combination 18,975 – – – 950 19,925
Fair value changes of investment properties 159,308 28,851 – (24,273) 7,498 171,384
Unremitted earnings/Deferred income 46,665 (9,790) – (18,266) (2,648) 15,961
Others 27,200 59,224 – (69,933) (3,388) 13,103Total 757,563 (26,300) 16,288 (144,370) 19,831 623,012
Deferred tax assets
Unutilised tax losses (65,262) (49,449) – 99,829 6,125 (8,757)Provisions and expenses (55,705) (25,309) – 37,151 2,763 (41,100)Deferred income (20,507) 5,058 – 14,014 1,435 –Fair value adjustments on initial
recognition of development properties for sale (23,085) 9,713 – – (1,117) (14,489)
Others (25,610) (2,281) – 6,151 730 (21,010)Total (190,169) (62,268) – 157,145 9,936 (85,356)
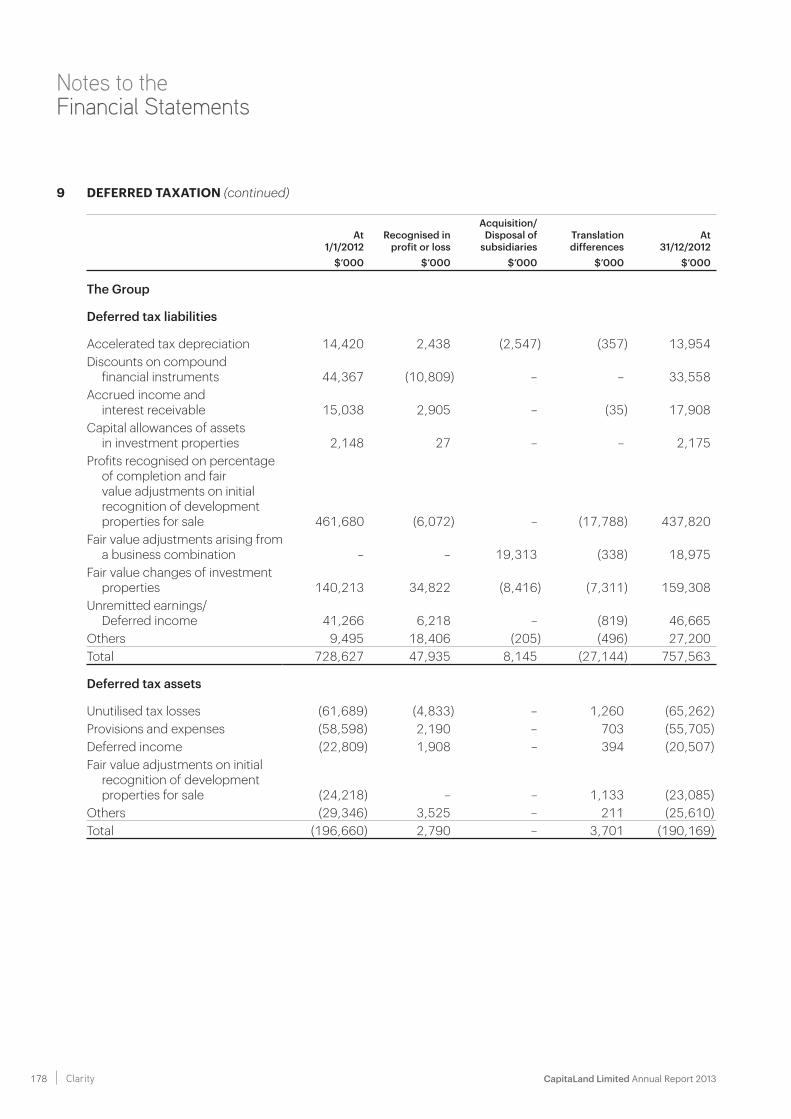
CapitaLand Limited Annual Report 2013 178 Clarity
Notes to the Financial Statements
9 DEFERRED TAXATION (continued)
At1/1/2012
Recognised in profit or loss
Acquisition/Disposal of
subsidiariesTranslation differences
At 31/12/2012
$’000 $’000 $’000 $’000 $’000
The Group
Deferred tax liabilities
Accelerated tax depreciation 14,420 2,438 (2,547) (357) 13,954Discounts on compound
financial instruments 44,367 (10,809) – – 33,558Accrued income and
interest receivable 15,038 2,905 – (35) 17,908Capital allowances of assets
in investment properties 2,148 27 – – 2,175Profits recognised on percentage
of completion and fair value adjustments on initial recognition of development properties for sale 461,680 (6,072) – (17,788) 437,820
Fair value adjustments arising from a business combination – – 19,313 (338) 18,975
Fair value changes of investment properties 140,213 34,822 (8,416) (7,311) 159,308
Unremitted earnings/Deferred income 41,266 6,218 – (819) 46,665
Others 9,495 18,406 (205) (496) 27,200Total 728,627 47,935 8,145 (27,144) 757,563
Deferred tax assets
Unutilised tax losses (61,689) (4,833) – 1,260 (65,262)Provisions and expenses (58,598) 2,190 – 703 (55,705)Deferred income (22,809) 1,908 – 394 (20,507)Fair value adjustments on initial
recognition of development properties for sale (24,218) – – 1,133 (23,085)
Others (29,346) 3,525 – 211 (25,610)Total (196,660) 2,790 – 3,701 (190,169)
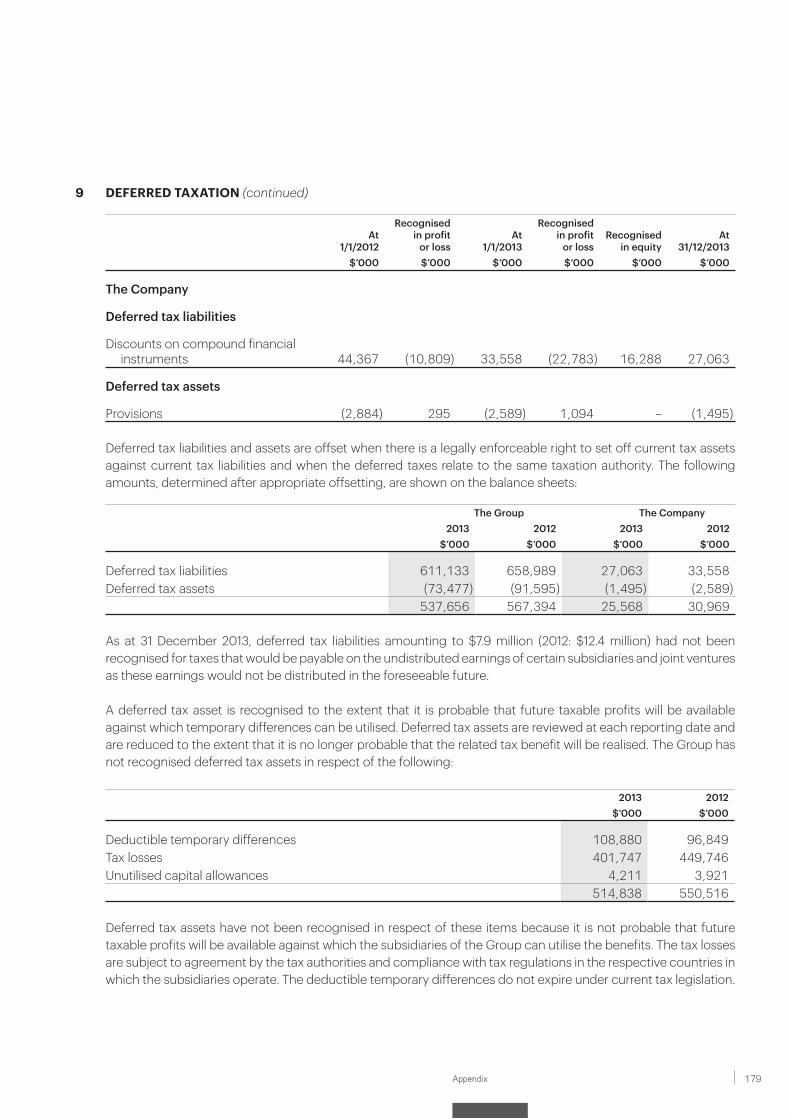
179Appendix
9 DEFERRED TAXATION (continued)
At1/1/2012
Recognisedin profit
or lossAt
1/1/2013
Recognisedin profit
or lossRecognised
in equityAt
31/12/2013$’000 $’000 $’000 $’000 $’000 $’000
The Company
Deferred tax liabilities
Discounts on compound financial instruments 44,367 (10,809) 33,558 (22,783) 16,288 27,063
Deferred tax assets
Provisions (2,884) 295 (2,589) 1,094 – (1,495)
Deferred tax liabilities and assets are offset when there is a legally enforceable right to set off current tax assets against current tax liabilities and when the deferred taxes relate to the same taxation authority. The following amounts, determined after appropriate offsetting, are shown on the balance sheets:
The Group The Company2013 2012 2013 2012
$’000 $’000 $’000 $’000
Deferred tax liabilities 611,133 658,989 27,063 33,558Deferred tax assets (73,477) (91,595) (1,495) (2,589)
537,656 567,394 25,568 30,969
As at 31 December 2013, deferred tax liabilities amounting to $7.9 million (2012: $12.4 million) had not been recognised for taxes that would be payable on the undistributed earnings of certain subsidiaries and joint ventures as these earnings would not be distributed in the foreseeable future.
A deferred tax asset is recognised to the extent that it is probable that future taxable profits will be available against which temporary differences can be utilised. Deferred tax assets are reviewed at each reporting date and are reduced to the extent that it is no longer probable that the related tax benefit will be realised. The Group has not recognised deferred tax assets in respect of the following:
2013 2012$’000 $’000
Deductible temporary differences 108,880 96,849Tax losses 401,747 449,746Unutilised capital allowances 4,211 3,921
514,838 550,516
Deferred tax assets have not been recognised in respect of these items because it is not probable that future taxable profits will be available against which the subsidiaries of the Group can utilise the benefits. The tax losses are subject to agreement by the tax authorities and compliance with tax regulations in the respective countries in which the subsidiaries operate. The deductible temporary differences do not expire under current tax legislation.
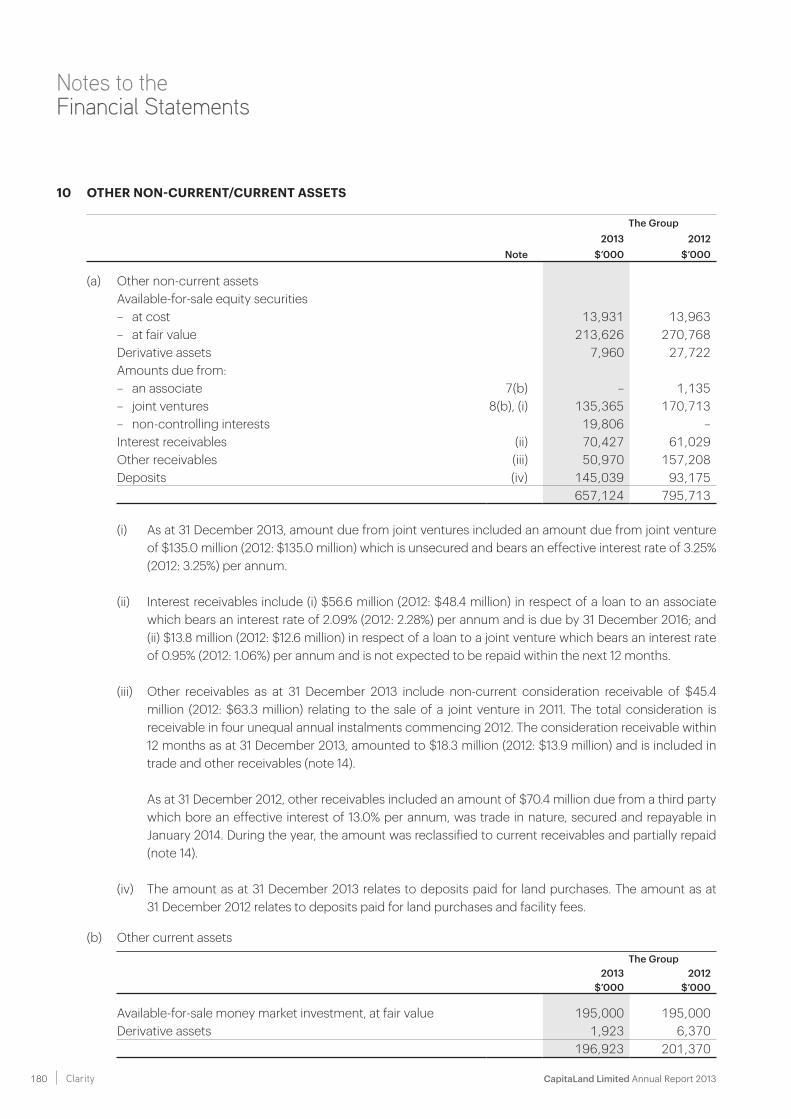
CapitaLand Limited Annual Report 2013 180 Clarity
Notes to the Financial Statements
10 OTHER NON-CURRENT/CURRENT ASSETS
The Group2013 2012
Note $’000 $’000
(a) Other non-current assetsAvailable-for-sale equity securities– at cost 13,931 13,963– at fair value 213,626 270,768Derivative assets 7,960 27,722Amounts due from:– an associate 7(b) – 1,135– joint ventures 8(b), (i) 135,365 170,713– non-controlling interests 19,806 –Interest receivables (ii) 70,427 61,029Other receivables (iii) 50,970 157,208Deposits (iv) 145,039 93,175
657,124 795,713
(i) As at 31 December 2013, amount due from joint ventures included an amount due from joint venture of $135.0 million (2012: $135.0 million) which is unsecured and bears an effective interest rate of 3.25% (2012: 3.25%) per annum.
(ii) Interest receivables include (i) $56.6 million (2012: $48.4 million) in respect of a loan to an associate which bears an interest rate of 2.09% (2012: 2.28%) per annum and is due by 31 December 2016; and (ii) $13.8 million (2012: $12.6 million) in respect of a loan to a joint venture which bears an interest rate of 0.95% (2012: 1.06%) per annum and is not expected to be repaid within the next 12 months.
(iii) Other receivables as at 31 December 2013 include non-current consideration receivable of $45.4 million (2012: $63.3 million) relating to the sale of a joint venture in 2011. The total consideration is receivable in four unequal annual instalments commencing 2012. The consideration receivable within 12 months as at 31 December 2013, amounted to $18.3 million (2012: $13.9 million) and is included in trade and other receivables (note 14).
As at 31 December 2012, other receivables included an amount of $70.4 million due from a third party which bore an effective interest of 13.0% per annum, was trade in nature, secured and repayable in January 2014. During the year, the amount was reclassified to current receivables and partially repaid (note 14).
(iv) The amount as at 31 December 2013 relates to deposits paid for land purchases. The amount as at 31 December 2012 relates to deposits paid for land purchases and facility fees.
(b) Other current assets
The Group2013 2012
$’000 $’000
Available-for-sale money market investment, at fair value 195,000 195,000Derivative assets 1,923 6,370
196,923 201,370
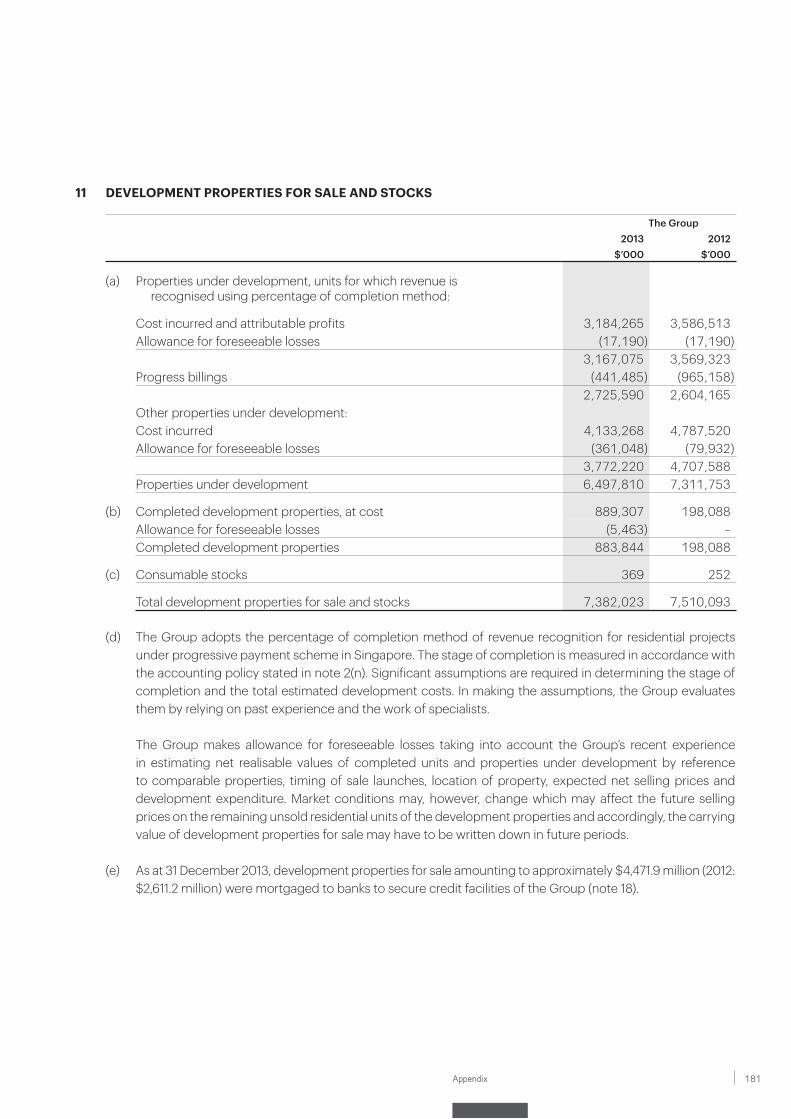
181Appendix
11 DEVELOPMENT PROPERTIES FOR SALE AND STOCKS
The Group2013 2012
$’000 $’000
(a) Properties under development, units for which revenue is recognised using percentage of completion method:
Cost incurred and attributable profits 3,184,265 3,586,513Allowance for foreseeable losses (17,190) (17,190)
3,167,075 3,569,323Progress billings (441,485) (965,158)
2,725,590 2,604,165 Other properties under development:Cost incurred 4,133,268 4,787,520Allowance for foreseeable losses (361,048) (79,932)
3,772,220 4,707,588Properties under development 6,497,810 7,311,753
(b) Completed development properties, at cost 889,307 198,088Allowance for foreseeable losses (5,463) –Completed development properties 883,844 198,088
(c) Consumable stocks 369 252
Total development properties for sale and stocks 7,382,023 7,510,093
(d) The Group adopts the percentage of completion method of revenue recognition for residential projects under progressive payment scheme in Singapore. The stage of completion is measured in accordance with the accounting policy stated in note 2(n). Significant assumptions are required in determining the stage of completion and the total estimated development costs. In making the assumptions, the Group evaluates them by relying on past experience and the work of specialists.
The Group makes allowance for foreseeable losses taking into account the Group’s recent experience
in estimating net realisable values of completed units and properties under development by reference to comparable properties, timing of sale launches, location of property, expected net selling prices and development expenditure. Market conditions may, however, change which may affect the future selling prices on the remaining unsold residential units of the development properties and accordingly, the carrying value of development properties for sale may have to be written down in future periods.
(e) As at 31 December 2013, development properties for sale amounting to approximately $4,471.9 million (2012: $2,611.2 million) were mortgaged to banks to secure credit facilities of the Group (note 18).
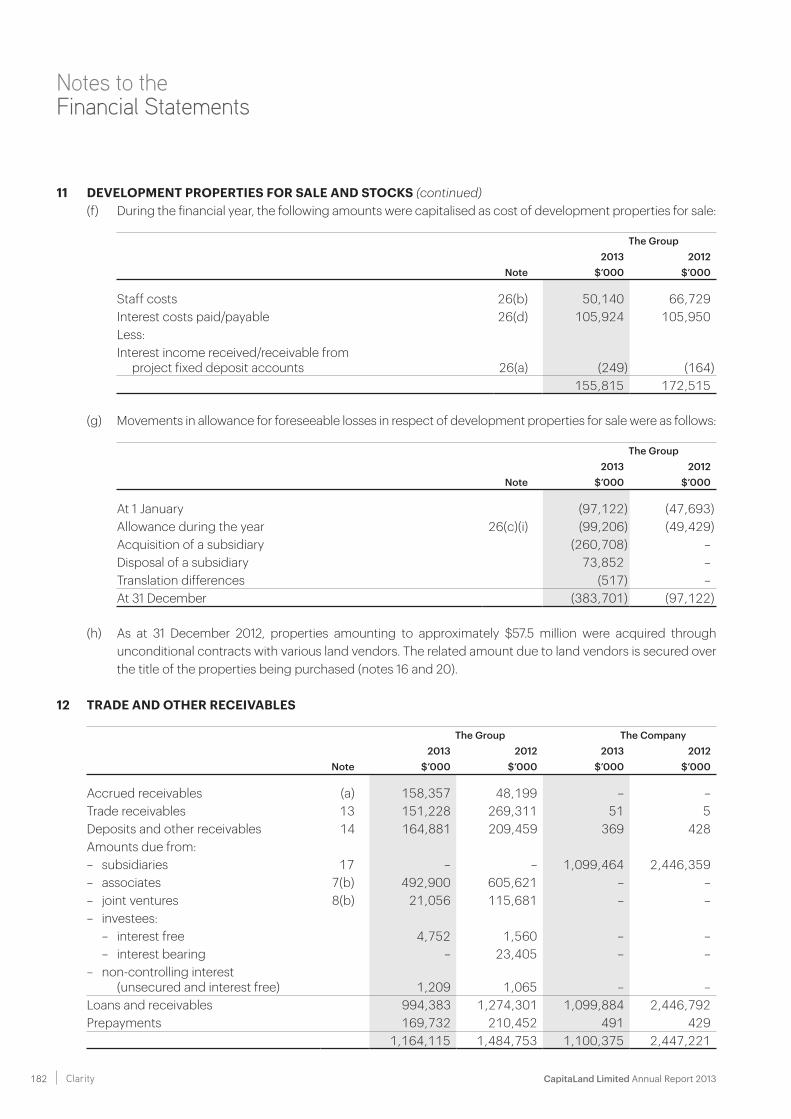
CapitaLand Limited Annual Report 2013 182 Clarity
Notes to the Financial Statements
11 DEVELOPMENT PROPERTIES FOR SALE AND STOCKS (continued)(f) During the financial year, the following amounts were capitalised as cost of development properties for sale:
The Group2013 2012
Note $’000 $’000
Staff costs 26(b) 50,140 66,729Interest costs paid/payable 26(d) 105,924 105,950Less:Interest income received/receivable from
project fixed deposit accounts 26(a) (249) (164)155,815 172,515
(g) Movements in allowance for foreseeable losses in respect of development properties for sale were as follows:
The Group2013 2012
Note $’000 $’000
At 1 January (97,122) (47,693)Allowance during the year 26(c)(i) (99,206) (49,429)Acquisition of a subsidiary (260,708) –Disposal of a subsidiary 73,852 –Translation differences (517) –At 31 December (383,701) (97,122)
(h) As at 31 December 2012, properties amounting to approximately $57.5 million were acquired through unconditional contracts with various land vendors. The related amount due to land vendors is secured over the title of the properties being purchased (notes 16 and 20).
12 TRADE AND OTHER RECEIVABLES
The Group The Company2013 2012 2013 2012
Note $’000 $’000 $’000 $’000
Accrued receivables (a) 158,357 48,199 – –Trade receivables 13 151,228 269,311 51 5Deposits and other receivables 14 164,881 209,459 369 428Amounts due from:– subsidiaries 17 – – 1,099,464 2,446,359– associates 7(b) 492,900 605,621 – –– joint ventures 8(b) 21,056 115,681 – –– investees: – interest free 4,752 1,560 – – – interest bearing – 23,405 – –– non-controlling interest
(unsecured and interest free) 1,209 1,065 – –Loans and receivables 994,383 1,274,301 1,099,884 2,446,792Prepayments 169,732 210,452 491 429
1,164,115 1,484,753 1,100,375 2,447,221
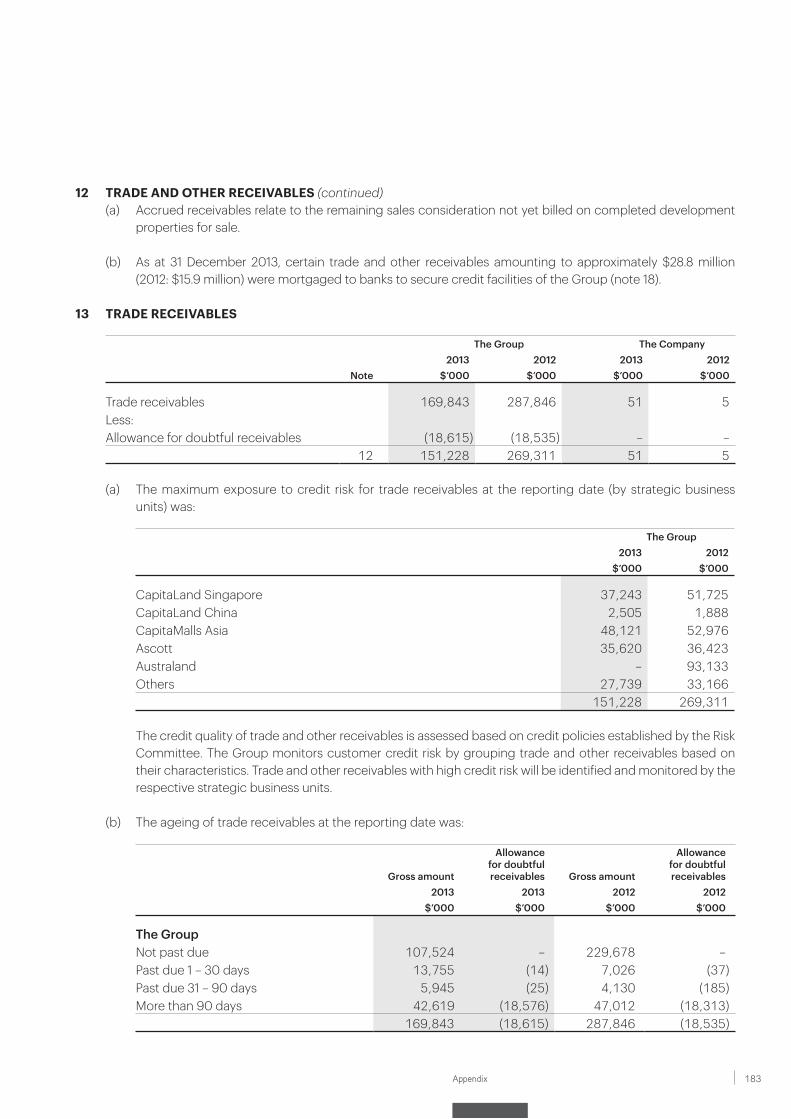
183Appendix
12 TRADE AND OTHER RECEIVABLES (continued)(a) Accrued receivables relate to the remaining sales consideration not yet billed on completed development
properties for sale.
(b) As at 31 December 2013, certain trade and other receivables amounting to approximately $28.8 million (2012: $15.9 million) were mortgaged to banks to secure credit facilities of the Group (note 18).
13 TRADE RECEIVABLES
The Group The Company2013 2012 2013 2012
Note $’000 $’000 $’000 $’000
Trade receivables 169,843 287,846 51 5Less:Allowance for doubtful receivables (18,615) (18,535) – –
12 151,228 269,311 51 5
(a) The maximum exposure to credit risk for trade receivables at the reporting date (by strategic business units) was:
The Group2013 2012
$’000 $’000
CapitaLand Singapore 37,243 51,725CapitaLand China 2,505 1,888CapitaMalls Asia 48,121 52,976Ascott 35,620 36,423Australand – 93,133Others 27,739 33,166
151,228 269,311
The credit quality of trade and other receivables is assessed based on credit policies established by the Risk Committee. The Group monitors customer credit risk by grouping trade and other receivables based on their characteristics. Trade and other receivables with high credit risk will be identified and monitored by the respective strategic business units.
(b) The ageing of trade receivables at the reporting date was:
Gross amount
Allowance for doubtful receivables Gross amount
Allowance for doubtful receivables
2013 2013 2012 2012$’000 $’000 $’000 $’000
The GroupNot past due 107,524 – 229,678 –Past due 1 – 30 days 13,755 (14) 7,026 (37)Past due 31 – 90 days 5,945 (25) 4,130 (185)More than 90 days 42,619 (18,576) 47,012 (18,313)
169,843 (18,615) 287,846 (18,535)
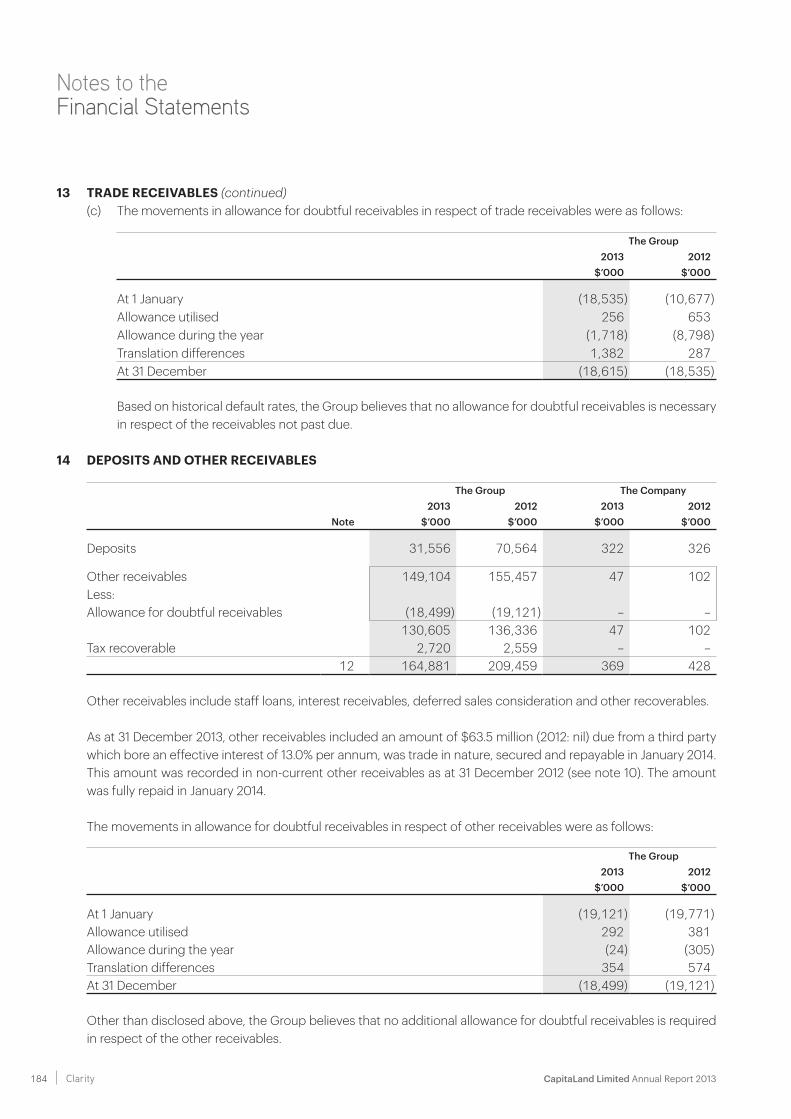
CapitaLand Limited Annual Report 2013 184 Clarity
Notes to the Financial Statements
13 TRADE RECEIVABLES (continued)(c) The movements in allowance for doubtful receivables in respect of trade receivables were as follows:
The Group2013 2012
$’000 $’000
At 1 January (18,535) (10,677)Allowance utilised 256 653Allowance during the year (1,718) (8,798)Translation differences 1,382 287At 31 December (18,615) (18,535)
Based on historical default rates, the Group believes that no allowance for doubtful receivables is necessary in respect of the receivables not past due.
14 DEPOSITS AND OTHER RECEIVABLES
The Group The Company2013 2012 2013 2012
Note $’000 $’000 $’000 $’000
Deposits 31,556 70,564 322 326
Other receivables 149,104 155,457 47 102Less:Allowance for doubtful receivables (18,499) (19,121) – –
130,605 136,336 47 102Tax recoverable 2,720 2,559 – –
12 164,881 209,459 369 428
Other receivables include staff loans, interest receivables, deferred sales consideration and other recoverables.
As at 31 December 2013, other receivables included an amount of $63.5 million (2012: nil) due from a third party which bore an effective interest of 13.0% per annum, was trade in nature, secured and repayable in January 2014. This amount was recorded in non-current other receivables as at 31 December 2012 (see note 10). The amount was fully repaid in January 2014.
The movements in allowance for doubtful receivables in respect of other receivables were as follows:
The Group2013 2012
$’000 $’000
At 1 January (19,121) (19,771)Allowance utilised 292 381Allowance during the year (24) (305)Translation differences 354 574At 31 December (18,499) (19,121)
Other than disclosed above, the Group believes that no additional allowance for doubtful receivables is required in respect of the other receivables.
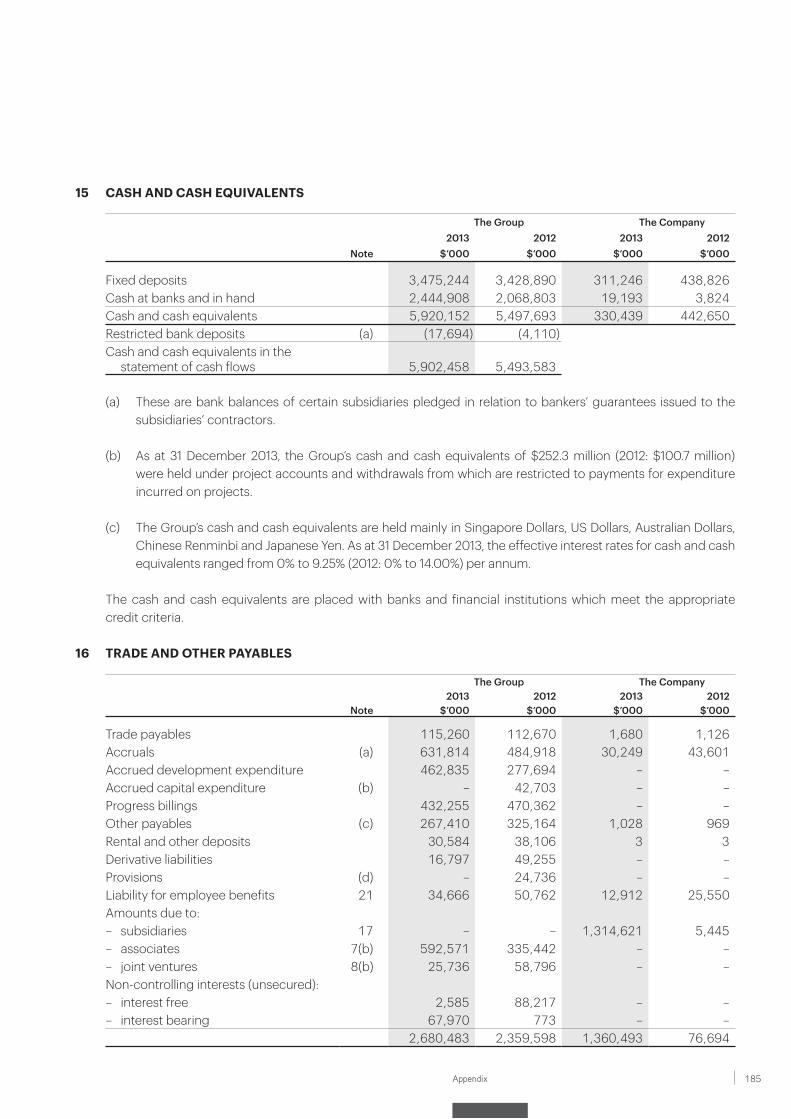
185Appendix
15 CASH AND CASH EQUIVALENTS
The Group The Company2013 2012 2013 2012
Note $’000 $’000 $’000 $’000
Fixed deposits 3,475,244 3,428,890 311,246 438,826Cash at banks and in hand 2,444,908 2,068,803 19,193 3,824Cash and cash equivalents 5,920,152 5,497,693 330,439 442,650Restricted bank deposits (a) (17,694) (4,110)Cash and cash equivalents in the
statement of cash flows 5,902,458 5,493,583
(a) These are bank balances of certain subsidiaries pledged in relation to bankers’ guarantees issued to the subsidiaries’ contractors.
(b) As at 31 December 2013, the Group’s cash and cash equivalents of $252.3 million (2012: $100.7 million) were held under project accounts and withdrawals from which are restricted to payments for expenditure incurred on projects.
(c) The Group’s cash and cash equivalents are held mainly in Singapore Dollars, US Dollars, Australian Dollars, Chinese Renminbi and Japanese Yen. As at 31 December 2013, the effective interest rates for cash and cash equivalents ranged from 0% to 9.25% (2012: 0% to 14.00%) per annum.
The cash and cash equivalents are placed with banks and financial institutions which meet the appropriate credit criteria.
16 TRADE AND OTHER PAYABLES
The Group The Company2013 2012 2013 2012
Note $’000 $’000 $’000 $’000
Trade payables 115,260 112,670 1,680 1,126Accruals (a) 631,814 484,918 30,249 43,601Accrued development expenditure 462,835 277,694 – –Accrued capital expenditure (b) – 42,703 – –Progress billings 432,255 470,362 – –Other payables (c) 267,410 325,164 1,028 969Rental and other deposits 30,584 38,106 3 3Derivative liabilities 16,797 49,255 – –Provisions (d) – 24,736 – –Liability for employee benefits 21 34,666 50,762 12,912 25,550Amounts due to:– subsidiaries 17 – – 1,314,621 5,445– associates 7(b) 592,571 335,442 – –– joint ventures 8(b) 25,736 58,796 – –Non-controlling interests (unsecured):– interest free 2,585 88,217 – –– interest bearing 67,970 773 – –
2,680,483 2,359,598 1,360,493 76,694
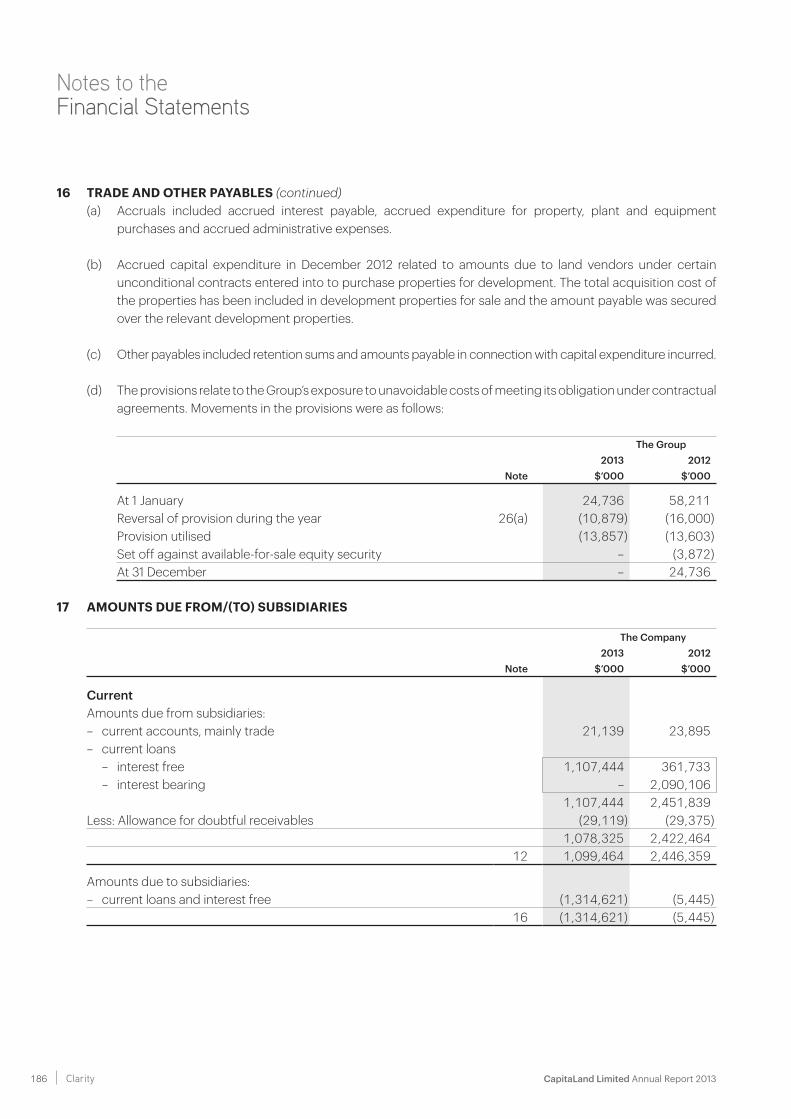
CapitaLand Limited Annual Report 2013 186 Clarity
Notes to the Financial Statements
16 TRADE AND OTHER PAYABLES (continued)(a) Accruals included accrued interest payable, accrued expenditure for property, plant and equipment
purchases and accrued administrative expenses. (b) Accrued capital expenditure in December 2012 related to amounts due to land vendors under certain
unconditional contracts entered into to purchase properties for development. The total acquisition cost of the properties has been included in development properties for sale and the amount payable was secured over the relevant development properties.
(c) Other payables included retention sums and amounts payable in connection with capital expenditure incurred.
(d) The provisions relate to the Group’s exposure to unavoidable costs of meeting its obligation under contractual agreements. Movements in the provisions were as follows:
The Group2013 2012
Note $’000 $’000
At 1 January 24,736 58,211Reversal of provision during the year 26(a) (10,879) (16,000)Provision utilised (13,857) (13,603)Set off against available-for-sale equity security – (3,872)At 31 December – 24,736
17 AMOUNTS DUE FROM/(TO) SUBSIDIARIES
The Company2013 2012
Note $’000 $’000
CurrentAmounts due from subsidiaries:– current accounts, mainly trade 21,139 23,895– current loans – interest free 1,107,444 361,733 – interest bearing – 2,090,106
1,107,444 2,451,839Less: Allowance for doubtful receivables (29,119) (29,375)
1,078,325 2,422,46412 1,099,464 2,446,359
Amounts due to subsidiaries:– current loans and interest free (1,314,621) (5,445)
16 (1,314,621) (5,445)
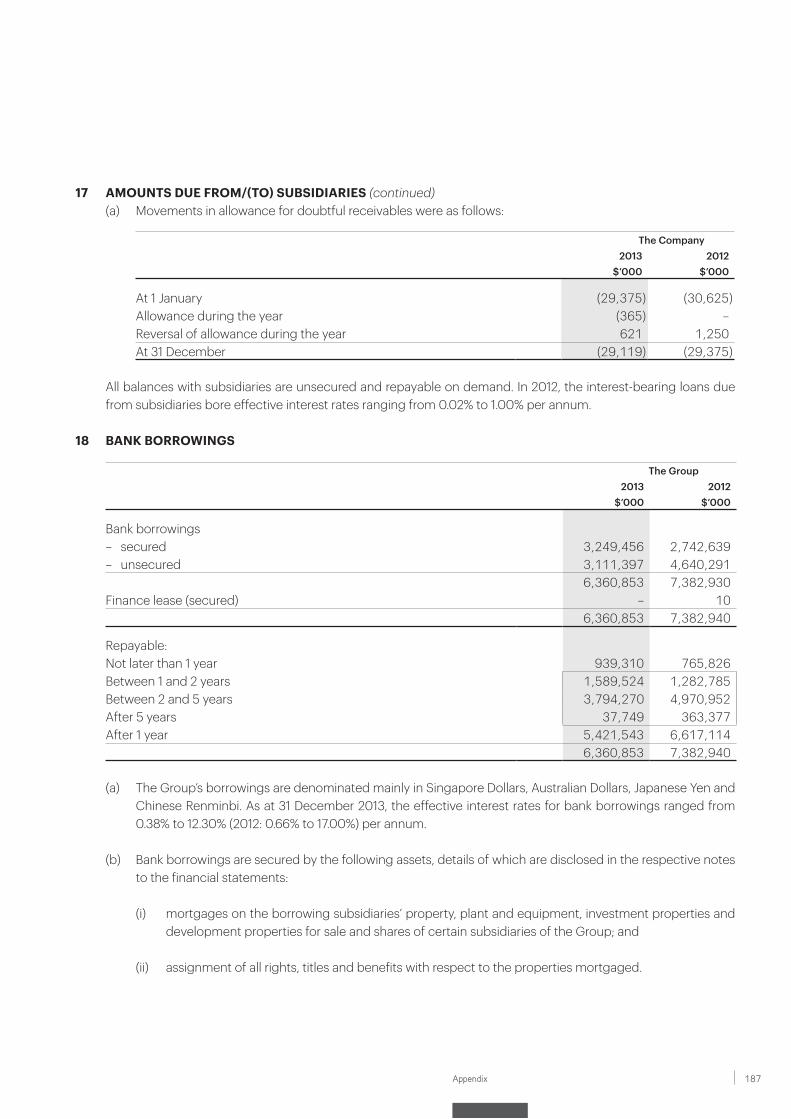
187Appendix
17 AMOUNTS DUE FROM/(TO) SUBSIDIARIES (continued)(a) Movements in allowance for doubtful receivables were as follows:
The Company2013 2012
$’000 $’000
At 1 January (29,375) (30,625)Allowance during the year (365) –Reversal of allowance during the year 621 1,250At 31 December (29,119) (29,375)
All balances with subsidiaries are unsecured and repayable on demand. In 2012, the interest-bearing loans due from subsidiaries bore effective interest rates ranging from 0.02% to 1.00% per annum.
18 BANK BORROWINGS
The Group2013 2012
$’000 $’000
Bank borrowings– secured 3,249,456 2,742,639– unsecured 3,111,397 4,640,291
6,360,853 7,382,930Finance lease (secured) – 10
6,360,853 7,382,940
Repayable:Not later than 1 year 939,310 765,826Between 1 and 2 years 1,589,524 1,282,785Between 2 and 5 years 3,794,270 4,970,952After 5 years 37,749 363,377After 1 year 5,421,543 6,617,114
6,360,853 7,382,940
(a) The Group’s borrowings are denominated mainly in Singapore Dollars, Australian Dollars, Japanese Yen and Chinese Renminbi. As at 31 December 2013, the effective interest rates for bank borrowings ranged from 0.38% to 12.30% (2012: 0.66% to 17.00%) per annum.
(b) Bank borrowings are secured by the following assets, details of which are disclosed in the respective notes to the financial statements:
(i) mortgages on the borrowing subsidiaries’ property, plant and equipment, investment properties and development properties for sale and shares of certain subsidiaries of the Group; and
(ii) assignment of all rights, titles and benefits with respect to the properties mortgaged.
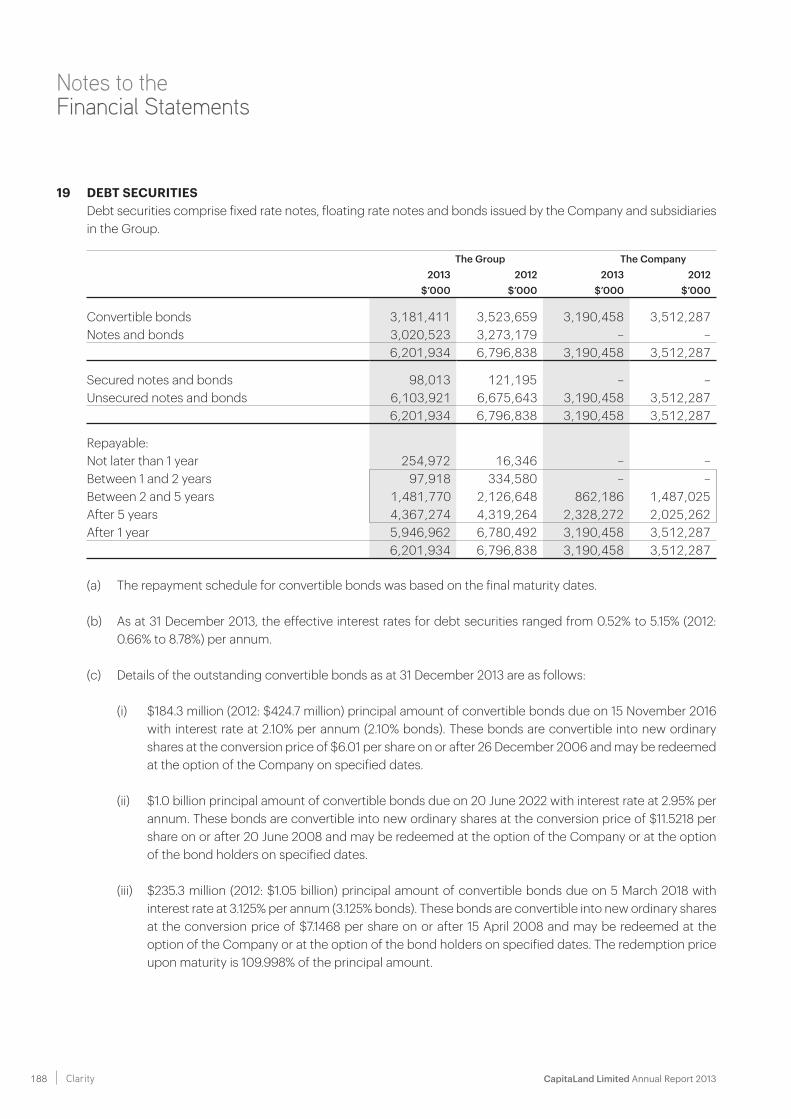
CapitaLand Limited Annual Report 2013 188 Clarity
Notes to the Financial Statements
19 DEBT SECURITIES Debt securities comprise fixed rate notes, floating rate notes and bonds issued by the Company and subsidiaries
in the Group.
The Group The Company2013 2012 2013 2012
$’000 $’000 $’000 $’000
Convertible bonds 3,181,411 3,523,659 3,190,458 3,512,287Notes and bonds 3,020,523 3,273,179 – –
6,201,934 6,796,838 3,190,458 3,512,287
Secured notes and bonds 98,013 121,195 – –Unsecured notes and bonds 6,103,921 6,675,643 3,190,458 3,512,287
6,201,934 6,796,838 3,190,458 3,512,287
Repayable:Not later than 1 year 254,972 16,346 – –Between 1 and 2 years 97,918 334,580 – –Between 2 and 5 years 1,481,770 2,126,648 862,186 1,487,025After 5 years 4,367,274 4,319,264 2,328,272 2,025,262After 1 year 5,946,962 6,780,492 3,190,458 3,512,287
6,201,934 6,796,838 3,190,458 3,512,287
(a) The repayment schedule for convertible bonds was based on the final maturity dates.
(b) As at 31 December 2013, the effective interest rates for debt securities ranged from 0.52% to 5.15% (2012: 0.66% to 8.78%) per annum.
(c) Details of the outstanding convertible bonds as at 31 December 2013 are as follows:
(i) $184.3 million (2012: $424.7 million) principal amount of convertible bonds due on 15 November 2016 with interest rate at 2.10% per annum (2.10% bonds). These bonds are convertible into new ordinary shares at the conversion price of $6.01 per share on or after 26 December 2006 and may be redeemed at the option of the Company on specified dates.
(ii) $1.0 billion principal amount of convertible bonds due on 20 June 2022 with interest rate at 2.95% per annum. These bonds are convertible into new ordinary shares at the conversion price of $11.5218 per share on or after 20 June 2008 and may be redeemed at the option of the Company or at the option of the bond holders on specified dates.
(iii) $235.3 million (2012: $1.05 billion) principal amount of convertible bonds due on 5 March 2018 with interest rate at 3.125% per annum (3.125% bonds). These bonds are convertible into new ordinary shares at the conversion price of $7.1468 per share on or after 15 April 2008 and may be redeemed at the option of the Company or at the option of the bond holders on specified dates. The redemption price upon maturity is 109.998% of the principal amount.
189Appendix
19 DEBT SECURITIES (continued)(iv) $467.0 million (2012: $1.20 billion) principal amount of convertible bonds due on 3 September 2016
with interest rate at 2.875% per annum (2.875% bonds). These bonds are convertible into new ordinary shares at the conversion price of $4.6836 (2012: $4.6908) per share on or after 14 October 2009 and may be redeemed at the option of the Company or at the option of the bond holders on specified dates.
(v) $650.0 million principal amount of convertible bonds due on 19 June 2020 with interest rate at 1.85% per annum. These bonds are convertible into new ordinary shares at the conversion price of $5.00 per share on or after 30 July 2013 and may be redeemed at the option of the Company or at the option of the bond holders on specified dates.
(vi) $800.0 million principal amount of convertible bonds due on 17 October 2023 with interest rate at 1.95% per annum. These bonds are convertible into new ordinary shares at the conversion price of $4.212 per share on or after 27 November 2013 and may be redeemed at the option of the Company or at the option of the bond holders on specified dates.
(d) During the year, the Company repurchased and cancelled $1,548.2 million convertible bonds comprising:
(i) $0.5 million of principal amount of 2.10% bonds due 2016;
(ii) $733.0 million of principal amount of 2.875% bonds due 2016; and
(iii) $814.7 million of principal amount of 3.125% bonds due 2018.
During the year, the Company also settled an aggregate principal amount of $240.0 million of its 2.10% bonds upon the redemption by bondholders.
(e) Secured debt securities As at 31 December 2013, the secured notes and bonds amounting to $98.0 million (2012: $121.2 million)
were fully secured by mortgages on the investment properties of the Group. Details on assets pledged are disclosed in the respective notes to the financial statements.
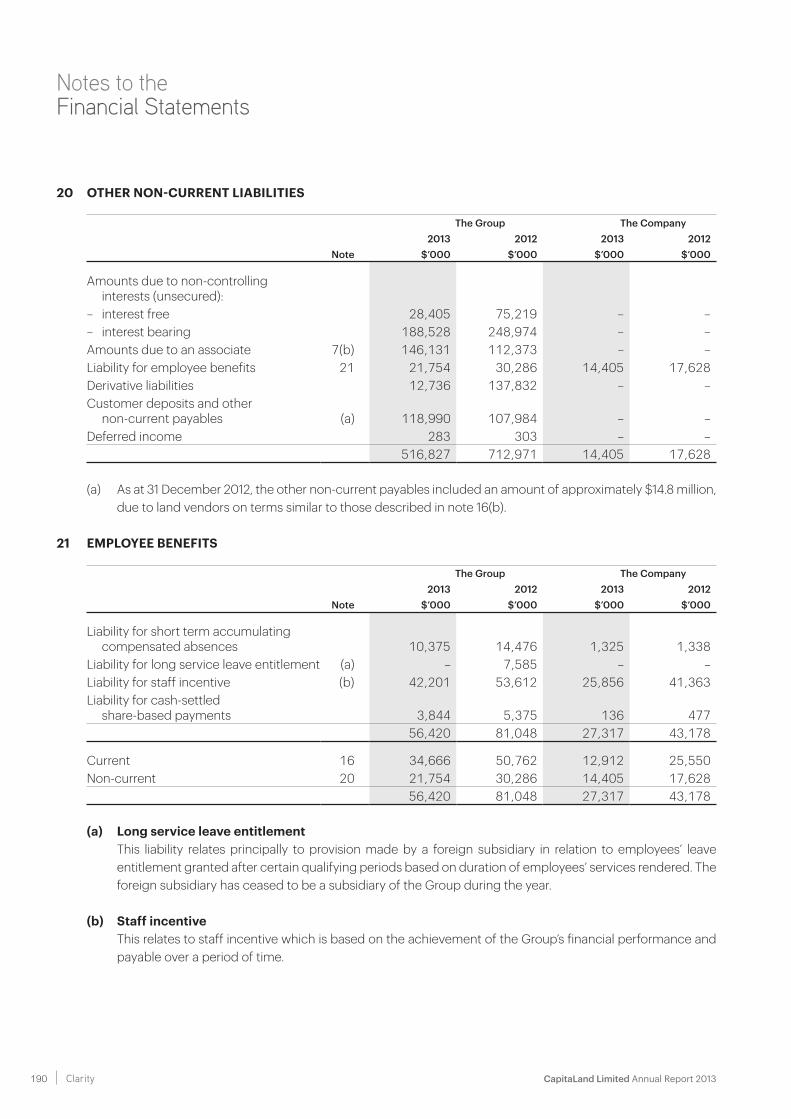
CapitaLand Limited Annual Report 2013 190 Clarity
Notes to the Financial Statements
20 OTHER NON-CURRENT LIABILITIES
The Group The Company2013 2012 2013 2012
Note $’000 $’000 $’000 $’000
Amounts due to non-controlling interests (unsecured):
– interest free 28,405 75,219 – –– interest bearing 188,528 248,974 – –Amounts due to an associate 7(b) 146,131 112,373 – –Liability for employee benefits 21 21,754 30,286 14,405 17,628Derivative liabilities 12,736 137,832 – –Customer deposits and other
non-current payables (a) 118,990 107,984 – –Deferred income 283 303 – –
516,827 712,971 14,405 17,628
(a) As at 31 December 2012, the other non-current payables included an amount of approximately $14.8 million, due to land vendors on terms similar to those described in note 16(b).
21 EMPLOYEE BENEFITS
The Group The Company2013 2012 2013 2012
Note $’000 $’000 $’000 $’000
Liability for short term accumulating compensated absences 10,375 14,476 1,325 1,338
Liability for long service leave entitlement (a) – 7,585 – –Liability for staff incentive (b) 42,201 53,612 25,856 41,363Liability for cash-settled
share-based payments 3,844 5,375 136 47756,420 81,048 27,317 43,178
Current 16 34,666 50,762 12,912 25,550Non-current 20 21,754 30,286 14,405 17,628
56,420 81,048 27,317 43,178
(a) Long service leave entitlement This liability relates principally to provision made by a foreign subsidiary in relation to employees’ leave
entitlement granted after certain qualifying periods based on duration of employees’ services rendered. The foreign subsidiary has ceased to be a subsidiary of the Group during the year.
(b) Staff incentive This relates to staff incentive which is based on the achievement of the Group’s financial performance and
payable over a period of time.
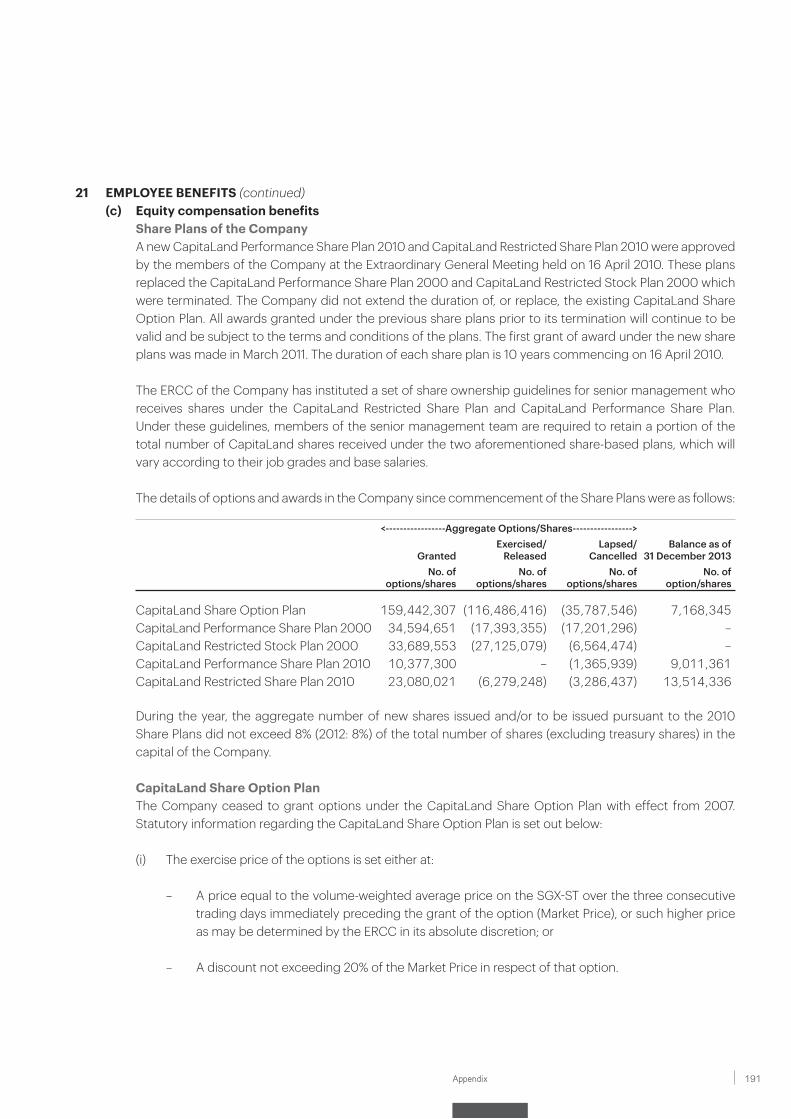
191Appendix
21 EMPLOYEE BENEFITS (continued)(c) Equity compensation benefits
Share Plans of the Company A new CapitaLand Performance Share Plan 2010 and CapitaLand Restricted Share Plan 2010 were approved
by the members of the Company at the Extraordinary General Meeting held on 16 April 2010. These plans replaced the CapitaLand Performance Share Plan 2000 and CapitaLand Restricted Stock Plan 2000 which were terminated. The Company did not extend the duration of, or replace, the existing CapitaLand Share Option Plan. All awards granted under the previous share plans prior to its termination will continue to be valid and be subject to the terms and conditions of the plans. The first grant of award under the new share plans was made in March 2011. The duration of each share plan is 10 years commencing on 16 April 2010.
The ERCC of the Company has instituted a set of share ownership guidelines for senior management who receives shares under the CapitaLand Restricted Share Plan and CapitaLand Performance Share Plan. Under these guidelines, members of the senior management team are required to retain a portion of the total number of CapitaLand shares received under the two aforementioned share-based plans, which will vary according to their job grades and base salaries.
The details of options and awards in the Company since commencement of the Share Plans were as follows:
<-----------------Aggregate Options/Shares----------------->
GrantedExercised/
ReleasedLapsed/
CancelledBalance as of
31 December 2013No. of
options/sharesNo. of
options/sharesNo. of
options/sharesNo. of
option/shares
CapitaLand Share Option Plan 159,442,307 (116,486,416) (35,787,546) 7,168,345CapitaLand Performance Share Plan 2000 34,594,651 (17,393,355) (17,201,296) –CapitaLand Restricted Stock Plan 2000 33,689,553 (27,125,079) (6,564,474) –CapitaLand Performance Share Plan 2010 10,377,300 – (1,365,939) 9,011,361CapitaLand Restricted Share Plan 2010 23,080,021 (6,279,248) (3,286,437) 13,514,336
During the year, the aggregate number of new shares issued and/or to be issued pursuant to the 2010 Share Plans did not exceed 8% (2012: 8%) of the total number of shares (excluding treasury shares) in the capital of the Company.
CapitaLand Share Option Plan The Company ceased to grant options under the CapitaLand Share Option Plan with effect from 2007.
Statutory information regarding the CapitaLand Share Option Plan is set out below:
(i) The exercise price of the options is set either at:
– A price equal to the volume-weighted average price on the SGX-ST over the three consecutive trading days immediately preceding the grant of the option (Market Price), or such higher price as may be determined by the ERCC in its absolute discretion; or
– A discount not exceeding 20% of the Market Price in respect of that option.
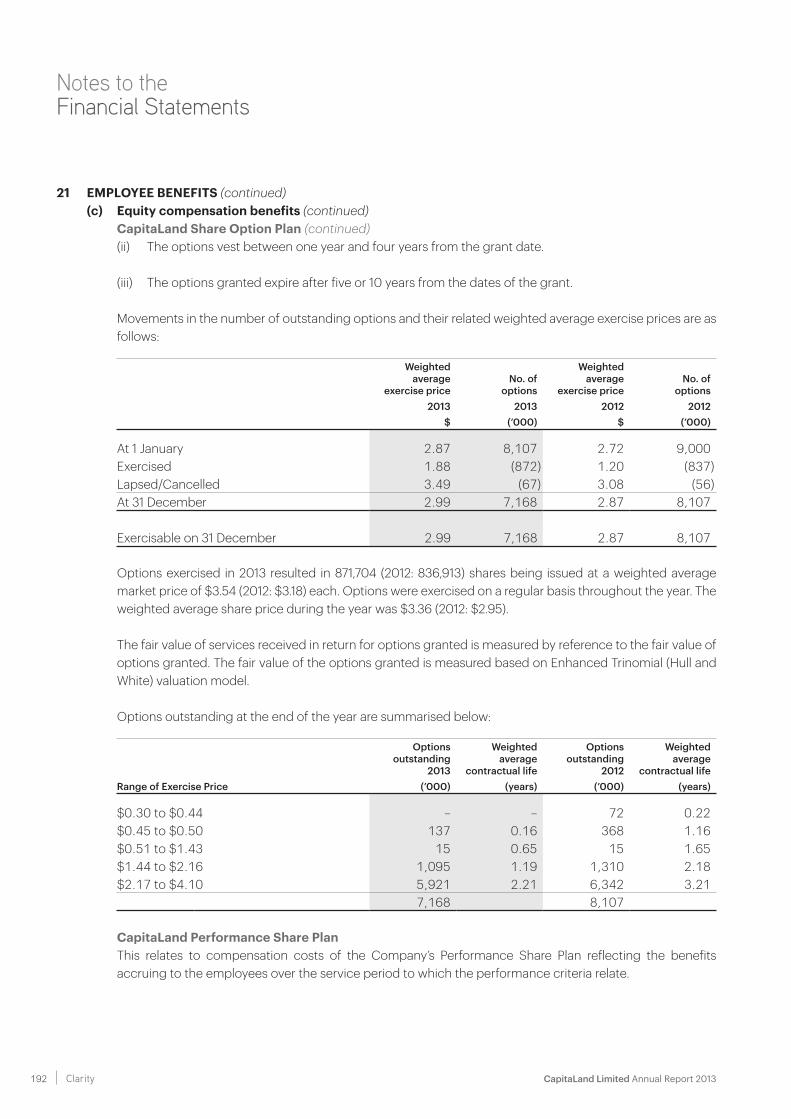
CapitaLand Limited Annual Report 2013 192 Clarity
Notes to the Financial Statements
21 EMPLOYEE BENEFITS (continued)(c) Equity compensation benefits (continued)
CapitaLand Share Option Plan (continued)(ii) The options vest between one year and four years from the grant date.
(iii) The options granted expire after five or 10 years from the dates of the grant.
Movements in the number of outstanding options and their related weighted average exercise prices are as follows:
Weighted average
exercise priceNo. of
options
Weighted average
exercise priceNo. of
options2013 2013 2012 2012
$ (’000) $ (’000)
At 1 January 2.87 8,107 2.72 9,000Exercised 1.88 (872) 1.20 (837)Lapsed/Cancelled 3.49 (67) 3.08 (56)At 31 December 2.99 7,168 2.87 8,107
Exercisable on 31 December 2.99 7,168 2.87 8,107
Options exercised in 2013 resulted in 871,704 (2012: 836,913) shares being issued at a weighted average market price of $3.54 (2012: $3.18) each. Options were exercised on a regular basis throughout the year. The weighted average share price during the year was $3.36 (2012: $2.95).
The fair value of services received in return for options granted is measured by reference to the fair value of options granted. The fair value of the options granted is measured based on Enhanced Trinomial (Hull and White) valuation model.
Options outstanding at the end of the year are summarised below:
Options outstanding
2013
Weighted average
contractual life
Options outstanding
2012
Weighted average
contractual lifeRange of Exercise Price (’000) (years) (’000) (years)
$0.30 to $0.44 – – 72 0.22$0.45 to $0.50 137 0.16 368 1.16$0.51 to $1.43 15 0.65 15 1.65$1.44 to $2.16 1,095 1.19 1,310 2.18$2.17 to $4.10 5,921 2.21 6,342 3.21
7,168 8,107
CapitaLand Performance Share Plan This relates to compensation costs of the Company’s Performance Share Plan reflecting the benefits
accruing to the employees over the service period to which the performance criteria relate.
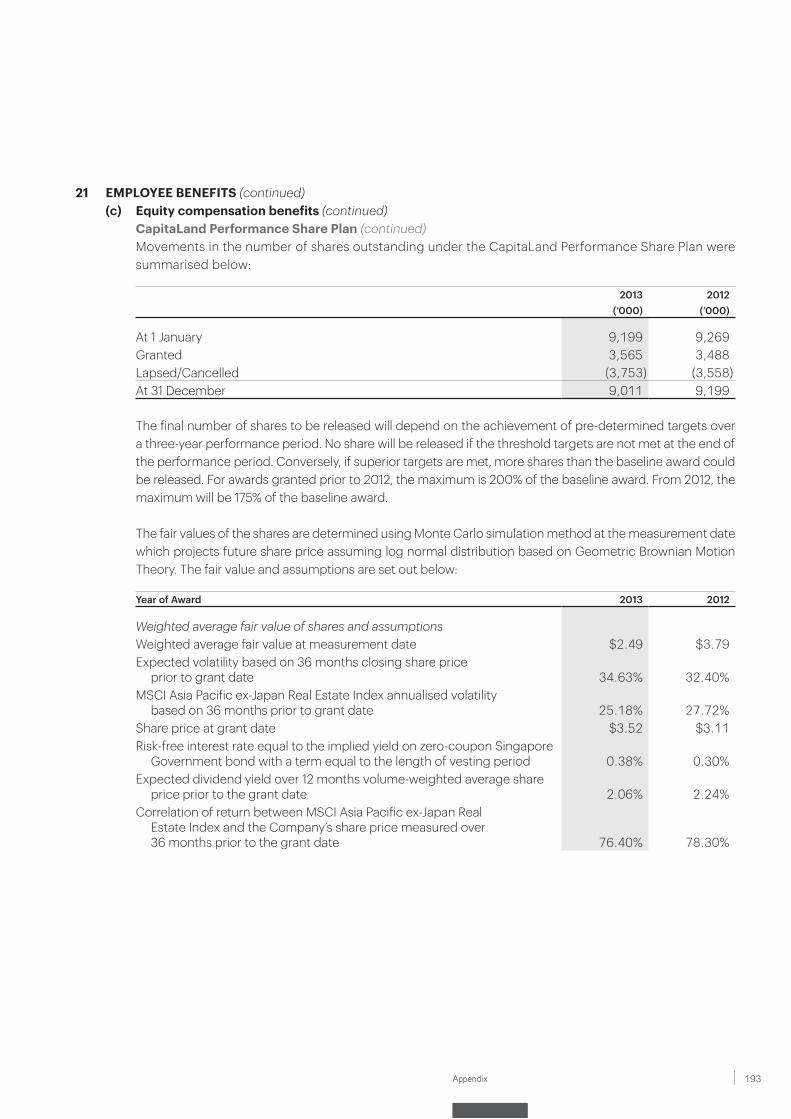
193Appendix
21 EMPLOYEE BENEFITS (continued)(c) Equity compensation benefits (continued)
CapitaLand Performance Share Plan (continued) Movements in the number of shares outstanding under the CapitaLand Performance Share Plan were
summarised below:
2013 2012(’000) (’000)
At 1 January 9,199 9,269Granted 3,565 3,488Lapsed/Cancelled (3,753) (3,558)At 31 December 9,011 9,199
The final number of shares to be released will depend on the achievement of pre-determined targets over a three-year performance period. No share will be released if the threshold targets are not met at the end of the performance period. Conversely, if superior targets are met, more shares than the baseline award could be released. For awards granted prior to 2012, the maximum is 200% of the baseline award. From 2012, the maximum will be 175% of the baseline award.
The fair values of the shares are determined using Monte Carlo simulation method at the measurement date which projects future share price assuming log normal distribution based on Geometric Brownian Motion Theory. The fair value and assumptions are set out below:
Year of Award 2013 2012
Weighted average fair value of shares and assumptionsWeighted average fair value at measurement date $2.49 $3.79Expected volatility based on 36 months closing share price
prior to grant date 34.63% 32.40%MSCI Asia Pacific ex-Japan Real Estate Index annualised volatility
based on 36 months prior to grant date 25.18% 27.72%Share price at grant date $3.52 $3.11Risk-free interest rate equal to the implied yield on zero-coupon Singapore
Government bond with a term equal to the length of vesting period 0.38% 0.30%Expected dividend yield over 12 months volume-weighted average share
price prior to the grant date 2.06% 2.24%Correlation of return between MSCI Asia Pacific ex-Japan Real
Estate Index and the Company’s share price measured over 36 months prior to the grant date 76.40% 78.30%
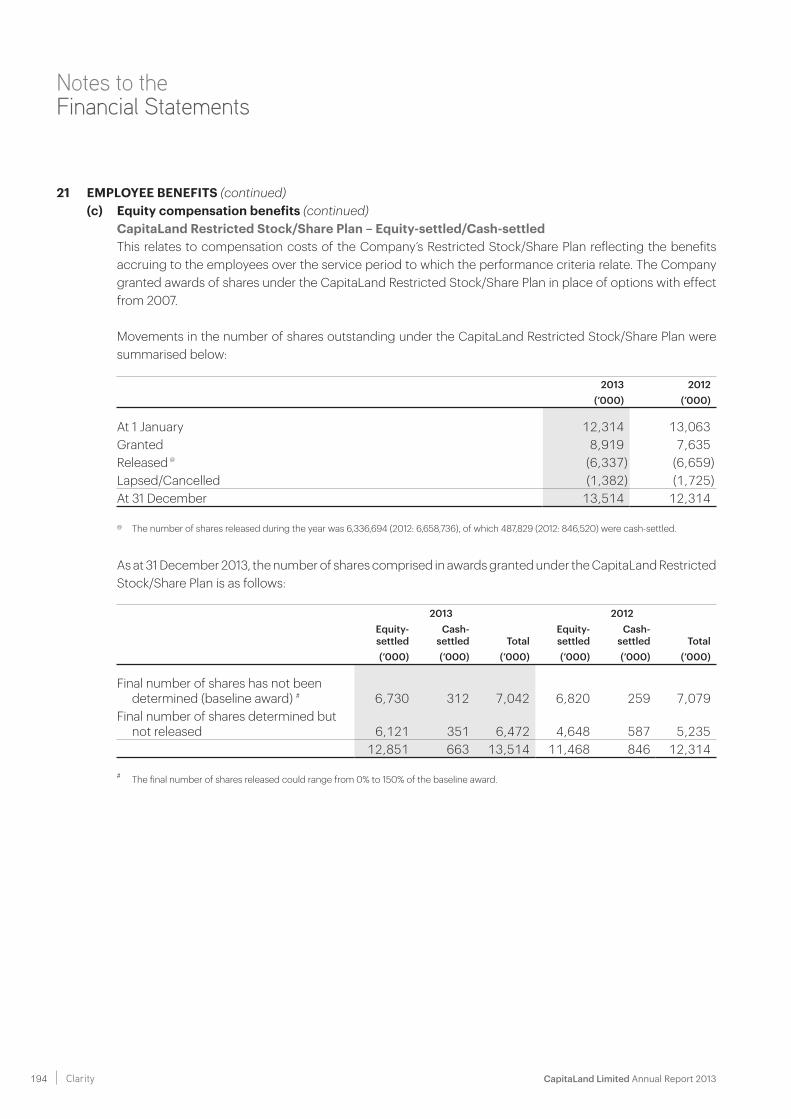
CapitaLand Limited Annual Report 2013 194 Clarity
Notes to the Financial Statements
21 EMPLOYEE BENEFITS (continued)(c) Equity compensation benefits (continued)
CapitaLand Restricted Stock/Share Plan – Equity-settled/Cash-settled This relates to compensation costs of the Company’s Restricted Stock/Share Plan reflecting the benefits
accruing to the employees over the service period to which the performance criteria relate. The Company granted awards of shares under the CapitaLand Restricted Stock/Share Plan in place of options with effect from 2007.
Movements in the number of shares outstanding under the CapitaLand Restricted Stock/Share Plan were summarised below:
2013 2012(’000) (’000)
At 1 January 12,314 13,063Granted 8,919 7,635Released @ (6,337) (6,659)Lapsed/Cancelled (1,382) (1,725)At 31 December 13,514 12,314
@ The number of shares released during the year was 6,336,694 (2012: 6,658,736), of which 487,829 (2012: 846,520) were cash-settled.
As at 31 December 2013, the number of shares comprised in awards granted under the CapitaLand Restricted Stock/Share Plan is as follows:
2013 2012Equity-settled
Cash-settled Total
Equity-settled
Cash-settled Total
(’000) (’000) (’000) (’000) (’000) (’000)
Final number of shares has not been determined (baseline award) # 6,730 312 7,042 6,820 259 7,079
Final number of shares determined but not released 6,121 351 6,472 4,648 587 5,235
12,851 663 13,514 11,468 846 12,314
# The final number of shares released could range from 0% to 150% of the baseline award.

195Appendix
21 EMPLOYEE BENEFITS (continued)(c) Equity compensation benefits (continued)
CapitaLand Restricted Stock/Share Plan – Equity-settled/Cash-settled (continued) The final number of shares to be released will depend on the achievement of pre-determined targets at the
end of a one-year performance period. No share will be released if the threshold targets are not met at the end of the performance period. Conversely, if superior targets are met, more shares than the baseline award could be delivered up to a maximum of 150% of the baseline award. The shares have a vesting schedule of two to three years. Recipient can receive fully paid shares, their equivalent cash value or combinations thereof, at no cost.
With effect from 2011, the awards to non-executive directors form part of the directors’ fees and will be an outright grant with no performance and vesting conditions.
Cash-settled awards of shares are measured at their current fair values at each balance sheet date.
The fair values of the shares granted to employees are determined using Monte Carlo simulation method at the measurement date which projects future share price assuming log normal distribution based on Geometric Brownian Motion Theory. The fair value and assumptions are set out below:
Year of Award 2013 2012
Weighted average fair value of shares and assumptionsWeighted average fair value at measurement date $3.40 $3.00Expected volatility based on 36 months closing share price
prior to grant date 34.63% 32.40%Share price at grant date $3.52 $3.11Risk-free interest rate equal to the implied yield on zero-coupon Singapore
Government bond with a term equal to the length of vesting period0.18% to
0.38%0.15% to
0.30%Expected dividend yield over 12 months volume-weighted average share
price prior to the grant date 2.06% 2.24%
The fair value of the shares awarded to non-executive directors in 2013 was $3.75 (2012: $2.68) which was the volume-weighted average price of a CapitaLand share on the SGX-ST over the 14 trading days from (and including) the ex-dividend date following the date of CapitaLand’s Annual General Meeting.
From 2012, cash-settled award plan for non-managerial grade employees in Singapore, Malaysia and Japan has been replaced by a Restricted Cash Plan (RCP). Under RCP, a cash bonus is distributed to eligible employees at the end of each financial year based on the Group’s financial performance and achievement of performance targets, as well as individual performance.
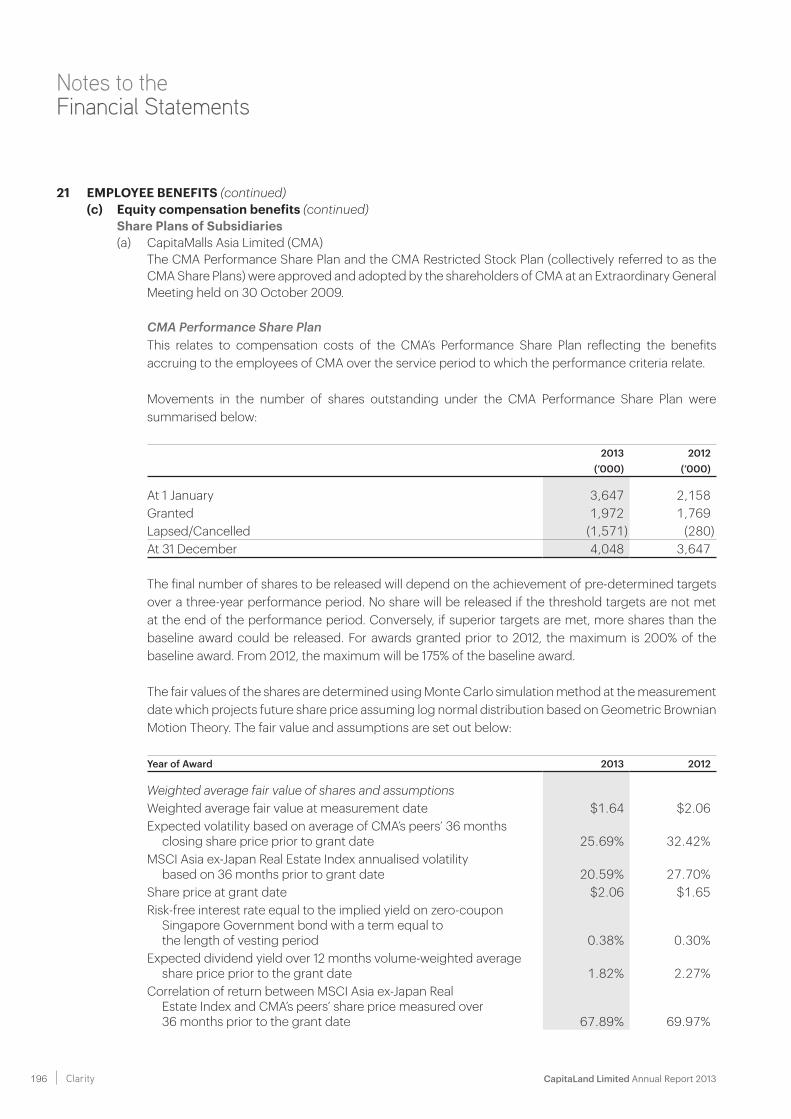
CapitaLand Limited Annual Report 2013 196 Clarity
Notes to the Financial Statements
21 EMPLOYEE BENEFITS (continued)(c) Equity compensation benefits (continued)
Share Plans of Subsidiaries(a) CapitaMalls Asia Limited (CMA) The CMA Performance Share Plan and the CMA Restricted Stock Plan (collectively referred to as the
CMA Share Plans) were approved and adopted by the shareholders of CMA at an Extraordinary General Meeting held on 30 October 2009.
CMA Performance Share Plan This relates to compensation costs of the CMA’s Performance Share Plan reflecting the benefits
accruing to the employees of CMA over the service period to which the performance criteria relate.
Movements in the number of shares outstanding under the CMA Performance Share Plan were summarised below:
2013 2012(’000) (’000)
At 1 January 3,647 2,158Granted 1,972 1,769Lapsed/Cancelled (1,571) (280)At 31 December 4,048 3,647
The final number of shares to be released will depend on the achievement of pre-determined targets over a three-year performance period. No share will be released if the threshold targets are not met at the end of the performance period. Conversely, if superior targets are met, more shares than the baseline award could be released. For awards granted prior to 2012, the maximum is 200% of the baseline award. From 2012, the maximum will be 175% of the baseline award.
The fair values of the shares are determined using Monte Carlo simulation method at the measurement date which projects future share price assuming log normal distribution based on Geometric Brownian Motion Theory. The fair value and assumptions are set out below:
Year of Award 2013 2012
Weighted average fair value of shares and assumptionsWeighted average fair value at measurement date $1.64 $2.06Expected volatility based on average of CMA’s peers’ 36 months
closing share price prior to grant date 25.69% 32.42%MSCI Asia ex-Japan Real Estate Index annualised volatility
based on 36 months prior to grant date 20.59% 27.70%Share price at grant date $2.06 $1.65Risk-free interest rate equal to the implied yield on zero-coupon
Singapore Government bond with a term equal to the length of vesting period 0.38% 0.30%
Expected dividend yield over 12 months volume-weighted average share price prior to the grant date 1.82% 2.27%
Correlation of return between MSCI Asia ex-Japan Real Estate Index and CMA’s peers’ share price measured over 36 months prior to the grant date 67.89% 69.97%
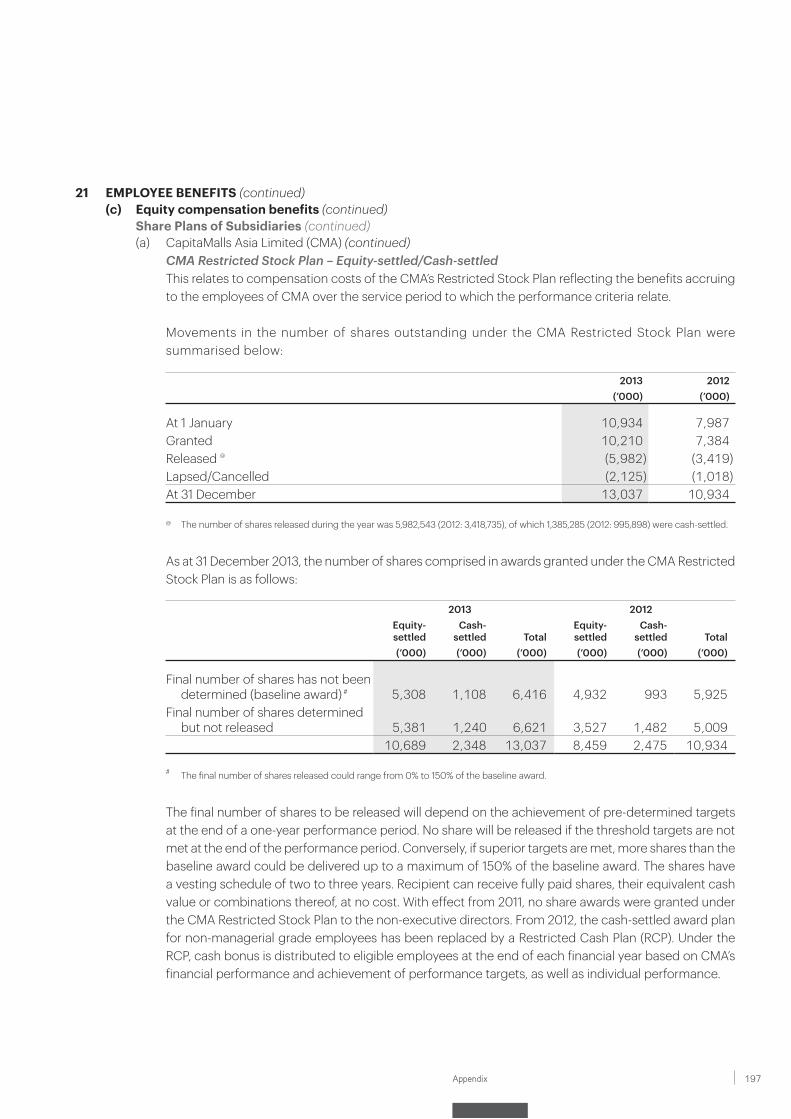
197Appendix
21 EMPLOYEE BENEFITS (continued)(c) Equity compensation benefits (continued)
Share Plans of Subsidiaries (continued)(a) CapitaMalls Asia Limited (CMA) (continued)
CMA Restricted Stock Plan – Equity-settled/Cash-settled This relates to compensation costs of the CMA’s Restricted Stock Plan reflecting the benefits accruing
to the employees of CMA over the service period to which the performance criteria relate.
Movements in the number of shares outstanding under the CMA Restricted Stock Plan were summarised below:
2013 2012(’000) (’000)
At 1 January 10,934 7,987Granted 10,210 7,384Released @ (5,982) (3,419)Lapsed/Cancelled (2,125) (1,018)At 31 December 13,037 10,934
@ The number of shares released during the year was 5,982,543 (2012: 3,418,735), of which 1,385,285 (2012: 995,898) were cash-settled.
As at 31 December 2013, the number of shares comprised in awards granted under the CMA Restricted Stock Plan is as follows:
2013 2012Equity-settled
Cash-settled Total
Equity-settled
Cash-settled Total
(’000) (’000) (’000) (’000) (’000) (’000)
Final number of shares has not been determined (baseline award) # 5,308 1,108 6,416 4,932 993 5,925
Final number of shares determined but not released 5,381 1,240 6,621 3,527 1,482 5,009
10,689 2,348 13,037 8,459 2,475 10,934
# The final number of shares released could range from 0% to 150% of the baseline award.
The final number of shares to be released will depend on the achievement of pre-determined targets at the end of a one-year performance period. No share will be released if the threshold targets are not met at the end of the performance period. Conversely, if superior targets are met, more shares than the baseline award could be delivered up to a maximum of 150% of the baseline award. The shares have a vesting schedule of two to three years. Recipient can receive fully paid shares, their equivalent cash value or combinations thereof, at no cost. With effect from 2011, no share awards were granted under the CMA Restricted Stock Plan to the non-executive directors. From 2012, the cash-settled award plan for non-managerial grade employees has been replaced by a Restricted Cash Plan (RCP). Under the RCP, cash bonus is distributed to eligible employees at the end of each financial year based on CMA’s financial performance and achievement of performance targets, as well as individual performance.
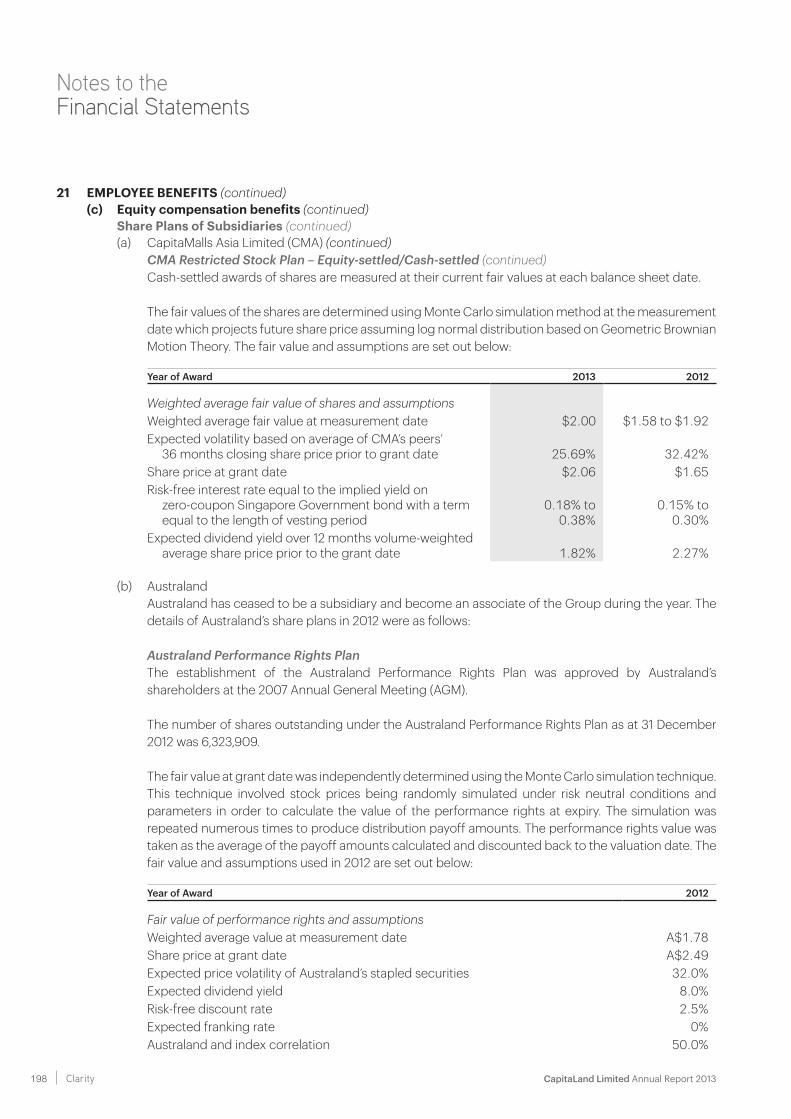
CapitaLand Limited Annual Report 2013 198 Clarity
Notes to the Financial Statements
21 EMPLOYEE BENEFITS (continued)(c) Equity compensation benefits (continued)
Share Plans of Subsidiaries (continued)(a) CapitaMalls Asia Limited (CMA) (continued)
CMA Restricted Stock Plan – Equity-settled/Cash-settled (continued) Cash-settled awards of shares are measured at their current fair values at each balance sheet date.
The fair values of the shares are determined using Monte Carlo simulation method at the measurement date which projects future share price assuming log normal distribution based on Geometric Brownian Motion Theory. The fair value and assumptions are set out below:
Year of Award 2013 2012
Weighted average fair value of shares and assumptionsWeighted average fair value at measurement date $2.00 $1.58 to $1.92Expected volatility based on average of CMA‘s peers’
36 months closing share price prior to grant date 25.69% 32.42%Share price at grant date $2.06 $1.65Risk-free interest rate equal to the implied yield on
zero-coupon Singapore Government bond with a term equal to the length of vesting period
0.18% to0.38%
0.15% to0.30%
Expected dividend yield over 12 months volume-weighted average share price prior to the grant date 1.82% 2.27%
(b) Australand Australand has ceased to be a subsidiary and become an associate of the Group during the year. The
details of Australand’s share plans in 2012 were as follows:
Australand Performance Rights Plan The establishment of the Australand Performance Rights Plan was approved by Australand’s
shareholders at the 2007 Annual General Meeting (AGM).
The number of shares outstanding under the Australand Performance Rights Plan as at 31 December 2012 was 6,323,909.
The fair value at grant date was independently determined using the Monte Carlo simulation technique. This technique involved stock prices being randomly simulated under risk neutral conditions and parameters in order to calculate the value of the performance rights at expiry. The simulation was repeated numerous times to produce distribution payoff amounts. The performance rights value was taken as the average of the payoff amounts calculated and discounted back to the valuation date. The fair value and assumptions used in 2012 are set out below:
Year of Award 2012
Fair value of performance rights and assumptionsWeighted average value at measurement date A$1.78Share price at grant date A$2.49Expected price volatility of Australand’s stapled securities 32.0%Expected dividend yield 8.0%Risk-free discount rate 2.5%Expected franking rate 0%Australand and index correlation 50.0%
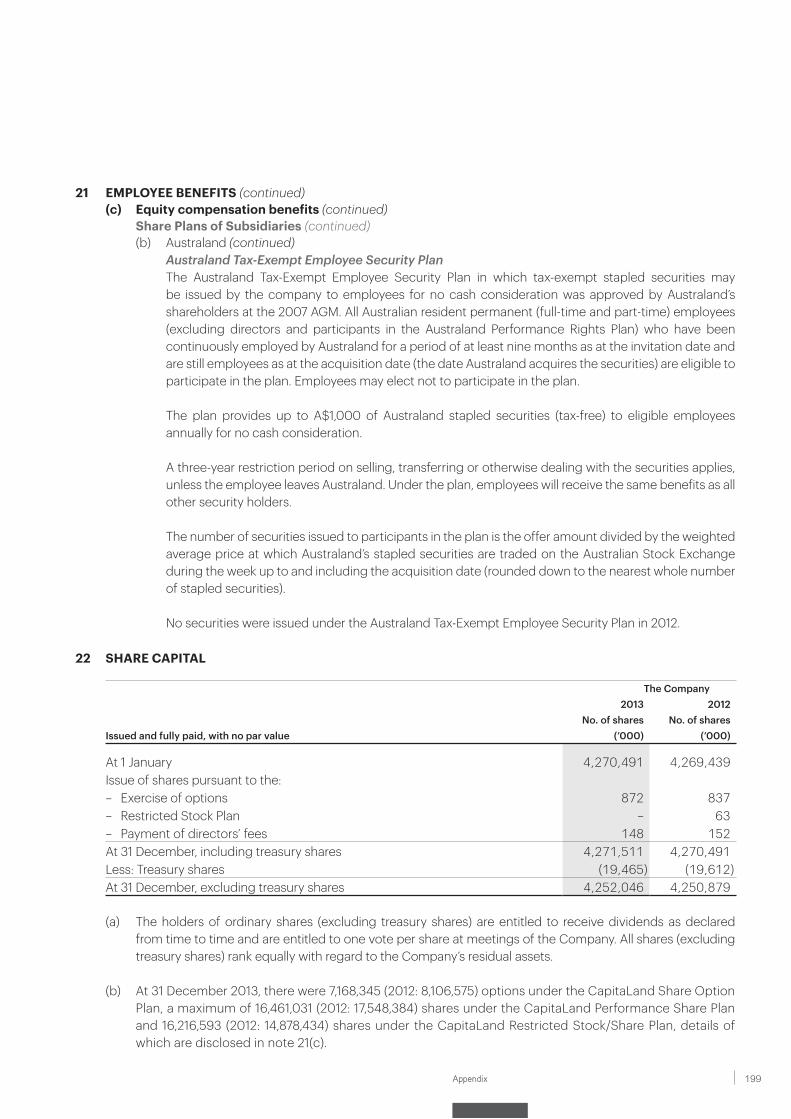
199Appendix
21 EMPLOYEE BENEFITS (continued)(c) Equity compensation benefits (continued)
Share Plans of Subsidiaries (continued)(b) Australand (continued)
Australand Tax-Exempt Employee Security Plan The Australand Tax-Exempt Employee Security Plan in which tax-exempt stapled securities may
be issued by the company to employees for no cash consideration was approved by Australand’s shareholders at the 2007 AGM. All Australian resident permanent (full-time and part-time) employees (excluding directors and participants in the Australand Performance Rights Plan) who have been continuously employed by Australand for a period of at least nine months as at the invitation date and are still employees as at the acquisition date (the date Australand acquires the securities) are eligible to participate in the plan. Employees may elect not to participate in the plan.
The plan provides up to A$1,000 of Australand stapled securities (tax-free) to eligible employees annually for no cash consideration.
A three-year restriction period on selling, transferring or otherwise dealing with the securities applies, unless the employee leaves Australand. Under the plan, employees will receive the same benefits as all other security holders.
The number of securities issued to participants in the plan is the offer amount divided by the weighted average price at which Australand’s stapled securities are traded on the Australian Stock Exchange during the week up to and including the acquisition date (rounded down to the nearest whole number of stapled securities).
No securities were issued under the Australand Tax-Exempt Employee Security Plan in 2012.
22 SHARE CAPITAL
The Company2013 2012
No. of shares No. of sharesIssued and fully paid, with no par value (’000) (’000)
At 1 January 4,270,491 4,269,439Issue of shares pursuant to the:– Exercise of options 872 837– Restricted Stock Plan – 63– Payment of directors’ fees 148 152At 31 December, including treasury shares 4,271,511 4,270,491Less: Treasury shares (19,465) (19,612)At 31 December, excluding treasury shares 4,252,046 4,250,879
(a) The holders of ordinary shares (excluding treasury shares) are entitled to receive dividends as declared from time to time and are entitled to one vote per share at meetings of the Company. All shares (excluding treasury shares) rank equally with regard to the Company’s residual assets.
(b) At 31 December 2013, there were 7,168,345 (2012: 8,106,575) options under the CapitaLand Share Option Plan, a maximum of 16,461,031 (2012: 17,548,384) shares under the CapitaLand Performance Share Plan and 16,216,593 (2012: 14,878,434) shares under the CapitaLand Restricted Stock/Share Plan, details of which are disclosed in note 21(c).
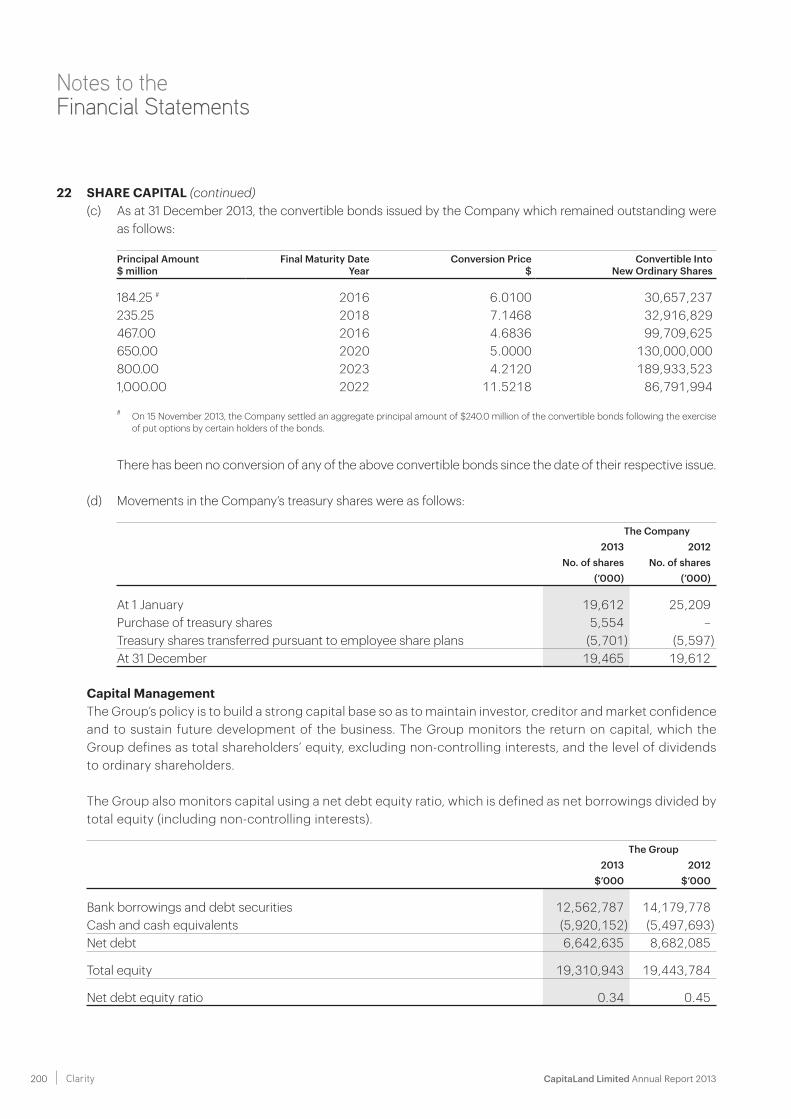
CapitaLand Limited Annual Report 2013 200 Clarity
Notes to the Financial Statements
22 SHARE CAPITAL (continued)(c) As at 31 December 2013, the convertible bonds issued by the Company which remained outstanding were
as follows:
Principal Amount$ million
Final Maturity DateYear
Conversion Price$
Convertible IntoNew Ordinary Shares
184.25 # 2016 6.0100 30,657,237 235.25 2018 7.1468 32,916,829 467.00 2016 4.6836 99,709,625 650.00 2020 5.0000 130,000,000 800.00 2023 4.2120 189,933,523 1,000.00 2022 11.5218 86,791,994
# On 15 November 2013, the Company settled an aggregate principal amount of $240.0 million of the convertible bonds following the exercise of put options by certain holders of the bonds.
There has been no conversion of any of the above convertible bonds since the date of their respective issue.
(d) Movements in the Company’s treasury shares were as follows:
The Company2013 2012
No. of shares No. of shares(’000) (’000)
At 1 January 19,612 25,209Purchase of treasury shares 5,554 –Treasury shares transferred pursuant to employee share plans (5,701) (5,597)At 31 December 19,465 19,612
Capital Management The Group’s policy is to build a strong capital base so as to maintain investor, creditor and market confidence
and to sustain future development of the business. The Group monitors the return on capital, which the Group defines as total shareholders’ equity, excluding non-controlling interests, and the level of dividends to ordinary shareholders.
The Group also monitors capital using a net debt equity ratio, which is defined as net borrowings divided by total equity (including non-controlling interests).
The Group2013 2012
$’000 $’000
Bank borrowings and debt securities 12,562,787 14,179,778Cash and cash equivalents (5,920,152) (5,497,693)Net debt 6,642,635 8,682,085
Total equity 19,310,943 19,443,784
Net debt equity ratio 0.34 0.45
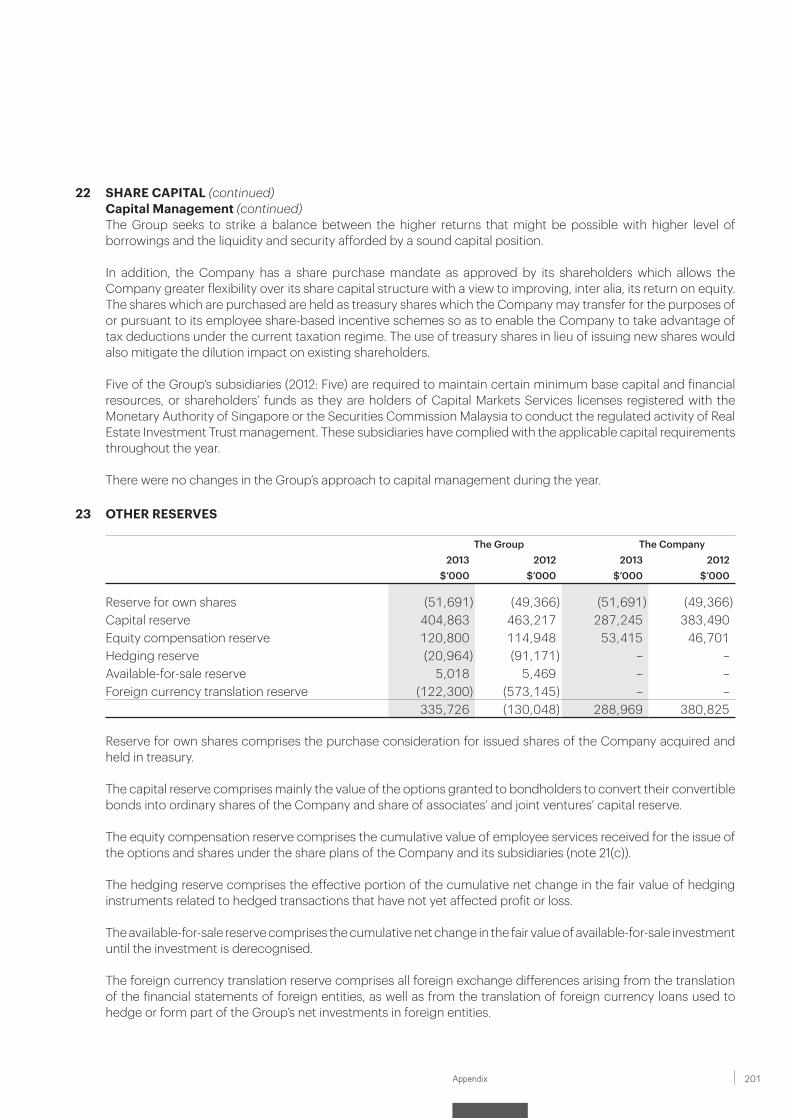
201Appendix
22 SHARE CAPITAL (continued)Capital Management (continued)
The Group seeks to strike a balance between the higher returns that might be possible with higher level of borrowings and the liquidity and security afforded by a sound capital position.
In addition, the Company has a share purchase mandate as approved by its shareholders which allows the Company greater flexibility over its share capital structure with a view to improving, inter alia, its return on equity. The shares which are purchased are held as treasury shares which the Company may transfer for the purposes of or pursuant to its employee share-based incentive schemes so as to enable the Company to take advantage of tax deductions under the current taxation regime. The use of treasury shares in lieu of issuing new shares would also mitigate the dilution impact on existing shareholders.
Five of the Group’s subsidiaries (2012: Five) are required to maintain certain minimum base capital and financial resources, or shareholders’ funds as they are holders of Capital Markets Services licenses registered with the Monetary Authority of Singapore or the Securities Commission Malaysia to conduct the regulated activity of Real Estate Investment Trust management. These subsidiaries have complied with the applicable capital requirements throughout the year.
There were no changes in the Group’s approach to capital management during the year.
23 OTHER RESERVES
The Group The Company2013 2012 2013 2012
$’000 $’000 $’000 $’000
Reserve for own shares (51,691) (49,366) (51,691) (49,366)Capital reserve 404,863 463,217 287,245 383,490Equity compensation reserve 120,800 114,948 53,415 46,701Hedging reserve (20,964) (91,171) – –Available-for-sale reserve 5,018 5,469 – –Foreign currency translation reserve (122,300) (573,145) – –
335,726 (130,048) 288,969 380,825
Reserve for own shares comprises the purchase consideration for issued shares of the Company acquired and held in treasury.
The capital reserve comprises mainly the value of the options granted to bondholders to convert their convertible bonds into ordinary shares of the Company and share of associates’ and joint ventures’ capital reserve.
The equity compensation reserve comprises the cumulative value of employee services received for the issue of the options and shares under the share plans of the Company and its subsidiaries (note 21(c)).
The hedging reserve comprises the effective portion of the cumulative net change in the fair value of hedging instruments related to hedged transactions that have not yet affected profit or loss.
The available-for-sale reserve comprises the cumulative net change in the fair value of available-for-sale investment until the investment is derecognised.
The foreign currency translation reserve comprises all foreign exchange differences arising from the translation of the financial statements of foreign entities, as well as from the translation of foreign currency loans used to hedge or form part of the Group’s net investments in foreign entities.
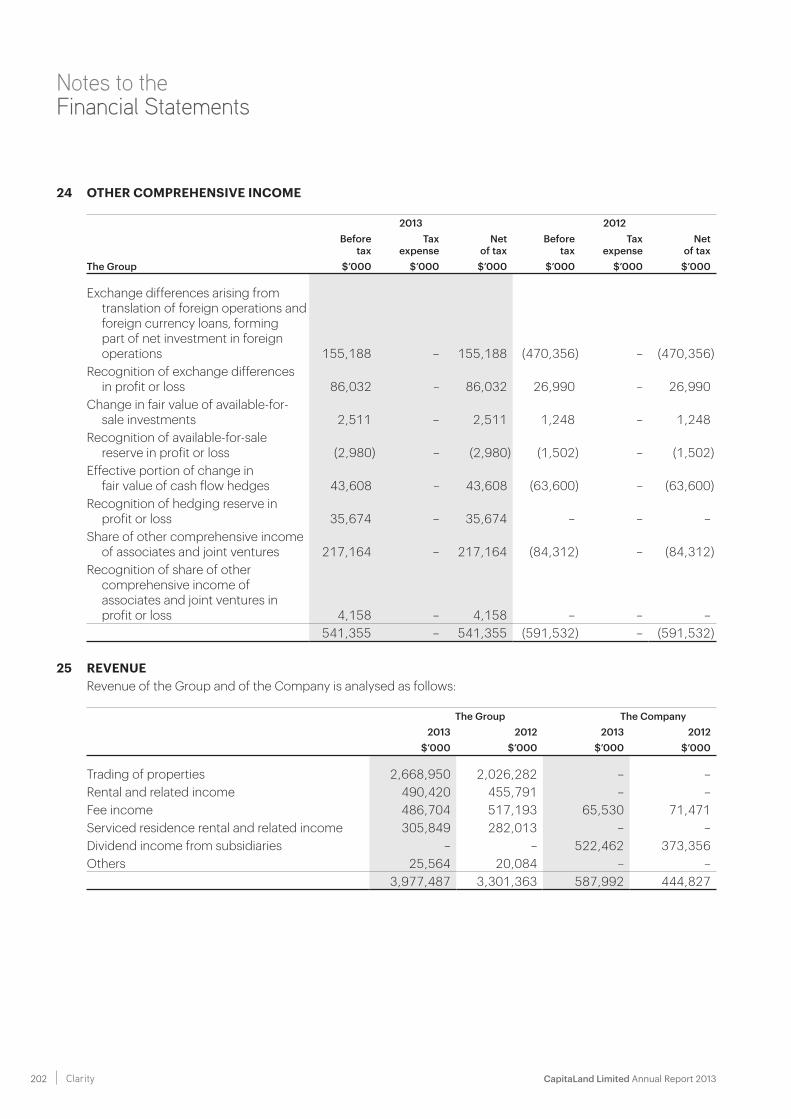
CapitaLand Limited Annual Report 2013 202 Clarity
Notes to the Financial Statements
24 OTHER COMPREHENSIVE INCOME
2013 2012Before
taxTax
expense Net
of taxBefore
taxTax
expense Net
of taxThe Group $’000 $’000 $’000 $’000 $’000 $’000
Exchange differences arising from translation of foreign operations and foreign currency loans, forming part of net investment in foreign operations 155,188 – 155,188 (470,356) – (470,356)
Recognition of exchange differences in profit or loss 86,032 – 86,032 26,990 – 26,990
Change in fair value of available-for-sale investments 2,511 – 2,511 1,248 – 1,248
Recognition of available-for-sale reserve in profit or loss (2,980) – (2,980) (1,502) – (1,502)
Effective portion of change in fair value of cash flow hedges 43,608 – 43,608 (63,600) – (63,600)
Recognition of hedging reserve in profit or loss 35,674 – 35,674 – – –
Share of other comprehensive income of associates and joint ventures 217,164 – 217,164 (84,312) – (84,312)
Recognition of share of other comprehensive income of associates and joint ventures in profit or loss 4,158 – 4,158 – – –
541,355 – 541,355 (591,532) – (591,532)
25 REVENUE Revenue of the Group and of the Company is analysed as follows:
The Group The Company2013 2012 2013 2012
$’000 $’000 $’000 $’000
Trading of properties 2,668,950 2,026,282 – –Rental and related income 490,420 455,791 – –Fee income 486,704 517,193 65,530 71,471Serviced residence rental and related income 305,849 282,013 – –Dividend income from subsidiaries – – 522,462 373,356Others 25,564 20,084 – –
3,977,487 3,301,363 587,992 444,827
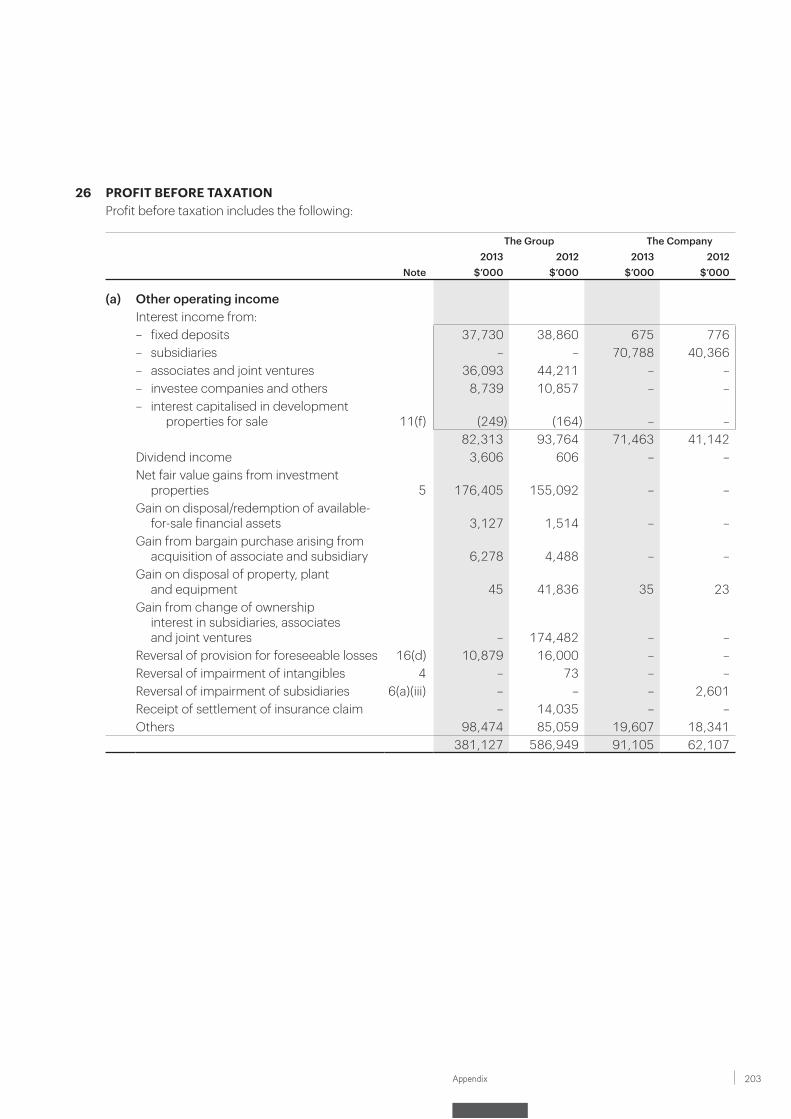
203Appendix
26 PROFIT BEFORE TAXATION Profit before taxation includes the following:
The Group The Company2013 2012 2013 2012
Note $’000 $’000 $’000 $’000
(a) Other operating incomeInterest income from:– fixed deposits 37,730 38,860 675 776– subsidiaries – – 70,788 40,366– associates and joint ventures 36,093 44,211 – –– investee companies and others 8,739 10,857 – –– interest capitalised in development
properties for sale 11(f) (249) (164) – –82,313 93,764 71,463 41,142
Dividend income 3,606 606 – –Net fair value gains from investment
properties 5 176,405 155,092 – –Gain on disposal/redemption of available-
for-sale financial assets 3,127 1,514 – –Gain from bargain purchase arising from
acquisition of associate and subsidiary 6,278 4,488 – –Gain on disposal of property, plant
and equipment 45 41,836 35 23Gain from change of ownership
interest in subsidiaries, associates and joint ventures – 174,482 – –
Reversal of provision for foreseeable losses 16(d) 10,879 16,000 – –Reversal of impairment of intangibles 4 – 73 – –Reversal of impairment of subsidiaries 6(a)(iii) – – – 2,601Receipt of settlement of insurance claim – 14,035 – –Others 98,474 85,059 19,607 18,341
381,127 586,949 91,105 62,107
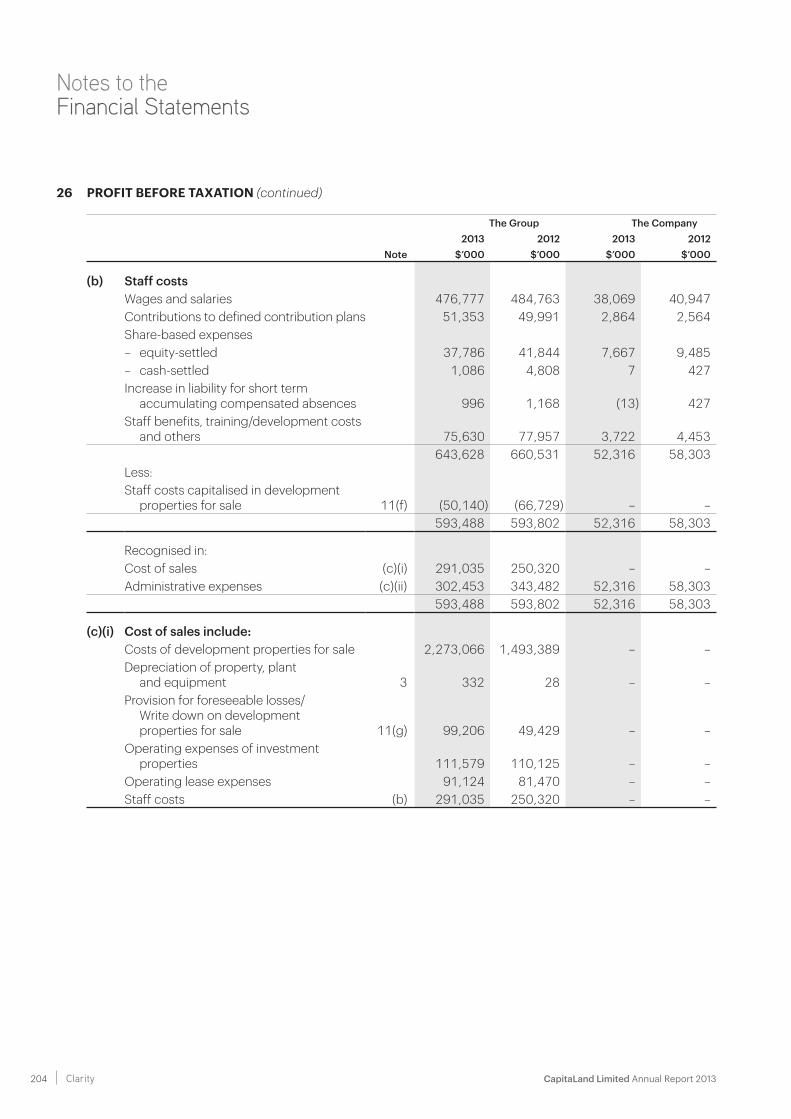
CapitaLand Limited Annual Report 2013 204 Clarity
Notes to the Financial Statements
26 PROFIT BEFORE TAXATION (continued)
The Group The Company2013 2012 2013 2012
Note $’000 $’000 $’000 $’000
(b) Staff costsWages and salaries 476,777 484,763 38,069 40,947Contributions to defined contribution plans 51,353 49,991 2,864 2,564Share-based expenses– equity-settled 37,786 41,844 7,667 9,485– cash-settled 1,086 4,808 7 427Increase in liability for short term
accumulating compensated absences 996 1,168 (13) 427Staff benefits, training/development costs
and others 75,630 77,957 3,722 4,453643,628 660,531 52,316 58,303
Less:Staff costs capitalised in development
properties for sale 11(f) (50,140) (66,729) – –593,488 593,802 52,316 58,303
Recognised in:Cost of sales (c)(i) 291,035 250,320 – –Administrative expenses (c)(ii) 302,453 343,482 52,316 58,303
593,488 593,802 52,316 58,303
(c)(i) Cost of sales include:Costs of development properties for sale 2,273,066 1,493,389 – –Depreciation of property, plant
and equipment 3 332 28 – –Provision for foreseeable losses/
Write down on development properties for sale 11(g) 99,206 49,429 – –
Operating expenses of investment properties 111,579 110,125 – –
Operating lease expenses 91,124 81,470 – –Staff costs (b) 291,035 250,320 – –
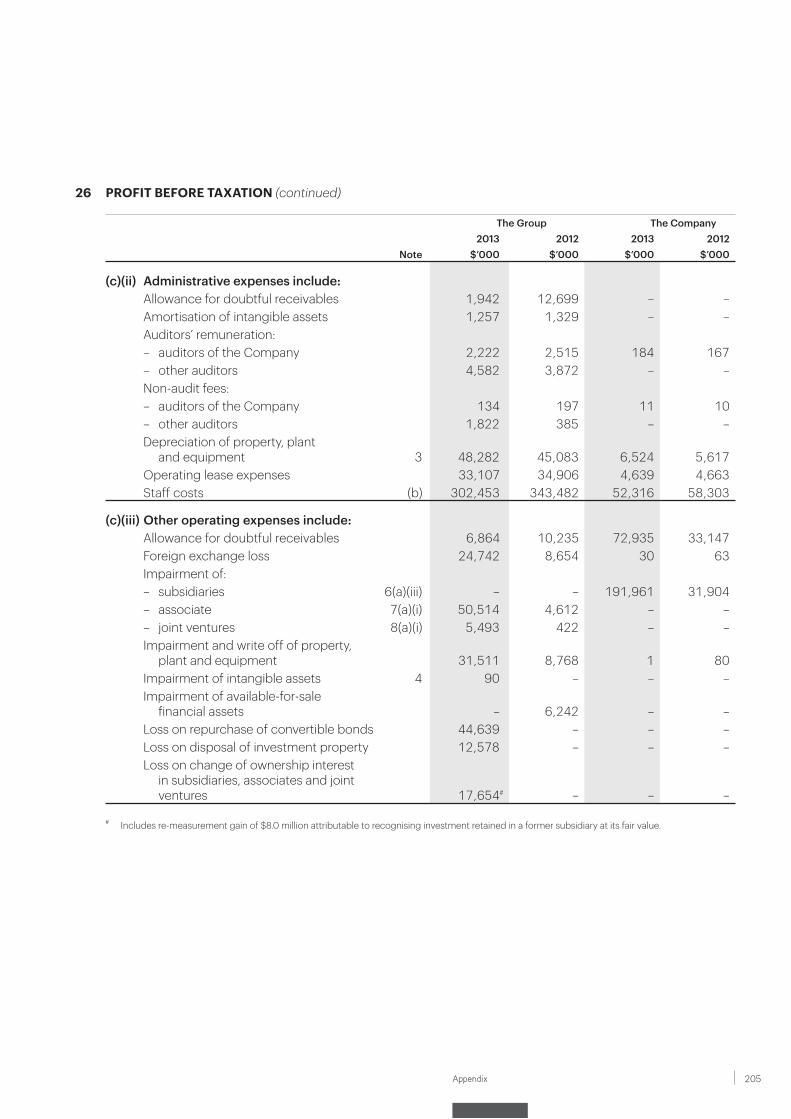
205Appendix
26 PROFIT BEFORE TAXATION (continued)
The Group The Company2013 2012 2013 2012
Note $’000 $’000 $’000 $’000
(c)(ii) Administrative expenses include:Allowance for doubtful receivables 1,942 12,699 – –Amortisation of intangible assets 1,257 1,329 – –Auditors’ remuneration:– auditors of the Company 2,222 2,515 184 167– other auditors 4,582 3,872 – –Non-audit fees:– auditors of the Company 134 197 11 10– other auditors 1,822 385 – –Depreciation of property, plant
and equipment 3 48,282 45,083 6,524 5,617Operating lease expenses 33,107 34,906 4,639 4,663Staff costs (b) 302,453 343,482 52,316 58,303
(c)(iii) Other operating expenses include:Allowance for doubtful receivables 6,864 10,235 72,935 33,147Foreign exchange loss 24,742 8,654 30 63Impairment of:– subsidiaries 6(a)(iii) – – 191,961 31,904– associate 7(a)(i) 50,514 4,612 – –– joint ventures 8(a)(i) 5,493 422 – –Impairment and write off of property,
plant and equipment 31,511 8,768 1 80Impairment of intangible assets 4 90 – – –Impairment of available-for-sale
financial assets – 6,242 – –Loss on repurchase of convertible bonds 44,639 – – –Loss on disposal of investment property 12,578 – – –Loss on change of ownership interest
in subsidiaries, associates and joint ventures 17,654# – – –
# Includes re-measurement gain of $8.0 million attributable to recognising investment retained in a former subsidiary at its fair value.
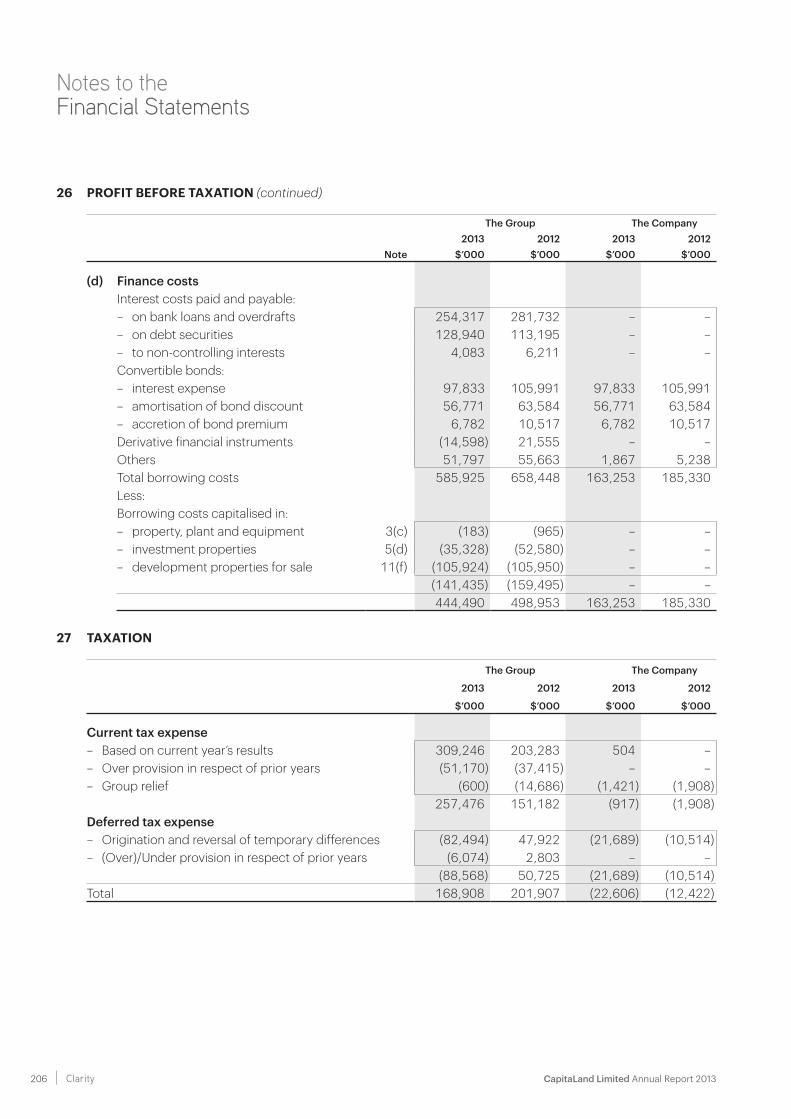
CapitaLand Limited Annual Report 2013 206 Clarity
Notes to the Financial Statements
26 PROFIT BEFORE TAXATION (continued)
The Group The Company2013 2012 2013 2012
Note $’000 $’000 $’000 $’000
(d) Finance costsInterest costs paid and payable:– on bank loans and overdrafts 254,317 281,732 – –– on debt securities 128,940 113,195 – –– to non-controlling interests 4,083 6,211 – –Convertible bonds:– interest expense 97,833 105,991 97,833 105,991– amortisation of bond discount 56,771 63,584 56,771 63,584– accretion of bond premium 6,782 10,517 6,782 10,517Derivative financial instruments (14,598) 21,555 – –Others 51,797 55,663 1,867 5,238Total borrowing costs 585,925 658,448 163,253 185,330Less:Borrowing costs capitalised in:– property, plant and equipment 3(c) (183) (965) – –– investment properties 5(d) (35,328) (52,580) – –– development properties for sale 11(f) (105,924) (105,950) – –
(141,435) (159,495) – –444,490 498,953 163,253 185,330
27 TAXATION
The Group The Company
2013 2012 2013 2012
$’000 $’000 $’000 $’000
Current tax expense– Based on current year’s results 309,246 203,283 504 –– Over provision in respect of prior years (51,170) (37,415) – –– Group relief (600) (14,686) (1,421) (1,908)
257,476 151,182 (917) (1,908)Deferred tax expense– Origination and reversal of temporary differences (82,494) 47,922 (21,689) (10,514)– (Over)/Under provision in respect of prior years (6,074) 2,803 – –
(88,568) 50,725 (21,689) (10,514)Total 168,908 201,907 (22,606) (12,422)
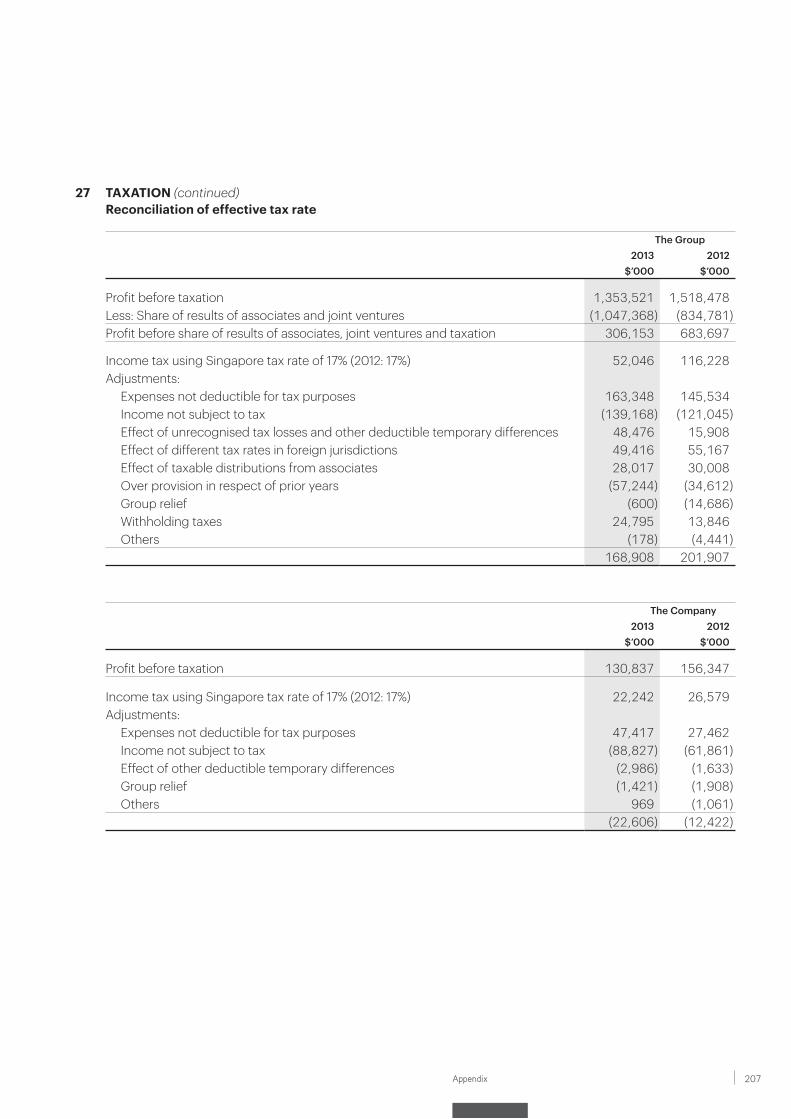
207Appendix
27 TAXATION (continued)Reconciliation of effective tax rate
The Group2013 2012
$’000 $’000
Profit before taxation 1,353,521 1,518,478Less: Share of results of associates and joint ventures (1,047,368) (834,781)Profit before share of results of associates, joint ventures and taxation 306,153 683,697
Income tax using Singapore tax rate of 17% (2012: 17%) 52,046 116,228Adjustments: Expenses not deductible for tax purposes 163,348 145,534 Income not subject to tax (139,168) (121,045) Effect of unrecognised tax losses and other deductible temporary differences 48,476 15,908 Effect of different tax rates in foreign jurisdictions 49,416 55,167 Effect of taxable distributions from associates 28,017 30,008 Over provision in respect of prior years (57,244) (34,612) Group relief (600) (14,686) Withholding taxes 24,795 13,846 Others (178) (4,441)
168,908 201,907
The Company2013 2012
$’000 $’000
Profit before taxation 130,837 156,347
Income tax using Singapore tax rate of 17% (2012: 17%) 22,242 26,579Adjustments: Expenses not deductible for tax purposes 47,417 27,462 Income not subject to tax (88,827) (61,861) Effect of other deductible temporary differences (2,986) (1,633) Group relief (1,421) (1,908) Others 969 (1,061)
(22,606) (12,422)
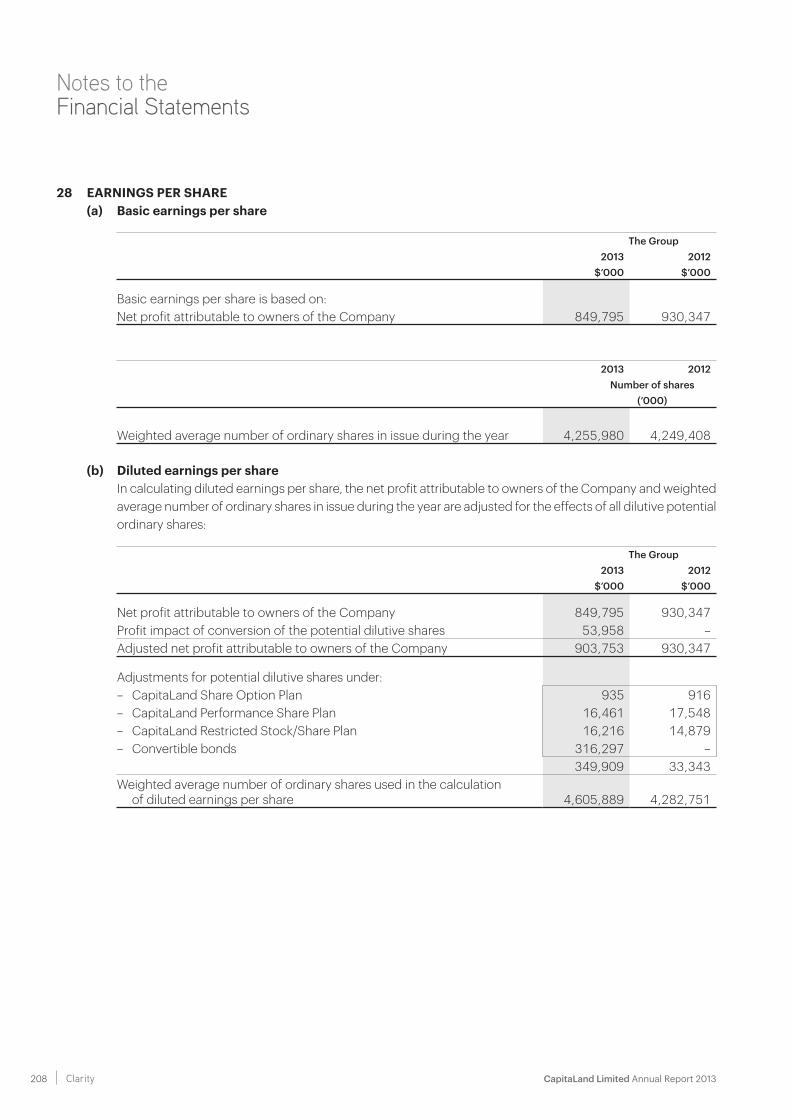
CapitaLand Limited Annual Report 2013 208 Clarity
Notes to the Financial Statements
28 EARNINGS PER SHARE(a) Basic earnings per share
The Group2013 2012
$’000 $’000
Basic earnings per share is based on:Net profit attributable to owners of the Company 849,795 930,347
2013 2012Number of shares
(’000)
Weighted average number of ordinary shares in issue during the year 4,255,980 4,249,408
(b) Diluted earnings per share In calculating diluted earnings per share, the net profit attributable to owners of the Company and weighted
average number of ordinary shares in issue during the year are adjusted for the effects of all dilutive potential ordinary shares:
The Group2013 2012
$’000 $’000
Net profit attributable to owners of the Company 849,795 930,347Profit impact of conversion of the potential dilutive shares 53,958 –Adjusted net profit attributable to owners of the Company 903,753 930,347
Adjustments for potential dilutive shares under:– CapitaLand Share Option Plan 935 916– CapitaLand Performance Share Plan 16,461 17,548– CapitaLand Restricted Stock/Share Plan 16,216 14,879– Convertible bonds 316,297 –
349,909 33,343Weighted average number of ordinary shares used in the calculation
of diluted earnings per share 4,605,889 4,282,751
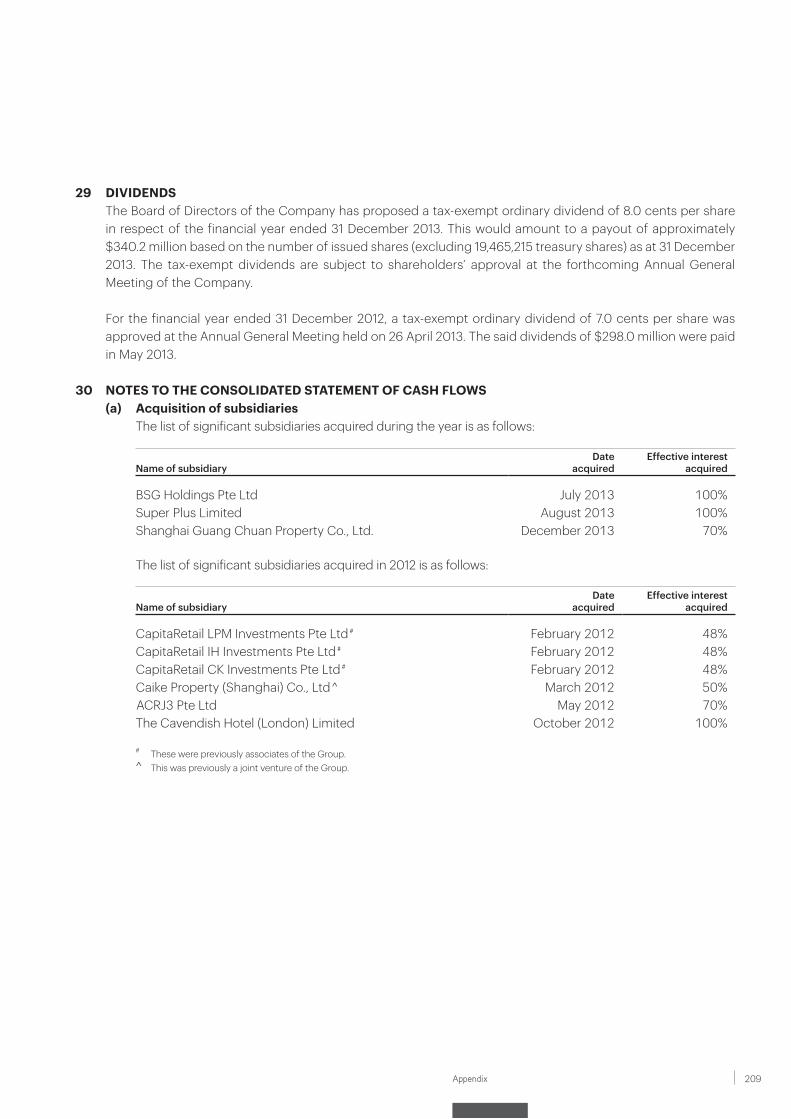
209Appendix
29 DIVIDENDS The Board of Directors of the Company has proposed a tax-exempt ordinary dividend of 8.0 cents per share
in respect of the financial year ended 31 December 2013. This would amount to a payout of approximately $340.2 million based on the number of issued shares (excluding 19,465,215 treasury shares) as at 31 December 2013. The tax-exempt dividends are subject to shareholders’ approval at the forthcoming Annual General Meeting of the Company.
For the financial year ended 31 December 2012, a tax-exempt ordinary dividend of 7.0 cents per share was approved at the Annual General Meeting held on 26 April 2013. The said dividends of $298.0 million were paid in May 2013.
30 NOTES TO THE CONSOLIDATED STATEMENT OF CASH FLOWS(a) Acquisition of subsidiaries The list of significant subsidiaries acquired during the year is as follows:
Name of subsidiaryDate
acquiredEffective interest
acquired
BSG Holdings Pte Ltd July 2013 100%Super Plus Limited August 2013 100%Shanghai Guang Chuan Property Co., Ltd. December 2013 70%
The list of significant subsidiaries acquired in 2012 is as follows:
Name of subsidiaryDate
acquiredEffective interest
acquired
CapitaRetail LPM Investments Pte Ltd # February 2012 48%CapitaRetail IH Investments Pte Ltd # February 2012 48%CapitaRetail CK Investments Pte Ltd # February 2012 48%Caike Property (Shanghai) Co., Ltd ^ March 2012 50%ACRJ3 Pte Ltd May 2012 70%The Cavendish Hotel (London) Limited October 2012 100%
# These were previously associates of the Group.^ This was previously a joint venture of the Group.
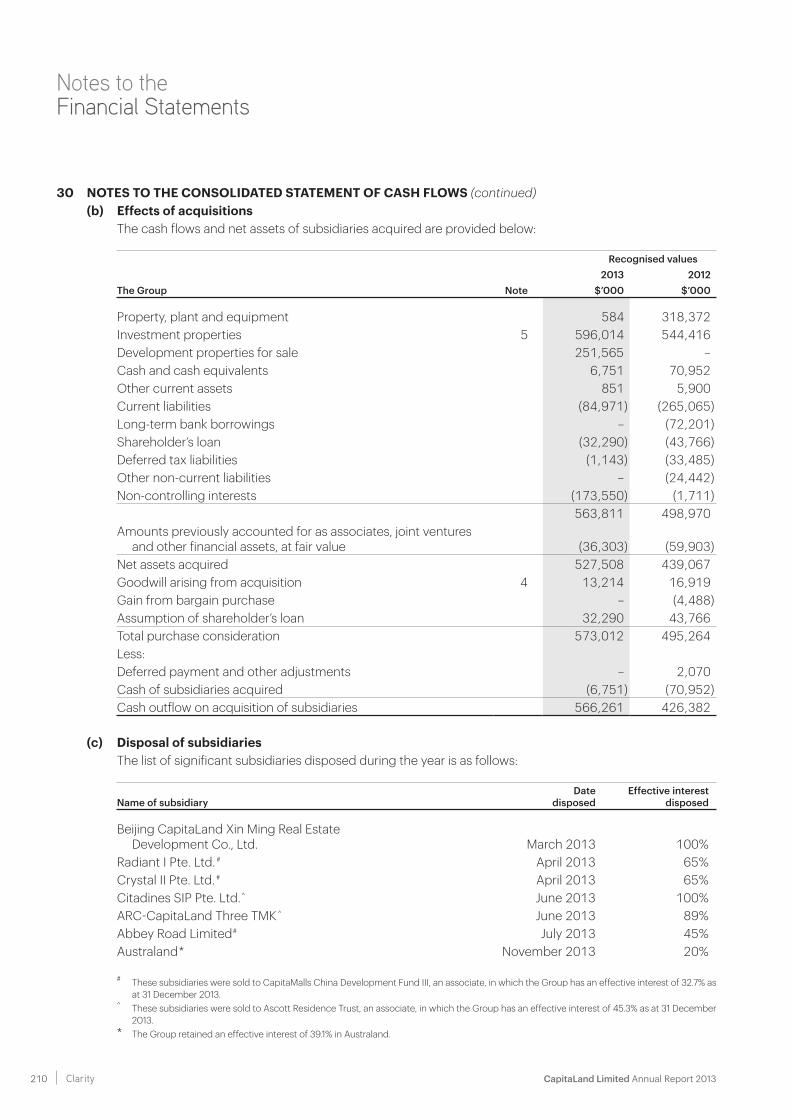
CapitaLand Limited Annual Report 2013 210 Clarity
Notes to the Financial Statements
30 NOTES TO THE CONSOLIDATED STATEMENT OF CASH FLOWS (continued)(b) Effects of acquisitions The cash flows and net assets of subsidiaries acquired are provided below:
Recognised values2013 2012
The Group Note $’000 $’000
Property, plant and equipment 584 318,372Investment properties 5 596,014 544,416Development properties for sale 251,565 –Cash and cash equivalents 6,751 70,952Other current assets 851 5,900Current liabilities (84,971) (265,065)Long-term bank borrowings – (72,201)Shareholder’s loan (32,290) (43,766)Deferred tax liabilities (1,143) (33,485)Other non-current liabilities – (24,442)Non-controlling interests (173,550) (1,711)
563,811 498,970Amounts previously accounted for as associates, joint ventures
and other financial assets, at fair value (36,303) (59,903)Net assets acquired 527,508 439,067Goodwill arising from acquisition 4 13,214 16,919Gain from bargain purchase – (4,488)Assumption of shareholder’s loan 32,290 43,766Total purchase consideration 573,012 495,264Less:Deferred payment and other adjustments – 2,070Cash of subsidiaries acquired (6,751) (70,952)Cash outflow on acquisition of subsidiaries 566,261 426,382
(c) Disposal of subsidiaries The list of significant subsidiaries disposed during the year is as follows:
Name of subsidiaryDate
disposedEffective interest
disposed
Beijing CapitaLand Xin Ming Real EstateDevelopment Co., Ltd. March 2013 100%
Radiant I Pte. Ltd. # April 2013 65%Crystal II Pte. Ltd. # April 2013 65%Citadines SIP Pte. Ltd. ^ June 2013 100%ARC-CapitaLand Three TMK ^ June 2013 89%Abbey Road Limited # July 2013 45%Australand * November 2013 20%
# These subsidiaries were sold to CapitaMalls China Development Fund III, an associate, in which the Group has an effective interest of 32.7% as at 31 December 2013.
^ These subsidiaries were sold to Ascott Residence Trust, an associate, in which the Group has an effective interest of 45.3% as at 31 December 2013.
* The Group retained an effective interest of 39.1% in Australand.
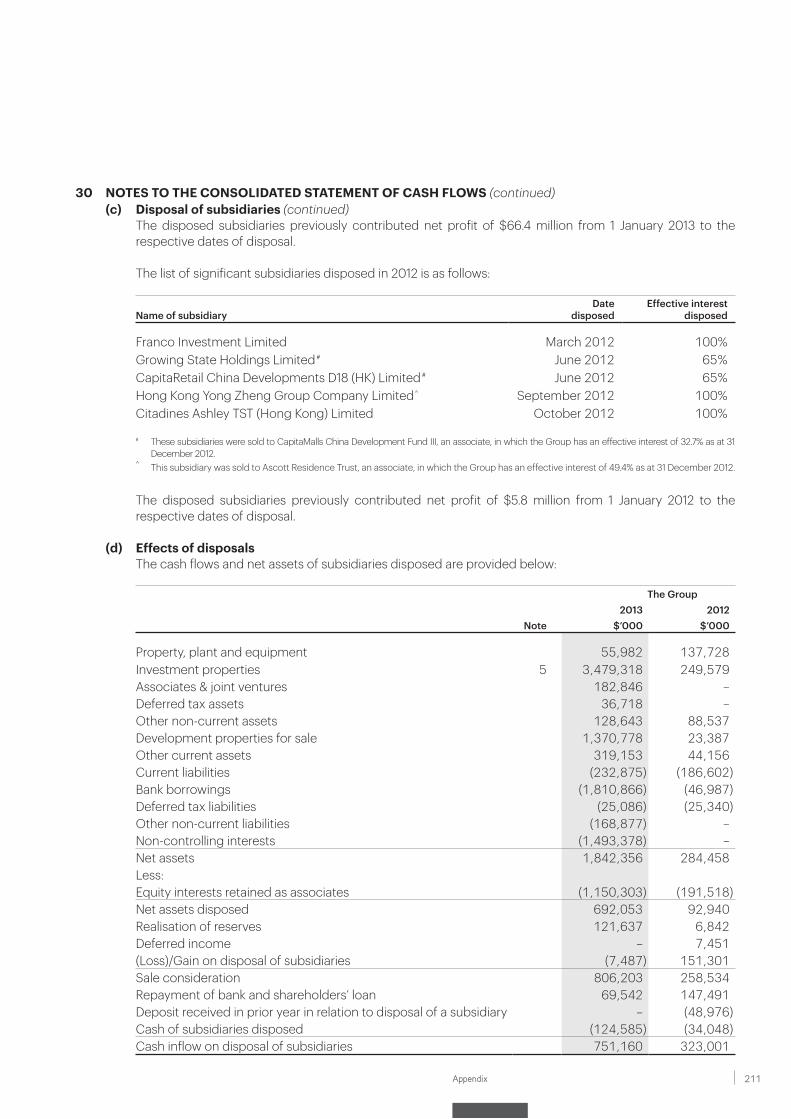
211Appendix
30 NOTES TO THE CONSOLIDATED STATEMENT OF CASH FLOWS (continued)(c) Disposal of subsidiaries (continued) The disposed subsidiaries previously contributed net profit of $66.4 million from 1 January 2013 to the
respective dates of disposal.
The list of significant subsidiaries disposed in 2012 is as follows:
Name of subsidiaryDate
disposedEffective interest
disposed
Franco Investment Limited March 2012 100%Growing State Holdings Limited # June 2012 65%CapitaRetail China Developments D18 (HK) Limited # June 2012 65%Hong Kong Yong Zheng Group Company Limited ^ September 2012 100%Citadines Ashley TST (Hong Kong) Limited October 2012 100%
# These subsidiaries were sold to CapitaMalls China Development Fund III, an associate, in which the Group has an effective interest of 32.7% as at 31 December 2012.
^ This subsidiary was sold to Ascott Residence Trust, an associate, in which the Group has an effective interest of 49.4% as at 31 December 2012.
The disposed subsidiaries previously contributed net profit of $5.8 million from 1 January 2012 to the respective dates of disposal.
(d) Effects of disposals The cash flows and net assets of subsidiaries disposed are provided below:
The Group2013 2012
Note $’000 $’000
Property, plant and equipment 55,982 137,728Investment properties 5 3,479,318 249,579Associates & joint ventures 182,846 –Deferred tax assets 36,718 –Other non-current assets 128,643 88,537Development properties for sale 1,370,778 23,387Other current assets 319,153 44,156Current liabilities (232,875) (186,602)Bank borrowings (1,810,866) (46,987)Deferred tax liabilities (25,086) (25,340)Other non-current liabilities (168,877) –Non-controlling interests (1,493,378) –Net assets 1,842,356 284,458Less:Equity interests retained as associates (1,150,303) (191,518)Net assets disposed 692,053 92,940Realisation of reserves 121,637 6,842Deferred income – 7,451(Loss)/Gain on disposal of subsidiaries (7,487) 151,301Sale consideration 806,203 258,534Repayment of bank and shareholders’ loan 69,542 147,491Deposit received in prior year in relation to disposal of a subsidiary – (48,976)Cash of subsidiaries disposed (124,585) (34,048)Cash inflow on disposal of subsidiaries 751,160 323,001
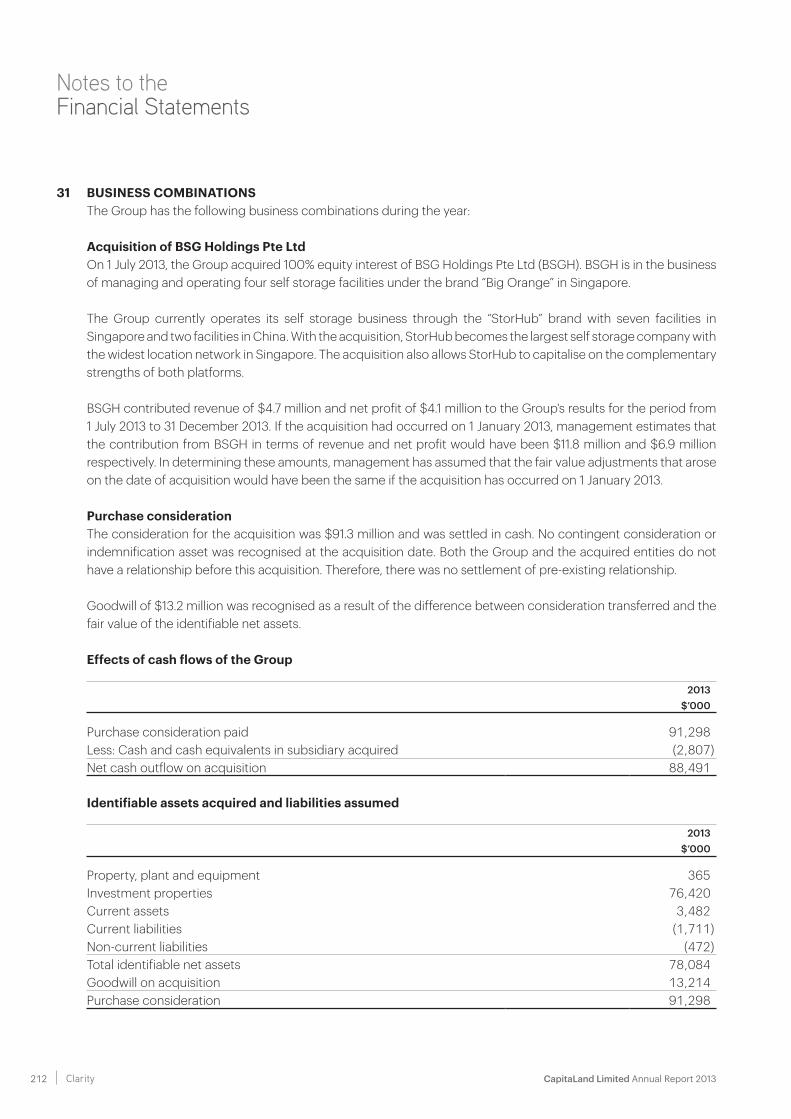
CapitaLand Limited Annual Report 2013 212 Clarity
Notes to the Financial Statements
31 BUSINESS COMBINATIONS The Group has the following business combinations during the year:
Acquisition of BSG Holdings Pte Ltd On 1 July 2013, the Group acquired 100% equity interest of BSG Holdings Pte Ltd (BSGH). BSGH is in the business
of managing and operating four self storage facilities under the brand “Big Orange” in Singapore.
The Group currently operates its self storage business through the “StorHub” brand with seven facilities in Singapore and two facilities in China. With the acquisition, StorHub becomes the largest self storage company with the widest location network in Singapore. The acquisition also allows StorHub to capitalise on the complementary strengths of both platforms.
BSGH contributed revenue of $4.7 million and net profit of $4.1 million to the Group's results for the period from 1 July 2013 to 31 December 2013. If the acquisition had occurred on 1 January 2013, management estimates that the contribution from BSGH in terms of revenue and net profit would have been $11.8 million and $6.9 million respectively. In determining these amounts, management has assumed that the fair value adjustments that arose on the date of acquisition would have been the same if the acquisition has occurred on 1 January 2013.
Purchase consideration The consideration for the acquisition was $91.3 million and was settled in cash. No contingent consideration or
indemnification asset was recognised at the acquisition date. Both the Group and the acquired entities do not have a relationship before this acquisition. Therefore, there was no settlement of pre-existing relationship.
Goodwill of $13.2 million was recognised as a result of the difference between consideration transferred and the fair value of the identifiable net assets.
Effects of cash flows of the Group
2013$’000
Purchase consideration paid 91,298Less: Cash and cash equivalents in subsidiary acquired (2,807)Net cash outflow on acquisition 88,491
Identifiable assets acquired and liabilities assumed
2013$’000
Property, plant and equipment 365Investment properties 76,420Current assets 3,482Current liabilities (1,711)Non-current liabilities (472)Total identifiable net assets 78,084Goodwill on acquisition 13,214Purchase consideration 91,298
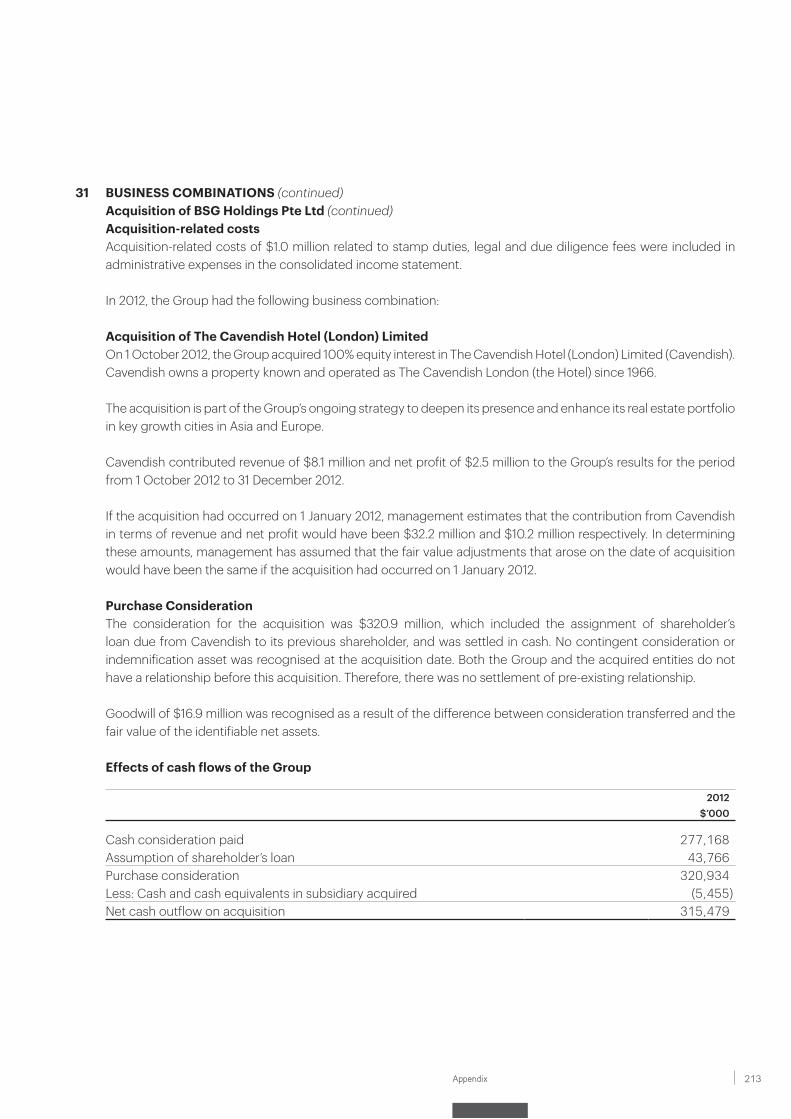
213Appendix
31 BUSINESS COMBINATIONS (continued)Acquisition of BSG Holdings Pte Ltd (continued)Acquisition-related costs
Acquisition-related costs of $1.0 million related to stamp duties, legal and due diligence fees were included in administrative expenses in the consolidated income statement.
In 2012, the Group had the following business combination:
Acquisition of The Cavendish Hotel (London) Limited On 1 October 2012, the Group acquired 100% equity interest in The Cavendish Hotel (London) Limited (Cavendish).
Cavendish owns a property known and operated as The Cavendish London (the Hotel) since 1966.
The acquisition is part of the Group’s ongoing strategy to deepen its presence and enhance its real estate portfolio in key growth cities in Asia and Europe.
Cavendish contributed revenue of $8.1 million and net profit of $2.5 million to the Group’s results for the period from 1 October 2012 to 31 December 2012.
If the acquisition had occurred on 1 January 2012, management estimates that the contribution from Cavendish in terms of revenue and net profit would have been $32.2 million and $10.2 million respectively. In determining these amounts, management has assumed that the fair value adjustments that arose on the date of acquisition would have been the same if the acquisition had occurred on 1 January 2012.
Purchase Consideration The consideration for the acquisition was $320.9 million, which included the assignment of shareholder’s
loan due from Cavendish to its previous shareholder, and was settled in cash. No contingent consideration or indemnification asset was recognised at the acquisition date. Both the Group and the acquired entities do not have a relationship before this acquisition. Therefore, there was no settlement of pre-existing relationship.
Goodwill of $16.9 million was recognised as a result of the difference between consideration transferred and the fair value of the identifiable net assets.
Effects of cash flows of the Group
2012$’000
Cash consideration paid 277,168Assumption of shareholder’s loan 43,766Purchase consideration 320,934Less: Cash and cash equivalents in subsidiary acquired (5,455)Net cash outflow on acquisition 315,479
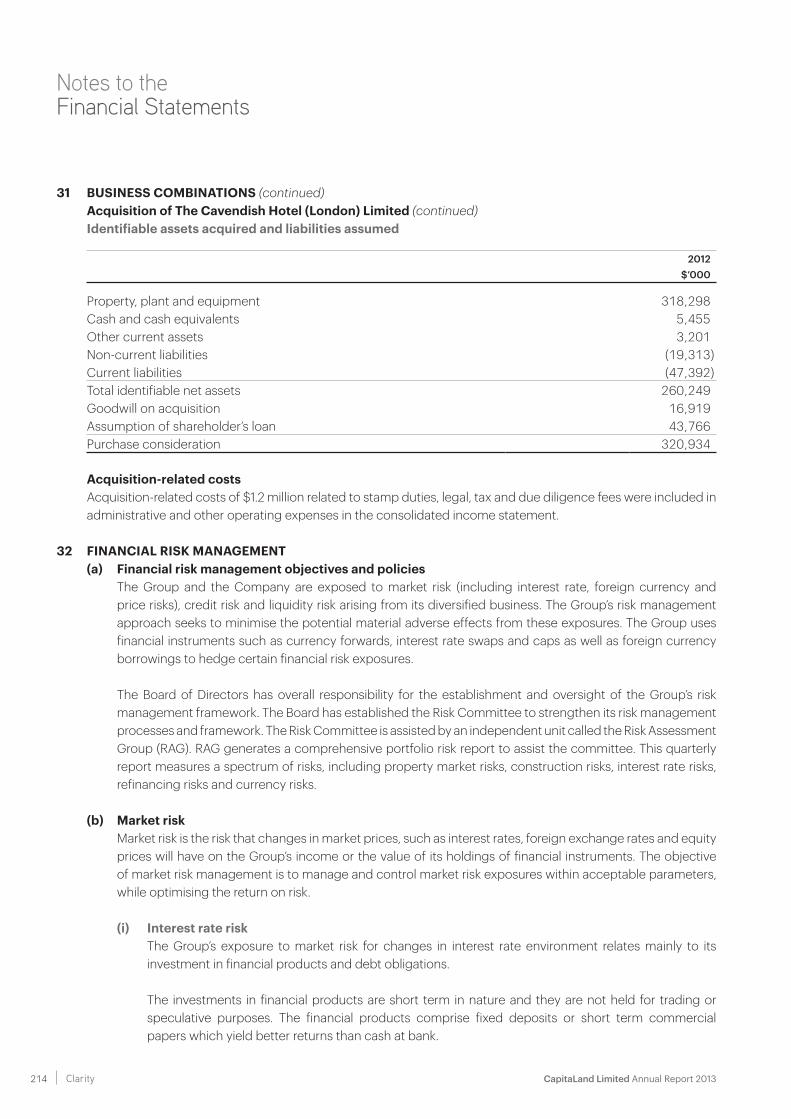
CapitaLand Limited Annual Report 2013 214 Clarity
Notes to the Financial Statements
31 BUSINESS COMBINATIONS (continued)Acquisition of The Cavendish Hotel (London) Limited (continued)Identifiable assets acquired and liabilities assumed
2012$’000
Property, plant and equipment 318,298Cash and cash equivalents 5,455Other current assets 3,201Non-current liabilities (19,313)Current liabilities (47,392)Total identifiable net assets 260,249Goodwill on acquisition 16,919Assumption of shareholder’s loan 43,766Purchase consideration 320,934
Acquisition-related costs Acquisition-related costs of $1.2 million related to stamp duties, legal, tax and due diligence fees were included in
administrative and other operating expenses in the consolidated income statement.
32 FINANCIAL RISK MANAGEMENT(a) Financial risk management objectives and policies The Group and the Company are exposed to market risk (including interest rate, foreign currency and
price risks), credit risk and liquidity risk arising from its diversified business. The Group’s risk management approach seeks to minimise the potential material adverse effects from these exposures. The Group uses financial instruments such as currency forwards, interest rate swaps and caps as well as foreign currency borrowings to hedge certain financial risk exposures.
The Board of Directors has overall responsibility for the establishment and oversight of the Group’s risk management framework. The Board has established the Risk Committee to strengthen its risk management processes and framework. The Risk Committee is assisted by an independent unit called the Risk Assessment Group (RAG). RAG generates a comprehensive portfolio risk report to assist the committee. This quarterly report measures a spectrum of risks, including property market risks, construction risks, interest rate risks, refinancing risks and currency risks.
(b) Market risk Market risk is the risk that changes in market prices, such as interest rates, foreign exchange rates and equity
prices will have on the Group’s income or the value of its holdings of financial instruments. The objective of market risk management is to manage and control market risk exposures within acceptable parameters, while optimising the return on risk.
(i) Interest rate risk The Group’s exposure to market risk for changes in interest rate environment relates mainly to its
investment in financial products and debt obligations.
The investments in financial products are short term in nature and they are not held for trading or speculative purposes. The financial products comprise fixed deposits or short term commercial papers which yield better returns than cash at bank.
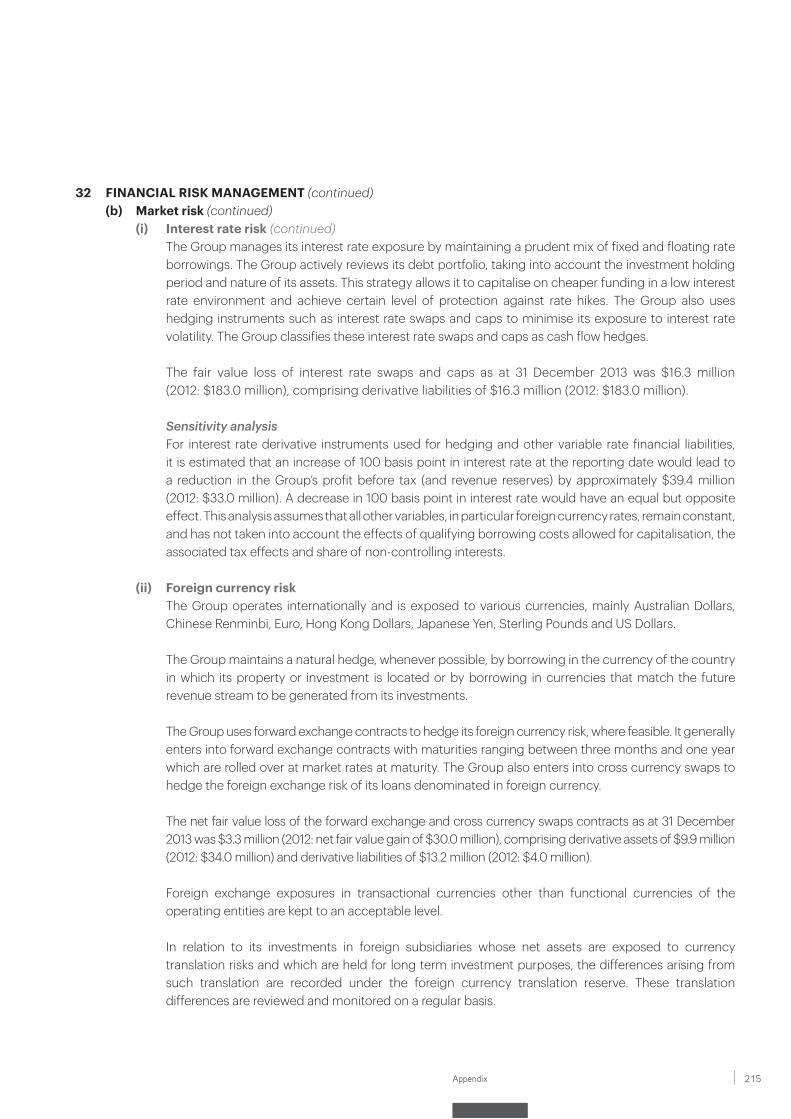
215Appendix
32 FINANCIAL RISK MANAGEMENT (continued)(b) Market risk (continued)
(i) Interest rate risk (continued) The Group manages its interest rate exposure by maintaining a prudent mix of fixed and floating rate
borrowings. The Group actively reviews its debt portfolio, taking into account the investment holding period and nature of its assets. This strategy allows it to capitalise on cheaper funding in a low interest rate environment and achieve certain level of protection against rate hikes. The Group also uses hedging instruments such as interest rate swaps and caps to minimise its exposure to interest rate volatility. The Group classifies these interest rate swaps and caps as cash flow hedges.
The fair value loss of interest rate swaps and caps as at 31 December 2013 was $16.3 million(2012: $183.0 million), comprising derivative liabilities of $16.3 million (2012: $183.0 million).
Sensitivity analysis For interest rate derivative instruments used for hedging and other variable rate financial liabilities,
it is estimated that an increase of 100 basis point in interest rate at the reporting date would lead to a reduction in the Group’s profit before tax (and revenue reserves) by approximately $39.4 million (2012: $33.0 million). A decrease in 100 basis point in interest rate would have an equal but opposite effect. This analysis assumes that all other variables, in particular foreign currency rates, remain constant, and has not taken into account the effects of qualifying borrowing costs allowed for capitalisation, the associated tax effects and share of non-controlling interests.
(ii) Foreign currency risk The Group operates internationally and is exposed to various currencies, mainly Australian Dollars,
Chinese Renminbi, Euro, Hong Kong Dollars, Japanese Yen, Sterling Pounds and US Dollars.
The Group maintains a natural hedge, whenever possible, by borrowing in the currency of the country in which its property or investment is located or by borrowing in currencies that match the future revenue stream to be generated from its investments.
The Group uses forward exchange contracts to hedge its foreign currency risk, where feasible. It generally enters into forward exchange contracts with maturities ranging between three months and one year which are rolled over at market rates at maturity. The Group also enters into cross currency swaps to hedge the foreign exchange risk of its loans denominated in foreign currency.
The net fair value loss of the forward exchange and cross currency swaps contracts as at 31 December
2013 was $3.3 million (2012: net fair value gain of $30.0 million), comprising derivative assets of $9.9 million (2012: $34.0 million) and derivative liabilities of $13.2 million (2012: $4.0 million).
Foreign exchange exposures in transactional currencies other than functional currencies of the operating entities are kept to an acceptable level.
In relation to its investments in foreign subsidiaries whose net assets are exposed to currency translation risks and which are held for long term investment purposes, the differences arising from such translation are recorded under the foreign currency translation reserve. These translation differences are reviewed and monitored on a regular basis.
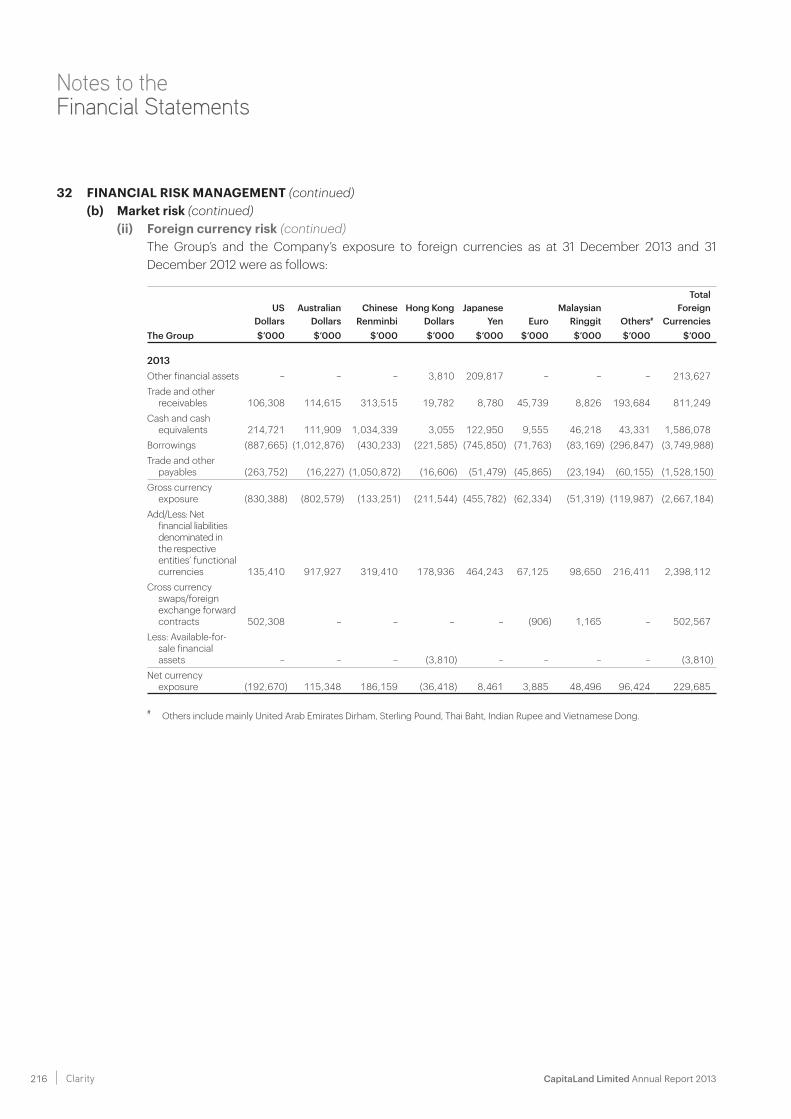
CapitaLand Limited Annual Report 2013 216 Clarity
Notes to the Financial Statements
32 FINANCIAL RISK MANAGEMENT (continued)(b) Market risk (continued)
(ii) Foreign currency risk (continued) The Group’s and the Company’s exposure to foreign currencies as at 31 December 2013 and 31
December 2012 were as follows:
TotalUS Australian Chinese Hong Kong Japanese Malaysian Foreign
Dollars Dollars Renminbi Dollars Yen Euro Ringgit Others# CurrenciesThe Group $’000 $’000 $’000 $’000 $’000 $’000 $’000 $’000 $’000
2013Other financial assets – – – 3,810 209,817 – – – 213,627Trade and other
receivables 106,308 114,615 313,515 19,782 8,780 45,739 8,826 193,684 811,249Cash and cash
equivalents 214,721 111,909 1,034,339 3,055 122,950 9,555 46,218 43,331 1,586,078Borrowings (887,665) (1,012,876) (430,233) (221,585) (745,850) (71,763) (83,169) (296,847) (3,749,988)Trade and other
payables (263,752) (16,227) (1,050,872) (16,606) (51,479) (45,865) (23,194) (60,155) (1,528,150)Gross currency
exposure (830,388) (802,579) (133,251) (211,544) (455,782) (62,334) (51,319) (119,987) (2,667,184)Add/Less: Net
financial liabilities denominated in the respective entities’ functional currencies 135,410 917,927 319,410 178,936 464,243 67,125 98,650 216,411 2,398,112
Cross currency swaps/foreign exchange forward contracts 502,308 – – – – (906) 1,165 – 502,567
Less: Available-for-sale financial assets – – – (3,810) – – – – (3,810)
Net currency exposure (192,670) 115,348 186,159 (36,418) 8,461 3,885 48,496 96,424 229,685
# Others include mainly United Arab Emirates Dirham, Sterling Pound, Thai Baht, Indian Rupee and Vietnamese Dong.
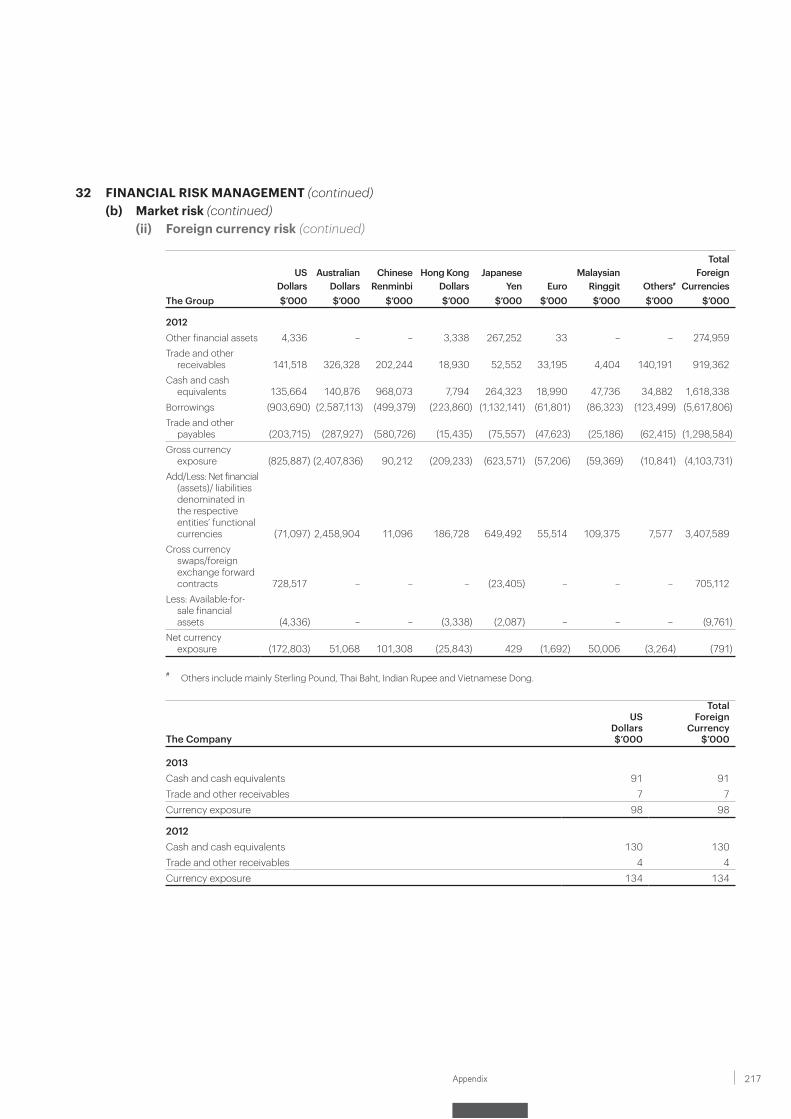
217Appendix
32 FINANCIAL RISK MANAGEMENT (continued)(b) Market risk (continued)
(ii) Foreign currency risk (continued)
TotalUS Australian Chinese Hong Kong Japanese Malaysian Foreign
Dollars Dollars Renminbi Dollars Yen Euro Ringgit Others# CurrenciesThe Group $’000 $’000 $’000 $’000 $’000 $’000 $’000 $’000 $’000
2012Other financial assets 4,336 – – 3,338 267,252 33 – – 274,959Trade and other
receivables 141,518 326,328 202,244 18,930 52,552 33,195 4,404 140,191 919,362Cash and cash
equivalents 135,664 140,876 968,073 7,794 264,323 18,990 47,736 34,882 1,618,338Borrowings (903,690) (2,587,113) (499,379) (223,860) (1,132,141) (61,801) (86,323) (123,499) (5,617,806)Trade and other
payables (203,715) (287,927) (580,726) (15,435) (75,557) (47,623) (25,186) (62,415) (1,298,584)Gross currency
exposure (825,887) (2,407,836) 90,212 (209,233) (623,571) (57,206) (59,369) (10,841) (4,103,731)Add/Less: Net financial
(assets)/ liabilities denominated in the respective entities’ functional currencies (71,097) 2,458,904 11,096 186,728 649,492 55,514 109,375 7,577 3,407,589
Cross currency swaps/foreign exchange forward contracts 728,517 – – – (23,405) – – – 705,112
Less: Available-for-sale financial assets (4,336) – – (3,338) (2,087) – – – (9,761)
Net currency exposure (172,803) 51,068 101,308 (25,843) 429 (1,692) 50,006 (3,264) (791)
# Others include mainly Sterling Pound, Thai Baht, Indian Rupee and Vietnamese Dong.
TotalUS Foreign
Dollars CurrencyThe Company $’000 $’000
2013Cash and cash equivalents 91 91Trade and other receivables 7 7Currency exposure 98 98
2012Cash and cash equivalents 130 130Trade and other receivables 4 4Currency exposure 134 134
CapitaLand Limited Annual Report 2013 218 Clarity
Notes to the Financial Statements
32 FINANCIAL RISK MANAGEMENT (continued)(b) Market risk (continued)
(ii) Foreign currency risk (continued)Sensitivity analysis
It is estimated that a five percentage point strengthening in foreign currencies against the Singapore Dollar would increase the Group’s profit before tax by approximately $11.5 million (2012: not significant) and increase the Group’s other components of equity by approximately $0.2 million (2012: $0.5 million). A five percentage point weakening in foreign currencies against the Singapore Dollar would have an equal but opposite effect. The Group’s outstanding forward exchange contracts and cross currency swaps have been included in this calculation. The analysis assumed that all other variables, in particular interest rates, remain constant and does not take into account the translation related risk, associated tax effects and share of non-controlling interests.
There was no significant exposure to foreign currencies for the Company as at 31 December 2013 and 31 December 2012.
(iii) Equity price risk The Group does not have significant exposure to equity price risk as at 31 December 2013 and
31 December 2012.
(c) Credit risk Credit risk is the risk of financial loss to the Group if a customer or counterparty to a financial instrument fails
to meet its contractual obligations. For trade receivables, the Group has guidelines governing the process of granting credit as a service or product provider in its respective segments of business. Trade and other receivables relate mainly to the Group’s customers who bought its residential units and tenants from its commercial buildings, shopping malls and serviced residences. Investments and financial transactions are restricted to counterparties that meet the appropriate credit criteria.
The principal risk to which the Group and the Company is exposed in respect of financial guarantee contracts is credit risk in connection with the guarantee contracts they have issued. To mitigate the risks, management continually monitors the risks and has established processes including performing credit evaluations of the parties it is providing the guarantee on behalf of. Guarantees are only given for its subsidiaries and related parties. The maximum exposure to credit risk in respect of these financial guarantees at the balance sheet date is disclosed in note 35.
The Group has a diversified portfolio of businesses and as at balance sheet date, there was no significant concentration of credit risk with any entity. The maximum exposure to credit risk is represented by the carrying amount of each financial asset in the balance sheet, including derivative financial instruments as well as any irrevocable loan undertaking to associates and joint ventures.
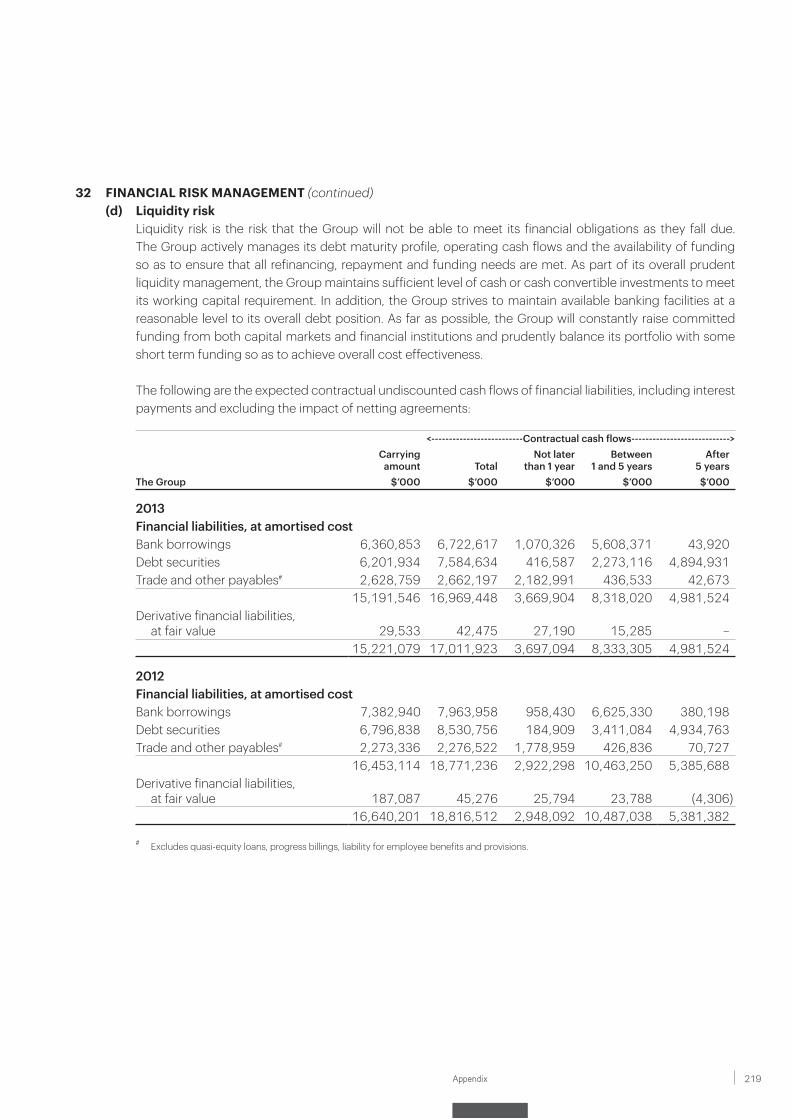
219Appendix
32 FINANCIAL RISK MANAGEMENT (continued)(d) Liquidity risk Liquidity risk is the risk that the Group will not be able to meet its financial obligations as they fall due.
The Group actively manages its debt maturity profile, operating cash flows and the availability of funding so as to ensure that all refinancing, repayment and funding needs are met. As part of its overall prudent liquidity management, the Group maintains sufficient level of cash or cash convertible investments to meet its working capital requirement. In addition, the Group strives to maintain available banking facilities at a reasonable level to its overall debt position. As far as possible, the Group will constantly raise committed funding from both capital markets and financial institutions and prudently balance its portfolio with some short term funding so as to achieve overall cost effectiveness.
The following are the expected contractual undiscounted cash flows of financial liabilities, including interest payments and excluding the impact of netting agreements:
<--------------------------Contractual cash flows---------------------------->Carrying
amount TotalNot later
than 1 yearBetween
1 and 5 yearsAfter
5 yearsThe Group $’000 $’000 $’000 $’000 $’000
2013Financial liabilities, at amortised costBank borrowings 6,360,853 6,722,617 1,070,326 5,608,371 43,920Debt securities 6,201,934 7,584,634 416,587 2,273,116 4,894,931Trade and other payables# 2,628,759 2,662,197 2,182,991 436,533 42,673
15,191,546 16,969,448 3,669,904 8,318,020 4,981,524Derivative financial liabilities,
at fair value 29,533 42,475 27,190 15,285 –15,221,079 17,011,923 3,697,094 8,333,305 4,981,524
2012Financial liabilities, at amortised costBank borrowings 7,382,940 7,963,958 958,430 6,625,330 380,198Debt securities 6,796,838 8,530,756 184,909 3,411,084 4,934,763Trade and other payables# 2,273,336 2,276,522 1,778,959 426,836 70,727
16,453,114 18,771,236 2,922,298 10,463,250 5,385,688Derivative financial liabilities,
at fair value 187,087 45,276 25,794 23,788 (4,306)16,640,201 18,816,512 2,948,092 10,487,038 5,381,382
# Excludes quasi-equity loans, progress billings, liability for employee benefits and provisions.
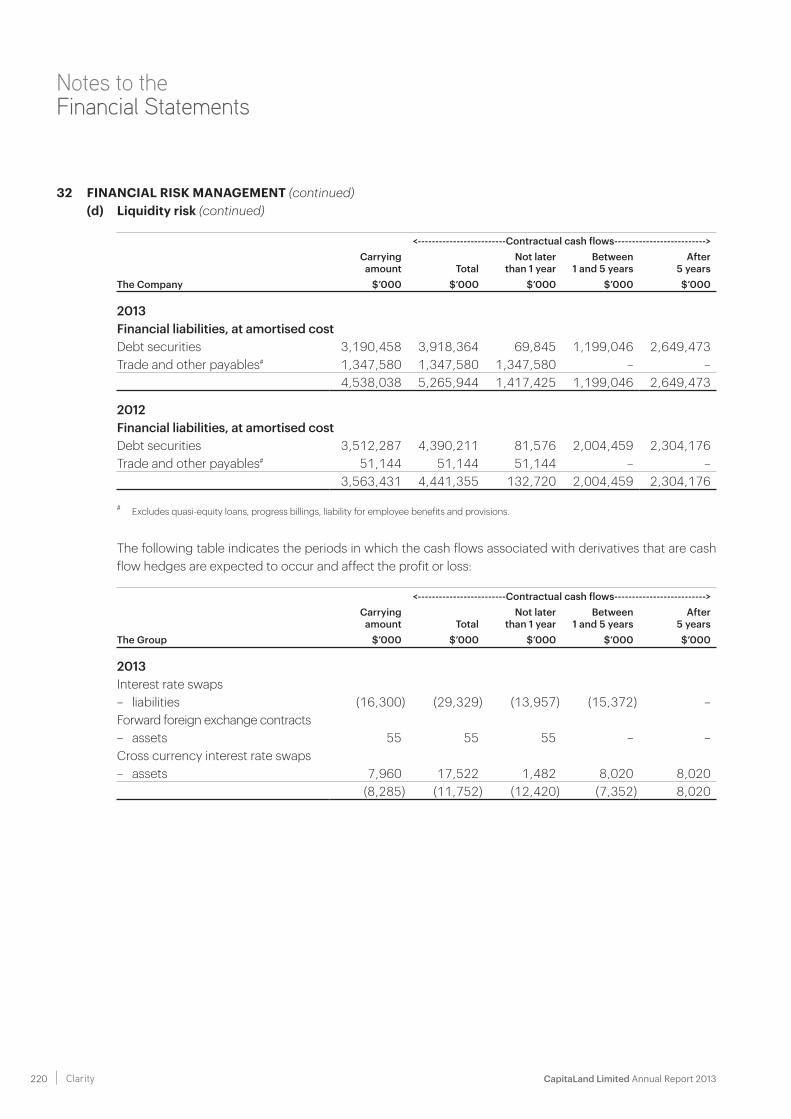
CapitaLand Limited Annual Report 2013 220 Clarity
Notes to the Financial Statements
32 FINANCIAL RISK MANAGEMENT (continued)(d) Liquidity risk (continued)
<-------------------------Contractual cash flows-------------------------->Carrying
amount TotalNot later
than 1 yearBetween
1 and 5 yearsAfter
5 yearsThe Company $’000 $’000 $’000 $’000 $’000
2013Financial liabilities, at amortised costDebt securities 3,190,458 3,918,364 69,845 1,199,046 2,649,473Trade and other payables# 1,347,580 1,347,580 1,347,580 – –
4,538,038 5,265,944 1,417,425 1,199,046 2,649,473
2012Financial liabilities, at amortised costDebt securities 3,512,287 4,390,211 81,576 2,004,459 2,304,176Trade and other payables# 51,144 51,144 51,144 – –
3,563,431 4,441,355 132,720 2,004,459 2,304,176
# Excludes quasi-equity loans, progress billings, liability for employee benefits and provisions.
The following table indicates the periods in which the cash flows associated with derivatives that are cash flow hedges are expected to occur and affect the profit or loss:
<-------------------------Contractual cash flows-------------------------->Carrying
amount TotalNot later
than 1 yearBetween
1 and 5 yearsAfter
5 yearsThe Group $’000 $’000 $’000 $’000 $’000
2013Interest rate swaps– liabilities (16,300) (29,329) (13,957) (15,372) –Forward foreign exchange contracts– assets 55 55 55 – –Cross currency interest rate swaps– assets 7,960 17,522 1,482 8,020 8,020
(8,285) (11,752) (12,420) (7,352) 8,020
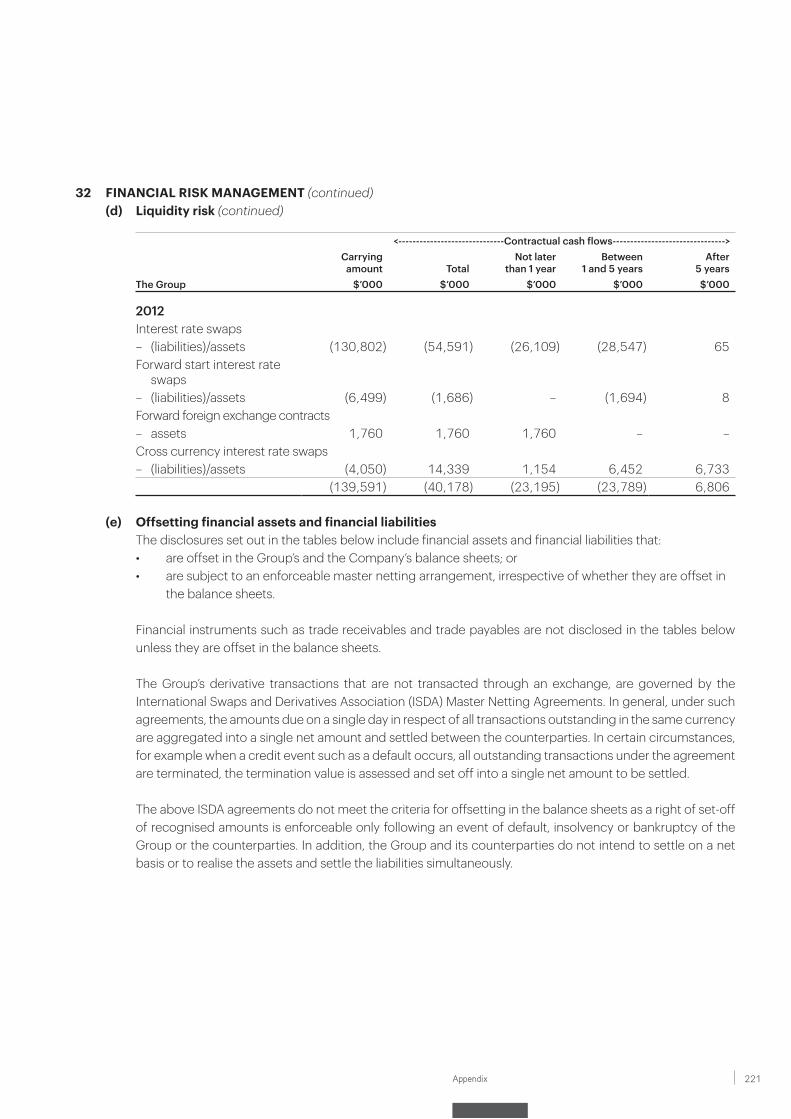
221Appendix
32 FINANCIAL RISK MANAGEMENT (continued)(d) Liquidity risk (continued)
<------------------------------Contractual cash flows-------------------------------->Carrying
amount TotalNot later
than 1 yearBetween
1 and 5 yearsAfter
5 yearsThe Group $’000 $’000 $’000 $’000 $’000
2012Interest rate swaps– (liabilities)/assets (130,802) (54,591) (26,109) (28,547) 65Forward start interest rate
swaps– (liabilities)/assets (6,499) (1,686) – (1,694) 8Forward foreign exchange contracts– assets 1,760 1,760 1,760 – –Cross currency interest rate swaps– (liabilities)/assets (4,050) 14,339 1,154 6,452 6,733
(139,591) (40,178) (23,195) (23,789) 6,806
(e) Offsetting financial assets and financial liabilities The disclosures set out in the tables below include financial assets and financial liabilities that:
• are offset in the Group’s and the Company’s balance sheets; or• are subject to an enforceable master netting arrangement, irrespective of whether they are offset in
the balance sheets.
Financial instruments such as trade receivables and trade payables are not disclosed in the tables below unless they are offset in the balance sheets.
The Group’s derivative transactions that are not transacted through an exchange, are governed by the International Swaps and Derivatives Association (ISDA) Master Netting Agreements. In general, under such agreements, the amounts due on a single day in respect of all transactions outstanding in the same currency are aggregated into a single net amount and settled between the counterparties. In certain circumstances, for example when a credit event such as a default occurs, all outstanding transactions under the agreement are terminated, the termination value is assessed and set off into a single net amount to be settled.
The above ISDA agreements do not meet the criteria for offsetting in the balance sheets as a right of set-off of recognised amounts is enforceable only following an event of default, insolvency or bankruptcy of the Group or the counterparties. In addition, the Group and its counterparties do not intend to settle on a net basis or to realise the assets and settle the liabilities simultaneously.
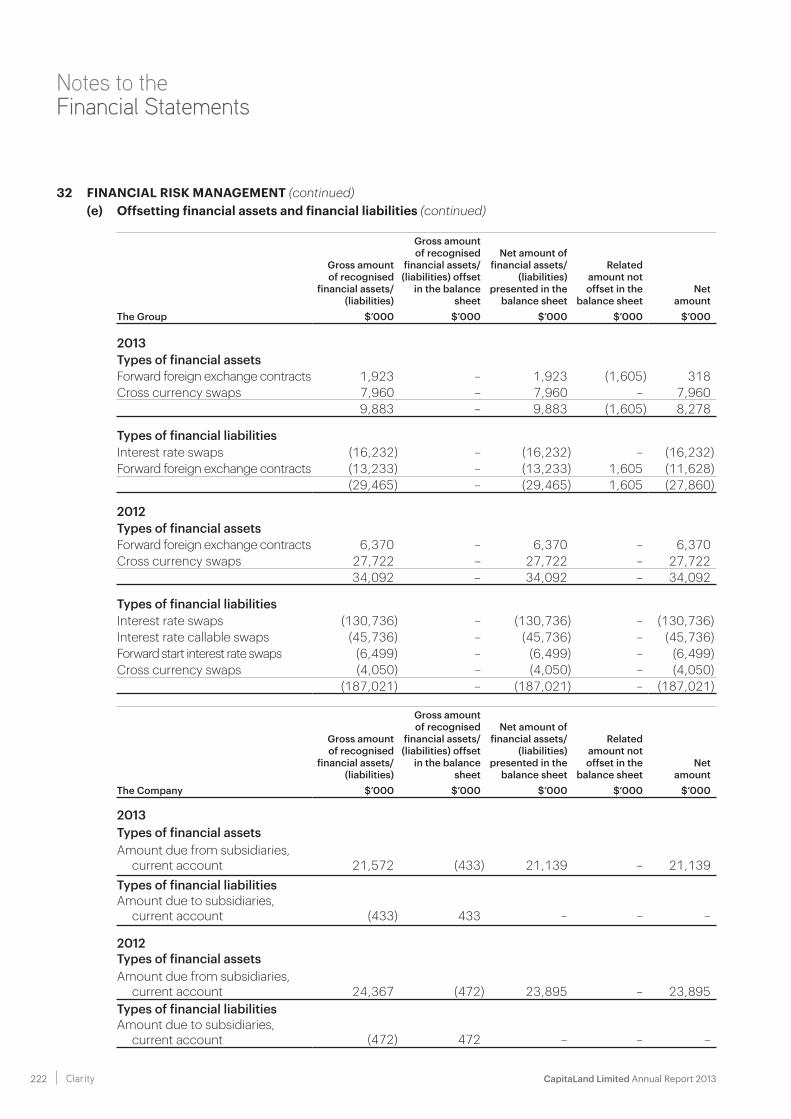
CapitaLand Limited Annual Report 2013 222 Clarity
Notes to the Financial Statements
32 FINANCIAL RISK MANAGEMENT (continued)(e) Offsetting financial assets and financial liabilities (continued)
Gross amount of recognised
financial assets/ (liabilities)
Gross amount of recognised
financial assets/ (liabilities) offset
in the balance sheet
Net amount of financial assets/
(liabilities) presented in the
balance sheet
Related amount not offset in the
balance sheetNet
amountThe Group $’000 $’000 $’000 $’000 $’000
2013Types of financial assetsForward foreign exchange contracts 1,923 – 1,923 (1,605) 318Cross currency swaps 7,960 – 7,960 – 7,960
9,883 – 9,883 (1,605) 8,278
Types of financial liabilitiesInterest rate swaps (16,232) – (16,232) – (16,232)Forward foreign exchange contracts (13,233) – (13,233) 1,605 (11,628)
(29,465) – (29,465) 1,605 (27,860)
2012Types of financial assetsForward foreign exchange contracts 6,370 – 6,370 – 6,370Cross currency swaps 27,722 – 27,722 – 27,722
34,092 – 34,092 – 34,092
Types of financial liabilitiesInterest rate swaps (130,736) – (130,736) – (130,736)Interest rate callable swaps (45,736) – (45,736) – (45,736)Forward start interest rate swaps (6,499) – (6,499) – (6,499)Cross currency swaps (4,050) – (4,050) – (4,050)
(187,021) – (187,021) – (187,021)
Gross amount of recognised
financial assets/ (liabilities)
Gross amount of recognised
financial assets/ (liabilities) offset
in the balance sheet
Net amount of financial assets/
(liabilities) presented in the
balance sheet
Related amount not offset in the
balance sheetNet
amountThe Company $’000 $’000 $’000 $’000 $’000
2013Types of financial assetsAmount due from subsidiaries,
current account 21,572 (433) 21,139 – 21,139Types of financial liabilitiesAmount due to subsidiaries,
current account (433) 433 – – –
2012Types of financial assetsAmount due from subsidiaries,
current account 24,367 (472) 23,895 – 23,895Types of financial liabilitiesAmount due to subsidiaries,
current account (472) 472 – – –
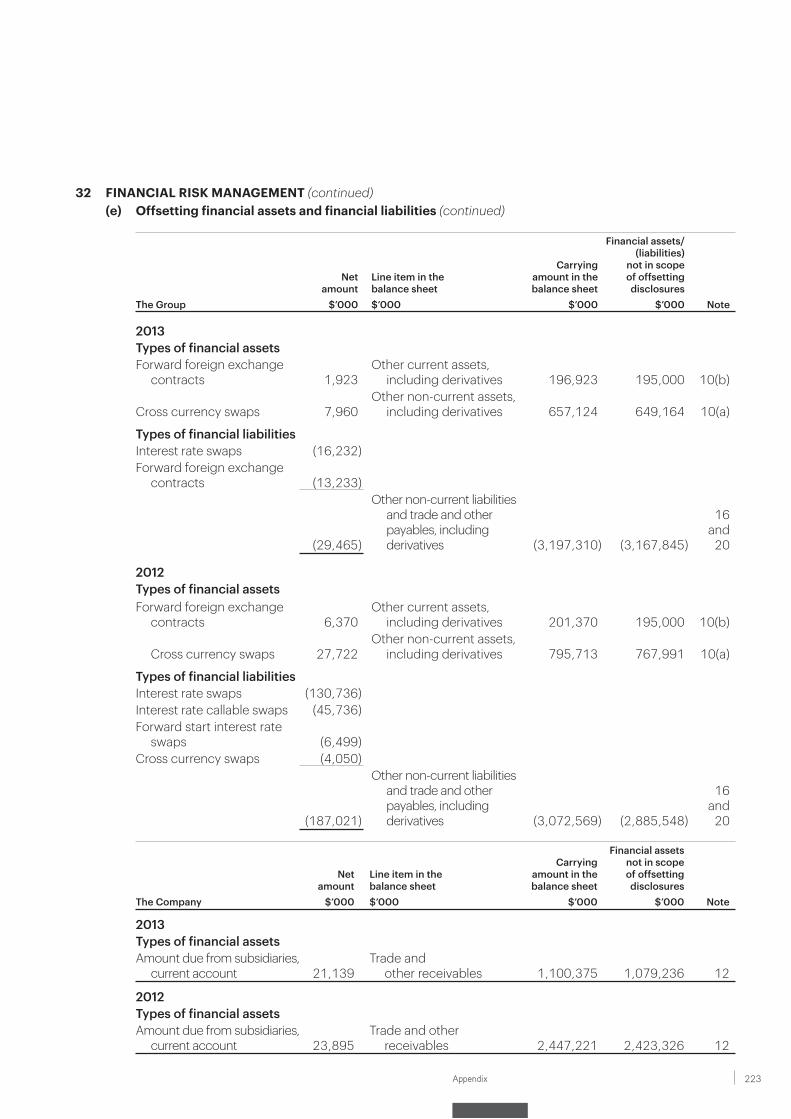
223Appendix
32 FINANCIAL RISK MANAGEMENT (continued)(e) Offsetting financial assets and financial liabilities (continued)
Net amount
Line item in the balance sheet
Carrying amount in the balance sheet
Financial assets/ (liabilities)
not in scope of offsetting disclosures
The Group $’000 $’000 $’000 $’000 Note
2013Types of financial assetsForward foreign exchange
contracts 1,923Other current assets,
including derivatives 196,923 195,000 10(b)
Cross currency swaps 7,960Other non-current assets,
including derivatives 657,124 649,164 10(a)
Types of financial liabilitiesInterest rate swaps (16,232)Forward foreign exchange
contracts (13,233)
(29,465)
Other non-current liabilities and trade and other payables, including derivatives (3,197,310) (3,167,845)
16 and
20
2012Types of financial assetsForward foreign exchange
contracts 6,370Other current assets,
including derivatives 201,370 195,000 10(b)
Cross currency swaps 27,722Other non-current assets,
including derivatives 795,713 767,991 10(a)
Types of financial liabilitiesInterest rate swaps (130,736)Interest rate callable swaps (45,736)Forward start interest rate
swaps (6,499)Cross currency swaps (4,050)
(187,021)
Other non-current liabilities and trade and other payables, including derivatives (3,072,569) (2,885,548)
16 and
20
Net amount
Line item in the balance sheet
Carrying amount in the balance sheet
Financial assets not in scope of offsetting disclosures
The Company $’000 $’000 $’000 $’000 Note
2013Types of financial assetsAmount due from subsidiaries,
current account 21,139Trade and
other receivables 1,100,375 1,079,236 12
2012Types of financial assetsAmount due from subsidiaries,
current account 23,895Trade and other
receivables 2,447,221 2,423,326 12
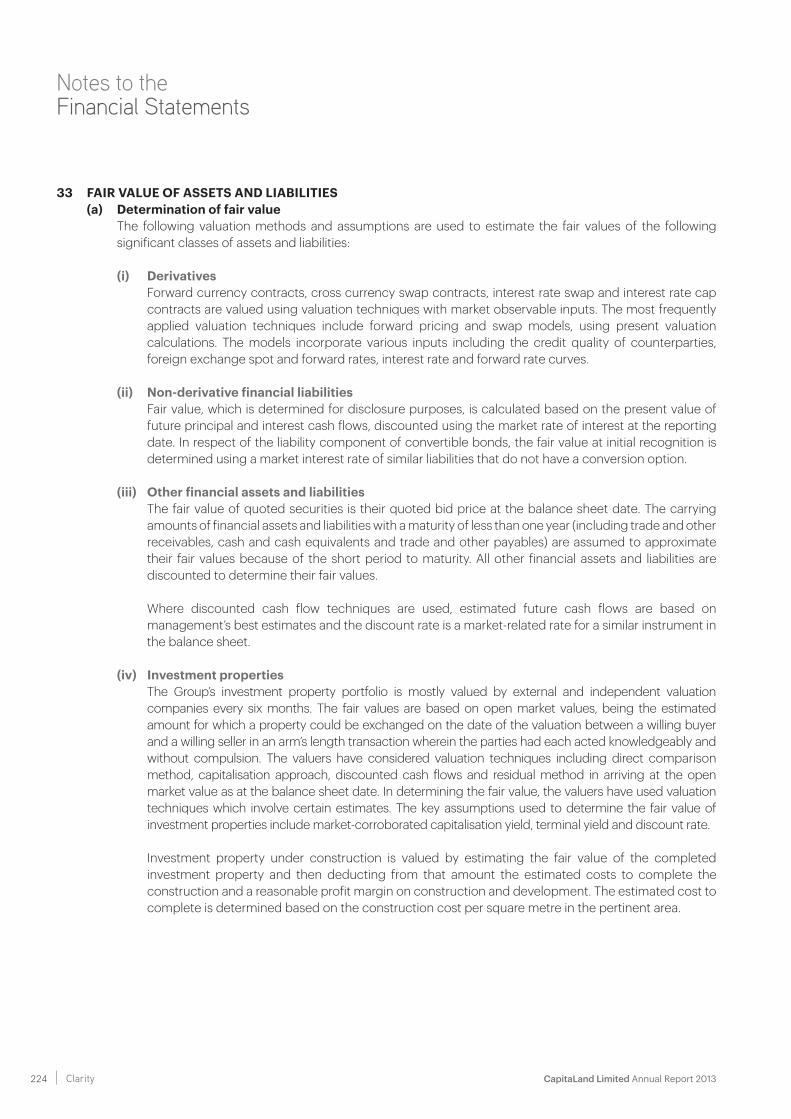
CapitaLand Limited Annual Report 2013 224 Clarity
Notes to the Financial Statements
33 FAIR VALUE OF ASSETS AND LIABILITIES(a) Determination of fair value The following valuation methods and assumptions are used to estimate the fair values of the following
significant classes of assets and liabilities:
(i) Derivatives Forward currency contracts, cross currency swap contracts, interest rate swap and interest rate cap
contracts are valued using valuation techniques with market observable inputs. The most frequently applied valuation techniques include forward pricing and swap models, using present valuation calculations. The models incorporate various inputs including the credit quality of counterparties, foreign exchange spot and forward rates, interest rate and forward rate curves.
(ii) Non-derivative financial liabilities Fair value, which is determined for disclosure purposes, is calculated based on the present value of
future principal and interest cash flows, discounted using the market rate of interest at the reporting date. In respect of the liability component of convertible bonds, the fair value at initial recognition is determined using a market interest rate of similar liabilities that do not have a conversion option.
(iii) Other financial assets and liabilities The fair value of quoted securities is their quoted bid price at the balance sheet date. The carrying
amounts of financial assets and liabilities with a maturity of less than one year (including trade and other receivables, cash and cash equivalents and trade and other payables) are assumed to approximate their fair values because of the short period to maturity. All other financial assets and liabilities are discounted to determine their fair values.
Where discounted cash flow techniques are used, estimated future cash flows are based on management’s best estimates and the discount rate is a market-related rate for a similar instrument in the balance sheet.
(iv) Investment properties The Group’s investment property portfolio is mostly valued by external and independent valuation
companies every six months. The fair values are based on open market values, being the estimated amount for which a property could be exchanged on the date of the valuation between a willing buyer and a willing seller in an arm’s length transaction wherein the parties had each acted knowledgeably and without compulsion. The valuers have considered valuation techniques including direct comparison method, capitalisation approach, discounted cash flows and residual method in arriving at the open market value as at the balance sheet date. In determining the fair value, the valuers have used valuation techniques which involve certain estimates. The key assumptions used to determine the fair value of investment properties include market-corroborated capitalisation yield, terminal yield and discount rate.
Investment property under construction is valued by estimating the fair value of the completed investment property and then deducting from that amount the estimated costs to complete the construction and a reasonable profit margin on construction and development. The estimated cost to complete is determined based on the construction cost per square metre in the pertinent area.
225Appendix
33 FAIR VALUE OF ASSETS AND LIABILITIES (continued)(a) Determination of fair value (continued)
(v) Property, plant and equipment The fair value of the property, plant and equipment recognised as a result of a business combination
is the estimated amount for which a property could be exchanged on the date of acquisition between a willing buyer and a willing seller in an arm’s length transaction after proper marketing wherein the parties had each acted knowledgeably and willingly. The residual values of serviced residence properties at the end of the intended holding period are determined based on annual independent professional valuations, using valuation methods such as discounted cash flow and/or comparison method. The key assumptions used to determine the residual values of serviced residence properties include terminal yield and discount rate.
(vi) Share-based payment transactions The fair values of employee performance share plan and restricted stock/share plan are measured using
Monte Carlo Simulation. The fair value of employee share option plan is measured using Enhanced Trinomial (Hull and White) valuation model. Measurement inputs include the share price at grant date, expected volatility (based on an evaluation of the historical volatility of the Company’s and subsidiaries’ share price), expected term of the instruments (based on historical experience and general option holder behaviour), expected dividends and the risk-free interest rate (based on government bonds). Service and non-market performance conditions attached to the transactions are not taken into account in determining the fair values.
(b) Fair value hierarchy The Group categorises fair value measurements using a fair value hierarchy that is dependent on the
valuation inputs used. The different levels have been defined as follows:
Level 1: Quoted prices (unadjusted) in active markets for identical assets or liabilities.
Level 2: Inputs other than quoted prices included within Level 1 that are observable for the asset or liability, either directly (i.e., as prices) or indirectly (i.e., derived from prices).
Level 3: Inputs for the asset or liability that are not based on observable market data (unobservable inputs).
(c) Accounting classifications and fair values The following tables show the carrying amounts and fair values of financial assets and financial liabilities,
including their levels in the fair value hierarchy. It does not include fair value information for short term trade and other receivables, cash and cash equivalents and trade and other payables as their carrying amounts are reasonable approximation of fair values.
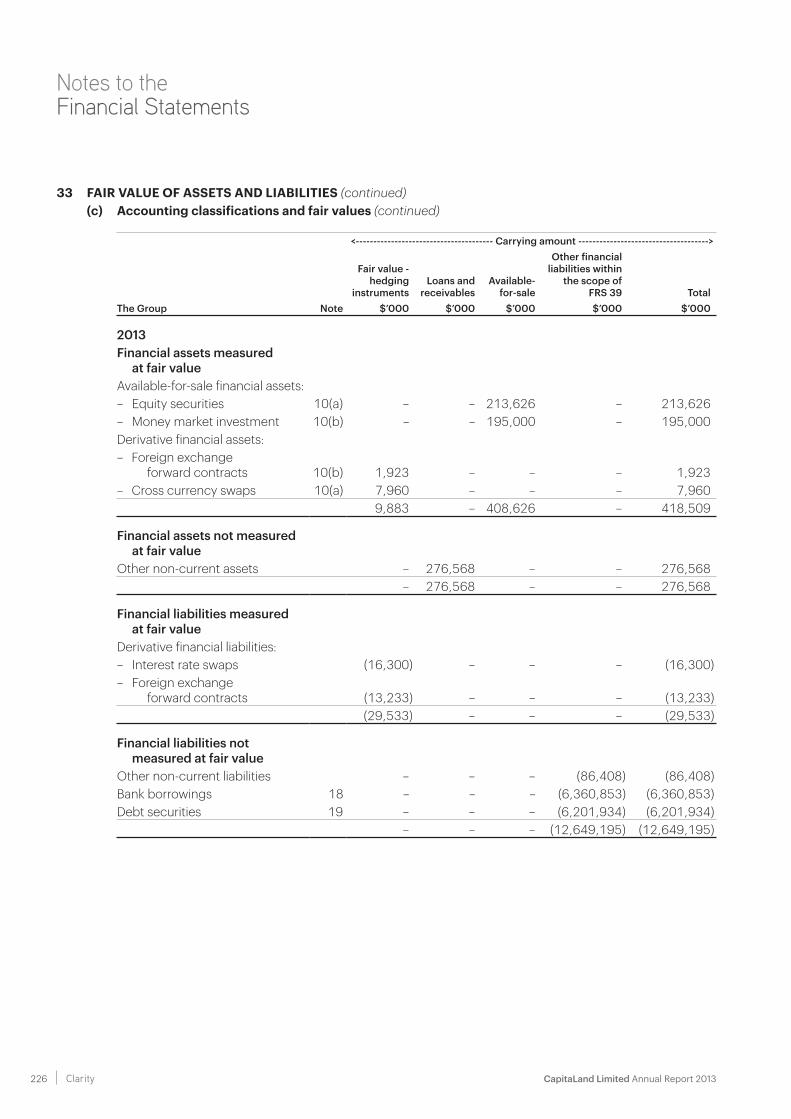
CapitaLand Limited Annual Report 2013 226 Clarity
Notes to the Financial Statements
33 FAIR VALUE OF ASSETS AND LIABILITIES (continued)(c) Accounting classifications and fair values (continued)
<--------------------------------------- Carrying amount ------------------------------------->
Fair value -hedging
instrumentsLoans and
receivablesAvailable-
for-sale
Other financialliabilities within
the scope ofFRS 39 Total
The Group Note $’000 $’000 $’000 $’000 $’000
2013Financial assets measured
at fair valueAvailable-for-sale financial assets:– Equity securities 10(a) – – 213,626 – 213,626– Money market investment 10(b) – – 195,000 – 195,000Derivative financial assets:– Foreign exchange forward contracts 10(b) 1,923 – – – 1,923– Cross currency swaps 10(a) 7,960 – – – 7,960
9,883 – 408,626 – 418,509
Financial assets not measured at fair value
Other non-current assets – 276,568 – – 276,568– 276,568 – – 276,568
Financial liabilities measured at fair value
Derivative financial liabilities:– Interest rate swaps (16,300) – – – (16,300)– Foreign exchange
forward contracts (13,233) – – – (13,233)(29,533) – – – (29,533)
Financial liabilities not measured at fair value
Other non-current liabilities – – – (86,408) (86,408)Bank borrowings 18 – – – (6,360,853) (6,360,853)Debt securities 19 – – – (6,201,934) (6,201,934)
– – – (12,649,195) (12,649,195)
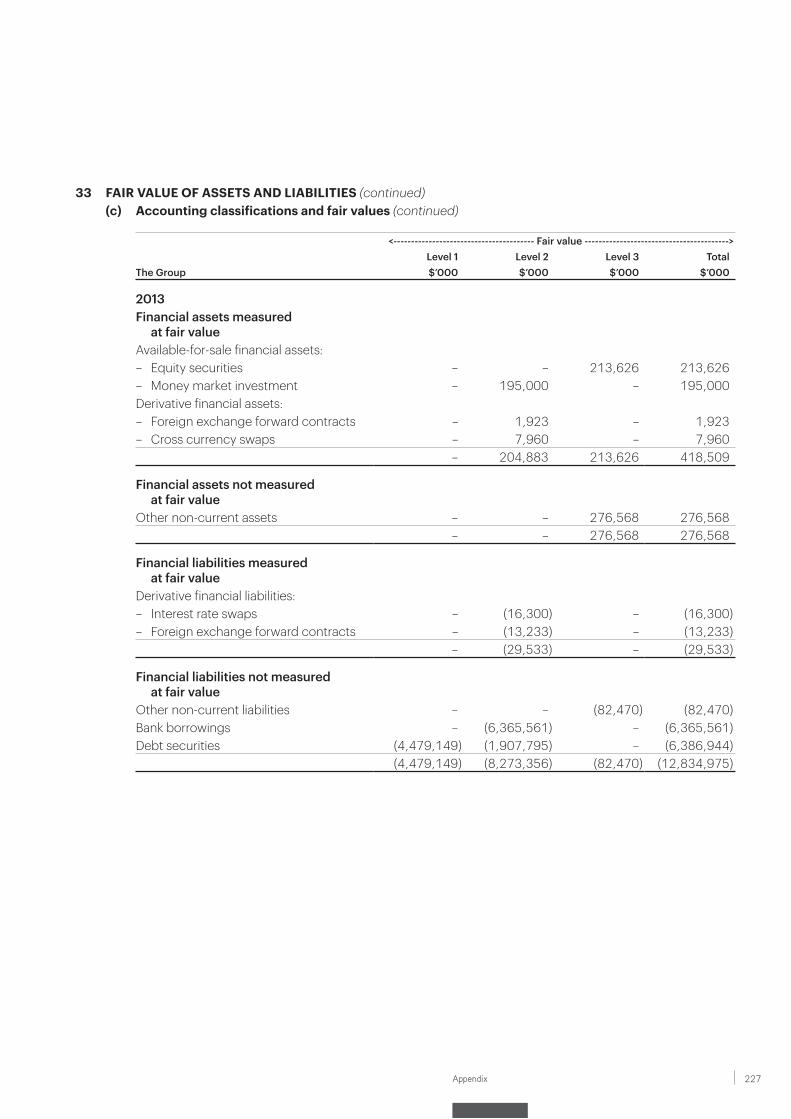
227Appendix
33 FAIR VALUE OF ASSETS AND LIABILITIES (continued)(c) Accounting classifications and fair values (continued)
<---------------------------------------- Fair value ----------------------------------------->Level 1 Level 2 Level 3 Total
The Group $’000 $’000 $’000 $’000
2013Financial assets measured
at fair valueAvailable-for-sale financial assets:– Equity securities – – 213,626 213,626– Money market investment – 195,000 – 195,000Derivative financial assets:– Foreign exchange forward contracts – 1,923 – 1,923– Cross currency swaps – 7,960 – 7,960
– 204,883 213,626 418,509
Financial assets not measured at fair value
Other non-current assets – – 276,568 276,568– – 276,568 276,568
Financial liabilities measured at fair value
Derivative financial liabilities:– Interest rate swaps – (16,300) – (16,300)– Foreign exchange forward contracts – (13,233) – (13,233)
– (29,533) – (29,533)
Financial liabilities not measured at fair value
Other non-current liabilities – – (82,470) (82,470)Bank borrowings – (6,365,561) – (6,365,561)Debt securities (4,479,149) (1,907,795) – (6,386,944)
(4,479,149) (8,273,356) (82,470) (12,834,975)
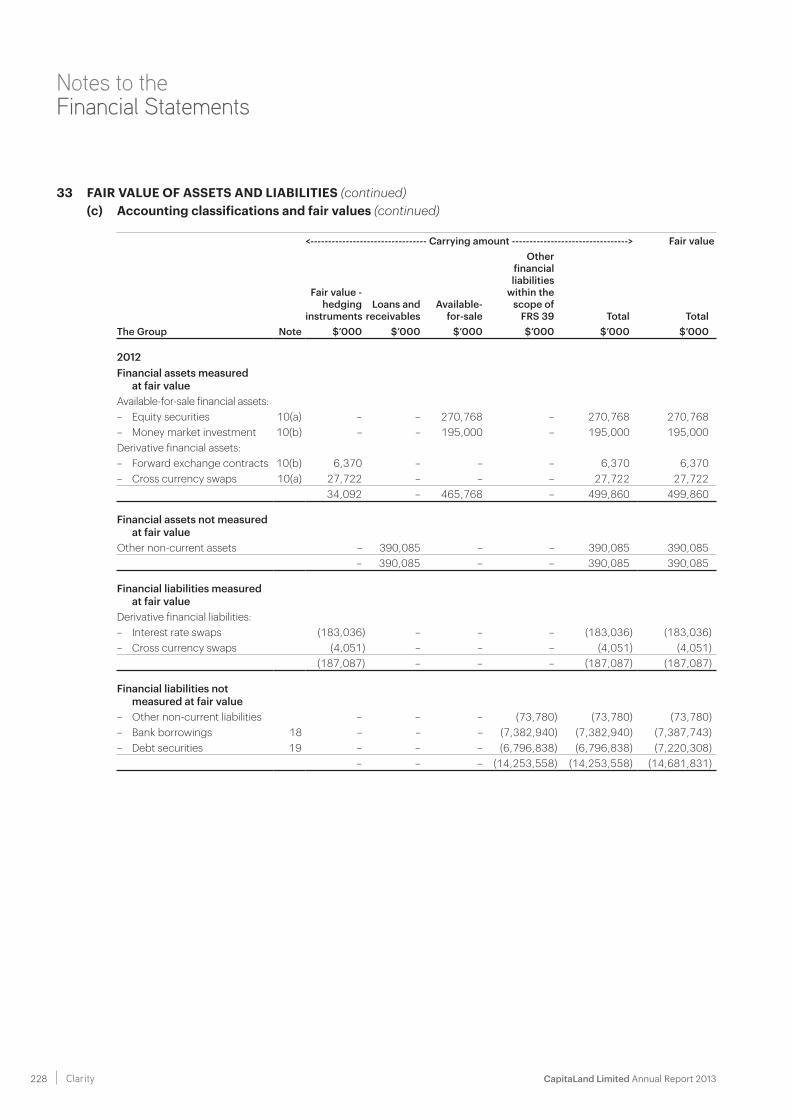
CapitaLand Limited Annual Report 2013 228 Clarity
Notes to the Financial Statements
33 FAIR VALUE OF ASSETS AND LIABILITIES (continued)(c) Accounting classifications and fair values (continued)
<--------------------------------- Carrying amount ---------------------------------> Fair value
Fair value -hedging
instrumentsLoans and
receivablesAvailable-
for-sale
Otherfinancial liabilities
within thescope of
FRS 39 Total TotalThe Group Note $’000 $’000 $’000 $’000 $’000 $’000
2012Financial assets measured
at fair valueAvailable-for-sale financial assets:– Equity securities 10(a) – – 270,768 – 270,768 270,768– Money market investment 10(b) – – 195,000 – 195,000 195,000Derivative financial assets:– Forward exchange contracts 10(b) 6,370 – – – 6,370 6,370– Cross currency swaps 10(a) 27,722 – – – 27,722 27,722
34,092 – 465,768 – 499,860 499,860
Financial assets not measured at fair value
Other non-current assets – 390,085 – – 390,085 390,085– 390,085 – – 390,085 390,085
Financial liabilities measured at fair value
Derivative financial liabilities:– Interest rate swaps (183,036) – – – (183,036) (183,036)– Cross currency swaps (4,051) – – – (4,051) (4,051)
(187,087) – – – (187,087) (187,087)
Financial liabilities not measured at fair value
– Other non-current liabilities – – – (73,780) (73,780) (73,780)– Bank borrowings 18 – – – (7,382,940) (7,382,940) (7,387,743)– Debt securities 19 – – – (6,796,838) (6,796,838) (7,220,308)
– – – (14,253,558) (14,253,558) (14,681,831)
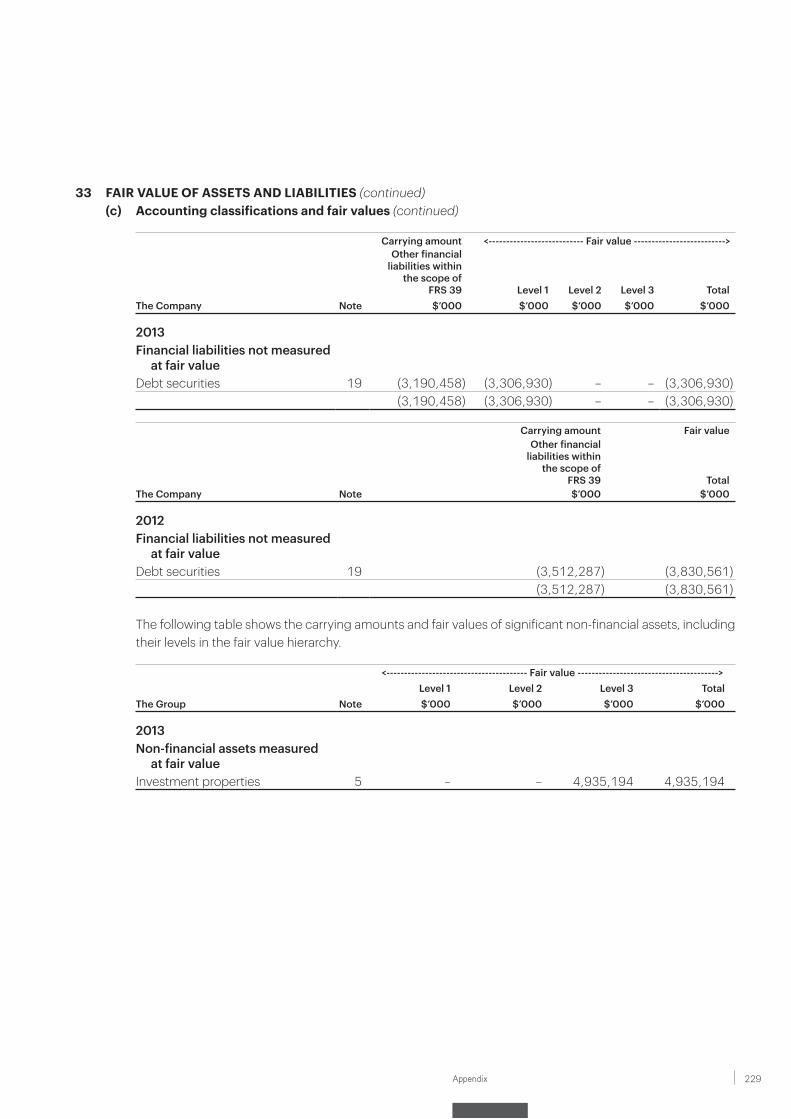
229Appendix
33 FAIR VALUE OF ASSETS AND LIABILITIES (continued)(c) Accounting classifications and fair values (continued)
Carrying amount <--------------------------- Fair value -------------------------->Other financial
liabilities within the scope of
FRS 39 Level 1 Level 2 Level 3 TotalThe Company Note $’000 $’000 $’000 $’000 $’000
2013Financial liabilities not measured
at fair valueDebt securities 19 (3,190,458) (3,306,930) – – (3,306,930)
(3,190,458) (3,306,930) – – (3,306,930)
Carrying amount Fair valueOther financial
liabilities within the scope of
FRS 39 TotalThe Company Note $’000 $’000
2012Financial liabilities not measured
at fair valueDebt securities 19 (3,512,287) (3,830,561)
(3,512,287) (3,830,561)
The following table shows the carrying amounts and fair values of significant non-financial assets, including their levels in the fair value hierarchy.
<---------------------------------------- Fair value ---------------------------------------->Level 1 Level 2 Level 3 Total
The Group Note $’000 $’000 $’000 $’000
2013Non-financial assets measured
at fair valueInvestment properties 5 – – 4,935,194 4,935,194
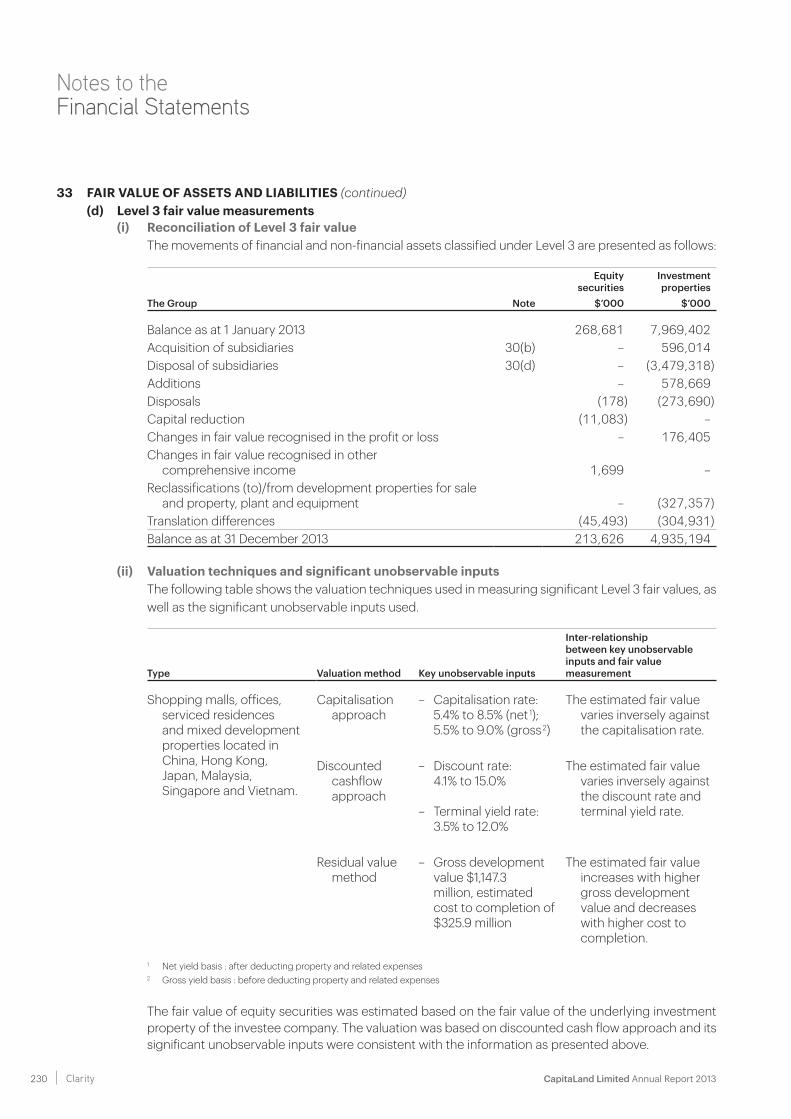
CapitaLand Limited Annual Report 2013 230 Clarity
Notes to the Financial Statements
33 FAIR VALUE OF ASSETS AND LIABILITIES (continued)(d) Level 3 fair value measurements
(i) Reconciliation of Level 3 fair value The movements of financial and non-financial assets classified under Level 3 are presented as follows:
Equitysecurities
Investment properties
The Group Note $’000 $’000
Balance as at 1 January 2013 268,681 7,969,402Acquisition of subsidiaries 30(b) – 596,014Disposal of subsidiaries 30(d) – (3,479,318)Additions – 578,669Disposals (178) (273,690)Capital reduction (11,083) –Changes in fair value recognised in the profit or loss – 176,405Changes in fair value recognised in other
comprehensive income 1,699 –Reclassifications (to)/from development properties for sale
and property, plant and equipment – (327,357)Translation differences (45,493) (304,931)Balance as at 31 December 2013 213,626 4,935,194
(ii) Valuation techniques and significant unobservable inputs The following table shows the valuation techniques used in measuring significant Level 3 fair values, as
well as the significant unobservable inputs used.
Type Valuation method Key unobservable inputs
Inter-relationship between key unobservable inputs and fair value measurement
Shopping malls, offices, serviced residences and mixed development properties located in China, Hong Kong, Japan, Malaysia, Singapore and Vietnam.
Capitalisation approach
– Capitalisation rate: 5.4% to 8.5% (net 1); 5.5% to 9.0% (gross 2)
The estimated fair value varies inversely against the capitalisation rate.
Discounted cashflow approach
– Discount rate: 4.1% to 15.0%
– Terminal yield rate: 3.5% to 12.0%
The estimated fair value varies inversely against the discount rate and terminal yield rate.
Residual value method
– Gross development value $1,147.3 million, estimated cost to completion of $325.9 million
The estimated fair value increases with higher gross development value and decreases with higher cost to completion.
1 Net yield basis : after deducting property and related expenses2 Gross yield basis : before deducting property and related expenses
The fair value of equity securities was estimated based on the fair value of the underlying investment property of the investee company. The valuation was based on discounted cash flow approach and its significant unobservable inputs were consistent with the information as presented above.
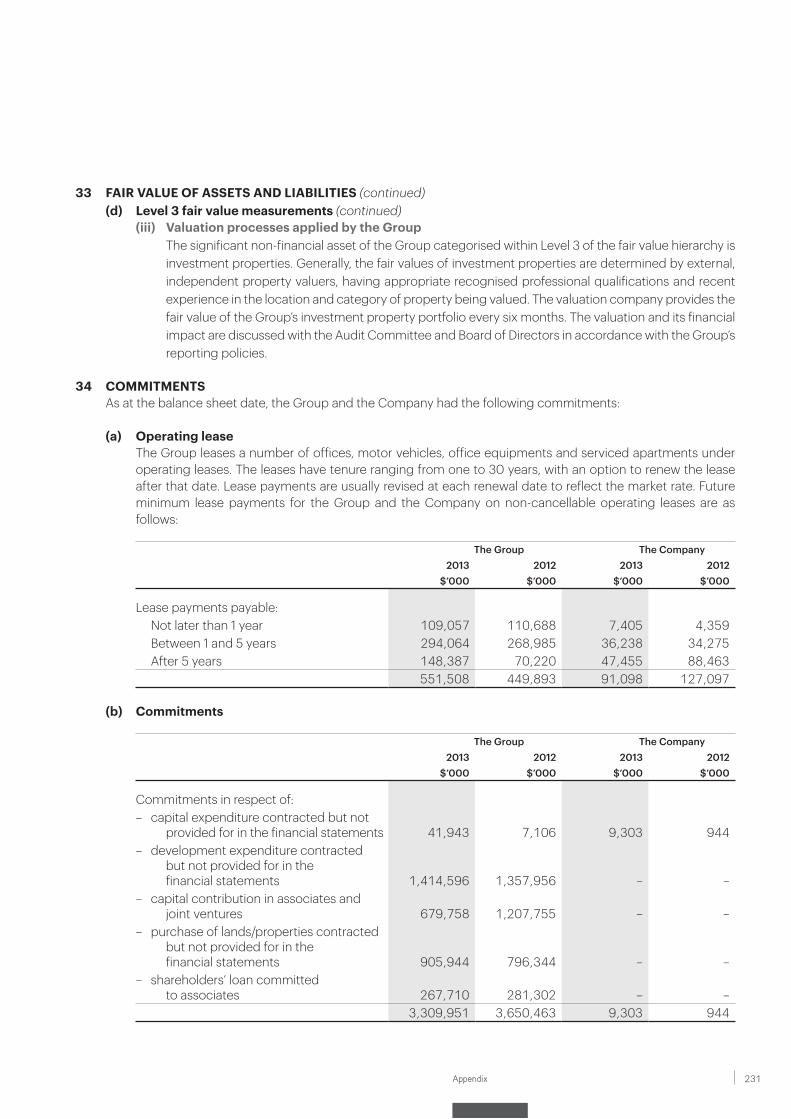
231Appendix
33 FAIR VALUE OF ASSETS AND LIABILITIES (continued)(d) Level 3 fair value measurements (continued)
(iii) Valuation processes applied by the Group The significant non-financial asset of the Group categorised within Level 3 of the fair value hierarchy is
investment properties. Generally, the fair values of investment properties are determined by external, independent property valuers, having appropriate recognised professional qualifications and recent experience in the location and category of property being valued. The valuation company provides the fair value of the Group’s investment property portfolio every six months. The valuation and its financial impact are discussed with the Audit Committee and Board of Directors in accordance with the Group’s reporting policies.
34 COMMITMENTS As at the balance sheet date, the Group and the Company had the following commitments:
(a) Operating lease The Group leases a number of offices, motor vehicles, office equipments and serviced apartments under
operating leases. The leases have tenure ranging from one to 30 years, with an option to renew the lease after that date. Lease payments are usually revised at each renewal date to reflect the market rate. Future minimum lease payments for the Group and the Company on non-cancellable operating leases are as follows:
The Group The Company2013 2012 2013 2012
$’000 $’000 $’000 $’000
Lease payments payable: Not later than 1 year 109,057 110,688 7,405 4,359 Between 1 and 5 years 294,064 268,985 36,238 34,275 After 5 years 148,387 70,220 47,455 88,463
551,508 449,893 91,098 127,097
(b) Commitments
The Group The Company2013 2012 2013 2012
$’000 $’000 $’000 $’000
Commitments in respect of:– capital expenditure contracted but not
provided for in the financial statements 41,943 7,106 9,303 944– development expenditure contracted
but not provided for in the financial statements 1,414,596 1,357,956 – –
– capital contribution in associates and joint ventures 679,758 1,207,755 – –
– purchase of lands/properties contracted but not provided for in the financial statements 905,944 796,344 – –
– shareholders’ loan committed to associates 267,710 281,302 – –
3,309,951 3,650,463 9,303 944
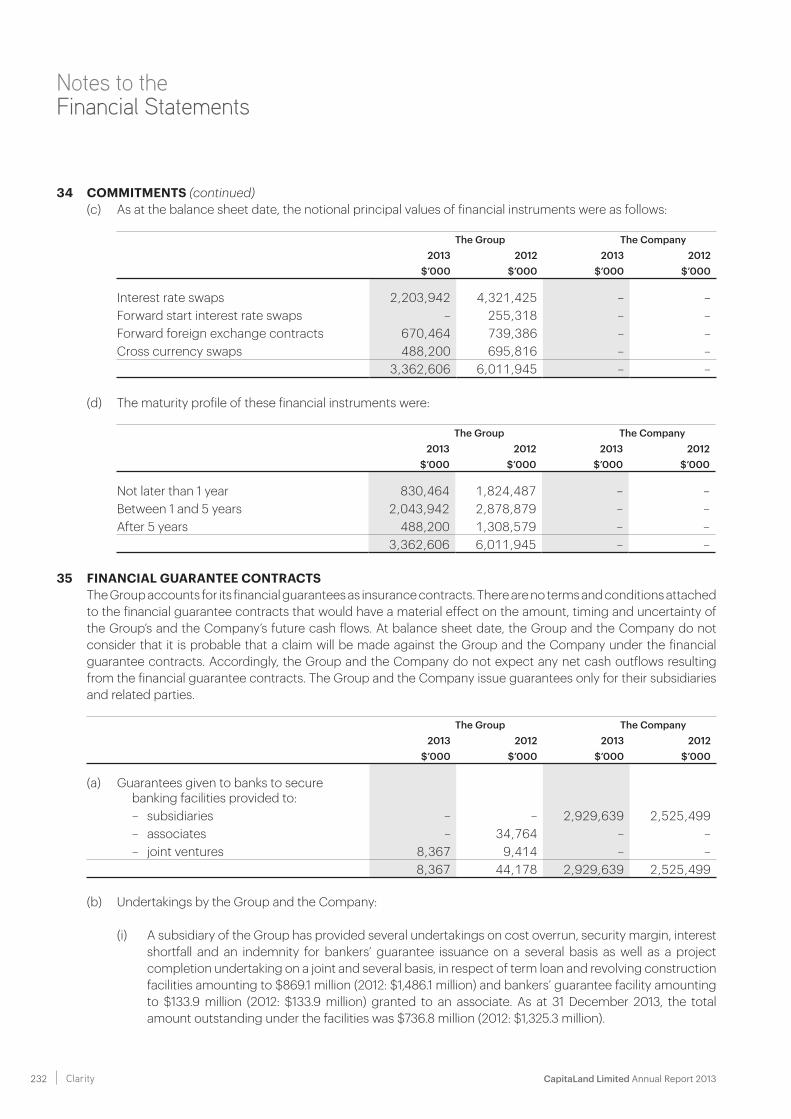
CapitaLand Limited Annual Report 2013 232 Clarity
Notes to the Financial Statements
34 COMMITMENTS (continued)(c) As at the balance sheet date, the notional principal values of financial instruments were as follows:
The Group The Company2013 2012 2013 2012
$’000 $’000 $’000 $’000
Interest rate swaps 2,203,942 4,321,425 – –Forward start interest rate swaps – 255,318 – –Forward foreign exchange contracts 670,464 739,386 – –Cross currency swaps 488,200 695,816 – –
3,362,606 6,011,945 – –
(d) The maturity profile of these financial instruments were:
The Group The Company2013 2012 2013 2012
$’000 $’000 $’000 $’000
Not later than 1 year 830,464 1,824,487 – –Between 1 and 5 years 2,043,942 2,878,879 – –After 5 years 488,200 1,308,579 – –
3,362,606 6,011,945 – –
35 FINANCIAL GUARANTEE CONTRACTS The Group accounts for its financial guarantees as insurance contracts. There are no terms and conditions attached
to the financial guarantee contracts that would have a material effect on the amount, timing and uncertainty of the Group’s and the Company’s future cash flows. At balance sheet date, the Group and the Company do not consider that it is probable that a claim will be made against the Group and the Company under the financial guarantee contracts. Accordingly, the Group and the Company do not expect any net cash outflows resulting from the financial guarantee contracts. The Group and the Company issue guarantees only for their subsidiaries and related parties.
The Group The Company2013 2012 2013 2012
$’000 $’000 $’000 $’000
(a) Guarantees given to banks to secure banking facilities provided to:
– subsidiaries – – 2,929,639 2,525,499 – associates – 34,764 – – – joint ventures 8,367 9,414 – –
8,367 44,178 2,929,639 2,525,499
(b) Undertakings by the Group and the Company:
(i) A subsidiary of the Group has provided several undertakings on cost overrun, security margin, interest shortfall and an indemnity for bankers’ guarantee issuance on a several basis as well as a project completion undertaking on a joint and several basis, in respect of term loan and revolving construction facilities amounting to $869.1 million (2012: $1,486.1 million) and bankers’ guarantee facility amounting to $133.9 million (2012: $133.9 million) granted to an associate. As at 31 December 2013, the total amount outstanding under the facilities was $736.8 million (2012: $1,325.3 million).
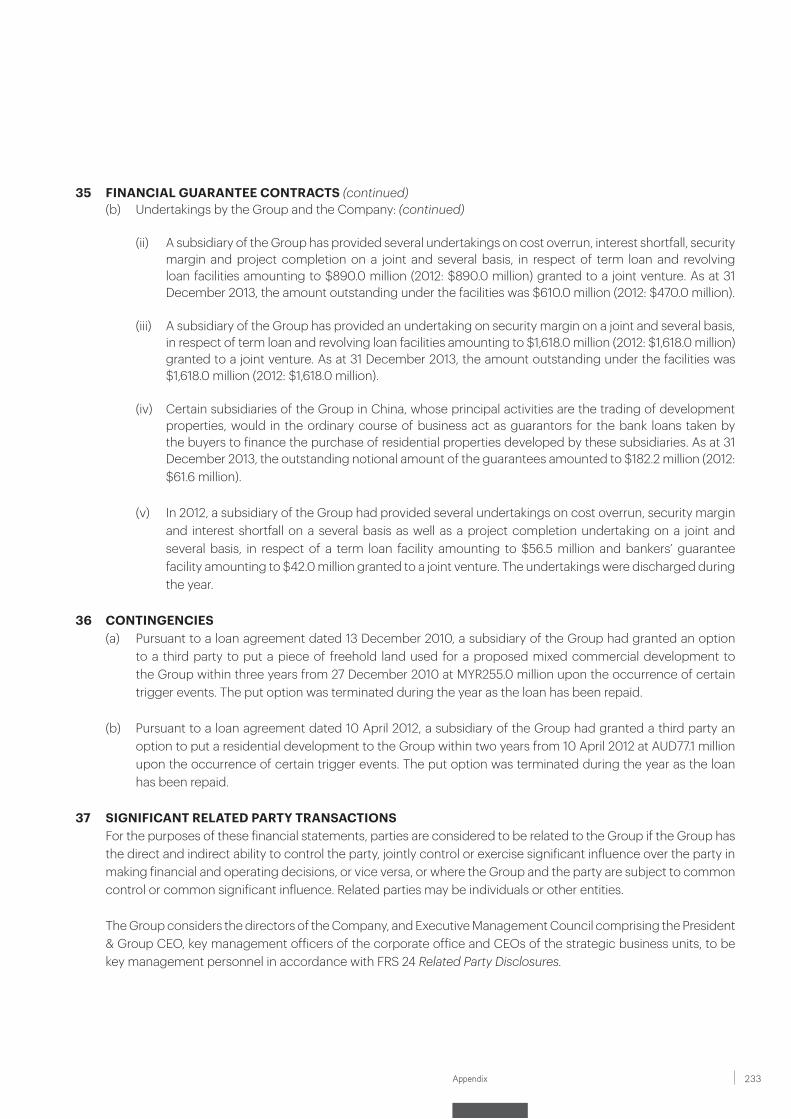
233Appendix
35 FINANCIAL GUARANTEE CONTRACTS (continued)(b) Undertakings by the Group and the Company: (continued)
(ii) A subsidiary of the Group has provided several undertakings on cost overrun, interest shortfall, security margin and project completion on a joint and several basis, in respect of term loan and revolving loan facilities amounting to $890.0 million (2012: $890.0 million) granted to a joint venture. As at 31 December 2013, the amount outstanding under the facilities was $610.0 million (2012: $470.0 million).
(iii) A subsidiary of the Group has provided an undertaking on security margin on a joint and several basis, in respect of term loan and revolving loan facilities amounting to $1,618.0 million (2012: $1,618.0 million) granted to a joint venture. As at 31 December 2013, the amount outstanding under the facilities was $1,618.0 million (2012: $1,618.0 million).
(iv) Certain subsidiaries of the Group in China, whose principal activities are the trading of development properties, would in the ordinary course of business act as guarantors for the bank loans taken by the buyers to finance the purchase of residential properties developed by these subsidiaries. As at 31 December 2013, the outstanding notional amount of the guarantees amounted to $182.2 million (2012: $61.6 million).
(v) In 2012, a subsidiary of the Group had provided several undertakings on cost overrun, security margin and interest shortfall on a several basis as well as a project completion undertaking on a joint and several basis, in respect of a term loan facility amounting to $56.5 million and bankers’ guarantee facility amounting to $42.0 million granted to a joint venture. The undertakings were discharged during the year.
36 CONTINGENCIES(a) Pursuant to a loan agreement dated 13 December 2010, a subsidiary of the Group had granted an option
to a third party to put a piece of freehold land used for a proposed mixed commercial development to the Group within three years from 27 December 2010 at MYR255.0 million upon the occurrence of certain trigger events. The put option was terminated during the year as the loan has been repaid.
(b) Pursuant to a loan agreement dated 10 April 2012, a subsidiary of the Group had granted a third party an option to put a residential development to the Group within two years from 10 April 2012 at AUD77.1 million upon the occurrence of certain trigger events. The put option was terminated during the year as the loan has been repaid.
37 SIGNIFICANT RELATED PARTY TRANSACTIONS For the purposes of these financial statements, parties are considered to be related to the Group if the Group has
the direct and indirect ability to control the party, jointly control or exercise significant influence over the party in making financial and operating decisions, or vice versa, or where the Group and the party are subject to common control or common significant influence. Related parties may be individuals or other entities.
The Group considers the directors of the Company, and Executive Management Council comprising the President & Group CEO, key management officers of the corporate office and CEOs of the strategic business units, to be key management personnel in accordance with FRS 24 Related Party Disclosures.
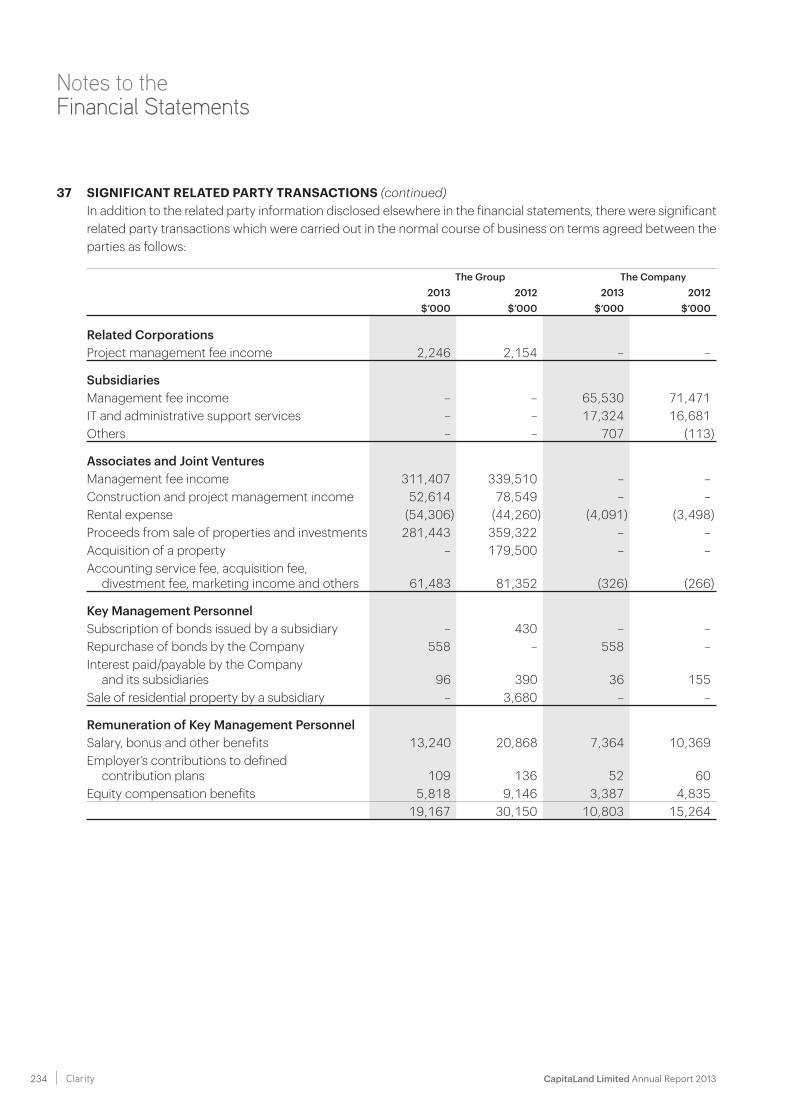
CapitaLand Limited Annual Report 2013 234 Clarity
Notes to the Financial Statements
37 SIGNIFICANT RELATED PARTY TRANSACTIONS (continued) In addition to the related party information disclosed elsewhere in the financial statements, there were significant
related party transactions which were carried out in the normal course of business on terms agreed between the parties as follows:
The Group The Company2013 2012 2013 2012
$’000 $’000 $’000 $’000
Related CorporationsProject management fee income 2,246 2,154 – –
SubsidiariesManagement fee income – – 65,530 71,471IT and administrative support services – – 17,324 16,681Others – – 707 (113)
Associates and Joint VenturesManagement fee income 311,407 339,510 – –Construction and project management income 52,614 78,549 – –Rental expense (54,306) (44,260) (4,091) (3,498)Proceeds from sale of properties and investments 281,443 359,322 – –Acquisition of a property – 179,500 – –Accounting service fee, acquisition fee,
divestment fee, marketing income and others 61,483 81,352 (326) (266)
Key Management PersonnelSubscription of bonds issued by a subsidiary – 430 – –Repurchase of bonds by the Company 558 – 558 –Interest paid/payable by the Company
and its subsidiaries 96 390 36 155Sale of residential property by a subsidiary – 3,680 – –
Remuneration of Key Management PersonnelSalary, bonus and other benefits 13,240 20,868 7,364 10,369Employer’s contributions to defined
contribution plans 109 136 52 60Equity compensation benefits 5,818 9,146 3,387 4,835
19,167 30,150 10,803 15,264
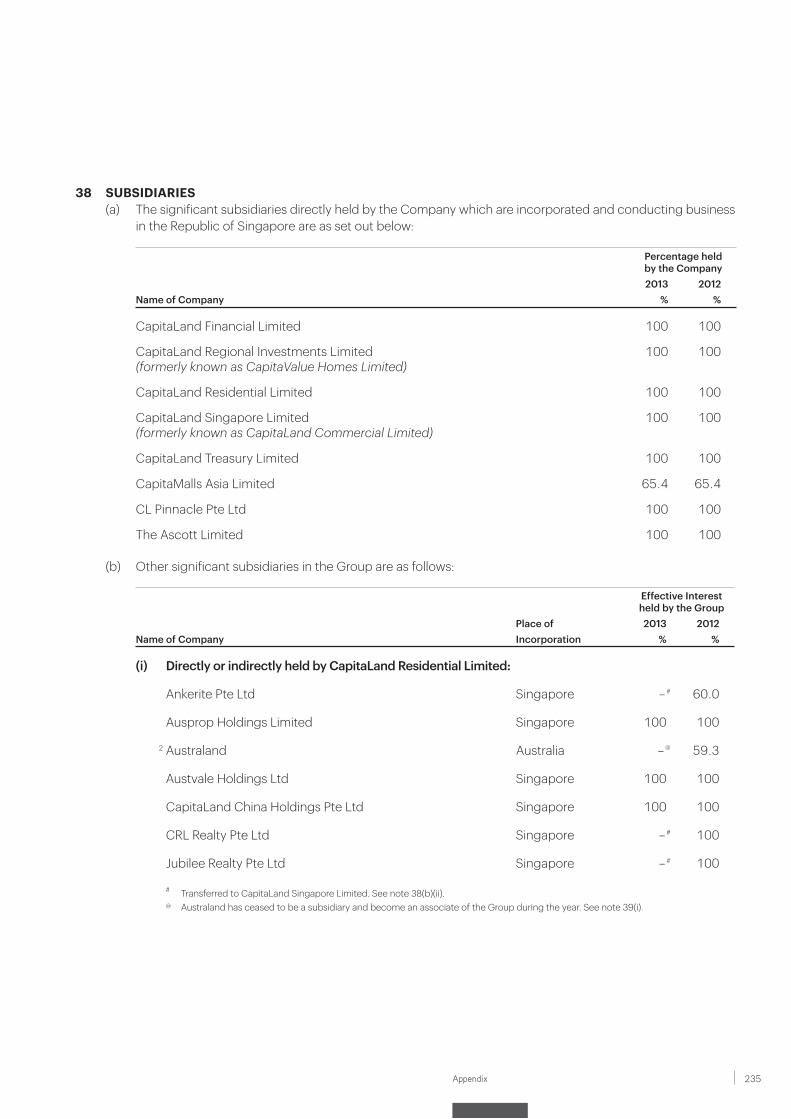
235Appendix
38 SUBSIDIARIES(a) The significant subsidiaries directly held by the Company which are incorporated and conducting business
in the Republic of Singapore are as set out below:
Percentage heldby the Company2013 2012
Name of Company % %
CapitaLand Financial Limited 100 100
CapitaLand Regional Investments Limited(formerly known as CapitaValue Homes Limited)
100 100
CapitaLand Residential Limited 100 100
CapitaLand Singapore Limited(formerly known as CapitaLand Commercial Limited)
100 100
CapitaLand Treasury Limited 100 100
CapitaMalls Asia Limited 65.4 65.4
CL Pinnacle Pte Ltd 100 100
The Ascott Limited 100 100
(b) Other significant subsidiaries in the Group are as follows:
Effective Interestheld by the Group
Place of 2013 2012Name of Company Incorporation % %
(i) Directly or indirectly held by CapitaLand Residential Limited:
Ankerite Pte Ltd Singapore – # 60.0
Ausprop Holdings Limited Singapore 100 100
2 Australand Australia – @ 59.3
Austvale Holdings Ltd Singapore 100 100
CapitaLand China Holdings Pte Ltd Singapore 100 100
CRL Realty Pte Ltd Singapore – # 100
Jubilee Realty Pte Ltd Singapore – # 100
# Transferred to CapitaLand Singapore Limited. See note 38(b)(ii).@ Australand has ceased to be a subsidiary and become an associate of the Group during the year. See note 39(i).
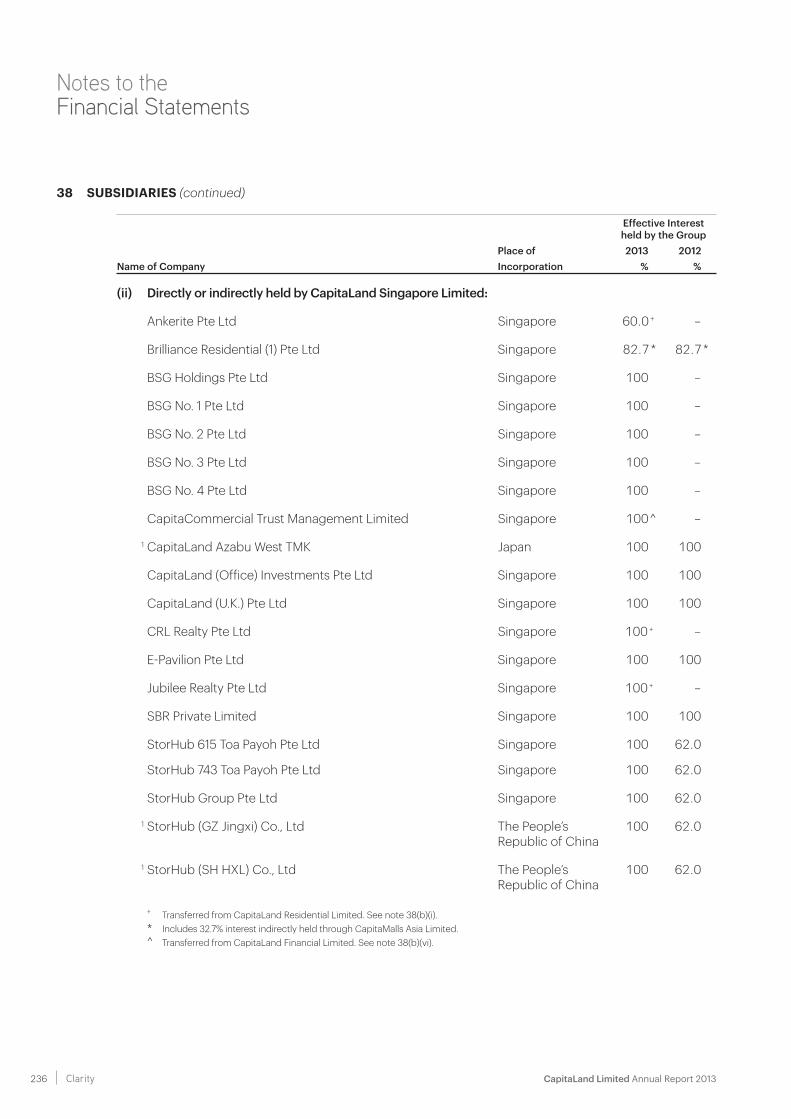
CapitaLand Limited Annual Report 2013 236 Clarity
Notes to the Financial Statements
38 SUBSIDIARIES (continued)
Effective Interestheld by the Group
Place of 2013 2012Name of Company Incorporation % %
(ii) Directly or indirectly held by CapitaLand Singapore Limited:
Ankerite Pte Ltd Singapore 60.0 + –
Brilliance Residential (1) Pte Ltd Singapore 82.7 * 82.7 *
BSG Holdings Pte Ltd Singapore 100 –
BSG No. 1 Pte Ltd Singapore 100 –
BSG No. 2 Pte Ltd Singapore 100 –
BSG No. 3 Pte Ltd Singapore 100 –
BSG No. 4 Pte Ltd Singapore 100 –
CapitaCommercial Trust Management Limited Singapore 100 ^ –
1 CapitaLand Azabu West TMK Japan 100 100
CapitaLand (Office) Investments Pte Ltd Singapore 100 100
CapitaLand (U.K.) Pte Ltd Singapore 100 100
CRL Realty Pte Ltd Singapore 100 + –
E-Pavilion Pte Ltd Singapore 100 100
Jubilee Realty Pte Ltd Singapore 100 + –
SBR Private Limited Singapore 100 100
StorHub 615 Toa Payoh Pte Ltd Singapore 100 62.0
StorHub 743 Toa Payoh Pte Ltd Singapore 100 62.0
StorHub Group Pte Ltd Singapore 100 62.0
1 StorHub (GZ Jingxi) Co., Ltd The People’s Republic of China
100 62.0
1 StorHub (SH HXL) Co., Ltd The People’s Republic of China
100 62.0
+ Transferred from CapitaLand Residential Limited. See note 38(b)(i).
* Includes 32.7% interest indirectly held through CapitaMalls Asia Limited.^ Transferred from CapitaLand Financial Limited. See note 38(b)(vi).
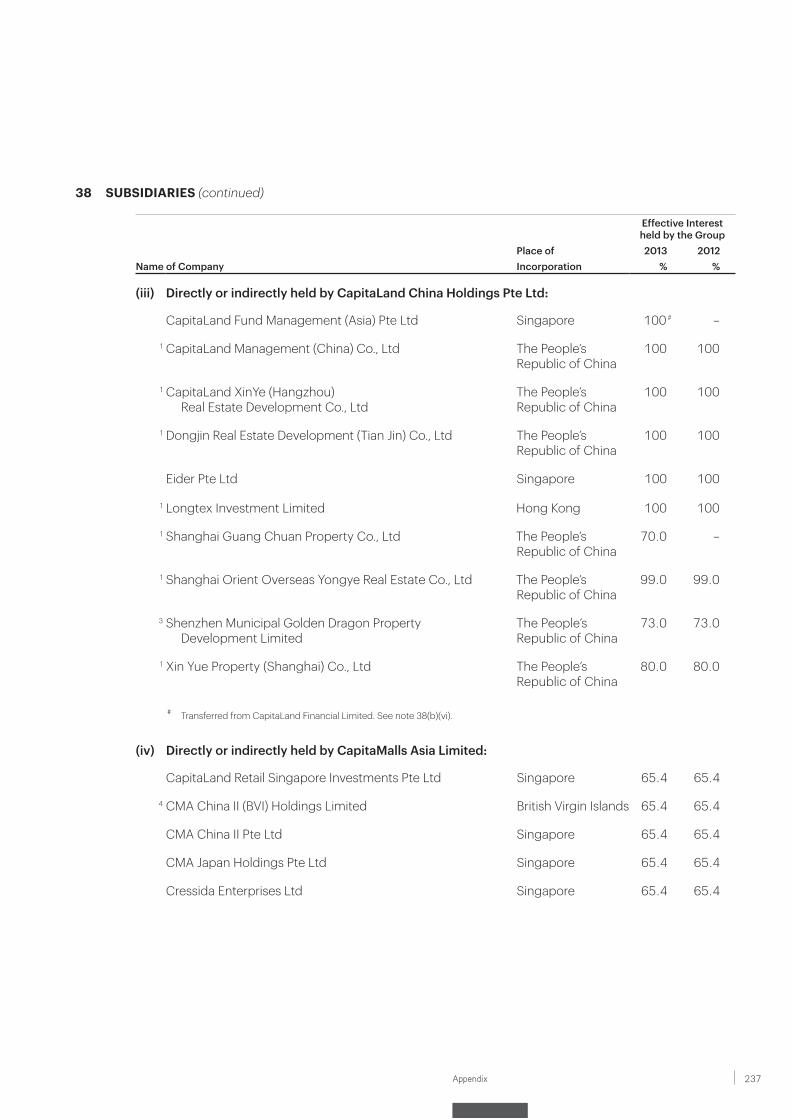
237Appendix
38 SUBSIDIARIES (continued)
Effective Interestheld by the Group
Place of 2013 2012Name of Company Incorporation % %
(iii) Directly or indirectly held by CapitaLand China Holdings Pte Ltd:
CapitaLand Fund Management (Asia) Pte Ltd Singapore 100 # –
1 CapitaLand Management (China) Co., Ltd The People’s Republic of China
100 100
1 CapitaLand XinYe (Hangzhou) Real Estate Development Co., Ltd
The People’s Republic of China
100 100
1 Dongjin Real Estate Development (Tian Jin) Co., Ltd The People’s Republic of China
100 100
Eider Pte Ltd Singapore 100 100
1 Longtex Investment Limited Hong Kong 100 100
1 Shanghai Guang Chuan Property Co., Ltd The People’s Republic of China
70.0 –
1 Shanghai Orient Overseas Yongye Real Estate Co., Ltd The People’s Republic of China
99.0 99.0
3 Shenzhen Municipal Golden Dragon Property Development Limited
The People’s Republic of China
73.0 73.0
1 Xin Yue Property (Shanghai) Co., Ltd The People’s Republic of China
80.0 80.0
# Transferred from CapitaLand Financial Limited. See note 38(b)(vi).
(iv) Directly or indirectly held by CapitaMalls Asia Limited:
CapitaLand Retail Singapore Investments Pte Ltd Singapore 65.4 65.4
4 CMA China II (BVI) Holdings Limited British Virgin Islands 65.4 65.4
CMA China II Pte Ltd Singapore 65.4 65.4
CMA Japan Holdings Pte Ltd Singapore 65.4 65.4
Cressida Enterprises Ltd Singapore 65.4 65.4
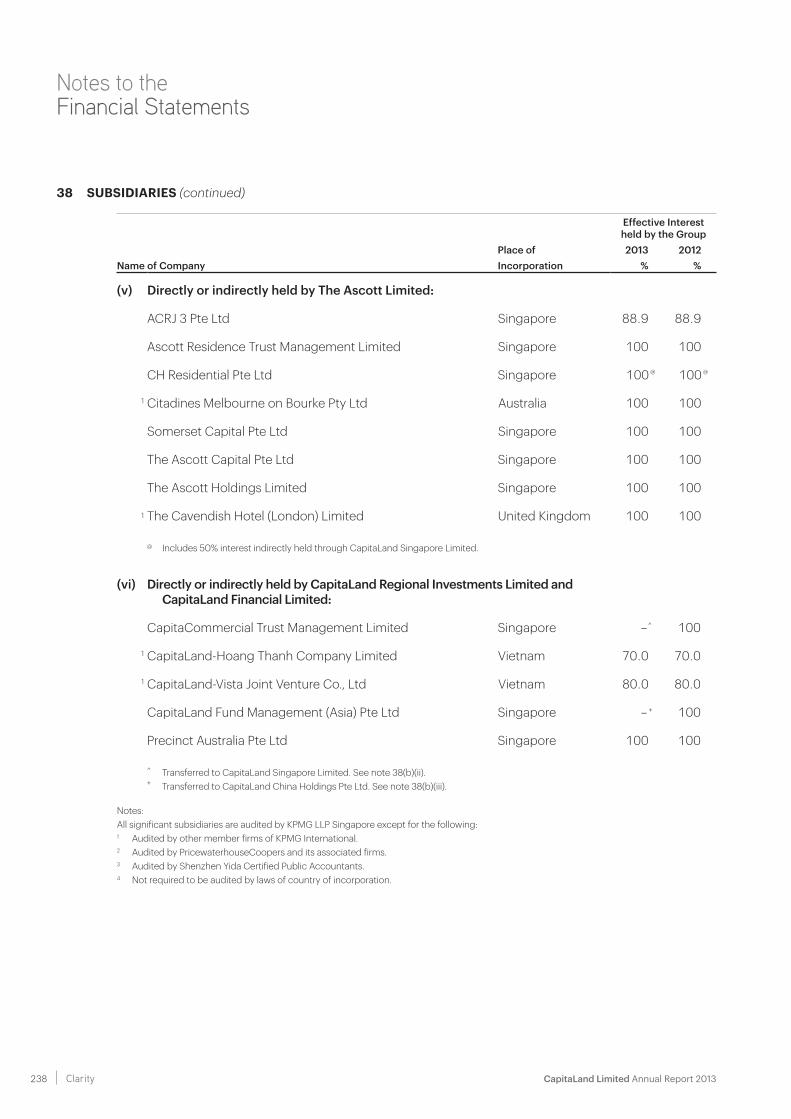
CapitaLand Limited Annual Report 2013 238 Clarity
Notes to the Financial Statements
38 SUBSIDIARIES (continued)
Effective Interestheld by the Group
Place of 2013 2012Name of Company Incorporation % %
(v) Directly or indirectly held by The Ascott Limited:
ACRJ 3 Pte Ltd Singapore 88.9 88.9
Ascott Residence Trust Management Limited Singapore 100 100
CH Residential Pte Ltd Singapore 100 @ 100 @
1 Citadines Melbourne on Bourke Pty Ltd Australia 100 100
Somerset Capital Pte Ltd Singapore 100 100
The Ascott Capital Pte Ltd Singapore 100 100
The Ascott Holdings Limited Singapore 100 100
1 The Cavendish Hotel (London) Limited United Kingdom 100 100
@ Includes 50% interest indirectly held through CapitaLand Singapore Limited.
(vi) Directly or indirectly held by CapitaLand Regional Investments Limited and CapitaLand Financial Limited:
CapitaCommercial Trust Management Limited Singapore – ^ 100
1 CapitaLand-Hoang Thanh Company Limited Vietnam 70.0 70.0
1 CapitaLand-Vista Joint Venture Co., Ltd Vietnam 80.0 80.0
CapitaLand Fund Management (Asia) Pte Ltd Singapore – + 100
Precinct Australia Pte Ltd Singapore 100 100
^ Transferred to CapitaLand Singapore Limited. See note 38(b)(ii).+ Transferred to CapitaLand China Holdings Pte Ltd. See note 38(b)(iii).
Notes:All significant subsidiaries are audited by KPMG LLP Singapore except for the following:1 Audited by other member firms of KPMG International.2 Audited by PricewaterhouseCoopers and its associated firms.3 Audited by Shenzhen Yida Certified Public Accountants.4 Not required to be audited by laws of country of incorporation.
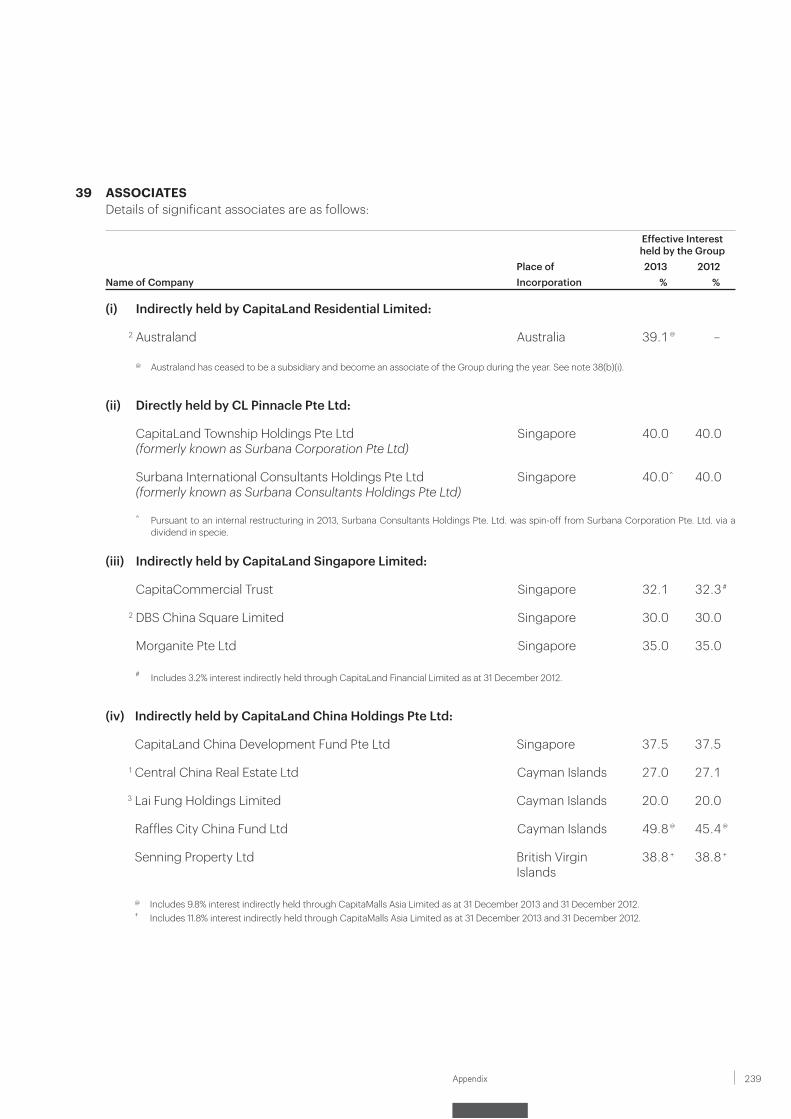
239Appendix
39 ASSOCIATESDetails of significant associates are as follows:
Effective Interestheld by the Group
Place of 2013 2012Name of Company Incorporation % %
(i) Indirectly held by CapitaLand Residential Limited:
2 Australand Australia 39.1 @ –
@ Australand has ceased to be a subsidiary and become an associate of the Group during the year. See note 38(b)(i).
(ii) Directly held by CL Pinnacle Pte Ltd:
CapitaLand Township Holdings Pte Ltd(formerly known as Surbana Corporation Pte Ltd)
Singapore 40.0 40.0
Surbana International Consultants Holdings Pte Ltd (formerly known as Surbana Consultants Holdings Pte Ltd)
Singapore 40.0 ^ 40.0
^ Pursuant to an internal restructuring in 2013, Surbana Consultants Holdings Pte. Ltd. was spin-off from Surbana Corporation Pte. Ltd. via a dividend in specie.
(iii) Indirectly held by CapitaLand Singapore Limited:
CapitaCommercial Trust Singapore 32.1 32.3 #
2 DBS China Square Limited Singapore 30.0 30.0
Morganite Pte Ltd Singapore 35.0 35.0
# Includes 3.2% interest indirectly held through CapitaLand Financial Limited as at 31 December 2012.
(iv) Indirectly held by CapitaLand China Holdings Pte Ltd:
CapitaLand China Development Fund Pte Ltd Singapore 37.5 37.5
1 Central China Real Estate Ltd Cayman Islands 27.0 27.1
3 Lai Fung Holdings Limited Cayman Islands 20.0 20.0
Raffles City China Fund Ltd Cayman Islands 49.8 @ 45.4 @
Senning Property Ltd British Virgin Islands
38.8 + 38.8 +
@ Includes 9.8% interest indirectly held through CapitaMalls Asia Limited as at 31 December 2013 and 31 December 2012.+ Includes 11.8% interest indirectly held through CapitaMalls Asia Limited as at 31 December 2013 and 31 December 2012.
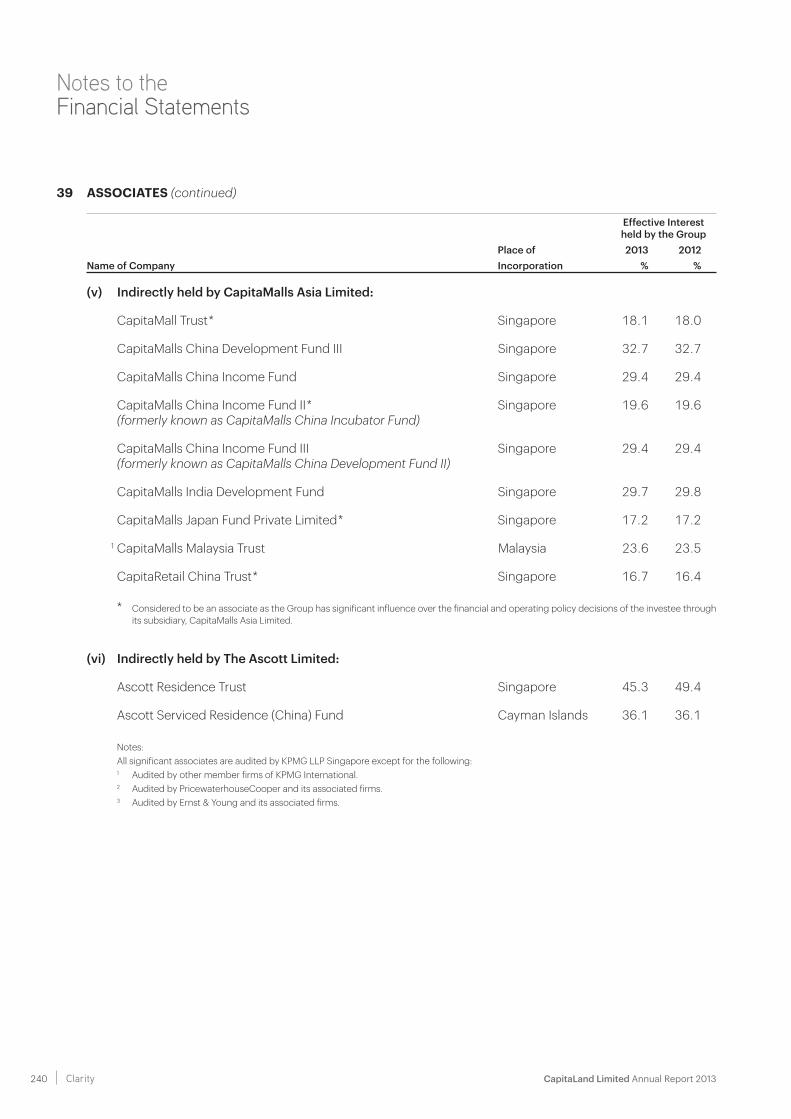
CapitaLand Limited Annual Report 2013 240 Clarity
Notes to the Financial Statements
39 ASSOCIATES (continued)
Effective Interestheld by the Group
Place of 2013 2012Name of Company Incorporation % %
(v) Indirectly held by CapitaMalls Asia Limited:
CapitaMall Trust * Singapore 18.1 18.0
CapitaMalls China Development Fund III Singapore 32.7 32.7
CapitaMalls China Income Fund Singapore 29.4 29.4
CapitaMalls China Income Fund II *(formerly known as CapitaMalls China Incubator Fund)
Singapore 19.6 19.6
CapitaMalls China Income Fund III(formerly known as CapitaMalls China Development Fund II)
Singapore 29.4 29.4
CapitaMalls India Development Fund Singapore 29.7 29.8
CapitaMalls Japan Fund Private Limited * Singapore 17.2 17.2
1 CapitaMalls Malaysia Trust Malaysia 23.6 23.5
CapitaRetail China Trust * Singapore 16.7 16.4
* Considered to be an associate as the Group has significant influence over the financial and operating policy decisions of the investee through its subsidiary, CapitaMalls Asia Limited.
(vi) Indirectly held by The Ascott Limited:
Ascott Residence Trust Singapore 45.3 49.4
Ascott Serviced Residence (China) Fund Cayman Islands 36.1 36.1
Notes:All significant associates are audited by KPMG LLP Singapore except for the following:1 Audited by other member firms of KPMG International.2 Audited by PricewaterhouseCooper and its associated firms.3 Audited by Ernst & Young and its associated firms.
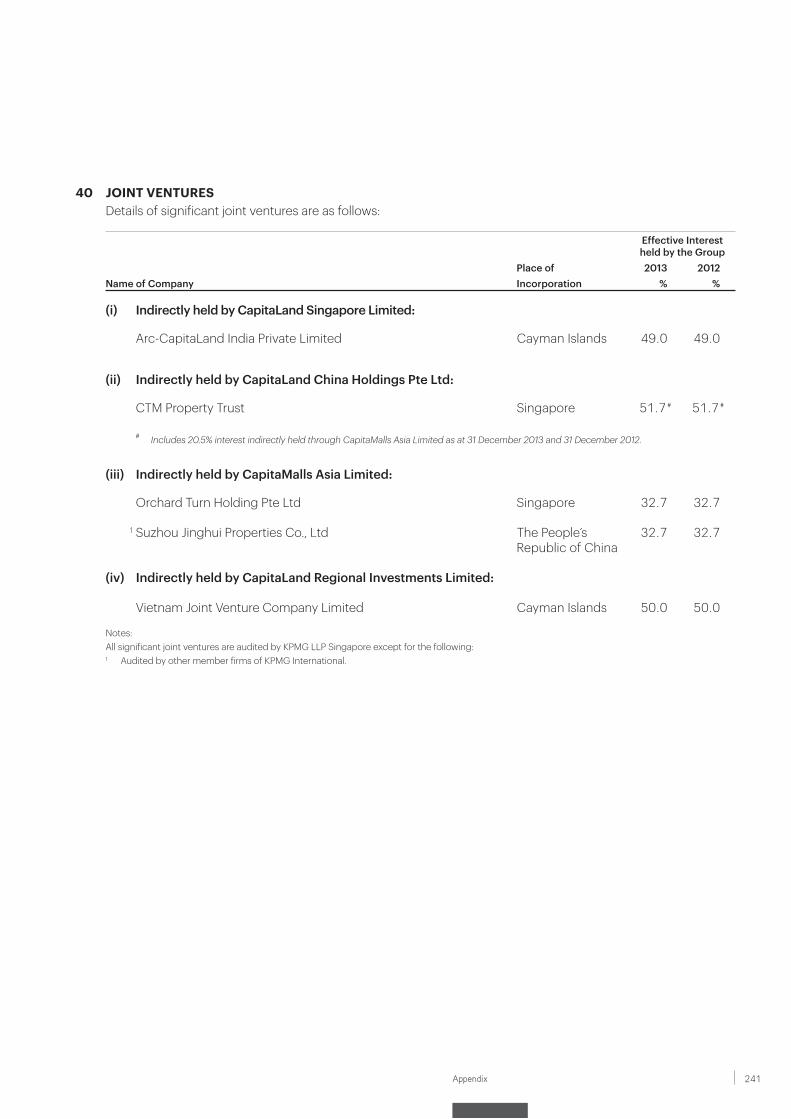
241Appendix
40 JOINT VENTURES Details of significant joint ventures are as follows:
Effective Interestheld by the Group
Place of 2013 2012Name of Company Incorporation % %
(i) Indirectly held by CapitaLand Singapore Limited:
Arc-CapitaLand India Private Limited Cayman Islands 49.0 49.0
(ii) Indirectly held by CapitaLand China Holdings Pte Ltd:
CTM Property Trust Singapore 51.7 # 51.7 #
# Includes 20.5% interest indirectly held through CapitaMalls Asia Limited as at 31 December 2013 and 31 December 2012.
(iii) Indirectly held by CapitaMalls Asia Limited:
Orchard Turn Holding Pte Ltd Singapore 32.7 32.7
1 Suzhou Jinghui Properties Co., Ltd The People’s Republic of China
32.7 32.7
(iv) Indirectly held by CapitaLand Regional Investments Limited:
Vietnam Joint Venture Company Limited Cayman Islands 50.0 50.0
Notes:All significant joint ventures are audited by KPMG LLP Singapore except for the following:1 Audited by other member firms of KPMG International.
CapitaLand Limited Annual Report 2013 242 Clarity
Notes to the Financial Statements
41 OPERATING SEGMENTS Management determines the operating segments based on the reports reviewed and used by the Executive
Management Council for strategic decisions making and resources allocation. For management purposes, the Group is organised into strategic business units based on their products, services and geography.
With effect from 3 January 2013, CapitaLand realigned and simplified its Group’s organisational structure to sharpen its focus on key markets and further accelerate its growth potential.
The Group was realigned into four main businesses – CapitaLand Singapore, CapitaLand China, CapitaMalls Asia (CMA) and The Ascott Limited (Ascott). Under the simplified organisational structure, the Group’s businesses in Singapore and China excluding that of CMA and Ascott, were consolidated into CapitaLand Singapore and CapitaLand China respectively. CMA and Ascott were the other two main business units and they operate across geographies that CapitaLand is in. The segmental information in this report has been prepared based on the new organisational structure and the comparative information has been restated.
The Group’s reportable operating segments are as follows:
(i) CapitaLand Singapore – owner/manager of commercial and industrial properties and develops residential properties in Singapore and Malaysia for sale.
(ii) CapitaLand China – involves in the residential, commercial and integrated property development in China.
(iii) CapitaMalls Asia – shopping mall owner/manager with portfolio in Singapore, China, India, Japan and Malaysia.
(iv) Ascott – an international serviced residence owner-operator with operations in key cities of Asia Pacific, Europe and the Gulf region. It operates three brands, namely Ascott, Somerset and Citadines.
(v) Australand – a major diversified property group with activities in residential, commercial and industrial developments and investment properties across Australia. During the year, Australand has ceased to be a subsidiary and become an associate of the Group.
(vi) Others – includes Corporate Office, Group Treasury, Surbana (Consultancy), StorHub, Financial Services, other businesses in Vietnam, Japan and Gulf Cooperation Council countries.
Information regarding the operations of each reportable segment is included below. Management monitors the operating results of each of its business units for the purpose of making decisions on resource allocation and performance assessment. Performance is measured based on segment earnings before interest and tax (EBIT). EBIT is used to measure performance as management believes that such information is the most relevant in evaluating the results of certain segments relative to other entities that operate within these industries. Group financing (including finance costs) and income taxes are managed on a group basis and are not allocated to operating segments. Segment assets and liabilities are presented net of inter-segment balances. Inter-segment pricing is determined on arm’s length basis.
Geographically, management reviews the performance of the businesses in Singapore, China, Other Asia, Australia and Europe. In presenting information on the basis of geographical segments, segment revenue is based on the geographical location of customers. Non-current assets and total assets are based on the geographical location of the assets.
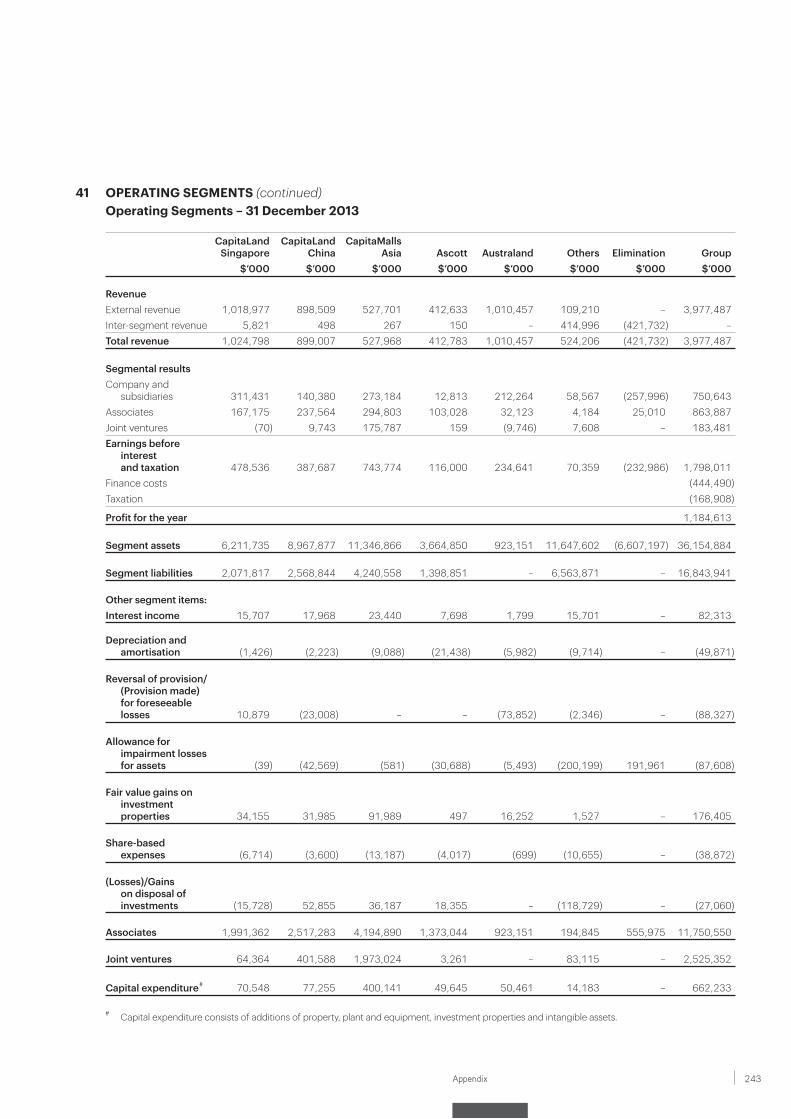
243Appendix
41 OPERATING SEGMENTS (continued)Operating Segments – 31 December 2013
CapitaLand Singapore
CapitaLand China
CapitaMalls Asia Ascott Australand Others Elimination Group
$’000 $’000 $’000 $’000 $’000 $’000 $’000 $’000
RevenueExternal revenue 1,018,977 898,509 527,701 412,633 1,010,457 109,210 – 3,977,487Inter-segment revenue 5,821 498 267 150 – 414,996 (421,732) –Total revenue 1,024,798 899,007 527,968 412,783 1,010,457 524,206 (421,732) 3,977,487
Segmental resultsCompany and
subsidiaries 311,431 140,380 273,184 12,813 212,264 58,567 (257,996) 750,643Associates 167,175 237,564 294,803 103,028 32,123 4,184 25,010 863,887Joint ventures (70) 9,743 175,787 159 (9,746) 7,608 – 183,481Earnings before
interestand taxation 478,536 387,687 743,774 116,000 234,641 70,359 (232,986) 1,798,011
Finance costs (444,490)Taxation (168,908)
Profit for the year 1,184,613
Segment assets 6,211,735 8,967,877 11,346,866 3,664,850 923,151 11,647,602 (6,607,197) 36,154,884
Segment liabilities 2,071,817 2,568,844 4,240,558 1,398,851 – 6,563,871 – 16,843,941
Other segment items:Interest income 15,707 17,968 23,440 7,698 1,799 15,701 – 82,313
Depreciation and amortisation (1,426) (2,223) (9,088) (21,438) (5,982) (9,714) – (49,871)
Reversal of provision/(Provision made) for foreseeable losses 10,879 (23,008) – – (73,852) (2,346) – (88,327)
Allowance for impairment losses for assets (39) (42,569) (581) (30,688) (5,493) (200,199) 191,961 (87,608)
Fair value gains on investment properties 34,155 31,985 91,989 497 16,252 1,527 – 176,405
Share-based expenses (6,714) (3,600) (13,187) (4,017) (699) (10,655) – (38,872)
(Losses)/Gains on disposal of investments (15,728) 52,855 36,187 18,355 – (118,729) – (27,060)
Associates 1,991,362 2,517,283 4,194,890 1,373,044 923,151 194,845 555,975 11,750,550
Joint ventures 64,364 401,588 1,973,024 3,261 – 83,115 – 2,525,352
Capital expenditure # 70,548 77,255 400,141 49,645 50,461 14,183 – 662,233
# Capital expenditure consists of additions of property, plant and equipment, investment properties and intangible assets.
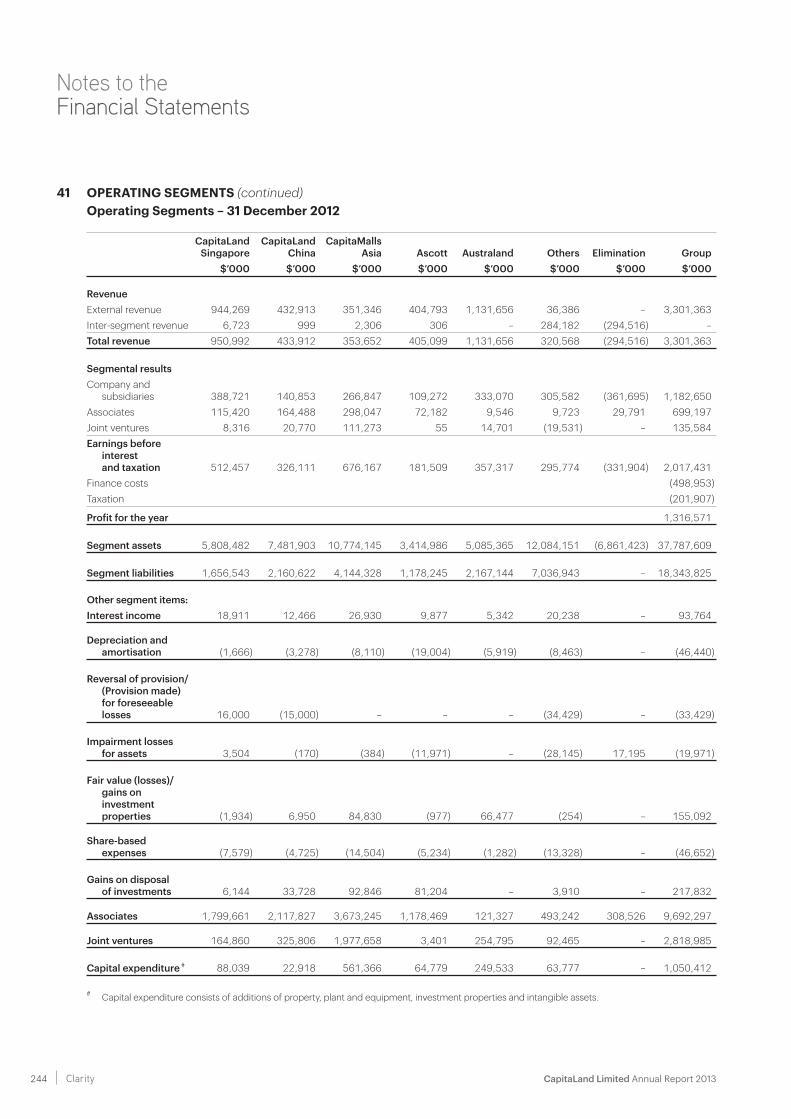
CapitaLand Limited Annual Report 2013 244 Clarity
Notes to the Financial Statements
41 OPERATING SEGMENTS (continued)Operating Segments – 31 December 2012
CapitaLand Singapore
CapitaLand China
CapitaMalls Asia Ascott Australand Others Elimination Group
$’000 $’000 $’000 $’000 $’000 $’000 $’000 $’000
RevenueExternal revenue 944,269 432,913 351,346 404,793 1,131,656 36,386 – 3,301,363Inter-segment revenue 6,723 999 2,306 306 – 284,182 (294,516) –Total revenue 950,992 433,912 353,652 405,099 1,131,656 320,568 (294,516) 3,301,363
Segmental resultsCompany and
subsidiaries 388,721 140,853 266,847 109,272 333,070 305,582 (361,695) 1,182,650Associates 115,420 164,488 298,047 72,182 9,546 9,723 29,791 699,197Joint ventures 8,316 20,770 111,273 55 14,701 (19,531) – 135,584Earnings before
interestand taxation 512,457 326,111 676,167 181,509 357,317 295,774 (331,904) 2,017,431
Finance costs (498,953)Taxation (201,907)
Profit for the year 1,316,571
Segment assets 5,808,482 7,481,903 10,774,145 3,414,986 5,085,365 12,084,151 (6,861,423) 37,787,609
Segment liabilities 1,656,543 2,160,622 4,144,328 1,178,245 2,167,144 7,036,943 – 18,343,825
Other segment items:Interest income 18,911 12,466 26,930 9,877 5,342 20,238 – 93,764
Depreciation and amortisation (1,666) (3,278) (8,110) (19,004) (5,919) (8,463) – (46,440)
Reversal of provision/(Provision made) for foreseeable losses 16,000 (15,000) – – – (34,429) – (33,429)
Impairment losses for assets 3,504 (170) (384) (11,971) – (28,145) 17,195 (19,971)
Fair value (losses)/ gains on investment properties (1,934) 6,950 84,830 (977) 66,477 (254) – 155,092
Share-based expenses (7,579) (4,725) (14,504) (5,234) (1,282) (13,328) – (46,652)
Gains on disposal of investments 6,144 33,728 92,846 81,204 – 3,910 – 217,832
Associates 1,799,661 2,117,827 3,673,245 1,178,469 121,327 493,242 308,526 9,692,297
Joint ventures 164,860 325,806 1,977,658 3,401 254,795 92,465 – 2,818,985
Capital expenditure # 88,039 22,918 561,366 64,779 249,533 63,777 – 1,050,412
# Capital expenditure consists of additions of property, plant and equipment, investment properties and intangible assets.
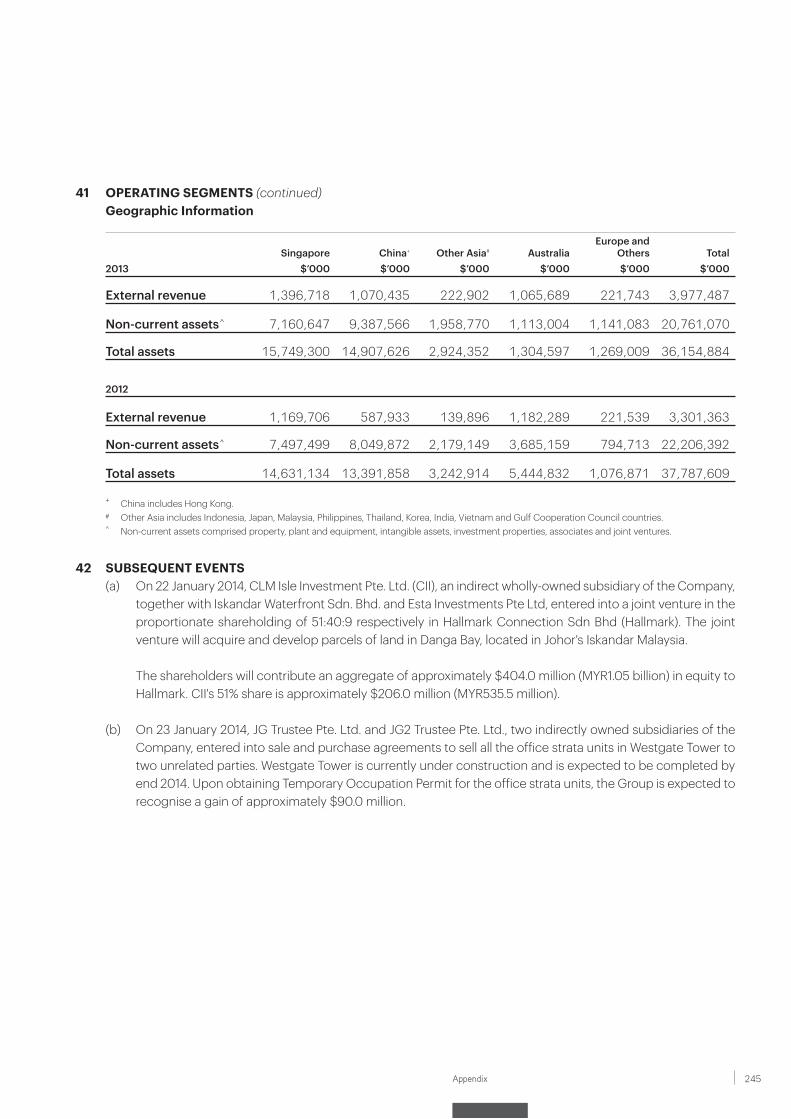
245Appendix
41 OPERATING SEGMENTS (continued)Geographic Information
Singapore China+ Other Asia# AustraliaEurope and
Others Total2013 $’000 $’000 $’000 $’000 $’000 $’000
External revenue 1,396,718 1,070,435 222,902 1,065,689 221,743 3,977,487
Non-current assets ^ 7,160,647 9,387,566 1,958,770 1,113,004 1,141,083 20,761,070
Total assets 15,749,300 14,907,626 2,924,352 1,304,597 1,269,009 36,154,884
2012
External revenue 1,169,706 587,933 139,896 1,182,289 221,539 3,301,363
Non-current assets ^ 7,497,499 8,049,872 2,179,149 3,685,159 794,713 22,206,392
Total assets 14,631,134 13,391,858 3,242,914 5,444,832 1,076,871 37,787,609
+ China includes Hong Kong. # Other Asia includes Indonesia, Japan, Malaysia, Philippines, Thailand, Korea, India, Vietnam and Gulf Cooperation Council countries. ^ Non-current assets comprised property, plant and equipment, intangible assets, investment properties, associates and joint ventures.
42 SUBSEQUENT EVENTS(a) On 22 January 2014, CLM Isle Investment Pte. Ltd. (CII), an indirect wholly-owned subsidiary of the Company,
together with Iskandar Waterfront Sdn. Bhd. and Esta Investments Pte Ltd, entered into a joint venture in the proportionate shareholding of 51:40:9 respectively in Hallmark Connection Sdn Bhd (Hallmark). The joint venture will acquire and develop parcels of land in Danga Bay, located in Johor's Iskandar Malaysia.
The shareholders will contribute an aggregate of approximately $404.0 million (MYR1.05 billion) in equity to
Hallmark. CII's 51% share is approximately $206.0 million (MYR535.5 million).
(b) On 23 January 2014, JG Trustee Pte. Ltd. and JG2 Trustee Pte. Ltd., two indirectly owned subsidiaries of the Company, entered into sale and purchase agreements to sell all the office strata units in Westgate Tower to two unrelated parties. Westgate Tower is currently under construction and is expected to be completed by end 2014. Upon obtaining Temporary Occupation Permit for the office strata units, the Group is expected to recognise a gain of approximately $90.0 million.
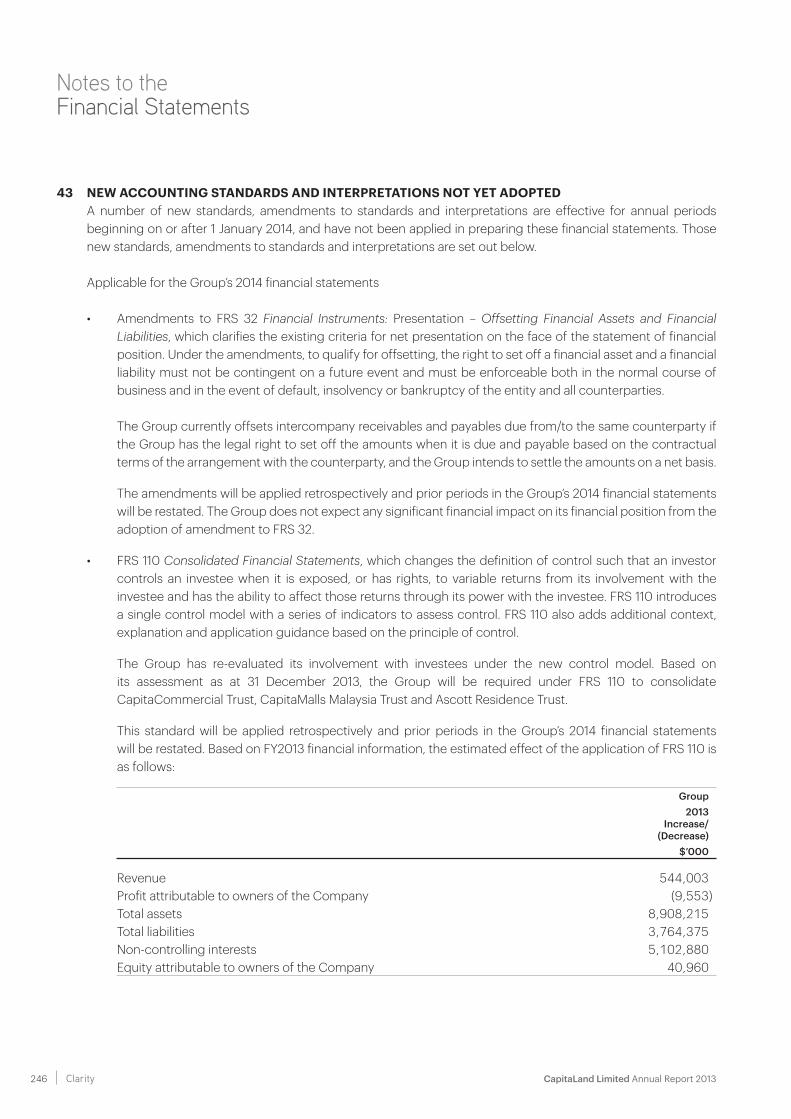
CapitaLand Limited Annual Report 2013 246 Clarity
Notes to the Financial Statements
43 NEW ACCOUNTING STANDARDS AND INTERPRETATIONS NOT YET ADOPTED A number of new standards, amendments to standards and interpretations are effective for annual periods
beginning on or after 1 January 2014, and have not been applied in preparing these financial statements. Those new standards, amendments to standards and interpretations are set out below.
Applicable for the Group’s 2014 financial statements
• Amendments to FRS 32 Financial Instruments: Presentation – Offsetting Financial Assets and Financial Liabilities, which clarifies the existing criteria for net presentation on the face of the statement of financial position. Under the amendments, to qualify for offsetting, the right to set off a financial asset and a financial liability must not be contingent on a future event and must be enforceable both in the normal course of business and in the event of default, insolvency or bankruptcy of the entity and all counterparties.
The Group currently offsets intercompany receivables and payables due from/to the same counterparty if the Group has the legal right to set off the amounts when it is due and payable based on the contractual terms of the arrangement with the counterparty, and the Group intends to settle the amounts on a net basis.
The amendments will be applied retrospectively and prior periods in the Group’s 2014 financial statements will be restated. The Group does not expect any significant financial impact on its financial position from the adoption of amendment to FRS 32.
• FRS 110 Consolidated Financial Statements, which changes the definition of control such that an investor controls an investee when it is exposed, or has rights, to variable returns from its involvement with the investee and has the ability to affect those returns through its power with the investee. FRS 110 introduces a single control model with a series of indicators to assess control. FRS 110 also adds additional context, explanation and application guidance based on the principle of control.
The Group has re-evaluated its involvement with investees under the new control model. Based on its assessment as at 31 December 2013, the Group will be required under FRS 110 to consolidate CapitaCommercial Trust, CapitaMalls Malaysia Trust and Ascott Residence Trust.
This standard will be applied retrospectively and prior periods in the Group’s 2014 financial statements will be restated. Based on FY2013 financial information, the estimated effect of the application of FRS 110 is as follows:
Group2013
Increase/(Decrease)
$’000
Revenue 544,003Profit attributable to owners of the Company (9,553)Total assets 8,908,215Total liabilities 3,764,375Non-controlling interests 5,102,880Equity attributable to owners of the Company 40,960
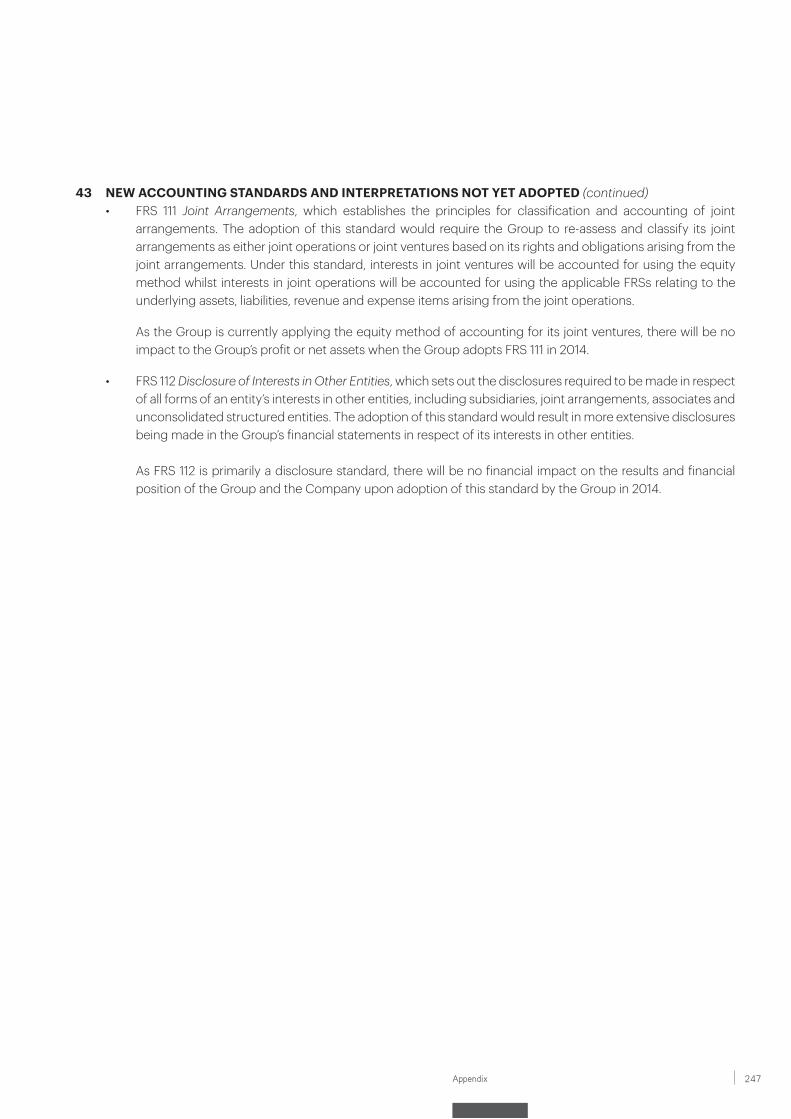
247Appendix
43 NEW ACCOUNTING STANDARDS AND INTERPRETATIONS NOT YET ADOPTED (continued)• FRS 111 Joint Arrangements, which establishes the principles for classification and accounting of joint
arrangements. The adoption of this standard would require the Group to re-assess and classify its joint arrangements as either joint operations or joint ventures based on its rights and obligations arising from the joint arrangements. Under this standard, interests in joint ventures will be accounted for using the equity method whilst interests in joint operations will be accounted for using the applicable FRSs relating to the underlying assets, liabilities, revenue and expense items arising from the joint operations.
As the Group is currently applying the equity method of accounting for its joint ventures, there will be no impact to the Group’s profit or net assets when the Group adopts FRS 111 in 2014.
• FRS 112 Disclosure of Interests in Other Entities, which sets out the disclosures required to be made in respect of all forms of an entity’s interests in other entities, including subsidiaries, joint arrangements, associates and unconsolidated structured entities. The adoption of this standard would result in more extensive disclosures being made in the Group’s financial statements in respect of its interests in other entities.
As FRS 112 is primarily a disclosure standard, there will be no financial impact on the results and financial position of the Group and the Company upon adoption of this standard by the Group in 2014.
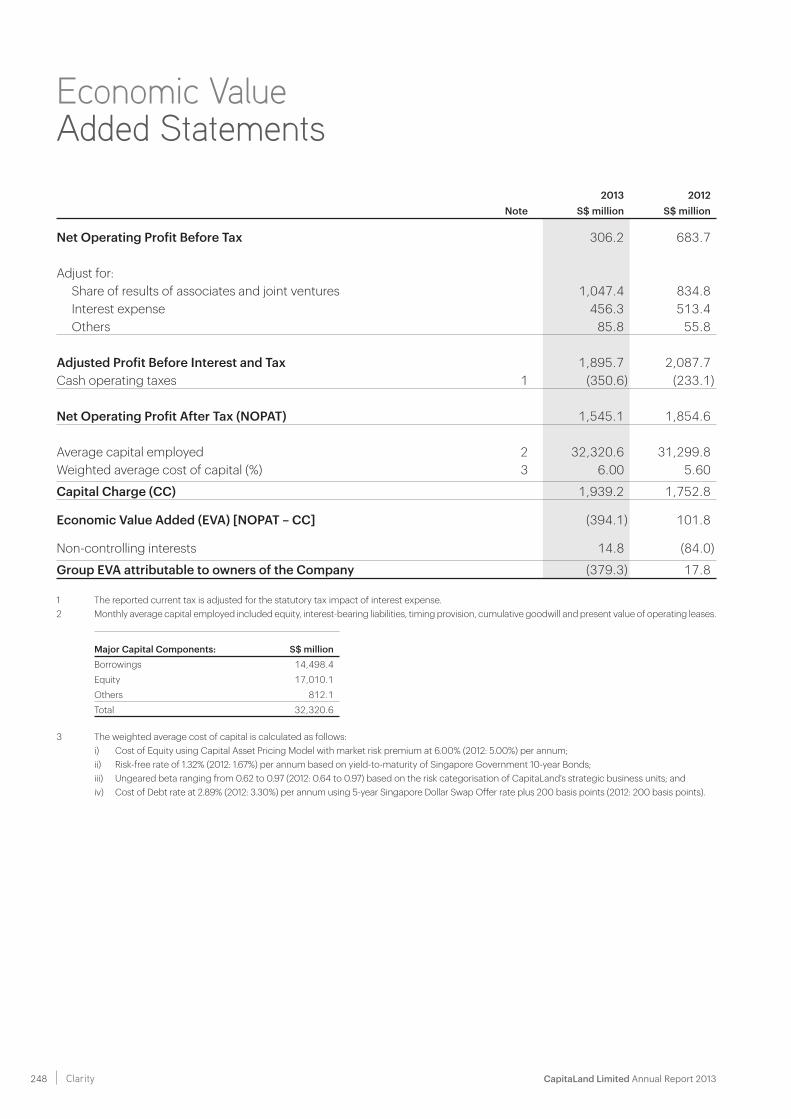
CapitaLand Limited Annual Report 2013 248 Clarity
Economic Value Added Statements
2013 2012Note S$ million S$ million
Net Operating Profit Before Tax 306.2 683.7
Adjust for: Share of results of associates and joint ventures 1,047.4 834.8 Interest expense 456.3 513.4 Others 85.8 55.8
Adjusted Profit Before Interest and Tax 1,895.7 2,087.7 Cash operating taxes 1 (350.6) (233.1)
Net Operating Profit After Tax (NOPAT) 1,545.1 1,854.6
Average capital employed 2 32,320.6 31,299.8 Weighted average cost of capital (%) 3 6.00 5.60
Capital Charge (CC) 1,939.2 1,752.8
Economic Value Added (EVA) [NOPAT – CC] (394.1) 101.8
Non-controlling interests 14.8 (84.0)
Group EVA attributable to owners of the Company (379.3) 17.8
1 The reported current tax is adjusted for the statutory tax impact of interest expense.2 Monthly average capital employed included equity, interest-bearing liabilities, timing provision, cumulative goodwill and present value of operating leases.
Major Capital Components: S$ millionBorrowings 14,498.4 Equity 17,010.1 Others 812.1 Total 32,320.6
3 The weighted average cost of capital is calculated as follows: i) Cost of Equity using Capital Asset Pricing Model with market risk premium at 6.00% (2012: 5.00%) per annum; ii) Risk-free rate of 1.32% (2012: 1.67%) per annum based on yield-to-maturity of Singapore Government 10-year Bonds; iii) Ungeared beta ranging from 0.62 to 0.97 (2012: 0.64 to 0.97) based on the risk categorisation of CapitaLand's strategic business units; and iv) Cost of Debt rate at 2.89% (2012: 3.30%) per annum using 5-year Singapore Dollar Swap Offer rate plus 200 basis points (2012: 200 basis points).
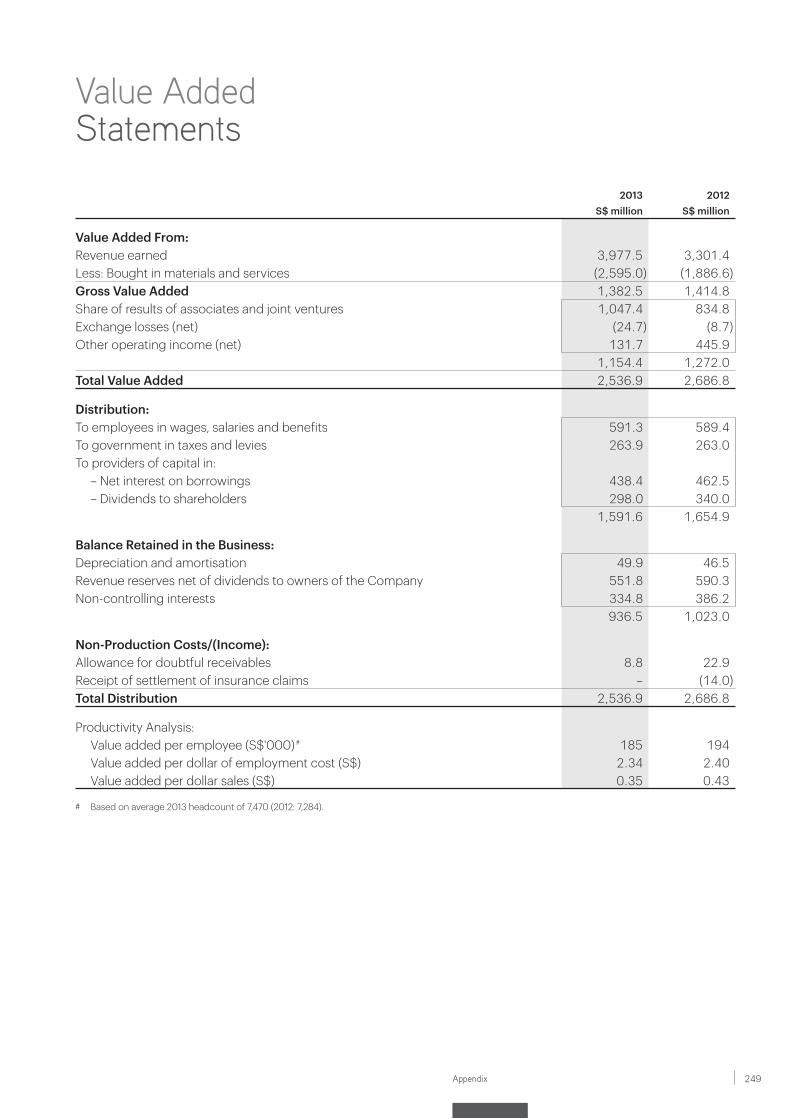
249Appendix
Value AddedStatements
2013 2012S$ million S$ million
Value Added From:Revenue earned 3,977.5 3,301.4Less: Bought in materials and services (2,595.0) (1,886.6)Gross Value Added 1,382.5 1,414.8Share of results of associates and joint ventures 1,047.4 834.8Exchange losses (net) (24.7) (8.7)Other operating income (net) 131.7 445.9
1,154.4 1,272.0Total Value Added 2,536.9 2,686.8
Distribution:To employees in wages, salaries and benefits 591.3 589.4To government in taxes and levies 263.9 263.0To providers of capital in: – Net interest on borrowings 438.4 462.5 – Dividends to shareholders 298.0 340.0
1,591.6 1,654.9
Balance Retained in the Business:Depreciation and amortisation 49.9 46.5Revenue reserves net of dividends to owners of the Company 551.8 590.3Non-controlling interests 334.8 386.2
936.5 1,023.0
Non-Production Costs/(Income):Allowance for doubtful receivables 8.8 22.9Receipt of settlement of insurance claims – (14.0)Total Distribution 2,536.9 2,686.8
Productivity Analysis: Value added per employee (S$'000) # 185 194 Value added per dollar of employment cost (S$) 2.34 2.40 Value added per dollar sales (S$) 0.35 0.43
# Based on average 2013 headcount of 7,470 (2012: 7,284).
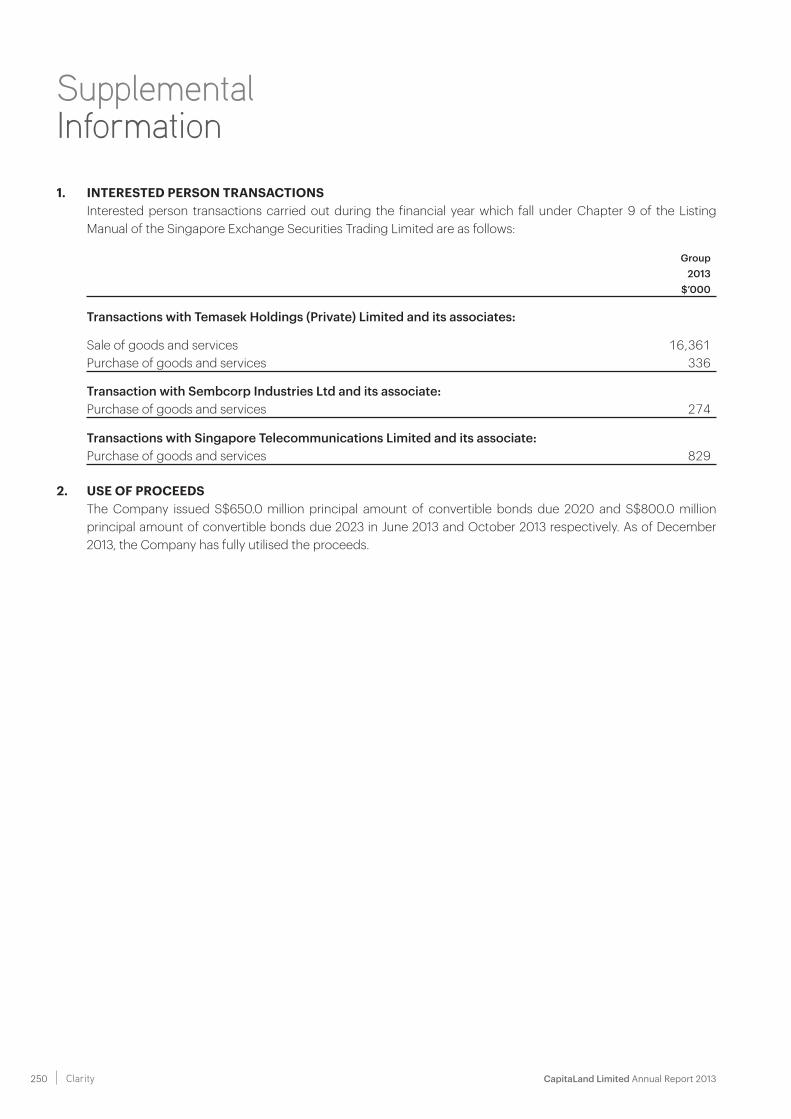
CapitaLand Limited Annual Report 2013 250 Clarity
Supplemental Information
1. INTERESTED PERSON TRANSACTIONS Interested person transactions carried out during the financial year which fall under Chapter 9 of the Listing
Manual of the Singapore Exchange Securities Trading Limited are as follows:
Group2013
$’000
Transactions with Temasek Holdings (Private) Limited and its associates:
Sale of goods and services 16,361Purchase of goods and services 336
Transaction with Sembcorp Industries Ltd and its associate:Purchase of goods and services 274
Transactions with Singapore Telecommunications Limited and its associate:Purchase of goods and services 829
2. USE OF PROCEEDS The Company issued S$650.0 million principal amount of convertible bonds due 2020 and S$800.0 million
principal amount of convertible bonds due 2023 in June 2013 and October 2013 respectively. As of December 2013, the Company has fully utilised the proceeds.
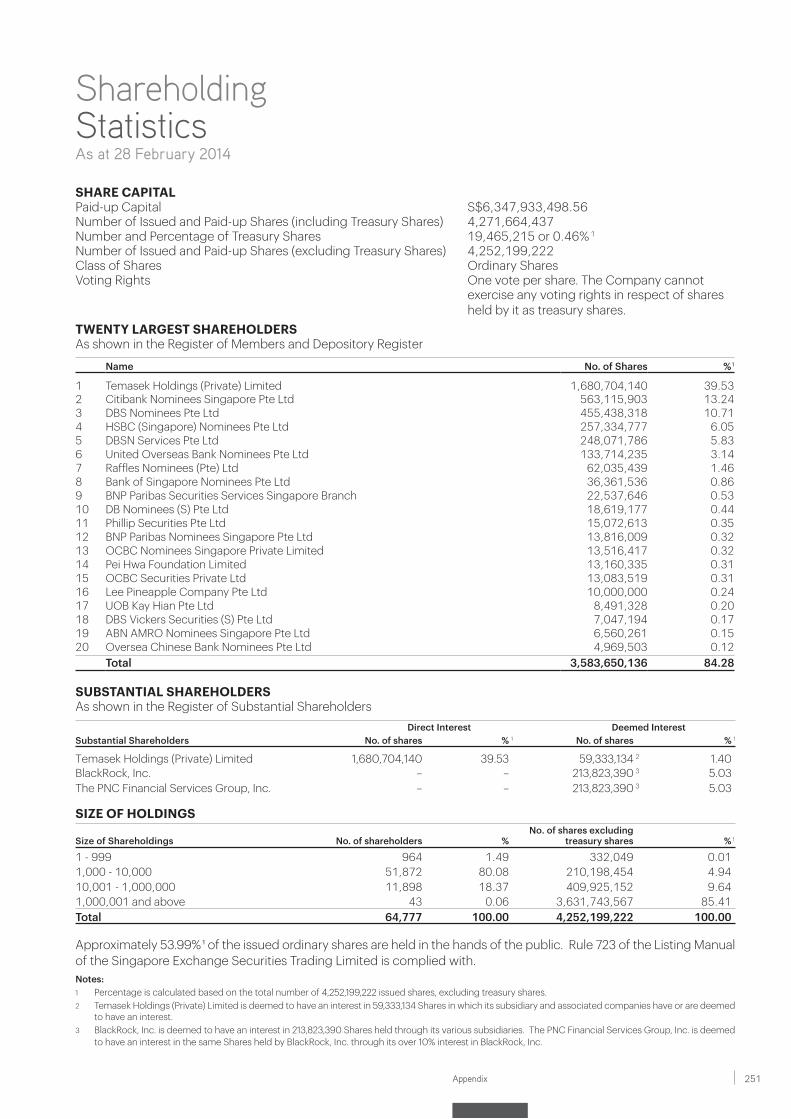
251Appendix
Shareholding StatisticsAs at 28 February 2014
SHARE CAPITALPaid-up Capital S$6,347,933,498.56Number of Issued and Paid-up Shares (including Treasury Shares) 4,271,664,437Number and Percentage of Treasury Shares 19,465,215 or 0.46% 1Number of Issued and Paid-up Shares (excluding Treasury Shares) 4,252,199,222Class of Shares Ordinary SharesVoting Rights One vote per share. The Company cannot
exercise any voting rights in respect of shares held by it as treasury shares.
TWENTY LARGEST SHAREHOLDERSAs shown in the Register of Members and Depository Register
Name No. of Shares % 1
1 Temasek Holdings (Private) Limited 1,680,704,140 39.532 Citibank Nominees Singapore Pte Ltd 563,115,903 13.243 DBS Nominees Pte Ltd 455,438,318 10.714 HSBC (Singapore) Nominees Pte Ltd 257,334,777 6.055 DBSN Services Pte Ltd 248,071,786 5.836 United Overseas Bank Nominees Pte Ltd 133,714,235 3.147 Raffles Nominees (Pte) Ltd 62,035,439 1.468 Bank of Singapore Nominees Pte Ltd 36,361,536 0.869 BNP Paribas Securities Services Singapore Branch 22,537,646 0.5310 DB Nominees (S) Pte Ltd 18,619,177 0.4411 Phillip Securities Pte Ltd 15,072,613 0.3512 BNP Paribas Nominees Singapore Pte Ltd 13,816,009 0.3213 OCBC Nominees Singapore Private Limited 13,516,417 0.3214 Pei Hwa Foundation Limited 13,160,335 0.3115 OCBC Securities Private Ltd 13,083,519 0.3116 Lee Pineapple Company Pte Ltd 10,000,000 0.2417 UOB Kay Hian Pte Ltd 8,491,328 0.2018 DBS Vickers Securities (S) Pte Ltd 7,047,194 0.1719 ABN AMRO Nominees Singapore Pte Ltd 6,560,261 0.1520 Oversea Chinese Bank Nominees Pte Ltd 4,969,503 0.12
Total 3,583,650,136 84.28
SUBSTANTIAL SHAREHOLDERSAs shown in the Register of Substantial Shareholders
Direct Interest Deemed InterestSubstantial Shareholders No. of shares % 1 No. of shares % 1
Temasek Holdings (Private) Limited 1,680,704,140 39.53 59,333,134 2 1.40BlackRock, Inc. – – 213,823,390 3 5.03The PNC Financial Services Group, Inc. – – 213,823,390 3 5.03
SIZE OF HOLDINGS
Size of Shareholdings No. of shareholders %No. of shares excluding
treasury shares % 1
1 - 999 964 1.49 332,049 0.011,000 - 10,000 51,872 80.08 210,198,454 4.9410,001 - 1,000,000 11,898 18.37 409,925,152 9.641,000,001 and above 43 0.06 3,631,743,567 85.41Total 64,777 100.00 4,252,199,222 100.00
Approximately 53.99% ¹ of the issued ordinary shares are held in the hands of the public. Rule 723 of the Listing Manual of the Singapore Exchange Securities Trading Limited is complied with. Notes:1 Percentage is calculated based on the total number of 4,252,199,222 issued shares, excluding treasury shares. 2 Temasek Holdings (Private) Limited is deemed to have an interest in 59,333,134 Shares in which its subsidiary and associated companies have or are deemed
to have an interest. 3 BlackRock, Inc. is deemed to have an interest in 213,823,390 Shares held through its various subsidiaries. The PNC Financial Services Group, Inc. is deemed
to have an interest in the same Shares held by BlackRock, Inc. through its over 10% interest in BlackRock, Inc.
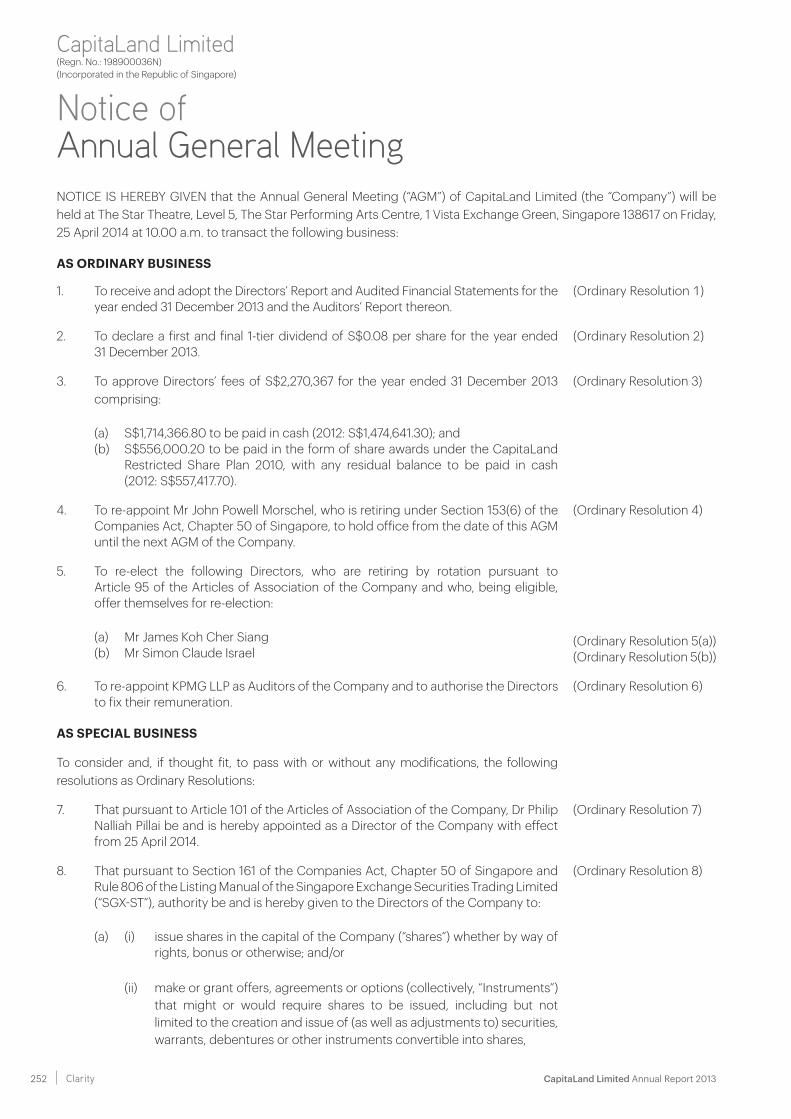
CapitaLand Limited Annual Report 2013 252 Clarity
Notice of Annual General Meeting
CapitaLand Limited(Regn. No.: 198900036N)(Incorporated in the Republic of Singapore)
NOTICE IS HEREBY GIVEN that the Annual General Meeting (“AGM”) of CapitaLand Limited (the “Company”) will be held at The Star Theatre, Level 5, The Star Performing Arts Centre, 1 Vista Exchange Green, Singapore 138617 on Friday, 25 April 2014 at 10.00 a.m. to transact the following business:
AS ORDINARY BUSINESS
1. To receive and adopt the Directors’ Report and Audited Financial Statements for the year ended 31 December 2013 and the Auditors’ Report thereon.
(Ordinary Resolution 1)
2. To declare a first and final 1-tier dividend of S$0.08 per share for the year ended 31 December 2013.
(Ordinary Resolution 2)
3. To approve Directors’ fees of S$2,270,367 for the year ended 31 December 2013 comprising:
(a) S$1,714,366.80 to be paid in cash (2012: S$1,474,641.30); and(b) S$556,000.20 to be paid in the form of share awards under the CapitaLand
Restricted Share Plan 2010, with any residual balance to be paid in cash (2012: S$557,417.70).
(Ordinary Resolution 3)
4. To re-appoint Mr John Powell Morschel, who is retiring under Section 153(6) of the Companies Act, Chapter 50 of Singapore, to hold office from the date of this AGM until the next AGM of the Company.
(Ordinary Resolution 4)
5. To re-elect the following Directors, who are retiring by rotation pursuant to Article 95 of the Articles of Association of the Company and who, being eligible, offer themselves for re-election:
(a) Mr James Koh Cher Siang(b) Mr Simon Claude Israel
(Ordinary Resolution 5(a))(Ordinary Resolution 5(b))
6. To re-appoint KPMG LLP as Auditors of the Company and to authorise the Directors to fix their remuneration.
(Ordinary Resolution 6)
AS SPECIAL BUSINESS
To consider and, if thought fit, to pass with or without any modifications, the following resolutions as Ordinary Resolutions:
7. That pursuant to Article 101 of the Articles of Association of the Company, Dr Philip Nalliah Pillai be and is hereby appointed as a Director of the Company with effect from 25 April 2014.
(Ordinary Resolution 7)
8. That pursuant to Section 161 of the Companies Act, Chapter 50 of Singapore and Rule 806 of the Listing Manual of the Singapore Exchange Securities Trading Limited (“SGX-ST”), authority be and is hereby given to the Directors of the Company to:
(a) (i) issue shares in the capital of the Company (“shares”) whether by way of rights, bonus or otherwise; and/or
(ii) make or grant offers, agreements or options (collectively, “Instruments”) that might or would require shares to be issued, including but not limited to the creation and issue of (as well as adjustments to) securities, warrants, debentures or other instruments convertible into shares,
(Ordinary Resolution 8)
253Appendix
AS SPECIAL BUSINESS (continued)
at any time and upon such terms and conditions and for such purposes and to such persons as the Directors may in their absolute discretion deem fit; and
(b) issue shares in pursuance of any Instrument made or granted by the Directors while this Resolution was in force (notwithstanding the authority conferred by this Resolution may have ceased to be in force),
provided that:
(1) the aggregate number of shares to be issued pursuant to this Resolution (including shares to be issued in pursuance of Instruments made or granted pursuant to this Resolution) shall not exceed fifty per cent. (50%) of the total number of issued shares (excluding treasury shares) in the capital of the Company (as calculated in accordance with sub-paragraph (2) below), of which the aggregate number of shares to be issued other than on a pro rata basis to shareholders of the Company (including shares to be issued in pursuance of Instruments made or granted pursuant to this Resolution) shall not exceed ten per cent. (10%) of the total number of issued shares (excluding treasury shares) in the capital of the Company (as calculated in accordance with sub-paragraph (2) below);
(2) (subject to such manner of calculation as may be prescribed by the SGX-ST for the purpose of determining the aggregate number of shares that may be issued under sub-paragraph (1) above, the total number of issued shares (excluding treasury shares) in the capital of the Company shall be based on the total number of issued shares (excluding treasury shares) in the capital of the Company at the time this Resolution is passed, after adjusting for:
(i) any new shares arising from the conversion or exercise of any convertible securities or share options or vesting of share awards which are outstanding or subsisting at the time this Resolution is passed; and
(ii) any subsequent bonus issue, consolidation or subdivision of shares;
(3) in exercising the authority conferred by this Resolution, the Company shall comply with the provisions of the Listing Manual of the SGX-ST for the time being in force (unless such compliance has been waived by the SGX-ST) and the Articles of Association for the time being of the Company; and
(4) (unless revoked or varied by the Company in general meeting) the authority conferred by this Resolution shall continue in force until (i) the conclusion of the next AGM of the Company or (ii) the date by which the next AGM of the Company is required by law to be held, whichever is the earlier.
CapitaLand Limited Annual Report 2013 254 Clarity
Notice of Annual General Meeting
AS SPECIAL BUSINESS (continued)
9. That the Directors of the Company be and are hereby authorised to:
(a) grant awards in accordance with the provisions of the CapitaLand Performance Share Plan 2010 (the “Performance Share Plan”) and/or the CapitaLand Restricted Share Plan 2010 (the “Restricted Share Plan”); and
(b) allot and issue from time to time such number of shares in the capital of the Company as may be required to be issued pursuant to the vesting of awards granted under the Performance Share Plan and/or the Restricted Share Plan,
provided that the aggregate number of new shares to be issued, when aggregated with existing shares (including treasury shares and cash equivalents) delivered and/or to be delivered pursuant to the Performance Share Plan, the Restricted Share Plan and all shares, options or awards granted under any other share schemes of the Company then in force, shall not exceed eight per cent. (8%) of the total number of issued shares (excluding treasury shares) in the capital of the Company from time to time.
(Ordinary Resolution 9)
BY ORDER OF THE BOARD
MICHELLE KOHCompany Secretary
Singapore21 March 201421 March 2014
Notes:
I A member of the Company entitled to attend and vote at the AGM of the Company is entitled to appoint not more than two proxies to attend and vote in his/her stead. A proxy need not be a member of the Company.
II Where a member of the Company appoints more than one proxy, the appointments shall be invalid unless he/she specifies the proportion of his/her shareholding (expressed as a percentage of the whole) to be represented by each proxy.
III The Proxy Form must be lodged/deposited at the office of the Company’s Share Registrar, M & C Services Private Limited, 112 Robinson Road, #05-01, Singapore 068902 not later than 23 April 2014 at 10.00 a.m., being 48 hours before the time fixed for the AGM of the Company.
255Appendix
EXPLANATORY NOTES:
1 In relation to item 3 under the heading “As Ordinary Business”, the total compensation of the non-executive Directors for financial year 2013 comprises a combination of cash and shares. If approved, the aggregate amount of Directors’ fees of S$2,270,367 will be paid as to S$1,714,366.80 in cash, and S$556,000.20 in the form of share awards under the CapitaLand Restricted Share Plan 2010 (RSP) with any residual balance to be paid in cash. Directors’ fees (comprising retainer and attendance fees) will only be paid as to about seventy per cent. (70%) in cash and about thirty per cent. (30%) in the form of share awards under RSP (save in the case of Mrs Arfat Pannir Selvam and Prof Kenneth Stuart Courtis who are retiring from the Board at the conclusion of the AGM and will receive all of their Directors’ fees in cash). The actual number of shares to be awarded will be based on the volume-weighted average price of a share of the Company on the SGX-ST over the 14 trading days from (and including) the ex-dividend date following the AGM. The actual number of shares to be awarded will be rounded down to the nearest share, and any residual balance settled in cash. The awards will consist of the grant of fully paid shares, with no performance conditions attached and no vesting periods imposed. Such Directors’ fees will be paid upon approval by the shareholders at the AGM.
2 In relation to item 4 under the heading “As Ordinary Business”, Mr John Powell Morschel will, upon re-appointment, continue to serve as a Member of the Investment Committee and the Nominating Committee respectively. Mr Morschel is considered as an independent Director. Please refer to the “Board of Directors” section of the Company’s Annual Report 2013 for information on the current directorships in other listed companies and other principal commitments of Mr Morschel.
3 In relation to item 5 under the heading “As Ordinary Business”, Mrs Arfat Pannir Selvam and Prof Kenneth Stuart Courtis, respectively independent Directors, will retire by rotation pursuant to Article 95 of the Company’s Articles of Association at the AGM and are not seeking re-election. Their retirement from the Board will take effect upon the conclusion of the AGM. Mrs Selvam will, upon retirement, cease to be a Member of the Audit Committee, the Corporate Disclosure Committee and the Nominating Committee respectively. Prof Courtis will, upon retirement, cease to be a Member of the Finance and Budget Committee and the Investment Committee respectively.
In relation to items 5(a) and (b) under the heading “As Ordinary Business”, Mr James Koh Cher Siang will, upon re-election, continue to serve as Chairman of the Corporate Disclosure Committee and a Member of the Audit Committee. Mr Koh will, upon re-election, step down as Chairman and a Member of the Risk Committee and be appointed as a Member of the Investment Committee. Mr Simon Claude Israel will, upon re-election, continue to serve as a Member of the Investment Committee, the Executive Resource and Compensation Committee and the Nominating Committee respectively. Mr Koh and Mr Israel are considered as independent Directors. Please refer to the “Board of Directors” section of the Company’s Annual Report 2013 for information on the current directorships in other listed companies and other principal commitments of Mr Koh and Mr Israel respectively.
Tan Sri Amirsham Bin A Aziz, an independent Director, who is a Member of the Risk Committee, will be appointed as Chairman of the Risk Committee in replacement of Mr James Koh.
CapitaLand Limited Annual Report 2013 256 Clarity
Notice of Annual General Meeting
EXPLANATORY NOTES: (continued)
4 In relation to item 7 under the heading “As Special Business”, it is proposed that Dr Philip Nalliah Pillai, 66, be appointed as a Director of the Company with effect from 25 April 2014. Dr Pillai served as a Judge of the Supreme Court of Singapore from June 2010 to 12 December 2012, after being appointed as Judicial Commissioner from October 2009. Prior to that, he was in legal practice for over 23 years as a partner and managing partner at Shook Lin & Bok, where he specialised in corporate, corporate finance and securities law. He was joint managing partner of Allen & Overy, Shook Lin & Bok JLV from 2000 to 2008. From 1971 to 1985, he taught law at the Law Faculty of National University of Singapore (NUS), holding the position of Associate Professor of Law and was a Senate Member of NUS from 1976 to 1985. Dr Pillai received an LLB (First Class) (Hons) from the University of Singapore in 1971 and an LLM and a Doctor of Juridical Sciences (SJD) from the Harvard Law School in 1973 and 1983, respectively. For his contributions to public service, Dr Pillai was awarded the Singapore Public Service Medal in 2003. He was a member of the Legal Service Commission from 2007 to 2013. Dr Pillai is currently a member of the board of Inland Revenue Authority of Singapore. His past directorships in listed companies include Singapore Press Holdings Ltd, Singapore Technologies Engineering Ltd and Hotung Investment Holdings Limited. Dr Pillai does not have any relationships including immediate family relationships between himself and the Directors, the Company and its 10% shareholders (as defined in the Singapore Code of Corporate Governance 2012). The Board of Directors of the Company is pleased to recommend the appointment of Dr Pillai who brings with him a long and distinguised career in the legal sector which will complement the skill sets of the other Board members. If appointed, Dr Pillai will be considered an independent Director. Upon his appointment as a Director of the Company, Dr Pillai will also be appointed as a Member of the Audit Committee and the Corporate Disclosure Committee respectively.
5 Ordinary Resolution 8 under the heading “As Special Business”, if passed, will empower the Directors to issue shares in the Company and to make or grant instruments (such as securities, warrants or debentures) convertible into shares, and to issue shares in pursuance of such instruments from the date of the AGM until the date of the next AGM of the Company unless such authority is earlier revoked or varied by the shareholders of the Company at a general meeting. The aggregate number of shares which the Directors may issue (including shares to be issued pursuant to convertibles) under this Resolution must not exceed fifty per cent. (50%) of the total number of issued shares (excluding treasury shares) in the capital of the Company with a sub-limit of ten per cent. (10%) for issues other than on a pro rata basis. For the purpose of determining the aggregate number of shares that may be issued, the total number of issued shares (excluding treasury shares) in the capital of the Company will be calculated based on the total number of issued shares (excluding treasury shares) in the capital of the Company at the time that Ordinary Resolution 8 is passed, after adjusting for (a) new shares arising from the conversion or exercise of any convertible securities or share options or vesting of share awards which are outstanding or subsisting at the time that Ordinary Resolution 8 is passed, and (b) any subsequent bonus issue, consolidation or subdivision of shares. The sub-limit of ten per cent. (10%) for issues other than on a pro rata basis is below the twenty per cent. (20%) sub-limit permitted by the Listing Manual of the SGX-ST. The Directors believe that the lower sub-limit of ten per cent. (10%) would sufficiently address the Company’s present need to maintain flexibility while taking into account shareholders’ concerns against dilution.
6 Ordinary Resolution 9 under the heading “As Special Business”, if passed, will empower the Directors to grant awards under the Performance Share Plan and the Restricted Share Plan, and to allot and issue shares pursuant to the vesting of such awards provided that the aggregate number of new shares to be issued, when aggregated with existing shares (including treasury shares and cash equivalents) delivered and/or to be delivered pursuant to the Performance Share Plan, the Restricted Share Plan and all shares, options or awards granted under any other share schemes of the Company then in force, does not exceed eight per cent. (8%) of the total number of issued shares (excluding treasury shares) in the capital of the Company from time to time. Such eight per cent. (8%) limit will apply across the entire duration of the Performance Share Plan and the Restricted Share Plan. Nonetheless, the Directors currently do not intend, in any given financial year, to grant awards under the Performance Share Plan and the Restricted Share Plan which, collectively, would comprise more than one per cent. (1%) of the total number of issued shares (excluding treasury shares) in the capital of the Company from time to time (the “Yearly Limit”). Should the Yearly Limit not be fully utilised in any given financial year, the unutilised balance will be rolled forward and may be used by the Directors in subsequent years to make grants of awards under the Performance Share Plan and the Restricted Share Plan.
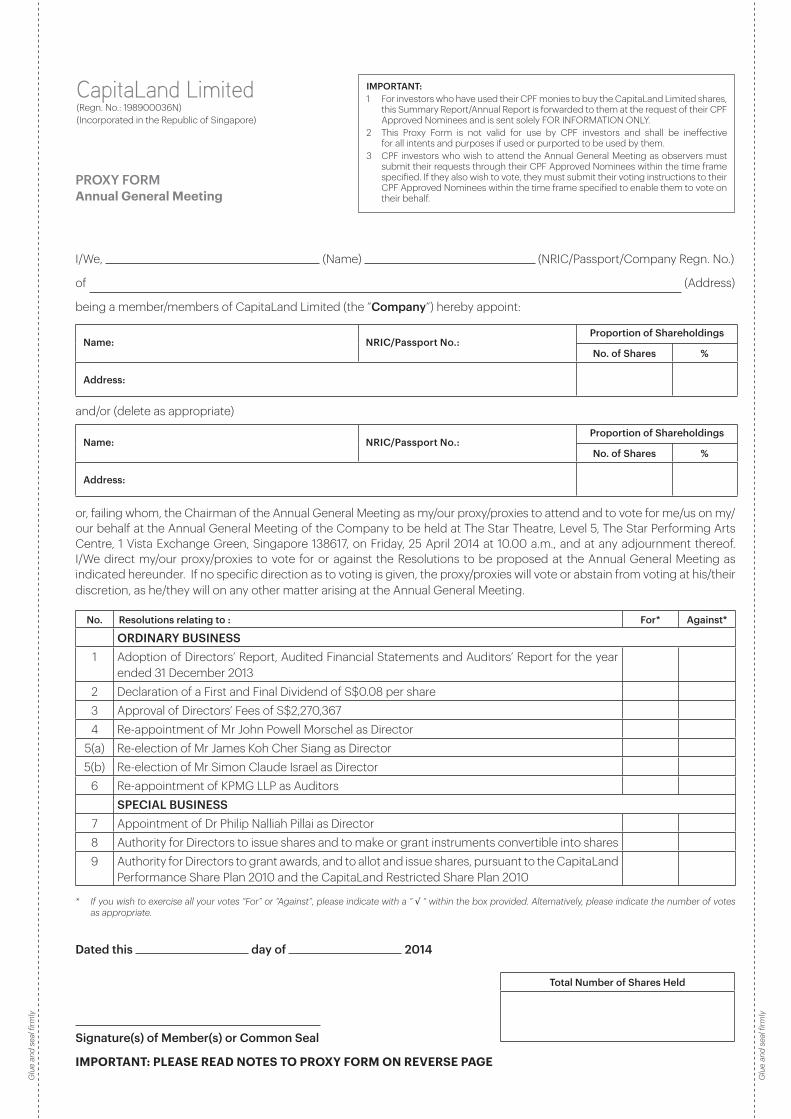
I/We, (Name) (NRIC/Passport/Company Regn. No.)
of (Address)
being a member/members of CapitaLand Limited (the “Company”) hereby appoint:
Name: NRIC/Passport No.:Proportion of Shareholdings
No. of Shares %
Address:
and/or (delete as appropriate)
Name: NRIC/Passport No.:Proportion of Shareholdings
No. of Shares %
Address:
or, failing whom, the Chairman of the Annual General Meeting as my/our proxy/proxies to attend and to vote for me/us on my/our behalf at the Annual General Meeting of the Company to be held at The Star Theatre, Level 5, The Star Performing Arts Centre, 1 Vista Exchange Green, Singapore 138617, on Friday, 25 April 2014 at 10.00 a.m., and at any adjournment thereof. I/We direct my/our proxy/proxies to vote for or against the Resolutions to be proposed at the Annual General Meeting as indicated hereunder. If no specific direction as to voting is given, the proxy/proxies will vote or abstain from voting at his/their discretion, as he/they will on any other matter arising at the Annual General Meeting.
No. Resolutions relating to : For* Against*
ORDINARY BUSINESS1 Adoption of Directors’ Report, Audited Financial Statements and Auditors’ Report for the year
ended 31 December 20132 Declaration of a First and Final Dividend of S$0.08 per share3 Approval of Directors’ Fees of S$2,270,3674 Re-appointment of Mr John Powell Morschel as Director
5(a) Re-election of Mr James Koh Cher Siang as Director5(b) Re-election of Mr Simon Claude Israel as Director
6 Re-appointment of KPMG LLP as Auditors SPECIAL BUSINESS
7 Appointment of Dr Philip Nalliah Pillai as Director8 Authority for Directors to issue shares and to make or grant instruments convertible into shares9 Authority for Directors to grant awards, and to allot and issue shares, pursuant to the CapitaLand
Performance Share Plan 2010 and the CapitaLand Restricted Share Plan 2010
* If you wish to exercise all your votes “For” or “Against”, please indicate with a “ √ “ within the box provided. Alternatively, please indicate the number of votes as appropriate.
Dated this day of 2014
Signature(s) of Member(s) or Common Seal
IMPORTANT: PLEASE READ NOTES TO PROXY FORM ON REVERSE PAGE
PROXY FORMAnnual General Meeting
CapitaLand Limited(Regn. No.: 198900036N)(Incorporated in the Republic of Singapore)
IMPORTANT:1 For investors who have used their CPF monies to buy the CapitaLand Limited shares,
this Summary Report/Annual Report is forwarded to them at the request of their CPF Approved Nominees and is sent solely FOR INFORMATION ONLY.
2 This Proxy Form is not valid for use by CPF investors and shall be ineffective for all intents and purposes if used or purported to be used by them.
3 CPF investors who wish to attend the Annual General Meeting as observers must submit their requests through their CPF Approved Nominees within the time frame specified. If they also wish to vote, they must submit their voting instructions to their CPF Approved Nominees within the time frame specified to enable them to vote on their behalf.
Total Number of Shares Held
Glu
e an
d se
al fi
rmly
Glu
e an
d se
al fi
rmly
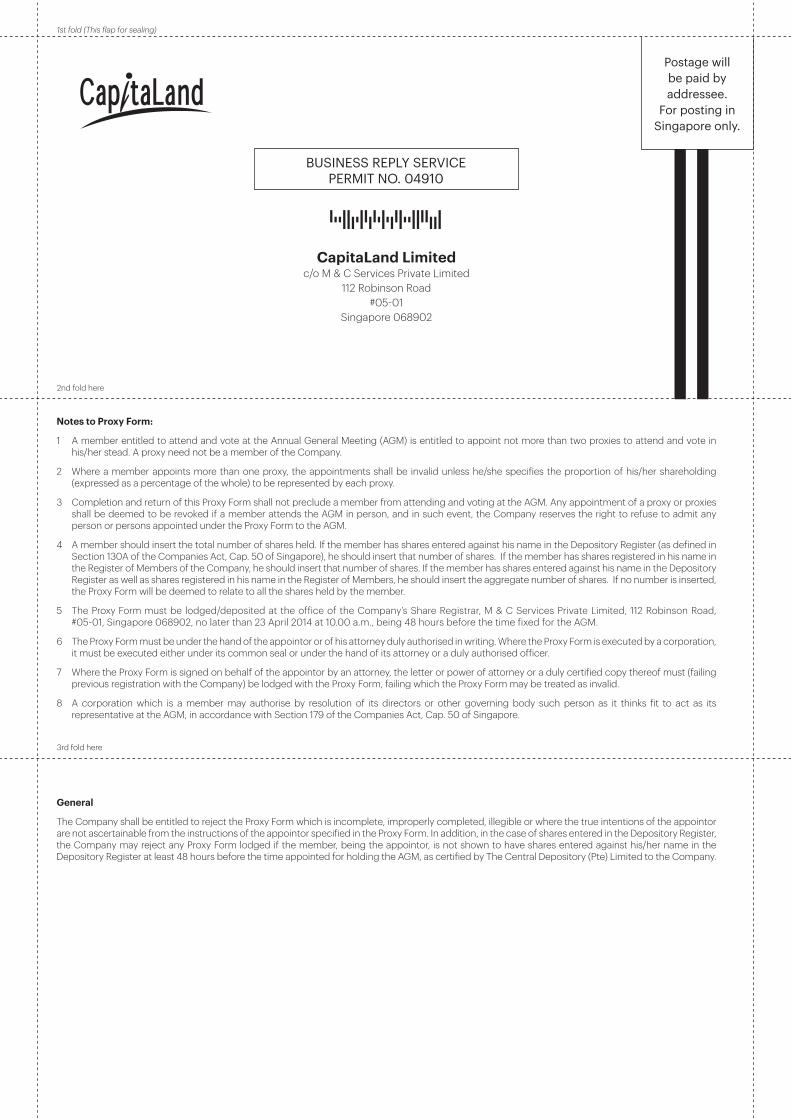
Notes to Proxy Form:
1 A member entitled to attend and vote at the Annual General Meeting (AGM) is entitled to appoint not more than two proxies to attend and vote in his/her stead. A proxy need not be a member of the Company.
2 Where a member appoints more than one proxy, the appointments shall be invalid unless he/she specifies the proportion of his/her shareholding (expressed as a percentage of the whole) to be represented by each proxy.
3 Completion and return of this Proxy Form shall not preclude a member from attending and voting at the AGM. Any appointment of a proxy or proxies shall be deemed to be revoked if a member attends the AGM in person, and in such event, the Company reserves the right to refuse to admit any person or persons appointed under the Proxy Form to the AGM.
4 A member should insert the total number of shares held. If the member has shares entered against his name in the Depository Register (as defined in Section 130A of the Companies Act, Cap. 50 of Singapore), he should insert that number of shares. If the member has shares registered in his name in the Register of Members of the Company, he should insert that number of shares. If the member has shares entered against his name in the Depository Register as well as shares registered in his name in the Register of Members, he should insert the aggregate number of shares. If no number is inserted, the Proxy Form will be deemed to relate to all the shares held by the member.
5 The Proxy Form must be lodged/deposited at the office of the Company’s Share Registrar, M & C Services Private Limited, 112 Robinson Road, #05-01, Singapore 068902, no later than 23 April 2014 at 10.00 a.m., being 48 hours before the time fixed for the AGM.
6 The Proxy Form must be under the hand of the appointor or of his attorney duly authorised in writing. Where the Proxy Form is executed by a corporation, it must be executed either under its common seal or under the hand of its attorney or a duly authorised officer.
7 Where the Proxy Form is signed on behalf of the appointor by an attorney, the letter or power of attorney or a duly certified copy thereof must (failing previous registration with the Company) be lodged with the Proxy Form, failing which the Proxy Form may be treated as invalid.
8 A corporation which is a member may authorise by resolution of its directors or other governing body such person as it thinks fit to act as its representative at the AGM, in accordance with Section 179 of the Companies Act, Cap. 50 of Singapore.
2nd fold here
CapitaLand Limitedc/o M & C Services Private Limited
112 Robinson Road #05-01
Singapore 068902
BUSINESS REPLY SERVICEPERMIT NO. 04910
1st fold (This flap for sealing)
Postage willbe paid byaddressee.
For posting inSingapore only.
General
The Company shall be entitled to reject the Proxy Form which is incomplete, improperly completed, illegible or where the true intentions of the appointor are not ascertainable from the instructions of the appointor specified in the Proxy Form. In addition, in the case of shares entered in the Depository Register, the Company may reject any Proxy Form lodged if the member, being the appointor, is not shown to have shares entered against his/her name in the Depository Register at least 48 hours before the time appointed for holding the AGM, as certified by The Central Depository (Pte) Limited to the Company.
3rd fold here

This page is intentionally left blank.

This page is intentionally left blank.
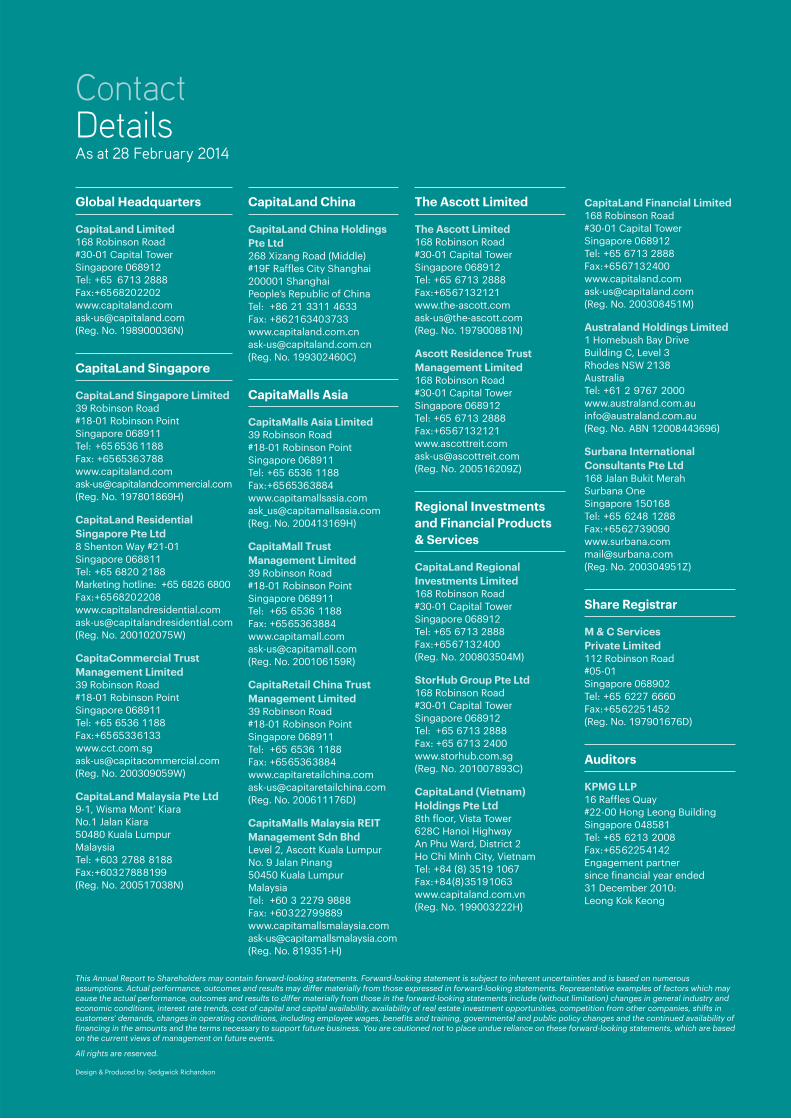
This Annual Report to Shareholders may contain forward-looking statements. Forward-looking statement is subject to inherent uncertainties and is based on numerous assumptions. Actual performance, outcomes and results may differ materially from those expressed in forward-looking statements. Representative examples of factors which may cause the actual performance, outcomes and results to differ materially from those in the forward-looking statements include (without limitation) changes in general industry and economic conditions, interest rate trends, cost of capital and capital availability, availability of real estate investment opportunities, competition from other companies, shifts in customers’ demands, changes in operating conditions, including employee wages, benefits and training, governmental and public policy changes and the continued availability of financing in the amounts and the terms necessary to support future business. You are cautioned not to place undue reliance on these forward-looking statements, which are based on the current views of management on future events. All rights are reserved.
Design & Produced by: Sedgwick Richardson
ContactDetailsAs at 28 February 2014
Global Headquarters
CapitaLand Limited168 Robinson Road#30-01 Capital TowerSingapore 068912Tel: +65 6713 2888Fax: +65 6820 [email protected](Reg. No. 198900036N)
CapitaLand Singapore
CapitaLand Singapore Limited39 Robinson Road#18-01 Robinson PointSingapore 068911Tel: +65 6536 1188Fax: +65 6536 [email protected](Reg. No. 197801869H)
CapitaLand Residential Singapore Pte Ltd 8 Shenton Way #21-01Singapore 068811Tel: +65 6820 2188Marketing hotline: +65 6826 6800Fax: +65 6820 2208www.capitalandresidential.comask-us@capitalandresidential.com(Reg. No. 200102075W)
CapitaCommercial Trust Management Limited39 Robinson Road#18-01 Robinson PointSingapore 068911Tel: +65 6536 1188Fax: +65 6533 [email protected](Reg. No. 200309059W)
CapitaLand Malaysia Pte Ltd9-1, Wisma Mont’ KiaraNo.1 Jalan Kiara50480 Kuala LumpurMalaysiaTel: +603 2788 8188Fax: +603 2788 8199(Reg. No. 200517038N)
CapitaLand China
CapitaLand China Holdings Pte Ltd268 Xizang Road (Middle)#19F Raffles City Shanghai200001 ShanghaiPeople’s Republic of ChinaTel: +86 21 3311 4633Fax: +86 21 6340 [email protected](Reg. No. 199302460C)
CapitaMalls Asia
CapitaMalls Asia Limited39 Robinson Road#18-01 Robinson PointSingapore 068911Tel: +65 6536 1188Fax: +65 6536 [email protected](Reg. No. 200413169H)
CapitaMall Trust Management Limited39 Robinson Road#18-01 Robinson PointSingapore 068911Tel: +65 6536 1188Fax: +65 6536 [email protected](Reg. No. 200106159R)
CapitaRetail China Trust Management Limited39 Robinson Road#18-01 Robinson PointSingapore 068911Tel: +65 6536 1188Fax: +65 6536 [email protected](Reg. No. 200611176D)
CapitaMalls Malaysia REIT Management Sdn BhdLevel 2, Ascott Kuala LumpurNo. 9 Jalan Pinang50450 Kuala LumpurMalaysiaTel: +60 3 2279 9888Fax: +60 3 2279 [email protected](Reg. No. 819351-H)
The Ascott Limited
The Ascott Limited168 Robinson Road#30-01 Capital TowerSingapore 068912Tel: +65 6713 2888 Fax: +65 6713 [email protected](Reg. No. 197900881N)
Ascott Residence Trust Management Limited168 Robinson Road#30-01 Capital TowerSingapore 068912Tel: +65 6713 2888 Fax: +65 6713 [email protected](Reg. No. 200516209Z)
Regional Investments and Financial Products& Services
CapitaLand Regional Investments Limited 168 Robinson Road#30-01 Capital TowerSingapore 068912Tel: +65 6713 2888Fax: +65 6713 2400(Reg. No. 200803504M)
StorHub Group Pte Ltd168 Robinson Road#30-01 Capital TowerSingapore 068912Tel: +65 6713 2888Fax: +65 6713 2400www.storhub.com.sg(Reg. No. 201007893C)
CapitaLand (Vietnam) Holdings Pte Ltd8th floor, Vista Tower 628C Hanoi Highway An Phu Ward, District 2 Ho Chi Minh City, VietnamTel: +84 (8) 3519 1067 Fax: +84 (8) 3519 1063www.capitaland.com.vn(Reg. No. 199003222H)
CapitaLand Financial Limited168 Robinson Road#30-01 Capital TowerSingapore 068912Tel: +65 6713 2888Fax: +65 6713 [email protected] (Reg. No. 200308451M)
Australand Holdings Limited1 Homebush Bay DriveBuilding C, Level 3Rhodes NSW 2138AustraliaTel: +61 2 9767 [email protected](Reg. No. ABN 12008443696)
Surbana International Consultants Pte Ltd168 Jalan Bukit MerahSurbana One Singapore 150168Tel: +65 6248 1288Fax: +65 6273 9090www.surbana.com [email protected] (Reg. No. 200304951Z)
Share Registrar
M & C Services Private Limited112 Robinson Road #05-01Singapore 068902Tel: +65 6227 6660Fax: +65 6225 1452(Reg. No. 197901676D)
Auditors
KPMG LLP16 Raffles Quay#22-00 Hong Leong BuildingSingapore 048581Tel: +65 6213 2008Fax: +65 6225 4142 Engagement partner since financial year ended 31 December 2010: Leong Kok Keong

CapitaLand LimitedCompany Reg. No.: 198900036N
168 Robinson Road#30-01 Capital TowerSingapore 068912Tel: +65 6713 2888Fax: +65 6820 2202www.capitaland.com