Embed Size (px)
Citation preview
IMPAQ International, LLC ISA Outcome Study Final Report
Institute for Student Achievement
ISA Outcome Study
Final Report
June 2012
Submitted to:
Dr. N. Gerry House
Institute for Student Achievement One Old Country Road
Suite 250 Carle Place, NY 11514
Submitted by: Cheri Fancsali, Ph.D. Jason Snipes, Ph.D. Ying Zhang, Ph.D.
Ginger Stoker, Ph.D. Lorena Ortiz, M.S.
Eliana Orellana, B.S. IMPAQ International, LLC
10420 Little Patuxent Parkway Suite 300
Columbia, MD 21044 www.impaqint.com

IMPAQ International, LLC ISA Outcome Study Final Report
TABLE OF CONTENTS
Executive Summary .......................................................................................................................... i
Introduction .................................................................................................................................... 1
Study Methods ................................................................................................................................ 3
1. Research Questions ............................................................................................................. 3
2. Study Sample ....................................................................................................................... 3
3. Data Sources ........................................................................................................................ 5
3.1 New York City Department of Education (NYC DOE) ................................................... 5
3.2 Atlanta Public Schools (APS) ......................................................................................... 5
3.3 ISA Program Staff Implementation Ratings .................................................................. 6
3.4 National Student Clearinghouse (NSC) ......................................................................... 6
Study Findings ................................................................................................................................. 7
1. ISA High School Outcomes ................................................................................................... 7
2. ISA Impact Analyses ............................................................................................................. 8
2.2 Credit Accumulation ..................................................................................................... 9
2.3 On-track for Graduation ............................................................................................. 11
2.4 Graduation Outcomes ................................................................................................ 11
2.5 Outcomes for High Implementing ISA Schools ........................................................... 12
3. ISA Class of 2007 and 2008 Post-secondary Attendance and Persistence ........................ 14
Conclusions ................................................................................................................................... 17
Works Cited ................................................................................................................................... 18
Appendix A: ISA and Comparison Student Demographic Characteristics .................................... 19
Appendix B: Unadjusted Means on Key Outcomes for NYC and APS ISA Students and their Matched Comparisons .................................................................................................................. 21
Appendix C: Comparison Group Matching Procedures ................................................................ 24
1. ISA school-level matching .................................................................................................. 24
2. ISA Student level matching ................................................................................................ 25
Appendix D: Analytic Approach .................................................................................................... 28
Appendix E: Results of Sub-group Analyses for High Implementing ISA Schools ......................... 29

IMPAQ International, LLC ISA Outcome Study Final Report

IMPAQ International, LLC P a g e | i ISA Outcome Study Final Report
EXECUTIVE SUMMARY IMPAQ International conducted an impact study of the Institute for Student Achievement (ISA) high school model. The ISA model is grounded in seven principles that focus on creating and sustaining intellectually rigorous, caring, and personalized learning environments. The study used a quasi-experimental approach to estimate the impact of the model on attendance, credit accumulation, grade promotion, and graduation rates in 27 high schools in New York City, New York and Atlanta, Georgia. The study sample included students who were 9th graders in fall 2006, 2007, 2008 and 2009. ISA schools serve predominately poor and minority students who enter high school with below proficient levels of math and English language arts achievement. Findings from the study suggest that ISA schools study had positive effects on student outcomes in New York and Atlanta. In particular, ISA students outperformed their peers on the following outcomes:
11th grade attendance
Earning enough credits to be promoted to the next grade
Four-year credit accumulation
On-track for graduation at the end of 9th grade
High school graduation ISA’s estimated impact on these outcomes was greater for schools rated as having a high level of implementation. Additionally, post-secondary outcome data collected from five ISA schools showed that ISA students attend four-year schools at higher rates and have greater persistence rates than students nationwide. These findings indicate that ISA has a positive impact on the transition to high school, progress through high school, and high school completion. The estimated impact on promotion from 9th to 10th grade is particularly important given that 9th grade is a critical transition year, especially for at-risk youth, and that promotion to 10th grade is highly predictive of high school success and graduation. The findings suggest that ISA is an effective school reform model that can make a difference for at-risk students in terms of their success in high school and beyond.

IMPAQ International, LLC Page | 1 ISA Outcome Study Final Report
INTRODUCTION
The Institute for Student Achievement (ISA) is a nonprofit organization that facilitates the transformation of high schools into small learning communities designed to prepare all students for college. ISA was created in 1990 by Lilo and Gerard Leeds. ISA partners with school administrators and teachers to create and sustain intellectually rigorous, caring, and personalized learning environments. Building on a set of seven principles, ISA collaborates with schools to create comprehensive plans and implementation strategies customized to meet school and district needs. The seven ISA principles are:1
1. College preparatory instructional program: Preparing students for college 2. Distributed counseling™: Building a safety net of support services across the school 3. Dedicated team of teachers and counselors: Providing a consistent, four-year support
network 4. Continuing professional development: Establishing a professional community 5. Extended school day and school year: Extending personalized and challenging learning
opportunities 6. Parent involvement: Encouraging parents to participate in their children’s education 7. Ongoing organizational improvement: Program accountability: monitoring progress and
refining program components
ISA currently has 80 partner schools serving 20,000 students in school districts in Georgia, Louisiana, Maryland, Michigan, New Jersey, and New York.2
A previous longitudinal study of ISA schools in NYC (Fancsali & Bat-Chava, 2010) showed positive outcomes for ISA students and teachers. Data showed that the schools in the study generally implemented ISA principles well. ISA teachers attributed many positive changes in their practice and in the school environment to ISA professional development and particularly to the ISA coaches. These analyses also indicated that the implementation of ISA had a large and positive effect on student outcomes including graduation from high school and post-secondary enrollment and retention.
Since implementation of the current ISA model began approximately ten years ago, ISA has scaled up its operations substantially. It currently supports 80 schools in six states and is continuing to grow. In 2011, ISA commissioned IMPAQ International to conduct a follow-up study to assess the main research question: What is the evidence of ISA’s effects on high school and post-secondary education outcomes? To assess the degree to which the ISA model has been successfully “scaled up” in these new contexts, IMPAQ conducted a study documenting students’ outcomes in two cities: Atlanta, GA and New York City. These cities were selected for 1 http://www.studentachievement.org/principles.aspx , retrieved March 30, 2010.
2 http://www.studentachievement.org/content.aspx, retrieved February 9, 2010.

IMPAQ International, LLC Page | 2 ISA Outcome Study Final Report
participation in the study because nearly half of ISA’s partner schools are located within these two school districts; they also contained enough non-ISA schools to allow for appropriate comparison groups; the ISA schools existed long enough to allow for a four-year longitudinal analysis that spanned 9th through 12th grade, and because the districts’ departments of education were able to provide student records data that would allow us to conduct such analyses.

IMPAQ International, LLC Page | 3 ISA Outcome Study Final Report
STUDY METHODS
1. Research Questions
IMPAQ International conducted a follow-up study to determine impact of ISA on high school student academic outcomes. This study also investigated whether the positive effects found in the first study were sustained in a larger sample of schools and districts, and with data from the 2010 graduating class. Expanding the study sample to include new ISA schools in New York City and Atlanta GA, the study explored the following research questions:
1) What is the impact of ISA on high school outcomes (e.g., credits earned, grade promotion, attendance, dropping out, graduation)? 2) How do outcomes for ISA students compare to similar students who do not benefit from ISA? 3) What are the post-secondary enrollment and persistence outcomes for students in five ISA schools in the previous study?
2. Study Sample This study used a quasi-experimental method to estimate the effect of ISA on student outcomes. Using a propensity score matching approach, IMPAQ selected a closely matched comparison group of students with which to compare the key outcomes of ISA students. In order to identify the comparison sample, we first selected comparison schools with student enrollment patterns that were similar to ISA schools in terms of their racial/ethnic make-up, gender, economic status (measured as the percent of students eligible for free/reduced priced lunch), English language learner and special education status, and prior achievement (8th grade attendance and test scores, overage for grade status). We also matched on school size and admissions process in New York City (this was not possible in Atlanta because only one comparison school was of a similar small size to the ISA schools; all Atlanta high schools use the same admissions process.) We then used propensity score matching to select comparison students from among the matched comparison schools. Students were matched using the same demographic and prior achievement variables used to select the comparison schools. The propensity score matching process produced a comparison group that was statistically identical to the ISA students in the sample. See Appendix A for a description of the matching procedures and the demographic characteristics of the ISA and comparison group students.
The study followed four cohorts of students in NYC and Atlanta, starting with 9th grade students from the 2006-7 school year. We followed these students through 2009-10, their 4th year of high school. Cohort 2 included students in 9th grade in 2007-8, following them through 2009-10, their 3rd year of high school. Cohort 3 included students in 9th grade in 2008-9, following them through their 2nd year of high school in 2009-10, and Cohort 4 included students in 9th grade in the 2009-10 school year (see Table 1).

IMPAQ International, LLC Page | 4 ISA Outcome Study Final Report
Table 1: Study Cohorts and Years
Cohort Year entered 9th grade Years followed in the
study Cohort 1 2006-7 4
Cohort 2 2007-8 3
Cohort 3 2008-9 2
Cohort 4 2009-10 1
A total of 27 ISA schools in NYC and Atlanta were included in the study; 18 from NYC and 9 from the Atlanta Public School district. The number of schools and students involved in each year of analysis is different, reflecting the year that the ISA school began serving 9th grade students. For example, 27 ISA schools in our study had 9th grade classes in 2009-10 and 2008-09. This drops to 24 schools with 9th grade classes in 2007-8 and 15 in 2006-07, the first year of our study. Thus, a total of 15 schools (12 in NYC and 3 in Atlanta) had a graduating class in 2010. Only these 15 schools are included in the analyses of year-four outcomes (e.g., dropouts, graduation). Table 2 below shows the number of schools and students involved in each year of the study for ISA and the comparison group. Table 2: Number of Schools and Students in the ISA and Comparison Group Sample, by Outcome Year
Outcome Years/cohorts
Number of ISA Schools
Number of ISA Students
Number of Comparison
Schools
Number of Comparison Group
Students Year 1 of high school
(4 cohorts: 2006, 2007, 2008, 2009 9
th
graders)
27 8,057 70 23,105
Year 2 of high school (3 cohorts: 2006,
2007, 2008 9th
graders)
27 5,686 70 16,730
Year 3 of high school (2 cohorts: 2006, 2007
9th
graders)
24 3,646 66 10,310
Year 4 of high school (1 cohort: 2006 9
th
graders)
15 1,430 48 4,182
Table 3 shows the background and prior achievement characteristics for ISA students in this study. Students were predominately African American (71%) and Latino (24%), with 2% percent Asian and 2% white. Reflecting the population of students served by ISA schools, the study sample was predominantly low-income, as indicated by the high percentage of students eligible

IMPAQ International, LLC Page | 5 ISA Outcome Study Final Report
for free and reduced priced lunch. A majority of the students in these ISA schools came to high school with low prior achievement. Only 44% of the NYC students reached a level of proficiency in 8th grade mathematics and 36% in reading; 6% were proficient in English language arts.3 Table 3: Background Characteristics of ISA study students
Characteristic Percent Gender
Males 50.3%
Females 49.7%
Race/ethnicity
African America 71.3%
Latino 23.9%
White 1.9%
Asian 2.1%
Other 0.8%
Percent ever eligible for Free/Reduced Lunch
84.7%
Overage for grade at 9th
grade 1.1%
8th
Grade Avg Attendance (NYC only) 85.6%
8th
proficient in Math (NYC only) 44%
8th
grade proficient ELA (NYC only) 36%
Percent ever classified as English language learner
5.6%
Percent ever classified as Special Ed 13.1%
3. Data Sources IMPAQ collected data for this study from the New York City Department of Education, Atlanta Public Schools, the National Student Clearinghouse and ISA program staff. 3.1 New York City Department of Education (NYC DOE) IMPAQ collected individual student achievement records from the NYC DOE for all high school students enrolled in public schools in the 2006-7 school year through the 2009-10 school year. We collected records on student characteristics and prior performance (race/ethnicity, free/reduced price lunch status, special education and English language learner status, gender, 8th grade achievement test results and attendance) and outcome variables (enrollment status by school, attendance, credits, Regents test scores, grade promotion, dropout and graduation). 3.2 Atlanta Public Schools (APS) Paralleling the data collected in New York City, IMPAQ collected individual achievement records from APS for all high school students enrolled in public schools in Atlanta in the 2006-7 through 2009-10.
3 8th
grade math and ELA proficiency data were not available for Atlanta students.

IMPAQ International, LLC Page | 6 ISA Outcome Study Final Report
3.3 ISA Program Staff Implementation Ratings To allow investigation of the relationship between program implementation and program impact, we collected implementation ratings for each school in our sample. ISA program staff who work closely with the schools (including the director of programming and ISA school coaching staff) was asked to rate ISA schools as low, medium or high in terms of their fidelity of implementation to the ISA model and 7 principles. Staff members were instructed to base their ratings on information gained from ISA’s yearly school review process and reports and staff knowledge (e.g., coach or program staff experience with the school) of the schools’ success in implementation and adherence to the model and principles.
Schools scoring low on this indicator had successfully implemented none or few of the 7 ISA principles, or have implemented most or all of the principles with a low level of coherence to the model as specified by ISA.
Schools scoring medium on this indicator had successfully implemented some of the 7 principles.
Schools scoring high on this indicator had successfully implemented most or all of the 7 principles, with a high-level of coherence to the model as specified by ISA.
3.4 National Student Clearinghouse (NSC) In the original study of ISA high schools in New York City (Fancsali & Bat-Chava, 2010), data were collected from the National Student Clearinghouse on the post-secondary outcomes for students in five ISA high schools. These students entered 9th grade in 2003 or 2004. We continued to collect college enrollment, retention and attainment data for these students through the 2010-11 academic year, three and four years post high school graduation.

IMPAQ International, LLC Page | 7 ISA Outcome Study Final Report
STUDY FINDINGS
This report summarizes findings from the current study in three ways. First, we present the overall outcome levels for ISA students for attendance, credit accumulation, and graduation rates. Then, we present the results of our statistical impact analyses. These impact analyses compare ISA students to similar non-ISA students in otherwise similar non-ISA schools to estimate the effect of ISA schools on student outcomes. In particular, they allow us to determine if ISA students outperformed similar students from similar schools. Finally, we present post-secondary outcomes for students in five high schools from the previous study.
1. ISA High School Outcomes Table 4 shows the attendance, credit accumulation and graduation outcomes for ISA students in our study. ISA students had an average daily attendance of between 82% and 88%, with a slight decline from the first year in high school to the fourth year in high school, as is typical of high school students. The credit accumulation outcomes reported in the table indicate that a majority of ISA students made adequate progress towards high school completion. For example, over three-fourths of 9th grade students earn enough credits to be promoted to the next grade, suggesting they are on-track for graduation at the end of their first year of high school. This pattern persisted in the second and third year of high school. Further, ISA students in both districts exceeded the number of credits required for graduation. (See Appendix B for all outcomes reported by district.)
Graduation rates among ISA students were higher than the graduation rates in the district as a whole. Nearly 76% of ISA 9th grade students from the 2006-07 cohort graduated from high school within four years of entering the 9th grade4. By comparison, only 65% of 2006-07 9th grade cohort of students in New York City as a whole graduated from high school in four years. Further, preliminary results from 2011 indicate that, even as graduation requirements have increased, the graduation rate among ISA students has improved since 20105.
4 We believe the small 3 percentage point difference in the graduation rate between this study and the previous
study of ISA (Fancsali & Bat-Chava, 2010) is due to increases in the New York City graduation requirements and the fact that this sample included several schools that were not included in the previous study’s graduation analysis (due to the fact that they did not have ISA graduating cohorts in 2007 or 2008).
5 2011 student-level graduation data have not been released by the NYC department of Education at the writing of
this report. Although not yet available for this cohort of students, it will be important to see the six-year graduation rate for ISA students, as we know that many students, particularly English Language Learners, take five or six years to graduate from high school.

IMPAQ International, LLC Page | 8 ISA Outcome Study Final Report
Table 4: High School Outcomes for ISA Study Students: 2006-10
Outcomes ISA Average Daily Attendance
Year 1 of high school 88.2%
Year 2 of high school 86.2%
Year 3 of high school 85.3%
Year 4 of high school 82.2%
Credits
9th
graders who earned enough credits to be promoted to 10th
grade 76.4%
10th
graders who earned enough credits to be promoted to 11th
grade 73.4%
11th
graders who earned enough credits to be promoted to 12th
grade 75.5%
4 year credit accumulation
New York City Schools (44 required for graduation) 46.8
Atlanta Schools (26 required for graduation) 30.3
Four-year graduation rate (any type of diploma) 75.6%
2. ISA Impact Analyses: What is the impact of ISA on student achievement? How do outcomes for ISA students compare to similar students? The main research question this study investigates is the impact of the ISA model on student achievement. The impact analyses provide a measure of the effect of ISA by calculating the difference in achievement for ISA and a carefully matched sample of comparison students, chosen from within a carefully matched set of non-ISA comparison schools. In order to create these matched comparisons, we first matched ISA schools with similar non-ISA schools based on average prior achievement and average background characteristics including race-ethnicity, eligibility for free and reduced-priced lunch, English language learner status, and special education status. We then matched ISA students with non-ISA students in their comparison schools, based again on prior achievement and key background characteristics. We compared the outcomes among the ISA students to the outcomes in the matched comparison group, still controlling for student background characteristics. This approach eliminates any differences due to prior achievement and all other measured background characteristics.6 The results presented below are the estimated impacts of ISA on student outcomes. In other words, they compare the average outcomes for students at ISA schools to the average outcomes of their matched comparison counterparts at non-ISA schools, statistically adjusted to control for background characteristics and prior achievement. The results include impacts on attendance, credit accumulation and graduation rates. The difference between the statistically
6 Impacts were estimated using a two-level hierarchical linear model, with students nested in schools, and with ISA
status as school level dichotomous variable. See Appendix D for a description of the analytic approach.

IMPAQ International, LLC Page | 9 ISA Outcome Study Final Report
adjusted mean score for ISA students and those the comparison students can be interpreted as the effect of ISA on that outcome. 2.1 Attendance
Attendance is an indicator of student engagement in school, and a strong predictor of high school graduation. Previous research indicates that low attendance during the first 30 days of grade 9 is a more powerful predictor that a student will drop out than any 8th grade factor, including test scores, age, or academic failure (Neild & Balfanz, 2001). As shown in Figure 1, ISA students had similar, though slightly higher, attendance levels than those in the comparison group. There is a statistically significant 1.4 percentage point difference between ISA students and their peers in the 11th grade.
Figure 1: Attendance Outcomes for ISA and Comparison Students
87.3% 84.5% 83.0% 79.9%86.6%83.0% 81.6% 77.9%
0.0%
20.0%
40.0%
60.0%
80.0%
100.0%
9th grade 10th grade 11th grade ** 12th grade
*p ≤.1, **p ≤.05,***p ≤.01
Average Daily Attendance
ISA
Control
2.2 Credit Accumulation Credit accumulation is a key indicator of students’ progress towards graduation. In New York City, 93% of dropouts were found to be over-age and under-credited (Parthenon Group, 2005). Further, credit accumulation is a key factor in determining if a student is promoted to the next grade, and promotion is a strong predictor of high school success and graduation – particularly in the 9th grade. Previous research has shown that first time 9th graders who are promoted to 10th grade are more than 3.5 times more likely to stay in school and graduate in four years than students who are not promoted (Roderick, 2006). Our impact analyses indicate that ISA had a
P=.000
IMPAQ International, LLC Page | 10 ISA Outcome Study Final Report
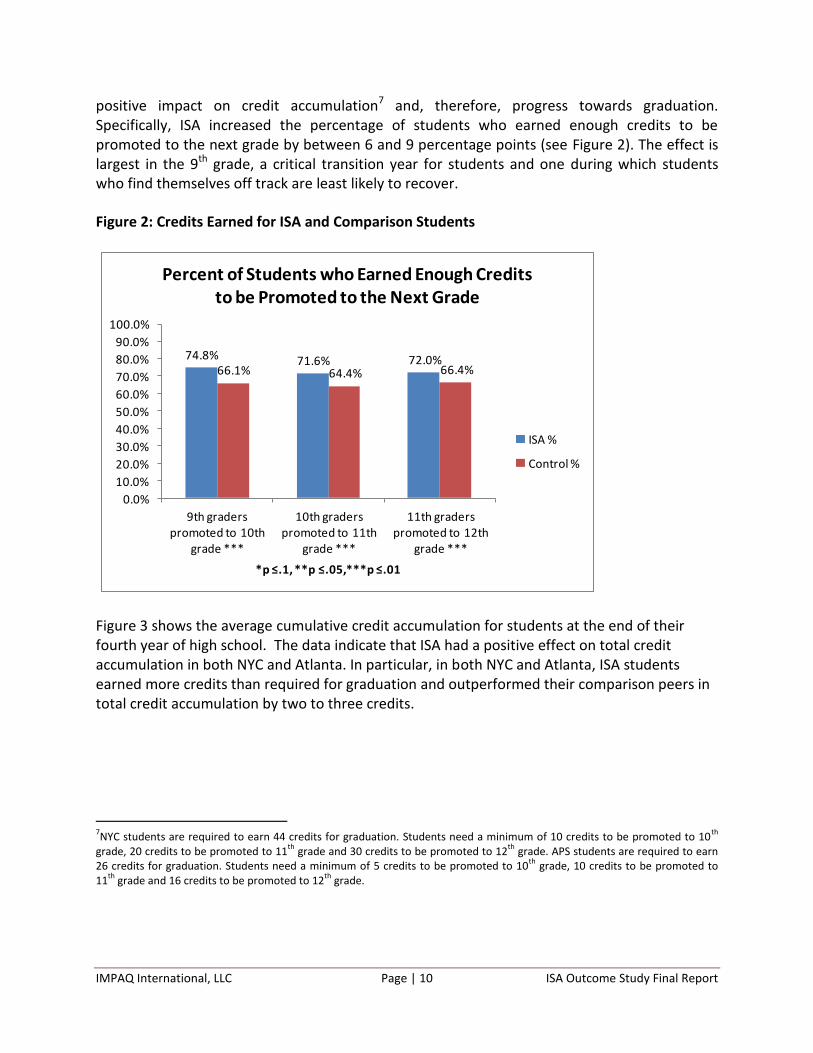
positive impact on credit accumulation7 and, therefore, progress towards graduation. Specifically, ISA increased the percentage of students who earned enough credits to be promoted to the next grade by between 6 and 9 percentage points (see Figure 2). The effect is largest in the 9th grade, a critical transition year for students and one during which students who find themselves off track are least likely to recover.
Figure 2: Credits Earned for ISA and Comparison Students
74.8% 71.6% 72.0%66.1% 64.4% 66.4%
0.0%
10.0%
20.0%
30.0%
40.0%
50.0%
60.0%
70.0%
80.0%
90.0%
100.0%
9th graders promoted to 10th
grade ***
10th graders promoted to 11th
grade ***
11th graders promoted to 12th
grade ***
*p ≤.1, **p ≤.05,***p ≤.01
Percent of Students who Earned Enough Credits to be Promoted to the Next Grade
ISA %
Control %
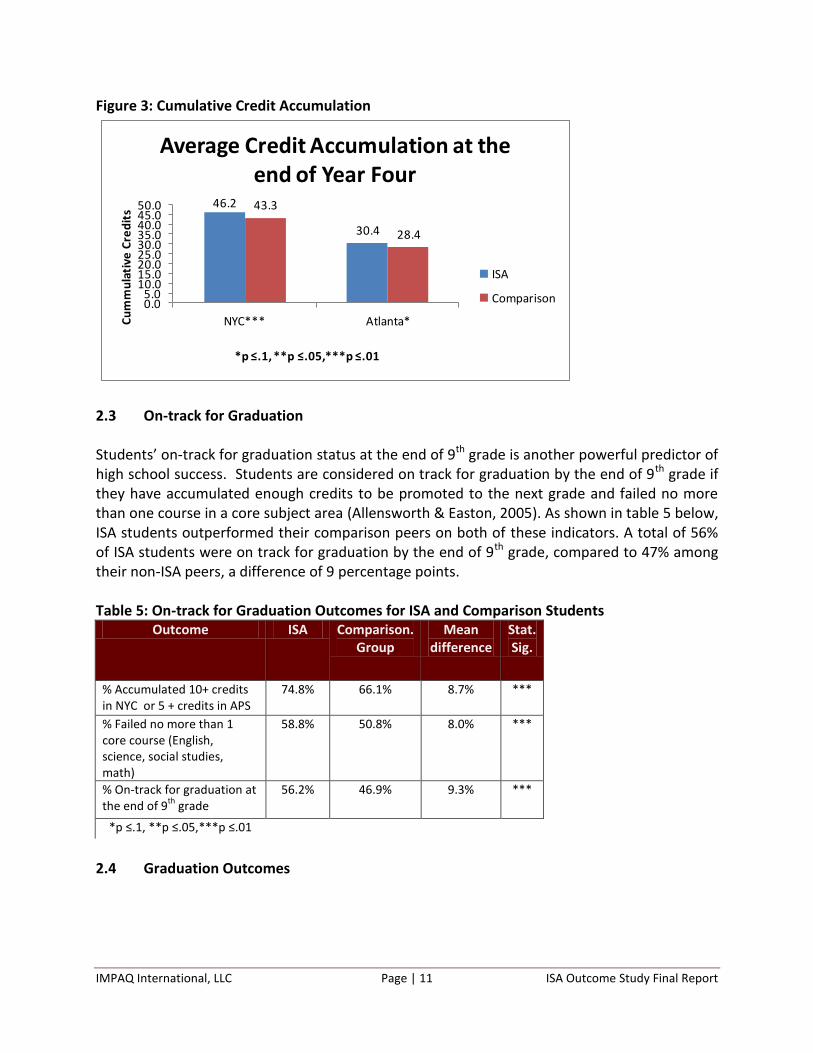
Figure 3 shows the average cumulative credit accumulation for students at the end of their fourth year of high school. The data indicate that ISA had a positive effect on total credit accumulation in both NYC and Atlanta. In particular, in both NYC and Atlanta, ISA students earned more credits than required for graduation and outperformed their comparison peers in total credit accumulation by two to three credits.
7NYC students are required to earn 44 credits for graduation. Students need a minimum of 10 credits to be promoted to 10
th
grade, 20 credits to be promoted to 11th
grade and 30 credits to be promoted to 12th
grade. APS students are required to earn 26 credits for graduation. Students need a minimum of 5 credits to be promoted to 10
th grade, 10 credits to be promoted to
11th
grade and 16 credits to be promoted to 12th
grade.
IMPAQ International, LLC Page | 11 ISA Outcome Study Final Report
Figure 3: Cumulative Credit Accumulation
46.2
30.4
43.3
28.4
0.05.0
10.015.020.025.030.035.040.045.050.0
NYC*** Atlanta*Cu
mm
ula
tive
Cre
dit
s
*p ≤.1, **p ≤.05,***p ≤.01
Average Credit Accumulation at the end of Year Four
ISA
Comparison
2.3 On-track for Graduation Students’ on-track for graduation status at the end of 9th grade is another powerful predictor of high school success. Students are considered on track for graduation by the end of 9th grade if they have accumulated enough credits to be promoted to the next grade and failed no more than one course in a core subject area (Allensworth & Easton, 2005). As shown in table 5 below, ISA students outperformed their comparison peers on both of these indicators. A total of 56% of ISA students were on track for graduation by the end of 9th grade, compared to 47% among their non-ISA peers, a difference of 9 percentage points. Table 5: On-track for Graduation Outcomes for ISA and Comparison Students
Outcome ISA Comparison. Group
Mean difference
Stat. Sig.
% Accumulated 10+ credits in NYC or 5 + credits in APS
74.8% 66.1% 8.7% ***
% Failed no more than 1 core course (English, science, social studies, math)
58.8% 50.8% 8.0% ***
% On-track for graduation at the end of 9
th grade
56.2% 46.9% 9.3% ***
*p ≤.1, **p ≤.05,***p ≤.01
2.4 Graduation Outcomes

IMPAQ International, LLC Page | 12 ISA Outcome Study Final Report
Our analysis indicates that ISA had a positive effect on graduation as well. As shown in Figure 4 below, our estimates suggest that ISA increased the percentage of students who graduated from high school within four years from 67 percent in the comparison group to 71 percent among ISA students, a difference of four percentage points. However, there were no statistically significant differences between ISA and comparison students on attainment of advanced high school diplomas,8 graduation test scores or dropout rates. Figure 4: Graduation Outcomes
2.5 Outcomes for High Implementing ISA Schools In addition to the primary impact analyses conducted with the total school sample discussed above, we conducted subgroup analyses for a set of “high implementation” ISA schools. ISA program staff rated all of the ISA schools in our sample as having low, medium or high levels of implementation. The implementation levels were determined by ISA staff based on the information from the ISA school review process and reports and staff’s knowledge (e.g. through coaches or program staff experience with the school) of the schools’ success in implementation and adherence to the model and seven principles. Based on these data, ISA staff classified fourteen of the 27 schools in our sample as high implementation sites, 12 as medium implementation sites, and one as a low implementation site.
8 NYC offers advanced diplomas to students who pass three additional regents exams (in science, math and a
foreign language) and earn at least six foreign language and three elective credits.
71.1% 67.2%
0.0%
10.0%
20.0%
30.0%
40.0%
50.0%
60.0%
70.0%
80.0%
90.0%
100.0%
ISA** Comparison
**p ≤.05
4-Year Cohort Graduation Rate

IMPAQ International, LLC Page | 13 ISA Outcome Study Final Report
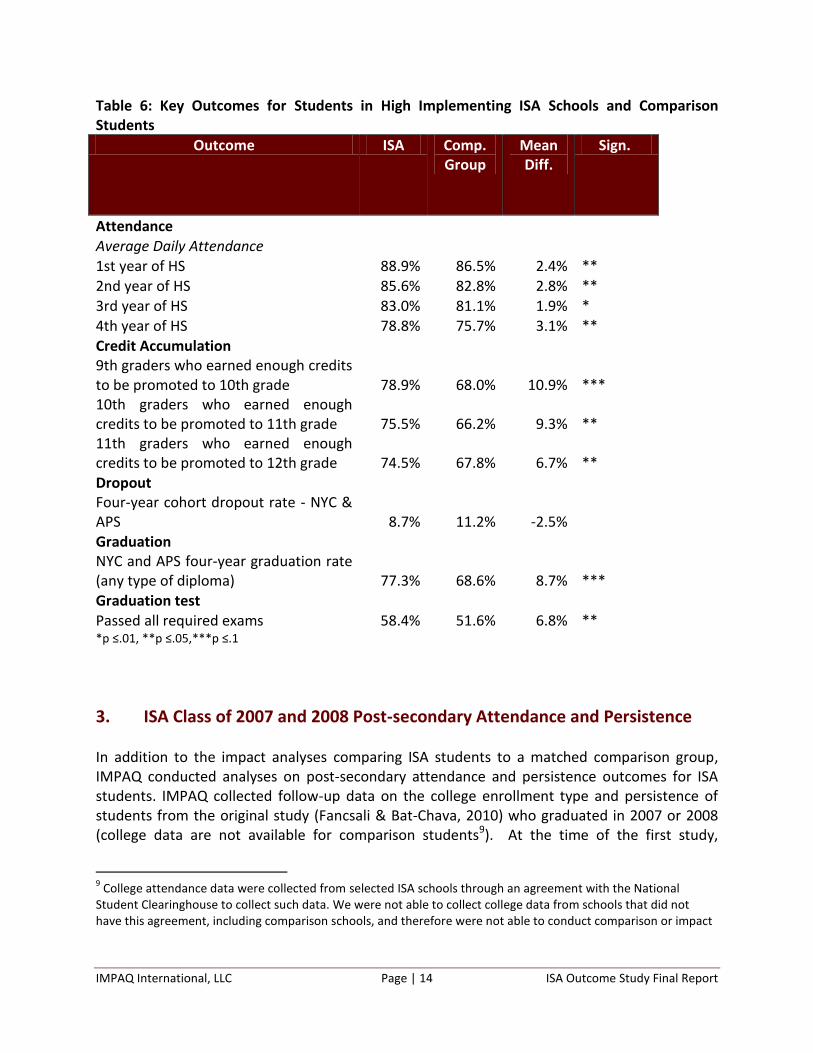
We hypothesized that the positive effect of ISA on student outcomes would be greater for schools with stronger levels of implementation. Though it is not possible to attribute these differences to the differences in implementation, our analysis appears to confirm this hypothesis. Estimated effects on student attendance, dropout, and graduation rates appeared to be stronger at schools with high levels of implementation (see Table 6). For example:
In the full sample, ISA students outperformed their peers in grade 11 attendance only. ISA students in high implementing schools outperformed their comparison peers on attendance at each grade level.
In the full sample, ISA students outperformed their peers in the percentage who earned enough credits to be promoted to the next grade by between 6 and 9 points. The difference between high implementing ISA schools and their comparison schools was between 7 and 11 percentage points.
In terms of dropout rates, ISA schools in the full sample had dropout rates that were less than 1 percent lower than those of their comparison schools. For high implementing schools, the difference between ISA schools and their comparable peers was -2.5% points.
ISA students in the full sample outperformed their comparison peers on graduation rates by four percentage points. For high implementing schools, the difference was nine percentage points. (See Appendix E for additional findings for high implementing schools).
IMPAQ International, LLC Page | 14 ISA Outcome Study Final Report
Table 6: Key Outcomes for Students in High Implementing ISA Schools and Comparison Students
Outcome ISA Comp. Group
Mean Diff.
Sign.
Attendance Average Daily Attendance 1st year of HS 88.9% 86.5% 2.4% **
2nd year of HS 85.6% 82.8% 2.8% ** 3rd year of HS 83.0% 81.1% 1.9% * 4th year of HS 78.8% 75.7% 3.1% **
Credit Accumulation 9th graders who earned enough credits
to be promoted to 10th grade 78.9% 68.0% 10.9% *** 10th graders who earned enough credits to be promoted to 11th grade 75.5% 66.2% 9.3% ** 11th graders who earned enough credits to be promoted to 12th grade 74.5% 67.8% 6.7% ** Dropout
Four-year cohort dropout rate - NYC & APS 8.7% 11.2% -2.5%
Graduation NYC and APS four-year graduation rate
(any type of diploma) 77.3% 68.6% 8.7% *** Graduation test
Passed all required exams 58.4% 51.6% 6.8% ** *p ≤.01, **p ≤.05,***p ≤.1
3. ISA Class of 2007 and 2008 Post-secondary Attendance and Persistence In addition to the impact analyses comparing ISA students to a matched comparison group, IMPAQ conducted analyses on post-secondary attendance and persistence outcomes for ISA students. IMPAQ collected follow-up data on the college enrollment type and persistence of students from the original study (Fancsali & Bat-Chava, 2010) who graduated in 2007 or 2008 (college data are not available for comparison students9). At the time of the first study,
9 College attendance data were collected from selected ISA schools through an agreement with the National
Student Clearinghouse to collect such data. We were not able to collect college data from schools that did not have this agreement, including comparison schools, and therefore were not able to conduct comparison or impact

IMPAQ International, LLC Page | 15 ISA Outcome Study Final Report
students had been out of high school for one or two years. In 2011, these same students had been out of high school for three or four years. Data from the National Student Clearinghouse indicate that the majority of ISA graduates from the original study who went to college are attending four-year colleges and persisting in college, and that they are doing so at much higher rates than students nationwide,10 despite representing a much larger population of poor and minority urban youth than students nationwide. Figure 5: College enrollment type
28% 37% 43%
72% 63% 57%
0%
20%
40%
60%
80%
100%
120%
ISA Class of 2007 ISA Class of 2008 National
Two- and Four-Year College Enrollment
4-Year College
2-Year College
As shown in Figure 5, college students from the ISA class of 2007and 2008 enrolled in four-year schools at a much high rate than students nationwide. This is an important outcome for students, as a four-year degree is associated with better economic and employment outcomes. Persistence rates were higher for ISA students than students nationwide as well. As shown in Figure 6, 88% of the class of 2007 college enrollees and 89% of the class of 2008 college enrollees persisted into the second year of study. This compares with only 77% of students nationwide in 2009.
analyses on college enrollment and persistence. Thus, the analyses of college enrollment are not as rigorous as the impact analyses conducted on high school outcomes for this study and they do not suggest causality.
10 National data in figures 5-6 are from the National Student Clearinghouse Research Center Signature Report
(Dunbar, et. al, 2011).

IMPAQ International, LLC Page | 16 ISA Outcome Study Final Report
Figure 6: College Persistence
89% 88%77%
0%
20%
40%
60%
80%
100%
ISA Class of 2007 ISA Class of 2008 National
College Persistence Rate (fall of first year to fall of second year)
Similarly, show in Figure 7, four-fifths or more of ISA students who enrolled in college were still enrolled or had graduated three and four years later (for the class of 2008 and 2007 respectively). Only one-fifth of students in either ISA class dropped out of college. This is impressive given the estimated 25% dropout rate nationwide for students in four-year schools and 50% nationwide dropout rate for students in two-year programs (Venezia, Kirst, & Antonio, 2003). Figure 7: College Outcomes
81% 80%
19% 20%
0%
20%
40%
60%
80%
100%
120%
Class of 2007 Class of 2008
College Outcomes for ISA Students
No longer enrolled
Graduated or still enrolled

IMPAQ International, LLC Page | 17 ISA Outcome Study Final Report
CONCLUSIONS The findings from this study show sustained positive impacts of ISA on high school student achievement including attendance, credit accumulation, grade promotion and graduation rates. ISA students outperformed their peers in closely matched non-ISA schools, controlling for background factors such as 8th grade achievement. Findings related to ISAs impact on credit accumulation and staying on-track for graduation at the end of 9th grade are particularly important given that the 9th grade is a critical transition period and on-track status is highly predictive of high school success and graduation. Further, ISA schools had higher graduation rates than NYC and APS districts as a whole. As expected, the impact of ISA on student outcomes was greater for high implementing schools. These findings are consistent with the positive findings from the 2010 study of ISA (Fancsali & Bat-Chava, 2010). They are also consistent with another recently completed rigorous study of the small high schools in New York City that included ISA schools in its sample (Bloom & Unterman, 2012). Both of these prior studies found positive effects on attendance, credit accumulation, promotion to the next grade and graduation, corroborating the positive findings for ISA schools in the current study. The findings from the current study are impressive for several reasons. First, the size of the effects of ISA on many outcomes are meaningful and statistically significant, and span several key outcome areas indicating that ISA has an impact student achievement broadly by improving students’ engagement and persistence in high school and beyond. Second, this study was conducted on a much larger sample of schools and students than the first study, and in two large urban school districts that serve high-need students. This suggests that as ISA has scaled up considerably to include many new schools and districts, the model has not been watered down or diminished in its implementation. Further, it suggests that ISA is an effective model of school reform in different contexts and is not limited to specific circumstances of a single district (NYC). Taken together, the positive findings from two quasi-experimental studies of ISA and supporting evidence from an experimental study of small high schools in NYC that included ISA schools in the sample indicate that ISA holds promise as an effective school reform model in districts across the country, and that it has the potential to make a difference for at-risk students’ success in high school and beyond. These are particularly salient findings as the standards and expectations in education increase nationwide, and all schools will be challenged to achieve and maintain strong outcomes for students.

IMPAQ International, LLC Page | 18 ISA Outcome Study Final Report
WORKS CITED
Allensworth, E.M., and Easton, J.Q. (2005). The on-track indicator as a predictor of high school
graduation. Chicago, IL: Consortium on Chicago School Research. Retrieved September 1, 2010, from http://ccsr.uchicago.edu/publications/p78.pdf
Bloom, H. and Unterman, B. (2012). Sustained positive effects on graduation rates produced by
New York City’s small public high schools of choice. New York: MDRC. Dunbar, A., Hossler, D., Shapiro, D., Chen, J., Martin, S., Torres, V., Zerquera, D., Ziskin, M.
(2011). National postsecondary enrollment trends before, during, and after the great recession: Signature report. National Student Clearinghouse Research Center: Herndon VA. http://www.studentclearinghouse.info/signature/1/NSC_Signature_Report_1.pdf
Fancsali, C. and Bat-Chava, Y. (2010). Findings from the Institute for Student Achievement
outcome evaluation final report. New York, NY: Academy for Educational Development. Neild, R., & Balfanz, R. (2001). An extreme degree of difficulty: The educational challenge of the
ninth grade in Philadelphia’s neighborhood high schools. Baltimore: Johns Hopkins University, Center for Social Organization of Schools.
Parthenon Group. (2005). NYC secondary reform selected analysis. New York: New York City Department of Education.
Roderick, M. (2006). Closing the aspirations-attainment gap: Implications for high school reform. Chicago: Consortium on Chicago School Research.
Venezia, Andrea, Michael Kirst, and Anthony L. Antonio (2003). Betraying the college dream: How disconnected K-12 and postsecondary education systems undermine student aspirations. Final policy report for Stanford University’s Bridge Project. Stanford, Calif.: The Stanford Institute for Higher Education Research. www.stanford.edu/group/bridgeproject/betrayingthecollegedream.pdf

IMPAQ International, LLC Page | 19 ISA Outcome Study Final Report
APPENDIX A: ISA AND COMPARISON STUDENT DEMOGRAPHIC CHARACTERISTICS
Appendix Table A1: Mean school level student demographic characteristics for NYC ISA and matched comparison group sample
Characteristic NYC ISA (n=18 schools)
Comparison Group (n=55 schools)
Gender
Males 50.5% 50.8%
Females 49.5% 49.2%
Race/ethnicity
African America 58.3% 58.0%
Latino 34.8% 35.3%
White 2.7% 2.3%
Asian 3.2% 3.5%
Other 1.0% 0.9%
Percent ever eligible for Free/Reduced Lunch
85.7% 84.5%
Overage for grade at 9th
grade
1.6% 1.6%
8th
Grade Avg Attendance 85.6% 84.2%
8th
proficient in Math 628.2 624.1
8th
grade proficient ELA 625.4 621.3
Percent ever classified as English language learner
8.1% 8.1%
Percent ever classified as Special Ed
13.8% 12.2%

IMPAQ International, LLC Page | 20 ISA Outcome Study Final Report
Appendix Table A2: Mean school level student demographic characteristics for APS ISA and matched comparison group sample
Characteristic APS ISA (n=9 schools) Comparison Group (n=15 schools)
Gender
Males 50.0% 48.9%
Females 50.0% 51.1%
Race/ethnicity
African America 97.3% 98.3%
Latino 2.0% 1.0%
White 0.4% 0.3%
Asian 0.09% 0.02%
Other 0.3% 0.4%
Percent ever eligible for Free/Reduced Lunch
82.8% 75.9%
Overage for grade at 9th
grade
0.2% 0.2%
8th
proficient in Math 317.4 317.9
Percent ever classified as English language learner
0.7% 0.5%
Percent ever classified as Special Ed
11.7% 10.8%
IMPAQ International, LLC Page | 21 ISA Outcome Study Final Report
APPENDIX B: UNADJUSTED MEANS ON KEY OUTCOMES FOR NYC AND APS ISA STUDENTS AND THEIR MATCHED COMPARISONS
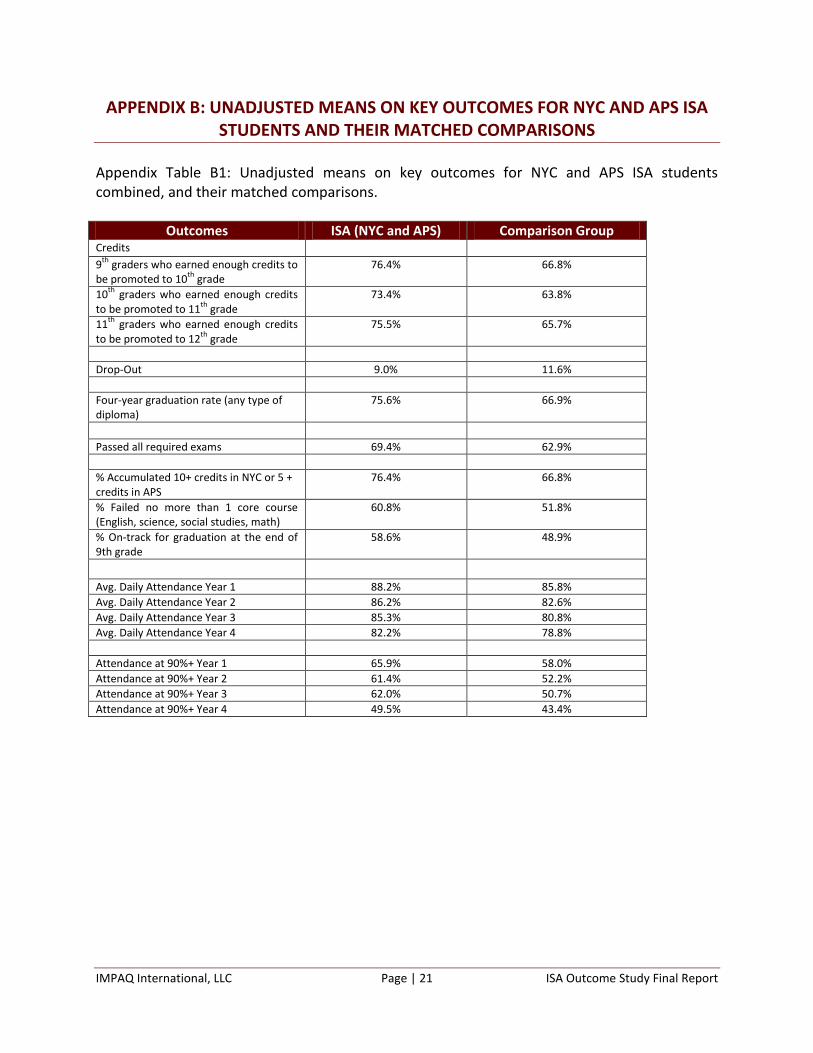
Appendix Table B1: Unadjusted means on key outcomes for NYC and APS ISA students combined, and their matched comparisons.
Outcomes ISA (NYC and APS) Comparison Group Credits 9
th graders who earned enough credits to
be promoted to 10th
grade 76.4% 66.8%
10th
graders who earned enough credits to be promoted to 11
th grade
73.4% 63.8%
11th
graders who earned enough credits to be promoted to 12
th grade
75.5% 65.7%
Drop-Out 9.0% 11.6%
Four-year graduation rate (any type of diploma)
75.6% 66.9%
Passed all required exams 69.4% 62.9%
% Accumulated 10+ credits in NYC or 5 + credits in APS
76.4% 66.8%
% Failed no more than 1 core course (English, science, social studies, math)
60.8% 51.8%
% On-track for graduation at the end of 9th grade
58.6% 48.9%
Avg. Daily Attendance Year 1 88.2% 85.8%
Avg. Daily Attendance Year 2 86.2% 82.6%
Avg. Daily Attendance Year 3 85.3% 80.8%
Avg. Daily Attendance Year 4 82.2% 78.8%
Attendance at 90%+ Year 1 65.9% 58.0%
Attendance at 90%+ Year 2 61.4% 52.2%
Attendance at 90%+ Year 3 62.0% 50.7%
Attendance at 90%+ Year 4 49.5% 43.4%
IMPAQ International, LLC Page | 22 ISA Outcome Study Final Report
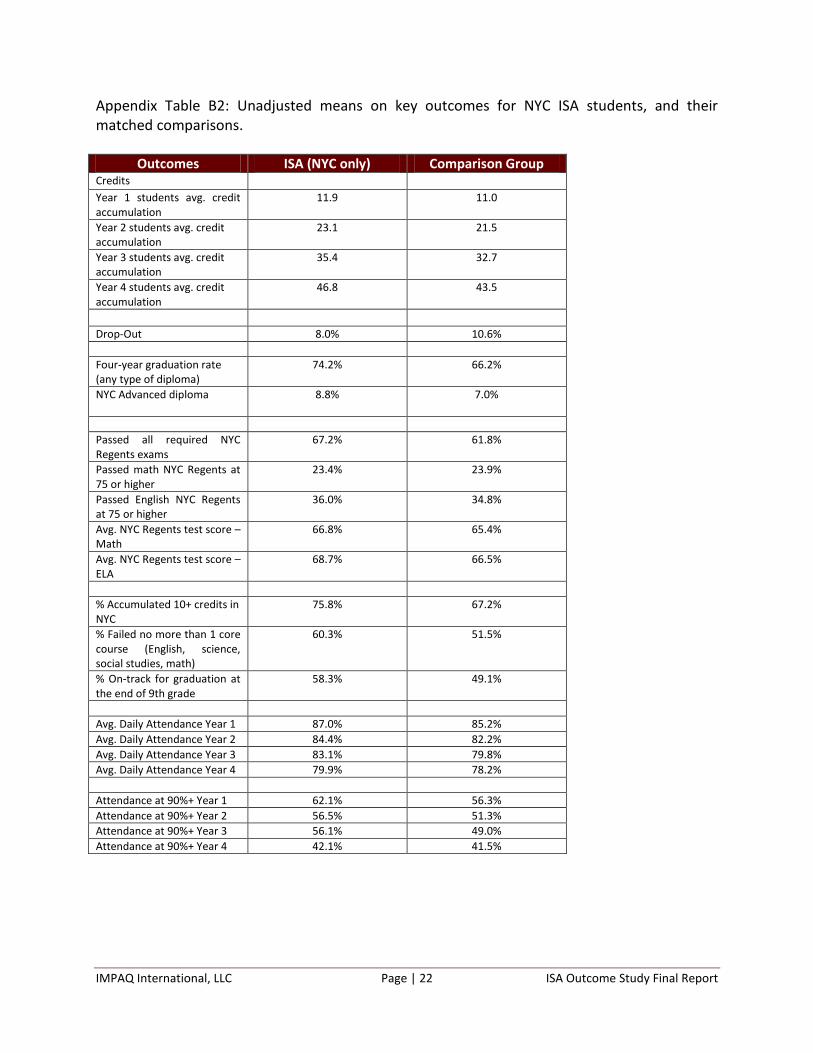
Appendix Table B2: Unadjusted means on key outcomes for NYC ISA students, and their matched comparisons.
Outcomes ISA (NYC only) Comparison Group Credits Year 1 students avg. credit accumulation
11.9 11.0
Year 2 students avg. credit accumulation
23.1 21.5
Year 3 students avg. credit accumulation
35.4 32.7
Year 4 students avg. credit accumulation
46.8 43.5
Drop-Out 8.0% 10.6%
Four-year graduation rate (any type of diploma)
74.2% 66.2%
NYC Advanced diploma
8.8% 7.0%
Passed all required NYC Regents exams
67.2% 61.8%
Passed math NYC Regents at 75 or higher
23.4% 23.9%
Passed English NYC Regents at 75 or higher
36.0% 34.8%
Avg. NYC Regents test score – Math
66.8% 65.4%
Avg. NYC Regents test score – ELA
68.7% 66.5%
% Accumulated 10+ credits in NYC
75.8% 67.2%
% Failed no more than 1 core course (English, science, social studies, math)
60.3% 51.5%
% On-track for graduation at the end of 9th grade
58.3% 49.1%
Avg. Daily Attendance Year 1 87.0% 85.2%
Avg. Daily Attendance Year 2 84.4% 82.2%
Avg. Daily Attendance Year 3 83.1% 79.8%
Avg. Daily Attendance Year 4 79.9% 78.2%
Attendance at 90%+ Year 1 62.1% 56.3%
Attendance at 90%+ Year 2 56.5% 51.3%
Attendance at 90%+ Year 3 56.1% 49.0%
Attendance at 90%+ Year 4 42.1% 41.5%

IMPAQ International, LLC Page | 23 ISA Outcome Study Final Report
Appendix Table B3: Unadjusted means on key outcomes for APS ISA students, and their matched comparisons.
Outcomes ISA (APS only) Comparison Group Credits Year 1 students avg. credit accumulation
6.5 5.4
Year 2 students avg. credit accumulation
13.1 11.6
Year 3 students avg. credit accumulation
19.8 18.6
Year 4 students avg. credit accumulation
30.3 28.3
Drop-Out 13.3% 23.0%
Four-year graduation rate (any type of diploma)
82.5% 74.8%
Passed all required GHSGT exams
81.8% 79.1%
Passed math GHSGT at the advanced level (525 or above)
36.9% 36.9%
Passed ELA GHSGT at the advanced level (235 or above)
28.2% 36.7%
MATH GHSGT mean score 523.0 522.3
ELA GHSGT mean score 224.2 224.4
% Accumulated 5 + credits in APS
79.5% 63.1%
% Failed no more than 1 core course (English, science, social studies, math)
63.7% 54.6%
% On-track for graduation at the end of 9th grade
60.3% 47.0%
Avg. Daily Attendance Year 1 94.2% 90.9%
Avg. Daily Attendance Year 2 92.9% 86.2%
Avg. Daily Attendance Year 3 90.9% 86.8%
Avg. Daily Attendance Year 4 93.5% 87.2%
Attendance at 90%+ Year 1 84.8% 74.6%
Attendance at 90%+ Year 2 80.3% 59.9%
Attendance at 90%+ Year 3 77.6% 60.5%
Attendance at 90%+ Year 4 85.7% 68.7%

IMPAQ International, LLC Page | 24 ISA Outcome Study Final Report
APPENDIX C: COMPARISON GROUP MATCHING PROCEDURES This section describes the matching procedures used to identify comparable student sample for ISA students in 18 ISA schools in New York City (NYC) and 9 in Atlanta. The analytic sample was identified through a two-stage matching processes, first at the school level and then at the student level. The stepwise matching allowed us to identify non-ISA schools that share similar characteristics with ISA schools and form a student sample with comparable traits within the matched schools.
1. ISA school-level matching The study includes 18 ISA schools in NYC and 9 in Atlanta that were matched with one or more non-ISA schools in their respective district. For the 18 ISA schools in NYC, we selected matched schools from a pool of 212 non-ISA public schools that served 9th grade or above between 2006-07 and 2009-10, without special enrollment requirements. With a pool of 230 ISA and non-ISA schools, we used the nearest neighbor matching method with replacement to form the analytic sample11. This procedure uses a logistic regression model to estimate the propensity of being an ISA school based on a selection of baseline characteristics, including
Demographics – % male, % Asian, % Hispanic, % Black, % eligibility for free or reduced
price lunch (FRPL), % limited English proficiency status (LEP), % overage students and
school enrollment
Prior achievement – 8th grade English language arts achievement, 8th grade mathematic
achievement, 8th grade attendance
School size
The dependent variable was a binary variable indicating the school’s ISA status. Based on the coefficients from the logistic regression model, a predicted propensity score was generated for every school and ordered from the highest to the lowest. The pairs of ISA and non-ISA school with the smallest difference between them were chosen for the school sample. By allowing for replacement, we matched some non-ISA schools to more than one ISA school if they show the closest propensity scores to multiple ISA schools. We examined the matching results by checking the differences in each of the baseline characteristics identified above. Given that the propensity scores is a predicted composite score, some non-ISA schools that were considered comparable based on their propensity scores could differ substantially from the corresponding ISA schools on specific characteristics. To ensure matched schools were not only close in their propensity scores but also similar on
11 In addition to nearest neighbor method, analytic samples were also generated through covariate matching, propensity score matching using caliper and radius with and without replacement, and the combination of covariate and propensity score matching. We chose the results of nearest neighbor matching with replacement because it generated the sample with the most balanced characteristics between ISA and non-ISA schools.

IMPAQ International, LLC Page | 25 ISA Outcome Study Final Report
specific school characteristics, we used additional screening criteria to select final matches from the non-ISA schools that were identified in the propensity score matching process. First, ISA schools and their matched non-ISA schools had to have prior (8th grade) achievement test scores that fall within .2 standard deviations of each other. Additionally, the demographics variables (gender, race, FRPL, LEP and percent over age for grade) of the matched schools had to fall within 20 percentage points of each other. If there was no non-ISA school identified in the propensity score matching process that had prior achievement within .2 standard deviations of the ISA school, we chose the non-ISA school with the closest prior achievement and with less than a 20 percentage point difference on the demographic characteristics. If no non-ISA school met this criterion, we chose the non-ISA school that had prior achievement closest to that of the matched ISA school and had no more than a 20 percentage point difference on the most prevalent racial or ethnic groups at the corresponding ISA school. Given the limited number of high schools in Atlanta, propensity score matching was not performed to identify matched schools in Atlanta. Non-ISA schools were matched to ISA schools who had no greater than a 20 percentage point difference on the demographic matching variables (gender, race, FRPL, LEP and overage) and within .2 standard deviations of 8th grade prior achievement12.
2. ISA Student level matching ISA and non-ISA students were matched within each school block (comprising one ISA school and its matched non-ISA school(s)) using the following variables –
Demographics – Gender, Asian, Hispanic, Black, eligibility for free or reduced price lunch
(FRPL), receiving special education services (SPED), limited English proficiency status
(LEP), overage for grade
Prior achievement13 – 8th grade English language arts achievement, 8th grade
mathematic achievement, 8th grade attendance
The student matching process was similar to the school-level matching. We generated propensity scores using logistic regression to form a student-level matching sample using the nearest neighbor method. The propensity score was generated for each district separately based on the 9th grade student sample from all matched schools in each cohort. There were four cohorts of 9th grade students in NYC, one in each year from the 2006-07 to the 2009-10 school year, and two cohorts in Atlanta, one in each year from the 2006-07 to the 2007-08 school year (Table C1).
12 In Atlanta, 8th grade mathematic achievement is the only indicator for school-level prior achievement.
13 In Atlanta, 8th grade mathematic achievement is the only indicator for student-level prior achievement.

IMPAQ International, LLC Page | 26 ISA Outcome Study Final Report
Appendix Table C1. Student Cohorts by Study Year, School Year and District
NYC Year 1 (9th grade) Year 2 Year 3 Year 4
2006-07 SY Cohort 1
2007-08 SY Cohort 2 Cohort 1
2008-09 SY Cohort 3 Cohort 2 Cohort 1
2009-10 SY Cohort 4 Cohort 3 Cohort 2 Cohort 1
APS Year 1 (9th grade) Year 2 Year 3 Year 4
2006-07 SY Cohort 1
2007-08 SY Cohort 2 Cohort 1
For each of the four cohorts in NYC, we generated the propensity scores using a logistic regression where the dependent variable was a student’s enrollment in an ISA school and the independent variables were the matching variables listed above. In NYC, the 11 matching variables were Gender, Asian, Hispanic, Black, LEP, FRPL, SPED, overage for grade, 8th grade English language arts achievement, 8th grade mathematic achievement, 8th grade attendance. For each of the two cohorts in Atlanta, we used similar logistic regressions except that 8th grade mathematics achievement was the only prior achievement indicator available. Prior achievement (8th grade) in ELA and 8th grade attendance data were not available from APS at the time of data collection. Students were matched within school blocks using the nearest neighbor method allowing for replacement. A non-ISA student was allowed to match with multiple ISA students if their schools were matched. Because ISA is a school-level intervention, it is important that matched students are comparable when they are aggregated to the school level. Therefore, we pooled the matched student samples across cohorts and checked the balance on each matching variable at the school level. Table C2 shows the means and mean differences of matching variables between the ISA and the matched non-ISA schools based on the aggregated matched student sample in both districts. Lastly, we used the joint significance test to assess the balance of matching variables for the student sample in each school year14. The joint significance test is an omnibus F test based on logistic regression where the student status of enrolling in an ISA school was the outcome variable and the student demographic variables were the predictors. The omnibus tests shows if the set of student demographic variables included in the logistic regression predicts the
14 For 2006-07 and 2007-08 school year, student samples in NYC and Atlanta are collapsed for testing. Atlanta only has two cohorts in the two years. For 2008-09 and 2009-10 school year. student samples are from NYC exclusively.

IMPAQ International, LLC Page | 27 ISA Outcome Study Final Report
membership of a student enrolled in an ISA school. The omnibus test were not statistically significant (p<.05) for student samples in all four school years which suggests the ISA and non-ISA students have comparable characteristics as defined by the student demographic variables. Appendix Table C2. Weighted demographic and achievement characteristics of matched student sample, aggregated at school level
%Male %Asian %Hispanic %Black %Special
Ed %LEP %FRPL %Overage
Math mean score
ISA 0.50 0.02 0.38 0.57 0.12 0.09 0.76 0.02 569.87
Non-ISA 0.50 0.02 0.38 0.58 0.12 0.09 0.76 0.02 569.94
ISA and non-ISA differences are not statistically significant (p<.05)

IMPAQ International, LLC Page | 28 ISA Outcome Study Final Report
APPENDIX D: ANALYTIC APPROACH We organized our analyses around the effects of the ISA program on the following student outcomes:
attendance
credit accumulation
on-track status at the end of 9th grade
dropout
graduation
performance on graduation test
Since ISA is a school-wide intervention, we measured the program effects on student outcomes at the school level using a 2-level random-intercept linear model where students are embedded within schools. At the student level (level-1), we estimated the student outcome within each cohort if multiple cohorts of students have data for the outcome. The cohort coefficients were estimated as fixed effects and the between-school variances of the outcome between schools were fixed to zero. The intercept, the true value of the outcome or the true outcome mean of the baseline year if there were more than one cohort, was estimated as a random effect, i.e., the intercept vary systematically between schools. The generic model for the primary analyses is as follows: Level-1 (All level-1 covariates were grand mean centered)
ijij
m
m
mjjij rCohorty 1
0
Or for binary outcomes
jijjij yprobyprob 1/log ijij
m
m
mjj rCohort 1
0
Level-2 (All level-2 covariates will be grand mean centered except for the treatment variable)
j
n
n
jnjj
jjjjj
uBlockSPEDFRPL
OtherHispanicBlackTreatment
0
7
00706
05030201000
%%
%%%
101 j
…
0mmj

IMPAQ International, LLC Page | 29 ISA Outcome Study Final Report
APPENDIX E: RESULTS OF SUB-GROUP ANALYSES FOR HIGH IMPLEMENTING ISA SCHOOLS
In addition to the primary analyses conducted with the total school sample, we conducted subgroup analyses on ISA schools with high ratings of implementation. ISA program staff rated all of the ISA schools in our sample as low, medium or high implementers. Fourteen of the 27 schools in our sample were rated as schools with high implementation, 12 were rated as schools with a medium level of implementation and one was rated as a school with a low level of implementation. We hypothesized that the positive effect of ISA on student outcomes would be greater for schools with stronger levels of implementation. Appendix Table E1 shows the results for the subgroup analyses conducted on high implementers. Confirming our hypothesis, schools with high levels of implementation had larger effects on the dropout and graduation rates and performance on graduation tests. For example, among all schools, ISA had a .6% point lower dropout rate than comparison schools. For high implementing schools, the difference between ISA schools and their comparable peers was 2.5% points.

IMPAQ International, LLC Page | 30 ISA Outcome Study Final Report
Appendix Table E1. Outcome Analyses for high implementing ISA schools
Outcome ISA # ISA schs
Comp. Group
# Non-ISA schs
Mean Diff.
SD Effect size
Sign.
Attendance Average Daily Attendance 1st year of HS 88.9% 14 86.5% 41 2.4% 0.18 0.14 **
2nd year of HS 85.6% 14 82.8% 41 2.8% 0.21 0.13 ** 3rd year of HS 83.0% 14 81.1% 41 1.9% 0.23 0.08 * 4th year of HS 78.8% 10 75.7% 33 3.1% 0.23 0.13 ** Regular attendance (90%+)
1st year of HS 70.4% 14 59.7% 41
10.7% 0.50 0.22 **
2nd year of HS 63.3% 14 52.3% 41 11.0
% 0.50 0.22 ** 3rd year of HS 56.6% 14 48.1% 41 8.6% 0.50 0.17 ** 4th year of HS 44.9% 10 37.6% 33 7.3% 0.50 0.15
Credit 9th graders who earned
enough credits to be promoted to 10th grade 78.9% 14 68.0% 41
10.9% 0.47 0.23 ***
10th graders who earned enough credits to be promoted to 11th grade 75.5% 14 66.2% 41 9.3% 0.48 0.19 ** 11th graders who earned enough credits to be promoted to 12th grade 74.5% 14 67.8% 41 6.7% 0.47 0.14 ** On-track for graduation
% Accumulated 10+ credits in NYC or 5 + credits in APS 78.9% 14 68.0% 41
10.9% 0.47 0.23 ***
% Failed no more than 1 core course (English, science, social studies, math) 58.0% 14 52.4% 41 5.6% 0.50 0.11
% On-track for graduation at the end of 9th grade 55.5% 14 48.5% 41 7.0% 0.50 0.14 * Dropout
Four-year cohort dropout rate - NYC & APS 8.7% 10 11.2% 33 -2.5% 0.33 -0.08
Graduation NYC and APS four-year 77.3% 10 68.6% 33 8.7% 0.47 0.19 ***

IMPAQ International, LLC Page | 31 ISA Outcome Study Final Report
Outcome ISA # ISA schs
Comp. Group
# Non-ISA schs
Mean Diff.
SD Effect size
Sign.
graduation rate (any type of diploma) Graduation test
Passed all required exams 58.4% 10 51.6% 33 6.8% 0.48 0.14 ** *p ≤.01, **p ≤.05,***p ≤.1