Embed Size (px)
Citation preview

Institutional Determinants of the Retirement Patterns of China’s Urban and Rural Residents
John Giles, Xiaoyan Lei, Yafeng Wang, Yaohui Zhao
October 2012
1
Introduction• China is facing the challenge of rapid population aging, which threatens to slow economic growth
• The projected sharp rise in the old‐age dependency burden can be alleviated if the working life can be extended
• The length of working life depends on many factors, labor supply (health, preferences and wealth), demand (mainly firm behavior), and institutions
2

This Paper• Focuses on institutions, whose role is most evident when comparing the retirement patterns of urban and rural residents– Giles, Cai, Wang (2012), using 2008 CHARLS pilot, conclude that the differing retirement patterns of older workers in ruraland urban China stem from two different retirement systems
• Utilizes CHARLS national baseline data and takes a closer look at different features of institutions that cause retirement patterns to diverge– Worker’s retirement policy
– Long‐standing economic and social policies that put rural residents at great disadvantage relative to their urban counterparts 3

Paper Structure• Data and descriptive of retirement patterns
• Institutions: Retirement policy for urban workers– Hazards of retirement
– Early retirement and internal retirement
• Institutions: economic resources– Pension coverage and generosity
– Economic divide
• Wealth gap
• Children gap
– Expectations on sources of elderly support
4

• HRS‐type survey• Biennial panel• Nationally representative of population over age 45• Multi‐stage PPS random sampling
– Counties, Villages, Households, individuals• Pilot survey in 2008: Zhejiang and Gansu• Baseline survey in 2011‐2012: 10,257 households, 17,708 respondents– 150 counties in 28 provinces– Tibet, Hongkong, Macau and Taiwan were excluded– Hainan and Ningxia had no counties sampled
Data: China Health and Retirement Longitudinal Study (CHARLS)
5

County distribution

Questionnaire Structure
• Demographics• Family structure/transfers• Health status and physical functioning• Biomarkers• Health care and insurance• Work, retirement and pension• Income and consumption• Assets (individual and household)• Community survey• Policy survey
7

8
CHARLS 2011‐2012 Sample Size and Response Rate
Total Rural UrbanAssigned households 23,422 10,597 12,825Age eligible rate(%) 66.8 73.8 59Response rate(%) (cv complete) 82.5 95.1 71.7
Sample Households 10,509 6,094 4,415Response rate(%) (main module complete) 80.5 94.1 68.6
Sample Households 10,257 6,033 4,224

The Retirement Patterns
9

Key Definitions• An individual is retired if once worked but is not currently active
in any of these economic activities: farming, employed, self‐
employed and unpaid family business, unemployed, and other
employments (includes part‐time job).
• Processed administrative retirement
– If “yes” to the question “Have you completed retirement
procedures (including early retirement) or internal
retirement?”
10

Work Status – All Respondents
11
12
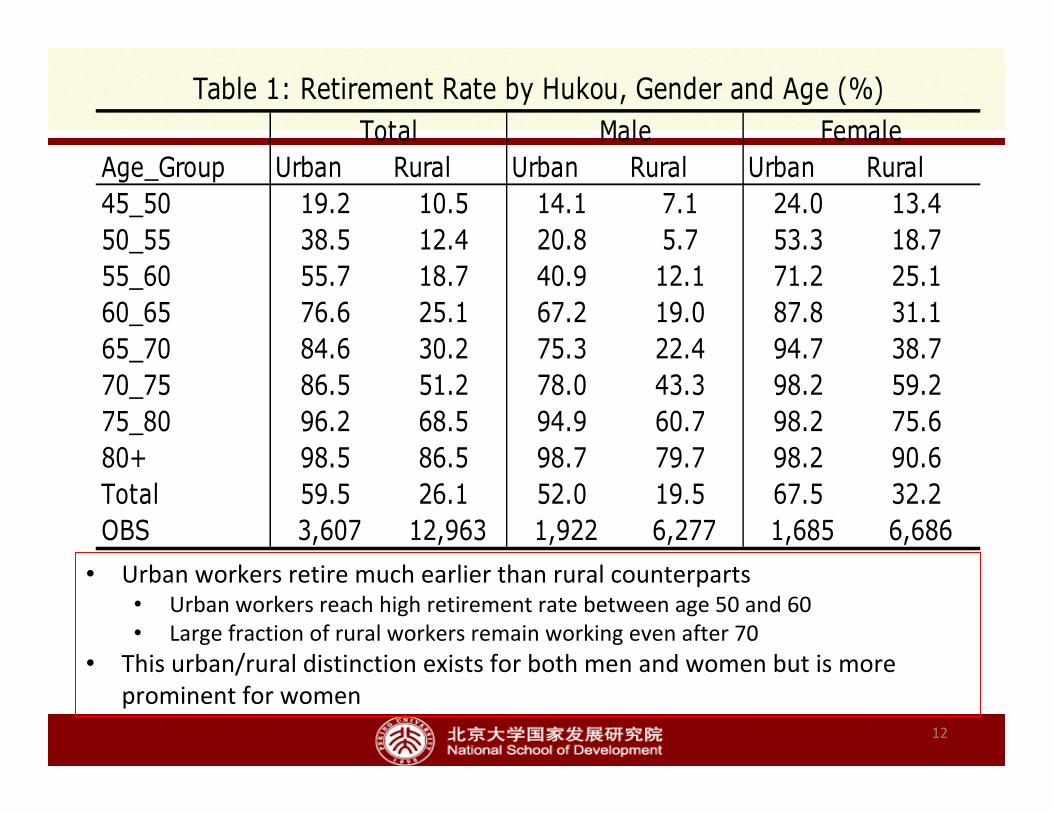
Age_Group Urban Rural Urban Rural Urban Rural45_50 19.2 10.5 14.1 7.1 24.0 13.450_55 38.5 12.4 20.8 5.7 53.3 18.755_60 55.7 18.7 40.9 12.1 71.2 25.160_65 76.6 25.1 67.2 19.0 87.8 31.165_70 84.6 30.2 75.3 22.4 94.7 38.770_75 86.5 51.2 78.0 43.3 98.2 59.275_80 96.2 68.5 94.9 60.7 98.2 75.680+ 98.5 86.5 98.7 79.7 98.2 90.6Total 59.5 26.1 52.0 19.5 67.5 32.2OBS 3,607 12,963 1,922 6,277 1,685 6,686
Table 1: Retirement Rate by Hukou, Gender and Age (%)Total Male Female
• Urban workers retire much earlier than rural counterparts• Urban workers reach high retirement rate between age 50 and 60• Large fraction of rural workers remain working even after 70
• This urban/rural distinction exists for both men and women but is more prominent for women

13
• Graphically...
0
20
40
60
80
100
45 50 55 60 65 70 75 80Age
Urban
Rural
%
Total
0
20
40
60
80
100
45 50 55 60 65 70 75 80Age
Urban Male
Rural Male
Urban Female
Rural Female
%
Gender and Hukou
Retirement Rate by Age, Hukou, and Gender

020406080
100
BelgiumFrance
Germany ItalyCanada
USAJapan
South KoreaIndia
Indonesia CH
CH Rural
CH Urban
%
Male
45-49 50-54 55-59 60-64 65+
020406080
100
BelgiumFrance
Germany ItalyCanada
USAJapan
South KoreaIndia
Indonesia CH
CH Rural
CH Urban
%
Female
45-49 50-54 55-59 60-64 65+
Data for China comes from CHARLS (Weighted), data for other countries come from "An Aging World: 2008", issued by NIA of NIH, U.S. Department of Health and Health Services
Retirement Rate by Country, Gender, and Age
International Perspective:
14
• Urban Chinese men not only retire earlier than men of other developing countries, but also earlier than men in developed countries, including the U.S. , South Korea and Japan, and show patterns similar to Western Europe

020406080
100
BelgiumFrance
Germany ItalyCanada
USAJapan
South KoreaIndia
Indonesia CH
CH Rural
CH Urban
%
Male
45-49 50-54 55-59 60-64 65+
020406080
100
BelgiumFrance
Germany ItalyCanada
USAJapan
South KoreaIndia
Indonesia CH
CH Rural
CH Urban
%
Female
45-49 50-54 55-59 60-64 65+
Data for China comes from CHARLS (Weighted), data for other countries come from "An Aging World: 2008", issued by NIA of NIH, U.S. Department of Health and Health Services
Retirement Rate by Country, Gender, and AgeInternational Perspective
15
• Urban Chinese women retire even earlier than Western European women

020406080
100
BelgiumFrance
Germany ItalyCanada
USAJapan
South KoreaIndia
Indonesia CH
CH Rural
CH Urban
%
Male
45-49 50-54 55-59 60-64 65+
020406080
100
BelgiumFrance
Germany ItalyCanada
USAJapan
South KoreaIndia
Indonesia CH
CH Rural
CH Urban
%
Female
45-49 50-54 55-59 60-64 65+
Data for China comes from CHARLS (Weighted), data for other countries come from "An Aging World: 2008", issued by NIA of NIH, U.S. Department of Health and Health Services
Retirement Rate by Country, Gender, and AgeInternational Perspective
16
• Rural Chinese retire late, with retirement age much lower than that in other countries, except for Indian and Indonesian men

The Urban‐Rural Difference Cannot by Explained by Lower Work Intensity in Rural Areas
17
0
20
40
60
45 50 55 60 65 70 75 80Age
Urban
Rural
Wor
king
Hou
rs
Male
0
20
40
60
45 50 55 60 65 70 75 80Age
Urban
Rural
Wor
king
Hou
rs
Female
Average Hours of Work Per Week (Unconditional on Work Status)

18
0
20
40
60
45 50 55 60 65 70 75Age
Urban
Rural
Wor
king
Hou
rs
Male
0
20
40
60
45 50 55 60 65 70 75Age
Urban
Rural
Wor
king
Hou
rs
Female
Average Hours of Work Per Week (Conditional on Working)

Institutional Background: Worker’s retirement policy
19

20
Retirement Policy for Workers• The Worker’s retirement system covers urban residents only– Established in the 1950s
– Initially covered only government employees and urban workers in state‐own enterprises
– Later (after 1997) it is required to cover all urban enterprises
– Retirement age: – Men: 60
– Women: 50 for manual workers, 55 for cadres/professionals
• No worker’s retirement system in rural areas
• NRPP is not worker’s retirement, strictly speaking. Eligibility is not conditional on past employment

Evidence: Prevalence of Processed Retirement
Age_Group Urban Rural Urban Rural Urban Rural45_50 27.6 0.6 38.1 0.0 21.8 0.850_55 61.1 3.2 23.7 3.5 73.4 3.255_60 76.4 3.1 62.6 4.7 84.7 2.460_65 80.2 2.8 87.7 4.6 73.4 1.765_70 80.4 5.7 89.6 11.1 72.5 2.270_75 84.4 6.3 95.5 12.4 72.5 1.875_80 82.5 4.6 95.0 9.3 64.6 1.180+ 78.1 4.8 92.7 13.3 58.8 0.4Total 75.0 4.0 81.3 8.4 69.8 1.6OBS 2,112 3,024 957 1,071 1,155 1,953
Table 2_1: Processed Administrative Retirement Rate of Retirees (%)Total Male Female
21
Conditional on retirement, the great majority of urban retirees had retirement “processed” while this is rare for rural retirees

22
0
20
40
60
80
100
45 50 55 60 65 70 75 80Age
Urban
Rural
%
Total
0
20
40
60
80
100
45 50 55 60 65 70 75 80Age
Urban Male
Rural Male
Urban Female
Rural Female
%
Gender and Hukou
Retirement Rate by Age, Hukou, and Gender
Evidence of Retirement Policy Effect

Evidence of Retirement Policy Effect
23
• Spikes of retirement exist for urban workers:• Urban men at 60, women at 50 and 55
• Smooth retirement for rural people
0
3
6
9
12
15
18
45 50 55 60 65 70 75 80Age
Urban MaleUrban FemaleRural MaleRural Female%
Retirement Hazard RateUnconditional Hazard Rate
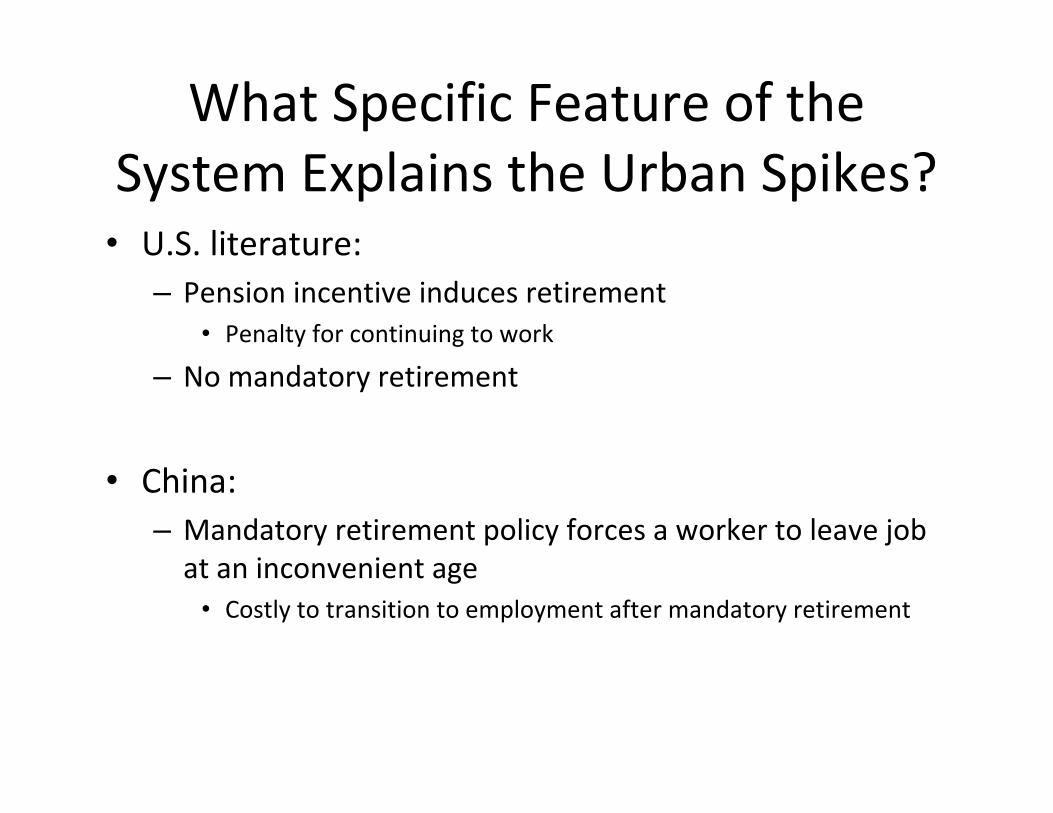
What Specific Feature of the System Explains the Urban Spikes? • U.S. literature:
– Pension incentive induces retirement• Penalty for continuing to work
– No mandatory retirement
• China: – Mandatory retirement policy forces a worker to leave job at an inconvenient age
• Costly to transition to employment after mandatory retirement

25
0
20
40
60
80
100
45 50 55 60 65 70Retirement Age
MaleFemale
%
Processed Retirement Hazard Rate of those Processed Retirement
An Anomaly in the Retirement System: Early Exits
• Positive hazard rate before official retirement ages

• Substantial processed retirement occurs before the official retirement ages.
0
20
40
60
80
100
20 25 30 35 40 45 50 55 60 65 70 75 80Processed Retirement Age
Urban Male
Urban Female
%Cumulative Processed Retirement Age
of those Processed Retirement

Early Retirement
• “Early retirement” is permitted in the worker’s retirement system‐ Jobs that are dangerous, harmful to health or extremely onerous
‐ Civil servants who have worked for 30 years and are within 5 years of the retirement age
• However, early retirement has been granted liberally in practice by the firm to shed redundant workers
27

28
Mechanism Total Male Female1 I have 30 years of job experience,which is enough for early retirement.
8.5 8.3 8.8
2 My work unit belonged to thecategory of high-risk and hard manuallabor and thus was eligible foroffering early retirement
6.3 3.8 10.3
3 My work unit was restructuring/bankrupt, so it offered earlyretirement
16.8 14.3 20.9
4 Due to poor health 37.2 45.1 24.45 Due to family reason 7.6 2.6 15.86 Other 23.6 25.9 19.8
Table 3: Mechanisms of Early Retirement (%)

Early retirement continued after massive enterprise restructuring in the late 1990s
29
Early Retired Dat Total Male FemaleBefore 1990 23.6 27.2 17.81990-1995 12.7 8.4 19.61995-2000 26.7 28.1 24.52000-2005 19.3 18.0 21.3After 2005 17.8 18.3 16.9
Table 5: Distribution of Early Retirement Date (%)

Internal Retirement
• A practice in the 1990s when many firms experienced financial difficulties
• Firms let redundant workers exit the work force before the normal retirement age at the firms’expense, and turn to the Social Insurance Administration for pensions after reaching the normal retirement age
• Internal retirement enables workers to maintain eligibility for social insurance after retirement
30

31
Total Male Female1 I have 30 years of job experience, which is enough for internal retirement.
10.2 13.0 4.7
2 My work unit was restructuring� bankrupt so offered internal retirement
30.0 28.0 34.0
3 Due to poor health 15.5 13.6 19.44 Due to family reason 2.5 1.2 5.15 Other 41.7 44.2 36.8
Table 4: Mechanisms of Internal Retirement (%)
32
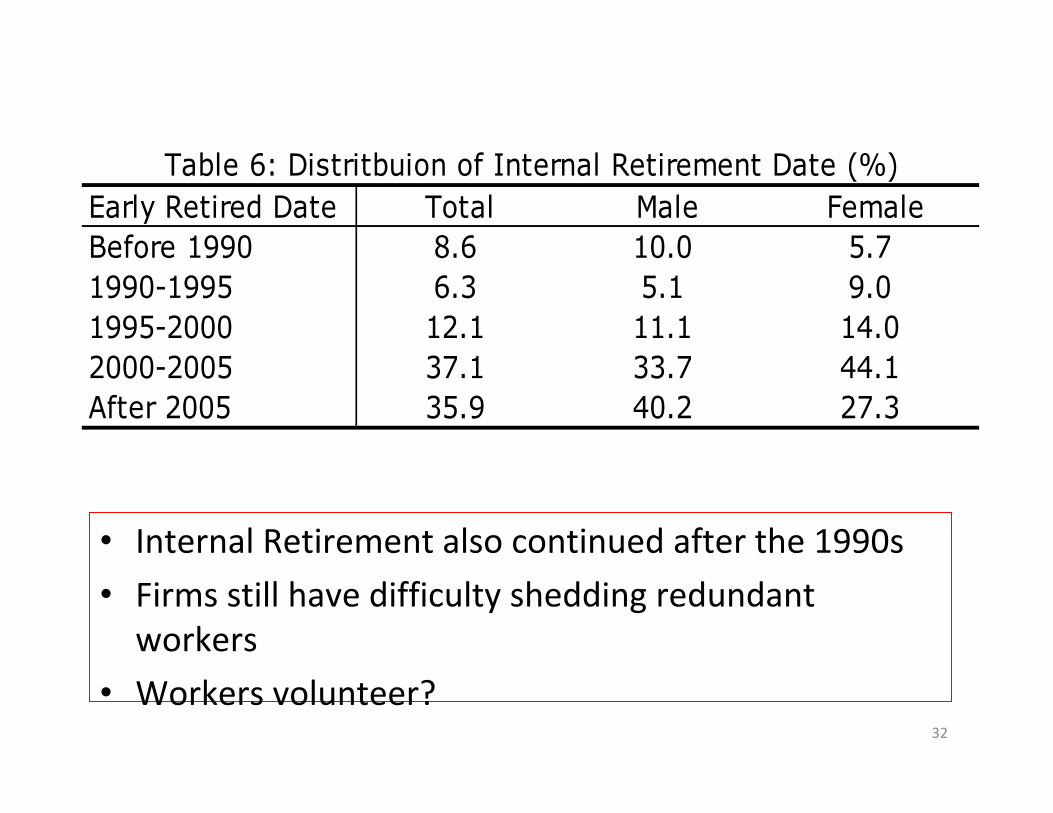
Early Retired Date Total Male FemaleBefore 1990 8.6 10.0 5.71990-1995 6.3 5.1 9.01995-2000 12.1 11.1 14.02000-2005 37.1 33.7 44.1After 2005 35.9 40.2 27.3
Table 6: Distritbuion of Internal Retirement Date (%)
• Internal Retirement also continued after the 1990s
• Firms still have difficulty shedding redundant workers
• Workers volunteer?

Incentive for Early Retirement
• Cost: – Financial penalty is minimal
– Only loss is foregone pension gains due to salary increases in years between early retirement and retirement at official age
• Gain: – double salary
– early transition to a bridge job that lasts
33
34
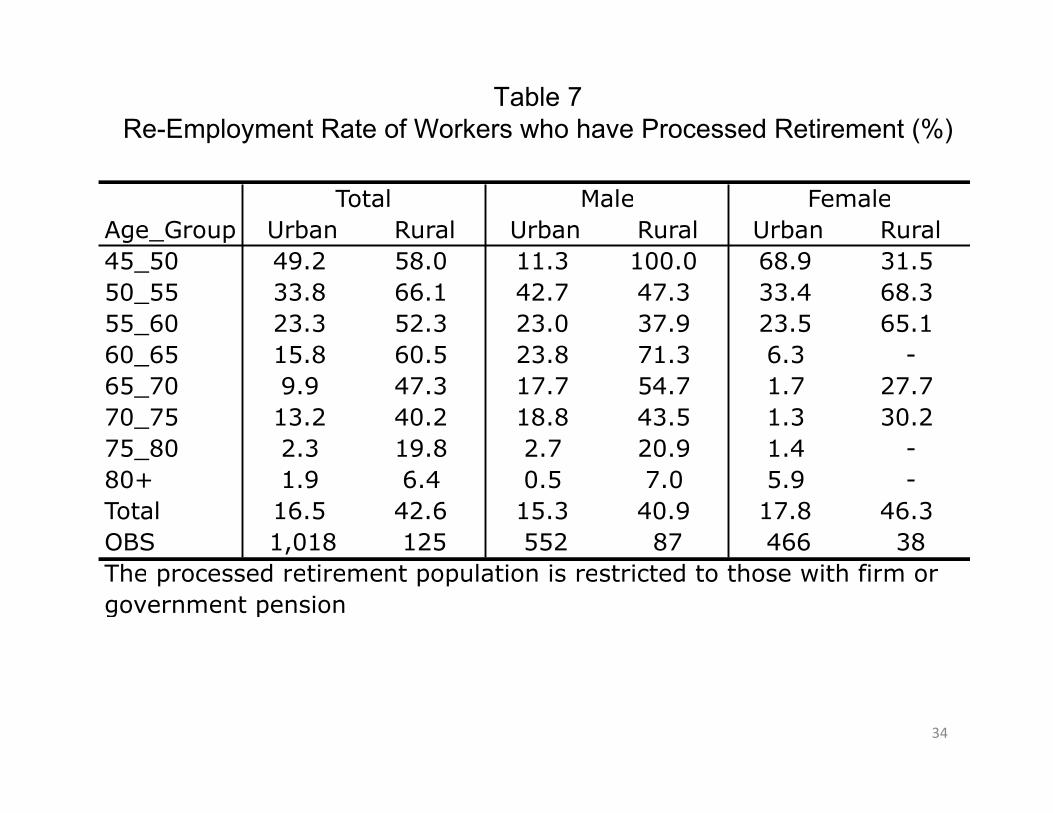
Age_Group Urban Rural Urban Rural Urban Rural45_50 49.2 58.0 11.3 100.0 68.9 31.550_55 33.8 66.1 42.7 47.3 33.4 68.355_60 23.3 52.3 23.0 37.9 23.5 65.160_65 15.8 60.5 23.8 71.3 6.3 -65_70 9.9 47.3 17.7 54.7 1.7 27.770_75 13.2 40.2 18.8 43.5 1.3 30.275_80 2.3 19.8 2.7 20.9 1.4 -80+ 1.9 6.4 0.5 7.0 5.9 -Total 16.5 42.6 15.3 40.9 17.8 46.3OBS 1,018 125 552 87 466 38
Total Male Female
The processed retirement population is restricted to those with firm orgovernment pension
Table 7Re-Employment Rate of Workers who have Processed Retirement (%)

• Pension coverage and generosity
• Wealth gap
• Children’s human capital investment
35
Institution # 2: Urban‐Rural Divide in Economic and Social Policies
36
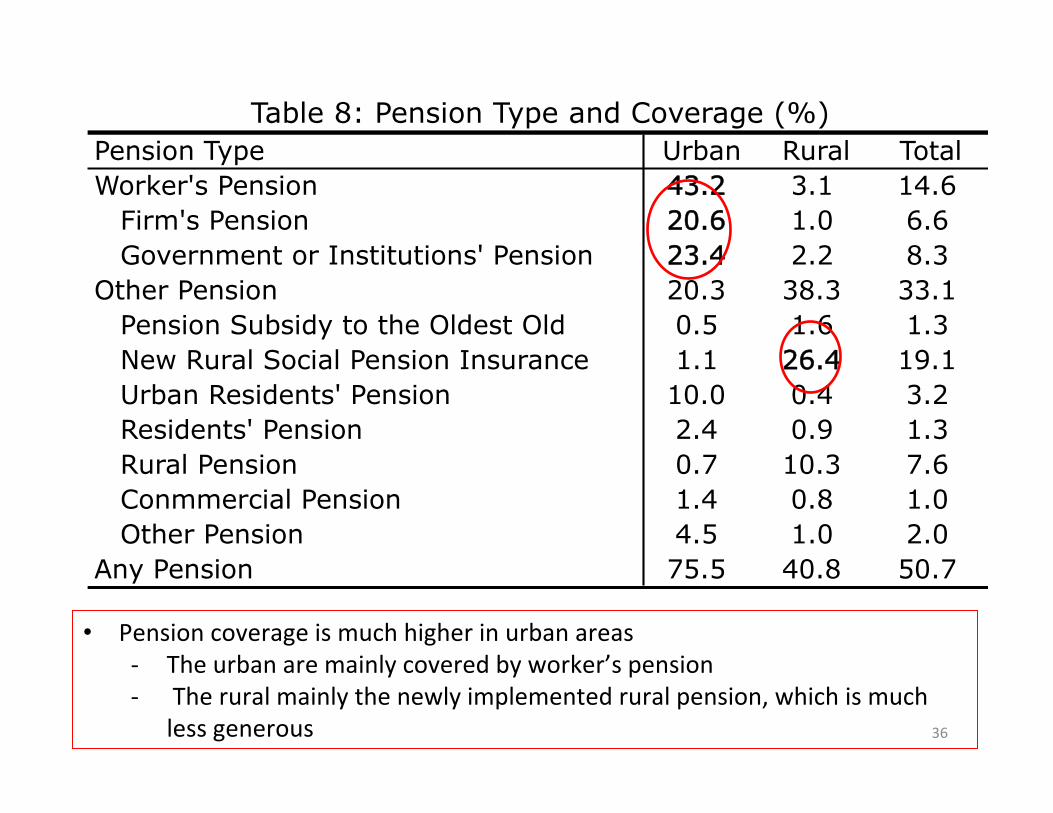
• Pension coverage is much higher in urban areas‐ The urban are mainly covered by worker’s pension‐ The rural mainly the newly implemented rural pension, which is much
less generous
Pension Type Urban Rural TotalWorker's Pension 43.2 3.1 14.6
Firm's Pension 20.6 1.0 6.6Government or Institutions' Pension 23.4 2.2 8.3
Other Pension 20.3 38.3 33.1Pension Subsidy to the Oldest Old 0.5 1.6 1.3New Rural Social Pension Insurance 1.1 26.4 19.1Urban Residents' Pension 10.0 0.4 3.2Residents' Pension 2.4 0.9 1.3Rural Pension 0.7 10.3 7.6Conmmercial Pension 1.4 0.8 1.0Other Pension 4.5 1.0 2.0
Any Pension 75.5 40.8 50.7
Table 8: Pension Type and Coverage (%)

37
• The retirement rate of urban people covered by any pension is higher than those who are not
• The difference in rural is trivial
0
20
40
60
80
100
45 50 55 60 65 70 75 80Age
Any Pension
No Pension%
Total
0
20
40
60
80
100
45 50 55 60 65 70 75 80Age
Any Pension
No Pension
%
Urban
0
20
40
60
80
100
45 50 55 60 65 70 75 80Age
Any Pension
No Pension
%
Rural
Retirement Rate by Pension Coverage

38
• Pension is much more generous among urban residents
Age_Group Urban Rural Urban Rural Urban Rural45_50 1300 0 7000 0 1100 050_55 1260 329 1240 0 1260 32955_60 1300 400 1300 200 1300 48060_65 1600 60 1900 70 1300 6065_70 1600 60 1800 100 1400 6070_75 1600 70 1800 120 1400 6075_80 1700 60 1780 90 1382 6080+ 2000 70 2300 120 1300 60Total 1500 65 1800 90 1300 60OBS 1,717 1,310 820 477 897 833
Table 9: Median Pension Income of Retirees with at Least OnePension (Unit Yuan/Month)
Total Male Female

39
Premium Freq. Percent<=100 1,716 72.28
(100, 200] 247 10.4(200, 300] 123 5.18(300, 400] 56 2.36(400, 500] 113 4.76
>500 119 5.01Total 2,374 100
Table 10: Premium of NRPP (Unit: Yuan/Year)
• The incentive embedded in the rural pension is poor, so rural people tend to choose the pension plans with lowest premiums‐ Low capability of accumulation, will result in low payment in the future

40
Age_Gro Urban Rural Urban Rural Urban Rural45_50 74.3 22.9 71.4 22.4 76.9 24.050_55 75.3 25.9 61.9 25.9 80.1 25.955_60 92.1 23.4 91.9 24.8 94.7 21.760_65 60.6 18.5 61.0 18.4 59.0 18.565_70 66.4 14.8 58.5 14.4 81.7 15.070_75 52.4 14.5 48.6 14.1 56.9 15.075_80 59.1 17.3 62.4 13.8 59.1 19.180+ 68.2 14.8 75.3 13.7 61.8 15.0Total 69.7 20.0 67.6 19.9 71.8 20.1OBS 3,607 12,963 1,922 6,277 1,685 6,686
Table 11: Median PCW by Hukou, Gender and Age (Unit:1000 Yuan/Year)
Total Male Female
• Rural residents have far less wealth. • This is partly caused by long‐standing income gap between R‐U areas,
and partly by urban housing boom that disproportionally benefitted urban residents.
• Rural residents have not fully benefitted from land sales that fueled the urbanization.

41
Type Urban Rural Urban Rural Urban RuralChildren 20.1 80.8 16.8 77.3 23.6 84.0Savings 4.0 4.4 3.9 5.4 4.2 3.6Pension or salary 73.0 9.1 77.0 11.0 68.6 7.3Other 2.9 5.7 2.3 6.3 3.6 5.1
Table 14: Expected Elderly Support (%)Total Male Female
• Urban elderly mainly expect pension or salary for support• Rural elderly mainly expect reliance on children

Social policy: Education of children
42
Age_Group Urban Rural Urban Rural Urban Rural45_50 12.5 9.9 12.8 9.4 12.4 1050_55 13 9.7 13.4 9.9 12.8 9.755_60 13 9 13.1 9.5 12.9 8.960_65 12.3 7.9 12.6 7.9 11.4 7.965_70 11.6 7.1 11.9 7.1 9.9 770_75 11.4 7 11.5 7.2 9.6 6.875_80 10.8 6.4 10.9 6.5 8.8 6.280+ 10.8 6.3 10.8 6.3 8.8 6.4Total 12.2 8.5 12.2 7.8 12.3 8.8OBS 3,535 12,703 2,060 2,947 1,475 9,756
Table 15: Average Years of Education of ChildrenTotal Retired Working

43
Age_Group Urban Rural Urban Rural Urban Rural45_50 15.0 15.0 15.0 17.5 15.0 15.050_55 25.0 17.5 35.0 25.0 21.3 17.055_60 35.0 17.5 35.0 25.0 35.0 16.360_65 35.0 19.3 35.0 19.2 28.3 19.365_70 35.0 17.5 35.0 17.9 25.0 17.170_75 27.0 17.5 27.1 19.2 15.2 15.075_80 23.0 18.1 25.0 17.1 20.0 19.280+ 25.0 15.0 25.0 15.0 25.0 15.7Total 30.0 15.0 35.0 17.5 25.0 15.0OBS 3,053 11,934 1,945 2,844 1,108 9,090
Table 16: Median of Average Income of Children and their Spouses (Unit 1000 Yuan/Year)
Total Retired Working
The sample is restricted to have at least one child and at least report one child's income

Conclusions• Retirement patterns are very different in urban and rural China
‐ Urban elderly retire very early‐ Rural elderly “work until dropping”
• The retirement patterns are possibly explained by‐ Mandatory retirement policy applicable to urban workers‐ Greater coverage and generous pension in urban areas‐ Large urban‐rural gap in economic and family resources for
elderly support‐ Policy implications
‐ Urban and rural China need different policies regarding retirement: while urban young elderly should be encouraged to stay on the labor force, rural elderly should be given the freedom to retire
‐ Equalization in institutional treatments is key for facilitating the transformations
44

45