Embed Size (px)
Citation preview

Institutional diversity in UK Higher Education
Brian Ramsden

2
Contents Introduction and summary ..................................................................................................................... 3
Overview ................................................................................................................................................. 5
Institutions .......................................................................................................................................... 5
Number of institutions .................................................................................................................... 5
Mergers ........................................................................................................................................... 6
New institutions in the sector ......................................................................................................... 6
Institutions by country-region of the UK ............................................................................................ 7
General versus specialist institutions. ................................................................................................ 9
Diversity of subject provision – supply and demand ............................................................................ 10
Supply – the number of institutions teaching major subjects .......................................................... 10
Demand – undergraduate application data ...................................................................................... 11
Students ................................................................................................................................................ 13
Qualifications of undergraduate applicants ..................................................................................... 13
Changes in the student population ................................................................................................... 13
Level of study .................................................................................................................................... 14
Mode of study ................................................................................................................................... 15
Balance between home and International students ........................................................................ 15
Widening participation ..................................................................................................................... 16
Teaching and research activity ............................................................................................................. 17
Balance between teaching and research .......................................................................................... 17
Conclusions and a look at the future .................................................................................................... 19
Appendix 1 - Mergers in the Higher education sector since 1994-95 .................................................. 20
Appendix 2 - New institutions counted within the higher education sector ........................................ 23
Appendix 3 – Change over time in the number of institutions teaching individual subjects. .............. 24

3
Introduction and summary
1. There is a widespread perception that while institutional diversity is one of
the main features of a healthy higher education system, there is some evidence
of declining institutional diversity, particularly as smaller, specialised, usually
single campus, institutions are absorbed into larger, comprehensive, multi-
campus institutions. The purpose of the study has therefore been to identify,
and if possible measure, the present extent and nature of institutional diversity,
taking a number of measures of diversity, and to assess the extent to which this
has changed.
2. The analysis in this report considers changes over broadly a 16 year
period beginning in 1994-95, the first year in which data were collected by the
Higher Education Statistics Agency (HESA)1. However, it needs to be recognised
that there are discontinuities in the data over this 16 year timeframe, and
therefore the analysis in this paper selects appropriate and available years.
Indeed some data, such as that those derived from Performance Indicators, did
not appear until 1999.
3. It should also be noted that this report is specifically about the Higher
Education sector as defined in the period under review – i.e. those institutions
which provided data to the Higher Education Statistics Agency, principally
because they were required to do so by their funding body. The definition of the
Higher Education sector may change significantly in the light of proposed
changes to funding regimes currently being considered by the UK Government
and devolved administrations.
4. Over the historic period under review, there has been a modest reduction
in the total number of higher education institutions (HEIs) in the UK – from 183
to 165. That apparent 10% reduction conceals the fact that several new
institutions entered the HE sector, mostly from the further education sector, but
so too did some private HE providers.
5. 40 institutional mergers have taken place in the UK higher education
sector within the last sixteen years, mostly involving the “takeover” of a small
specialist institution by a larger institution. This fact in itself would seem to imply
that there has been a reduction in specialist provision within the HE sector:
however, the admission of new institutions within the publicly-funded HE sector
has had a partial balancing effect since many of these have been specialist. It is
also, of course, the case that merged institutions may retain the same
curriculum profile and accessibility as the two unmerged institutions.
1 Previously, data had been collected by several different organisations depending on the
nature of the higher education institution and its country of location.

4
6. An analysis of the characteristics of UK higher education institutions
suggests that there is now less opportunity for potential students to enter
specialist institutions than 16 years ago. While there has been a net decrease of
three general institutions across the UK as a whole over the last sixteen years,
the net decrease among specialist institutions has been 14 – despite the
significant number of new specialist institutions entering the HE sector.
7. However, it does not follow from this that the overall diversity of provision
has declined, since the opportunities previously provided by specialist
institutions may have been carried over into the smaller number of institutions
now operating.
8. A more detailed analysis, having regard to region of location, subject
provision, student population characteristics, and other factors has therefore
been carried out. This shows that
There are significant differences in the changes observed across the
countries and regions of the UK: London, the South-East, Wales and
Scotland have seen significant reductions in the number of HE institutions,
through mergers, while some other regions (the North-east and East
Midlands, for example), have seen little or no change.
There have clearly been major changes in the balance of subject provision of undergraduate courses, notably a decline in Science and Technology
subjects, alongside a significant increase in Creative and Performing Arts, Media Studies and Politics. However, in general, the major changes in
subject provision by HE institutions have matched the changes in demand as evidenced by applicant choices - although Mathematics is a notable exception to this, having seen an increase in demand and a reduction in
supply.
As regards both mode and level of study, there has been a convergent
trend, i.e. there are fewer institutions which specialise exclusively or largely in full-time, part-time, postgraduate or undergraduate study: in particular, it is notable that only one institution now has no postgraduate
students, compared with five in 1994-95.
Over the last twelve years, many more institutions have enrolled
significant numbers of students from outside the UK. It is now the norm for institutions to enroll more than 15% of their students from countries other than the UK.
A diminishing number of institutions require the highest level of entry qualifications.
A significant majority now recruiting over 90% of their entrants from the state sector.
9. In all of these respects, it can be argued that the Higher Education sector
is less diverse than it was ten years or fifteen years ago. but the changes are
marginal – there are still a large number of institutions that have differing

5
characteristics and do different things. Moreover, to the extent that there has
been convergence, to a large extent the changes that have been observed
represent a response by institutions to the demands and constraints of the
external environment, most particularly changes in student demands and needs.
10. And as far as the balance between teaching and research is concerned,
perhaps surprisingly in view of the apparent national policy towards greater
concentration, this investigation has concluded that there has not really been
much divergence of mission over time; although there has been a marginal
increase in diversity amongst the most highly research active institutions, as
research concentration has been promoted.
11. For the future, the pressures on HE institutions arising from the
Government’s introduction of a new funding regime for HE institutions in England
create the most significant change to the HE landscape for at least twenty years.
The comparatively minor changes in the diversity of the sector over the last
fifteen years may well be over-shadowed by major changes, as growing market
pressures come to bear on institutions – not only in England but also in
Scotland, Wales and Northern Ireland. (At the time of writing, pressures
towards institutional mergers in Wales are considerable, and the setting of fee
levels at Scotland’s universities (for UK students domiciled outwith Scotland) is
an issue of considerable interest and controversy: it also potentially creates a
new kind of diversity between institutions in Scotland.
Overview
Institutions
Number of institutions
12. In order to set this study into context, it begins by looking at the number
of Higher Education Institutions (HEIs) and the changes which have taken place
over the last sixteen years.
13. In 1994-95 there were 183 HEIs2. In 2009-10 there were 165. This
apparent loss of 18 institutions is however misleading, because over the period
several institutions merged, and some were “admitted” to the sector, having
previously been funded as Further Education Colleges (FECs), or entered the
sector as private providers or de-merged, at least for funding and data analysis
purposes, from other HE institutions.
14. Some of the issues concerning general and specialist institutions are
considered below, but first the changes which have occurred in the overall
numbers of institutions are examined.
2 Excluding the University of Wales Registry which received public funding but had
virtually no student provision.

6
15. It should be noted here that, within the period considered, no institution
has disappeared from the overall count except through merger; and no new
institution has appeared except through transfer or de-merger of activity,
although in a few instances new institutions were nurtured – largely from the FE
sector - towards the point at which they might join the HE sector.
Mergers
16. Annex A reports the mergers which have taken place within the HE sector
since 1994-95. In total 40 are identified, although some are multiple, and so
the count is not simple.
17. It will be seen from Annex A, in the large majority of instances, these
mergers involved a specialist institution being “taken over” by a larger, more
general institution – the combined institution retaining the name of the larger
merger partner. In some instances these mergers are known to have arisen from
financial weakness on the part of the smaller partner, but this was by no means
always the case: mergers have taken place also because of a general policy
decision (for example in relation to medical education in London in the 1990s) or
because of a desire for rationalisation, for example in both Scotland and Wales.
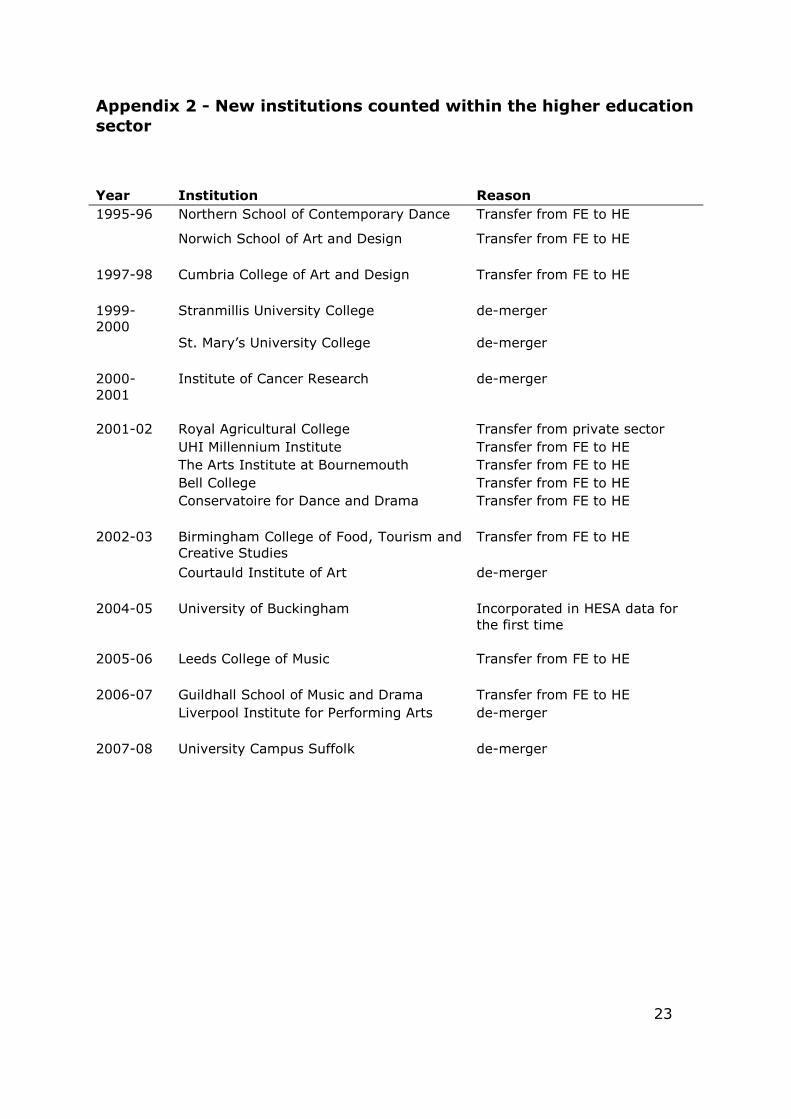
New institutions in the sector
18. Alongside the disappearance of some institutions through mergers, new
institutions have entered the sector, and these are shown in Annex B.
19. It will be seen that 18 institutions are identified here, and also that most
of them are in fact specialist institutions, many specialising in the creative and
performing arts3.
20. Of course, it should not be imagined that these institutions suddenly
appeared and so increased the diversity of provision in the sector: all had
previous existences either within the FE sector, or in the private sector or as part
of a larger publicly funded institution.
21. It should also be recognised that, in parallel with the developments
considered, there were several instances of further education institutions being
partly or completely absorbed into large universities; and indeed those
universities continue to support FE students.
22. So while 40 institutional mergers have taken place within the last 16
years mostly involving the takeover of a small specialist institution by a larger
one, over the same period 18 institutions, most of which were identifiably
specialist in nature, joined the sector.
3 It should also be mentioned that there are some providers of higher education which
are not independent entities but which involve collaboration between existing providers,
e.g. the Peninsular college of Medicine and Dentistry, and the Brighton and Sussex
Medical School.

7
Institutions by country-region of the UK
23. This section of the report considers the distribution of institutions by
country of the UK and region of England over time, looking at the number of
institutions in 1994-95, and in the most recent year available (2009-10),
together with one intermediate year, 2001-02: this year has been chosen
because the Universities UK Patterns report for that year4 concentrated on
regional issues, and contains much relevant material about that year.5
24. Table 1 below shows the number of HE institutions in each UK country and
region of England in the relevant years.
Table 1: Numbers of HE institutions by region, 1994-95, 2001-02 and 2009-10
1994-95 2001-02 2009-10
North East 5 5 5
North West 16 15 14
Yorkshire and The Humber 12 11 11
East Midlands 10 9 9
West Midlands 12 11 12
East of England 9 10 10
London 45 40 40
South East 22 17 17
South West 11 13 12
England sub-total 142 131 130
Wales 15 13 11
Scotland 23 20 19
Northern Ireland 2 4 4
UK-wide 1 1 1
Total 183 169 165
Source: HESA publications
25. The net reduction in the overall number of HE institutions was particularly noticeable in the late 1990s, and that it was by no means uniform across the
countries and regions of the UK.
26. In more detail:
The North-East region has seen no change at all in its institutions which
consist of five universities.
The North-West has seen a modest reduction overall, but this conceals a
complex picture: over the period, two small specialist institutions (one
4 “Patterns of Higher education Institutions in the UK”, report prepared by Professor
Brian Ramsden for Universities UK. http:--www.universitiesuk.ac.uk-Publications-
Documents-Patterns4.pdf 5 It should be noted that the attribution to regions in the following paragraphs is crude,
being based on institutional headquarters. Some institutions teach across regional
boundaries, having multiple campuses. For example, the Conservatoire for Dance and
Drama teaches in London, Leeds and Bristol. I have not thought it necessary for the
purposes of this report to disaggregate all institutional campus arrangements.

8
concerned with teacher education and the other with technology) were subsumed within larger institutions, while two substantial pre-1992
universities merged. Two new institutions entered the sector: both are involved with performing or creative arts.
Yorkshire and the Humber lost two colleges through mergers, one being a specialist arts and education college, and the other a general college. It gained one college of the performing arts.
Provision within the East Midlands has been broadly stable in institutional terms with the exception of one merger of a college of art
with its neighbouring university. However, it is relevant to note that some of the universities have seen major changes, including the transfer of students from former FE colleges.
In the West Midlands also there has been a comparatively stable situation in terms of providing institutions: one specialist college of
education merged with its local university, and a new entrant to the sector was a former FE college.
The East region shows a net increase in the number of institutions: while
it has lost one specialist education college, it has gained one general college (through de-merger) and also one specialist art college from the
FE sector.
London appears to show major change, having “lost” five of its 45
institutions over the period under review. However, much of this arose from a conscious policy decision to rationalise the provision of medical education in London, through the incorporation of smaller specialist
institutions into larger ones. London has also seen one major institutional merger involving London Guildhall University and the University of North
London becoming London Metropolitan University. Additionally some institutions have joined the sector from the FE sector, or by de-merger or transfer from the private sector.
The South-East region also shows a net reduction in the number of institutions, arising chiefly because of the integration of some smaller
specialist institutions into universities. The University for the Creative Arts was created by merger of smaller colleges of creative arts; and the University of Buckingham joined the list of HESA institutions, while
remaining in the private sector.
In contrast, the South-West region shows an increase overall of one
institution over the timescale under consideration. While the larger institutions are unchanged, one specialist art college merged into a larger institution and two colleges joined the sector, one being previously a
private agricultural college, and the other previously an FE college of the arts.
Wales has seen a reduction in the number of institutions from 15 to 11, entirely because of the amalgamation of small specialist institutions into larger general institutions. The four merged institutions were colleges of
agriculture, education, medicine and performing arts. No new institutions have joined the sector in the region.

9
Scotland also has seen a net reduction of four institutions. Five specialist colleges – three colleges of education, one college of art, and a college of
textiles - merged with larger universities, while there was one new entrant (the UHI Millennium Institute, now re-designated as the University of the
Highlands and Islands) transferring provision from the FE sector.
Northern Ireland appears to show a doubling of higher education institutions, but this involves only a technical de-merger of two education
colleges from the university sector.
27. In this respect – the change in institutional provision over the last 16
years – there are marked differences between the countries and regions of the
UK.
General versus specialist institutions.
28. Previous paragraphs, have referred to “specialist” and “general”
institutions. When considering the distinction between two, it is undesirable to
consider the concept of a monotechnic too literally. Most institutions, even if
they declare themselves to be specialist providers, offer courses across a range
of subject disciplines – there are at present only twelve which teach in only one
of the nineteen formally recognised subject areas. The definition of a specialist
institution is necessarily subjective. For the purposes of this report an institution
is considered to be “specialist” if the whole of its teaching falls within fiveor
fewer subject areas.6
29. Table 2 below shows the number of specialist and general HE institutions
in the UK in 1994-95 and in 2009-10.
Table 2: Numbers of general and specialist institutions, and student
numbers, 1994-95 and 2009-10
Number of
institutions
Total Student
population
Average student
population per
institution
1994-95 General institutions 134 1,515,697 11,311
Specialist
institutions 48 51,616 1,075
Total 183 1,567,313 8,565
2009-10 General institutions 131 2,437,670 18,608
Specialist
institutions 34 55,730 1,639
Total 165 2,493,400 15,112
Source : HESA publications
6 In order to eliminate data deficiencies, institutions appearing to teach fewer than ten
students in any subject area have been excluded.

10
30. While there has been a net decrease of three general institutions across
the UK as a whole over the last sixteen years, the net decrease among specialist
institutions has been 14 – despite the significant number of new specialist
institutions entering the HE sector.
31. While there is now less opportunity for potential students to enter
specialist institutions than was the case sixteen years ago - and as has been
seen, there are marked differences in the changes that have taken place
between regions and countries of the UK - this does not necessarily mean that
overall curriculum opportunities have been reduced. When mergers have taken
place it is quite possible that the curriculum offering of the junior partner will be
carried over into the merged institution. Moreover, as was seen in Table 2
despite the reduction in the number of specialist institutions, there are actually
more students studying at such institutions than previously.
Diversity of subject provision – supply and demand
32. There are two ways of considering the diversity of subject provision -
based on supply by institutions and demand from students. However, the two
should be related.
Supply – the number of institutions teaching major subjects
33. Analysis of subject provision over time is complicated by the significant
changes which have occurred both in subject definitions and in student
populations. For technical reasons, the following analysis compares the figures
for 1996-97 with those for the latest year, 2009-10. Over that period the
student population has been redefined in such a way that postgraduate numbers
have declined because of the exclusion of writing-up students; and the subject
definitions used by HESA and UCAS have also changed in some respects. Also
there has been a movement in the attribution of students between the Combined
subject area to more specific subjects.
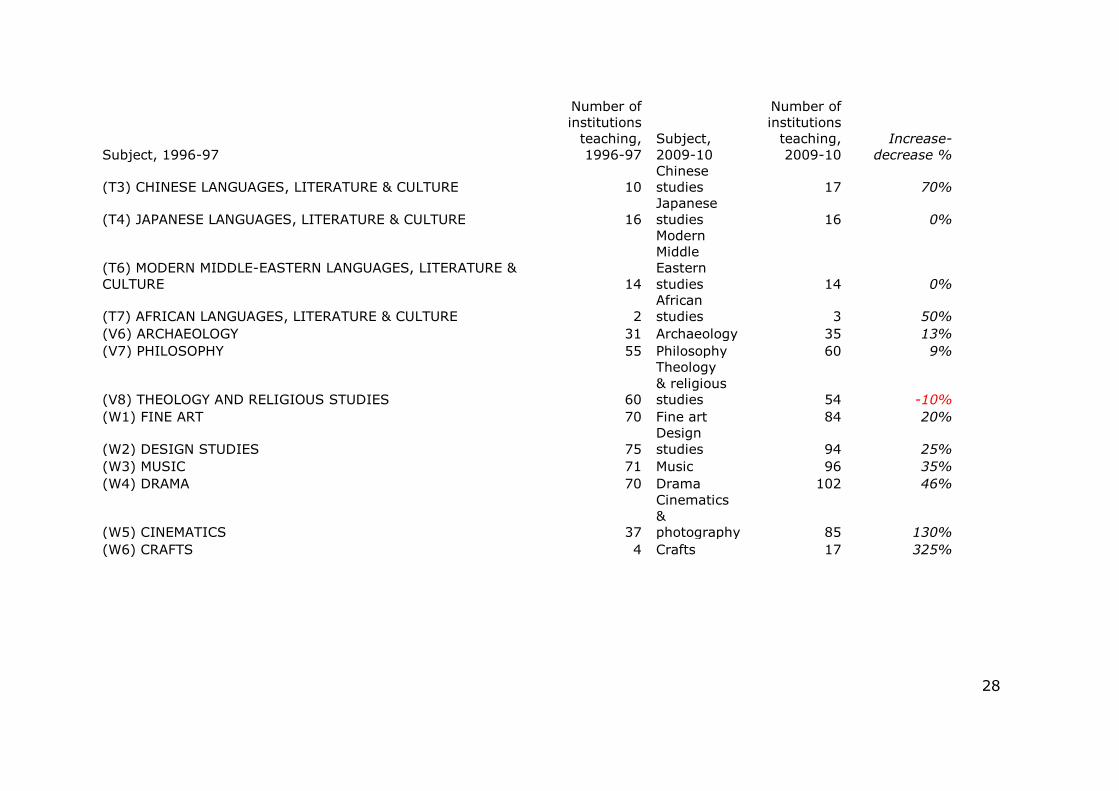
34. Annex C shows changes in the numbers of institutions teaching most
major subjects over the last 14 years. (For reasons explained in the previous
paragraph, this analysis cannot be comprehensive – for example the subject
History and its components cannot be tracked across this timescale.)
35. However, some major changes over time can be identified:
All subjects in the Physical sciences show a marked reduction in the number of institutional providers, with the exception of Astronomy, the
providers of which have more than doubled from a small base. Chemistry is now taught in 66 institutions compared with 93 fourteen
years ago (a reduction of 20%). The reduction in institutions teaching physics has been even greater, from 69 to 47, a reduction of 32%.
11
Most subjects in the areas of Engineering and Technology similarly show a marked decrease in the number of providers. Minerals
technology is taught now in only three institutions compared with eight in 1996-97. Production engineering, Metallurgy, Ceramics, Polymers &
textiles and Maritime technology also show marked reductions in the numbers of institutions making provision.
Botany is now taught in only 11 institutions compared with 22 in
1996-97
Conversely, the areas of Creative and performing arts show a
marked increase in the number of teaching institutions
This is true also of English studies
There has been a significant increase in the number of institutions
teaching Architecture.
Media studies, Publishing and Journalism also show large increases, as
does Cinematics and photography.
There has been modest decline in the number of institutions teaching Mathematics.
Politics shows a marked increase, while Sociology shows an increase although only a modest one.
36. In summary, there have clearly been major changes in the balance of
subject provision of undergraduate courses, notably the decline in Science and
Technology subjects, alongside a significant increase in Creative and Performing
Arts, Media Studies and Politics.
Demand – undergraduate application data
37. It is reasonable to consider whether these changes in supply are merely
reflecting changes in demand from potential students. One way of considering
this question is to look at the application figures through UCAS as a reflection of
changes in demand from applicants. It must be recognised that this is an
instrument of limited scope, given the changes in the institutional and subject
constituency of UCAS over time.
38. However, subject to this caveat, Figure 1 shows the percentage change in
applications for individual subjects at full-time undergraduate level which can
reasonably be compared in 1996 and 2010.7
7 Art and Design and Nursing are excluded since they did not feature in the UCAS
constituency in 1996. The chart is limited to subjects within which there were more
than 500 applications in either year.

12
Figure 1: Percentage change in undergraduate applications for courses by
courses by individual subject, 1996 and 2010
Source UCAS statistics at www.ucas.com
39. If Figure 1 which is a chart of “demand” - is compared with the
information in the previous paragraphs showing “supply”, even allowing for the
limitations of the data, some interesting comparisons can be observed.
-100% -50% 0% 50% 100% 150% 200% 250%
Accounting
Aerospace Engineering
Agriculture
American studies
Anthropology
Architecture
Biology
Building
Chemical,Process and Energy Engineering
Chemistry
Civil Engineering
Classical studies
Computer Science
Drama
Economics
Electronic and Electrical Engineering
English studies
French studies
General Engineering
Human and Social Geography
Physical Geographical Sciences
Geology
History
Journalism
Law
Marketing
Mathematics
Mechanical Engineering
Media studies
Music
Nutrition
Ophthalmics
Philosophy
Physics
Politics
Production and Manufacturing Engineering
Psychology
Social Policy
Sociology
Software Engineering
Theology and Religious studies
Zoology
All subjects
All subjects
average
change =
57%

13
Media Studies and Journalism feature strongly in both demand figures and in the supply.
The same is true of subjects in the Creative and performing arts, and also in Architecture
There are generally reductions in both supply and demand among disciplines in Engineering and technology (although Chemical engineering and Aeronautical engineering are exceptions), and also in
Physics and Chemistry.
However, there has been an above average increase in the number of
applications to Mathematics courses, over a period in which the number of institutions teaching Mathematics has decreased sharply.
40. So while there have clearly been major changes in the balance of subject
provision of undergraduate courses, notably the decline in science and
technology subjects, alongside a significant increase in creative and performing
arts, media studies and politics, in general, though with some notable
exceptions, the major changes have matched changes in demand as evidenced
by applicant choices.
Students
Qualifications of undergraduate applicants
41. The qualifications of applicants to HE institutions, are of especial interest
in view of the Government’s intention to release unlimited numbers of places for
students with UCAS tariff scores of AAB or better. (This equates to 340 UCAS
tariff points.)
42. In 2004-05 50 institutions (33%) admitted first year first degree students
with an average points score of 340 (equivalent to AAB at GCE A-level), while 89
(59%) had an average points score of less than 300 (equivalent to BBB). In
2009, only 44 institutions (30%) exceeded an average of 340 points, while 88
(again 59%) had an average of less than 300. The figures suggest that there is a
diminishing number of institutions which require the highest qualification levels,
and that there is some convergence in relation to entry qualifications to full-time
undergraduate courses.
Changes in the student population
43. The following paragraphs consider changes in balance of the student
population by mode and level of study, by age, gender and ethnicity;
performance indicators that report on institutional access to higher education are
also considered.
14
Level of study
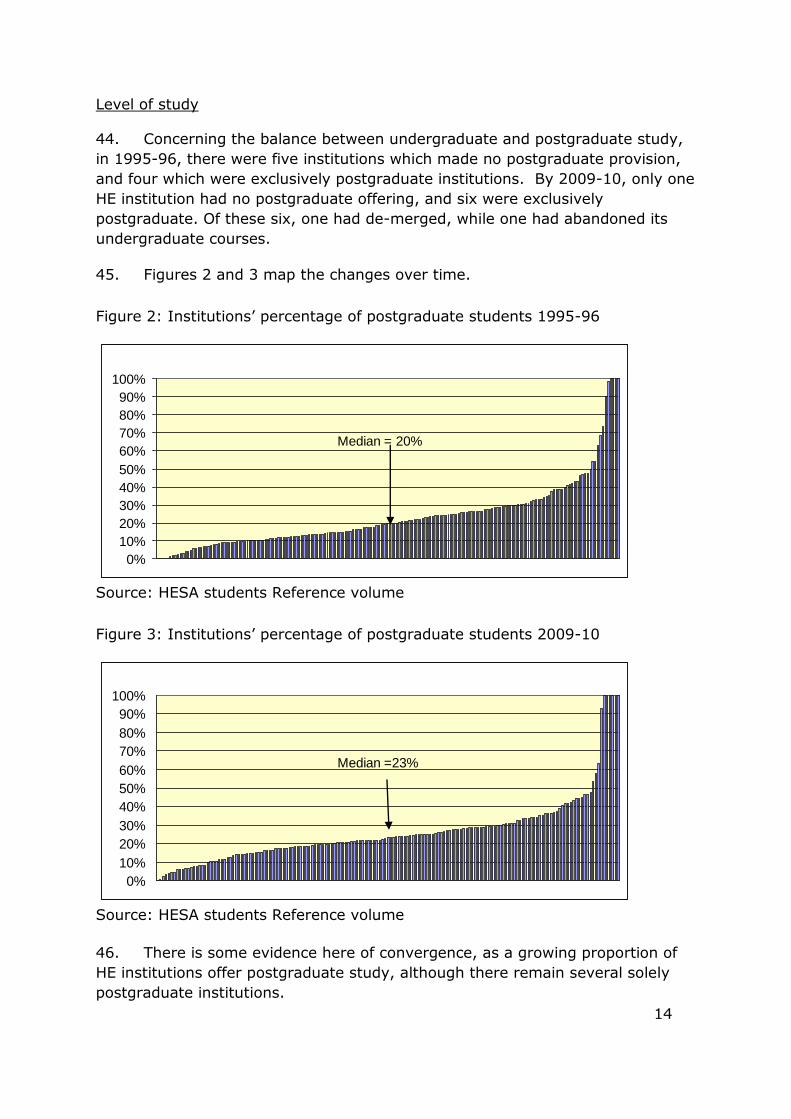
44. Concerning the balance between undergraduate and postgraduate study,
in 1995-96, there were five institutions which made no postgraduate provision,
and four which were exclusively postgraduate institutions. By 2009-10, only one
HE institution had no postgraduate offering, and six were exclusively
postgraduate. Of these six, one had de-merged, while one had abandoned its
undergraduate courses.
45. Figures 2 and 3 map the changes over time.
Figure 2: Institutions’ percentage of postgraduate students 1995-96
0%
10%
20%
30%
40%
50%
60%
70%
80%
90%
100%
Median = 20%
Source: HESA students Reference volume
Figure 3: Institutions’ percentage of postgraduate students 2009-10
0%
10%
20%
30%
40%
50%
60%
70%
80%
90%
100%
Median =23%
Source: HESA students Reference volume
46. There is some evidence here of convergence, as a growing proportion of
HE institutions offer postgraduate study, although there remain several solely
postgraduate institutions.

15
Mode of study
47. Between 1995-96 and 2009-10, there was a significant shift nationally
towards part-time study among undergraduates in the UK. Full-time
undergraduates increased by 37%, while part-time undergraduates increased by
54%.
48. In this period, as Figure 4 shows, there was a significant increase in the
proportion of part-time students across the whole spectrum of HE institutions,
Figure 4: Percentage part-time among undergraduate students by institution,
1995-96 and 2009-10
0%
10%
20%
30%
40%
50%
60%
70%
80%
90%
100%
2009/10
1995/96
Balance between home and International students
49. Another differentiator among institutions is the balance between home, EU
and other international students.
50. In 1996-97, 86% of full-time students (undergraduate and postgraduate)
at UK HE institutions were domiciled in the UK: the average percentage of non-
UK students in each institution was 14%, within which the average percentage of
students from outside the EU was 7%.
51. In 2009-10, only 79% of full-time students were from the UK: on
average, 21% of students were from outside the UK, of whom 14% (two thirds)
were from outside the EU. This represents an increase of 50%, the whole of the
increase being represented by students from outside the EU, whose numbers
increased from 7% of the student population to 14%. The proportion of EU
students remained constant at 7% (despite the enlargement of the EU in the
intervening period).
16
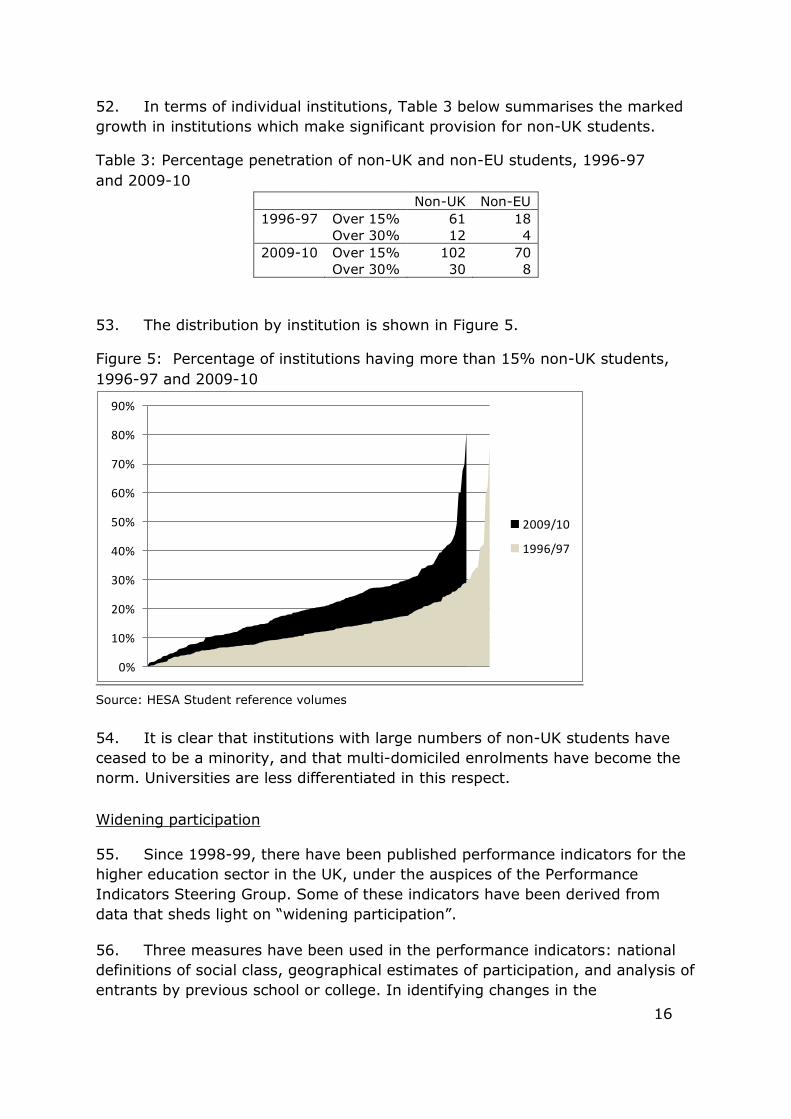
52. In terms of individual institutions, Table 3 below summarises the marked
growth in institutions which make significant provision for non-UK students.
Table 3: Percentage penetration of non-UK and non-EU students, 1996-97
and 2009-10
Non-UK Non-EU
1996-97 Over 15% 61 18
Over 30% 12 4
2009-10 Over 15% 102 70
Over 30% 30 8
53. The distribution by institution is shown in Figure 5.
Figure 5: Percentage of institutions having more than 15% non-UK students,
1996-97 and 2009-10
0%
10%
20%
30%
40%
50%
60%
70%
80%
90%
2009/10
1996/97
Source: HESA Student reference volumes
54. It is clear that institutions with large numbers of non-UK students have
ceased to be a minority, and that multi-domiciled enrolments have become the
norm. Universities are less differentiated in this respect.
Widening participation
55. Since 1998-99, there have been published performance indicators for the
higher education sector in the UK, under the auspices of the Performance
Indicators Steering Group. Some of these indicators have been derived from
data that sheds light on “widening participation”.
56. Three measures have been used in the performance indicators: national
definitions of social class, geographical estimates of participation, and analysis of
entrants by previous school or college. In identifying changes in the

17
differentiation of the sector, the first two of these measures cannot be used
robustly, since their definitions have changed markedly over the last ten years.
(The social class indicator has changed with the introduction of NS-SEC8, while
the geographical indicator, designed to reflect the social class of students’ home
neighbourhoods, has been changed significantly with the introduction of the
“POLAR” system by the Higher Education Funding Council for England.9) While
these changes may have improved the snapshot data which can be derived, they
have generated significant turbulence in time series analysis, and should be
discounted for the purpose of this report.
57. However, the third measure of widened participation is the percentage of
full-time young undergraduates entering higher education from state schools
and colleges, for which there is reasonable continuity. The change over time is
summarised in the Figure 6.
Figure 6: Percentage entrants to full-time undergraduate courses from state
schools and colleges, 1998-9 and 2009-10
Source: HESA Performance Indicators
58. The umber of institutions admitting more than 90% of their intake from
the state sector has grown markedly, implying some convergence in the social
composition of institutions' student bodies.
Teaching and research activity
Balance between teaching and research
59. Perhaps the most simple, straightforward - and perhaps overly simplistic -
differentiator in higher education institutions in the UK (and also in many other
countries) is the balance between teaching and research activity.
8 NS-SEC – see ONS website for details. 9 POLAR – see HEFCE website for details
0
20
40
60
80
100
120
up to 75% 76-90% over 90%
percentage of full-time undergraduate entrants from state
schools & colleges
nu
mb
er
of in
stitu
tio
ns
1998/99
2009/10

18
60. While the two are obviously closely inter-related, the balance between
them can be measured, at least in terms of input10, by considering the income
received for teaching and research.
61. Approximately 69% of the (total teaching and research – T+R) income
received by UK higher education institutions is specifically designated for
teaching, and comes through a combination of funding council grants and tuition
fees and support grants. This has been unchanging over the last ten years,
although there has been a change in the balance among individual institutions,.
Figure 7: Teaching income as percentage of teaching and research income:
institutional distribution, 1999-2000 and 2009-10
Source: HESA, HE Finance Plus
62. Figure 7 shows that the proportion of institutions receiving less than 50%
of their T+R income from teaching activities has grown slightly to just over 8%
of all HE institutions; while the number receiving between 50% and 74% has
declined. The number of institutions in the higher percentage bands have both
increased slightly.
63. These findings correlate well with the earlier conclusions about the
changes in the number of specialist institutions within the sector, many of which
have, or had, a research orientation: i.e. while some specialist institutions have
been subsumed within other institutions, new ones have emerged, and the
balance is not much changed.
64. From these data it is apparent that there has, over the last ten years,
been no significant diminution of the concentration of research funding, and
therefore the balance between teaching and research funding in institutions
across the sector
10 While it is possible to measure the financial input, the measurement of the output
from teaching resources is difficult, and the measurement of output of research
resources is – arguably - impossible.
0%
10%
20%
30%
40%
50%
60%
<50% 50-74% 75-89% 90% plus
1999/2000
2009/10

19
Research concentration
65. A further issue affecting institutional diversity is the concentration of
funding for research, which has been a subject of policy determination in recent
years (i.e. there has been a positive policy move towards greater research
concentration)
66. As a result, the number of institutions receiving more than 3% of the total
public funding for research11 has reduced from 11 to 9. Across the whole time-
frame, 4 (identical) institutions have received approximately a quarter of all
public research income. So although there has been a policy priority to diversify
the sector in terms of its research activity ( i.e. to concentrate research activity),
the data do not suggest that this has occurred.
67. The previous paragraph indicates that over recent years in some respects
there may have been a modest decline in the diversity of institutions in relation
to the teaching of students. However, there has not been a significant change in
the balance of funding between teaching and research, although among
institutions in receipt of research funding there has been a marginal increase in
the concentration of funding. However, this is not sufficient to conclude that
there has been significant increase in diversity.
Conclusions and a look at the future
68. it is clear from the analysis of this report that some of the concerns that
have been expressed about the wholesale diminution of diversity in the sector
are unfounded - despite a modest amount of convergence in some respects the
sector remains highly diverse in many significant respects.
69. However, this report is published early in 2012, after the Government has
proposed, through its White Paper, the most significant changes to impact on
Higher Education institutions, their staff and their students for at least twenty
years. What the impact of these changes will be on the diversity of institutions
is impossible to say. It is, however, safe to think that commercial pressures will
increase - and it is commercial pressures of this kind which have in the past led
to the modest convergence of activity and mission described here, such as it is.
70. A converse influence however is the “opening-up” of the HE sector to new
providers, both from the FE and the “for profit” sectors, which will themselves
increase diversity and which may spur others to change.
11 i.e. funding council R grant plus research grants and contracts from government
funded research bodies

Appendix 1 - Mergers in the Higher education sector since
1994-95
Unless otherwise stated, the merged institutions assumed the name of the last
named institution. Only publicly funded higher education institutions are included
in this list: it does not include further education colleges that have merged with
higher education institutions.
1994-1995
Institute of Psychiatry (transition) and King’s College London
West London Institute of Higher Education and Brunel University
London Hospital Medical College and Queen Mary and Westfield College
St Bartholomew’s Hospital Medical School and Queen Mary and Westfield College
The Welsh Agricultural College and University College of Wales,
Aberystwyth Duncan of Jordanstone College of Art and University of Dundee 1995-1996
Salford College of Technology and University of Salford
Winchester School of Art and University of Southampton
Charlotte Mason and St Martin’s College
The British Postgraduate Medical Federation incorporated into: Imperial College of
Science, Technology and Medicine, King’s College London, University College London and
London University – Senate institutes
1996-1997
Institute of Psychiatry and King’s College London
Royal Postgraduate Medical School and Imperial College of Science,
Technology and Medicine
Charing Cross and Westminster Medical
School
and Imperial College of Science,
Technology and Medicine
La Sainte Union College and University of Southampton
Coleg Normal and University College of North Wales,
Bangor 1998-1999
Loughborough College of Art and Design
and
Loughborough University
United Medical and Dental School (UMDS) and King’s College London
Royal Free Hospital School of Medicine and University College London
Westhill College and University of Birmingham
Moray House Institute of Education and University of Edinburgh
The Scottish College of Textiles and Heriot-Watt University
1999-2000
21
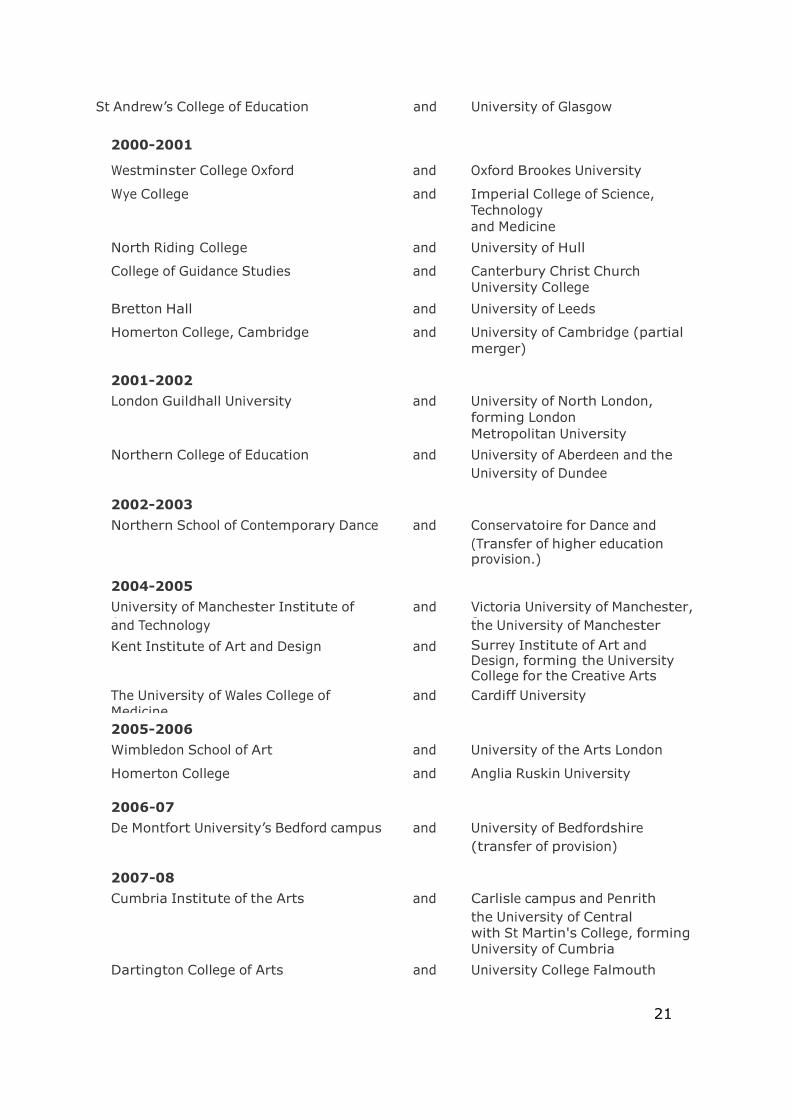
St Andrew’s College of Education and University of Glasgow
2000-2001
Westminster College Oxford and Oxford Brookes University
Wye College and Imperial College of Science,
Technology
and Medicine
North Riding College and University of Hull
College of Guidance Studies and Canterbury Christ Church
University College
Bretton Hall and University of Leeds
Homerton College, Cambridge and University of Cambridge (partial
merger)
2001-2002
London Guildhall University and University of North London,
forming London
Metropolitan University
Northern College of Education and University of Aberdeen and the
University of Dundee
2002-2003
Northern School of Contemporary Dance and Conservatoire for Dance and
Drama (Transfer of higher education provision.)
2004-2005
University of Manchester Institute of
Science
and Victoria University of Manchester,
forming and Technology the University of Manchester
Kent Institute of Art and Design and Surrey Institute of Art and Design, forming the University College for the Creative Arts
The University of Wales College of
Medicine
and Cardiff University
2005-2006
Wimbledon School of Art and University of the Arts London
Homerton College and Anglia Ruskin University
2006-07
De Montfort University’s Bedford campus and University of Bedfordshire
(transfer of provision)
2007-08
Cumbria Institute of the Arts and Carlisle campus and Penrith
campus of the University of Central Lancashire merged with St Martin's College, forming the University of Cumbria
Dartington College of Arts and University College Falmouth

22
The Royal College of Nursing transferred
provision
to The Open University
Royal Welsh College of Music and Drama
and
University of Glamorgan
Bell College
and
University of Paisley, forming the
University of the West of Scotland.
23
Appendix 2 - New institutions counted within the higher education
sector
Year Institution Reason
1995-96 Northern School of Contemporary Dance Transfer from FE to HE
Norwich School of Art and Design Transfer from FE to HE
1997-98 Cumbria College of Art and Design Transfer from FE to HE
1999-
2000
Stranmillis University College de-merger
St. Mary’s University College de-merger
2000-
2001
Institute of Cancer Research de-merger
2001-02 Royal Agricultural College Transfer from private sector
UHI Millennium Institute Transfer from FE to HE
The Arts Institute at Bournemouth Transfer from FE to HE
Bell College Transfer from FE to HE
Conservatoire for Dance and Drama Transfer from FE to HE
2002-03 Birmingham College of Food, Tourism and
Creative Studies
Transfer from FE to HE
Courtauld Institute of Art de-merger
2004-05 University of Buckingham Incorporated in HESA data for
the first time
2005-06 Leeds College of Music Transfer from FE to HE
2006-07 Guildhall School of Music and Drama Transfer from FE to HE
Liverpool Institute for Performing Arts de-merger
2007-08 University Campus Suffolk de-merger

Appendix 3 – Change over time in the number of institutions teaching individual subjects.
Subject, 1996-97
Number of
institutions
teaching,
1996-97
Subject,
2009-10
Number of
institutions
teaching,
2009-10
Increase-
decrease %
(A1) PRE-CLINICAL MEDICINE 28
Pre-clinical
medicine 30 7%
(A2) PRE-CLINICAL DENTISTRY 14
Pre-clinical
dentistry 11 -21%
(A3) CLINICAL MEDICINE 33
Clinical
medicine 42 27%
(A4) CLINICAL DENTISTRY 15
Clinical
dentistry 19 27%
(B1) ANATOMY AND PHYSIOLOGY 40
Anatomy,
physiology &
pathology 72 80%
(B4) NUTRITION 18 Nutrition 43 139%
(B5) OPHTHALMICS 9 Ophthalmics 11 22%
(B6) AUDIOLOGY 10
Aural & oral
sciences 25 150%
(B7) NURSING 87 Nursing 85 -2%
(B8) MEDICAL TECHNOLOGY 29
Medical
technology 43 48%
(B9) OTHER MEDICAL SUBJECTS 100
Others in
subjects
allied to
medicine 115 15%
(C1) BIOLOGY 96 Biology 97 1%
(C2) BOTANY 22 Botany 11 -50%
(C3) ZOOLOGY 32 Zoology 39 22%
(C4) GENETICS 26 Genetics 31 19%
(C5) MICROBIOLOGY 35 Microbiology 44 26%
(D2) AGRICULTURE 38 Agriculture 46 21%
(D3) FORESTRY 7 Forestry 11 57%

25
Subject, 1996-97
Number of
institutions
teaching,
1996-97
Subject,
2009-10
Number of
institutions
teaching,
2009-10
Increase-
decrease %
(D4) FOOD SCIENCE 30
Food &
beverage
studies 34 13%
(D8) AGRICULTURAL SCIENCES 7
Agricultural
sciences 2 -71%
(F1) CHEMISTRY 83 Chemistry 66 -20%
(F2) MATERIALS SCIENCE 10
Materials
science 6 -40%
(F3) PHYSICS 69 Physics 47 -32%
(F5) ASTRONOMY 14 Astronomy 29 107%
(F6) GEOLOGY 47 Geology 40 -15%
(F8) GEOGRAPHY STUDIES AS A SCIENCE 61
Physical
geographical
sciences 71 16%
(G1) MATHEMATICS 94 Mathematics 87 -7%
(G4) STATISTICS 42 Statistics 39 -7%
(G5) COMPUTING SCIENCE 116
Computer
science 122 5%
(H1) GENERAL ENGINEERING 73
General
engineering 76 4%
(H2) CIVIL ENGINEERING 70
Civil
engineering 69 -1%
(H3) MECHANICAL ENGINEERING 84
Mechanical
engineering 82 -2%
(H4) AERONAUTICAL ENGINEERING 22
Aerospace
engineering 33 50%
(H7) PRODUCTION ENGINEERING 65
Production &
manufacturing
engineering 51 -22%
(H8) CHEMICAL ENGINEERING 27
Chemical,
process & 30 11%

26
Subject, 1996-97
Number of
institutions
teaching,
1996-97
Subject,
2009-10
Number of
institutions
teaching,
2009-10
Increase-
decrease %
energy
engineering
(H9) OTHER ENGINEERING 12
Others in
engineering 18 50%
(J1) MINERALS TECHNOLOGY 8
Minerals
technology 3 -63%
(J2) METALLURGY 11 Metallurgy 8 -27%
(J3) CERAMICS AND GLASSES 7
Ceramics
& glasses 4 -43%
(J4) POLYMERS AND TEXTILES 21
Polymers
& textiles 11 -48%
(J6) MARITIME TECHNOLOGY 11
Maritime
technology 5 -55%
(J8) BIOTECHNOLOGY 18 Biotechnology 22 22%
(K1) ARCHITECTURE 41 Architecture 67 63%
(K2) BUILDING 56 Building 61 9%
(K4) TOWN AND COUNTRY PLANNING 43
Planning
(urban, rural
& regional) 46 7%
(L1) ECONOMICS 85 Economics 83 -2%
(L3) SOCIOLOGY 99 Sociology 102 3%
(L4) SOCIAL POLICY AND ADMINISTRATION 62 Social policy 70 13%
(L5) SOCIAL WORK 109 Social work 107 -2%
(L6) ANTHROPOLOGY 31 Anthropology 24 -23%
(M1) POLITICS 80 Politics 95 19%
(M3) LAW 89 Law total 105 18%
(N1) BUSINESS AND MANAGEMENT STUDIES 122
Business
studies 122 0%
(N3) FINANCIAL MANAGEMENT 52 Finance 95 83%
(N4) ACCOUNTANCY 74 Accounting 102 38%

27
Subject, 1996-97
Number of
institutions
teaching,
1996-97
Subject,
2009-10
Number of
institutions
teaching,
2009-10
Increase-
decrease %
(N5) MARKETING AND MARKET RESEARCH 59 Marketing 100 69%
(P4) MEDIA STUDIES 37 Media studies 111 200%
(P5) PUBLISHING 5 Publishing 17 240%
(P6) JOURNALISM 16 Journalism 68 325%
(Q1) LINGUISTICS 40 Linguistics 51 28%
(Q2) COMPARATIVE LITERATURE 32
Comparative
literary
studies 18 -44%
(Q3) ENGLISH 99
English
studies 120 21%
(Q6) LATIN LANGUAGE & LITERATURE 4
Latin
studies 6 50%
(Q7) ANCIENT GREEK LANGUAGE & LITERATURE 3
Classical
Greek
studies 4 33%
(Q8) CLASSICS 24
Classical
studies 26 8%
(R1) FRENCH LANGUAGE, LITERATURE & CULTURE 65
French
studies 71 9%
(R2) GERMAN LANGUAGE, LITERATURE & CULTURE 51
German
studies 48 -6%
(R3) ITALIAN LANGUAGE, LITERATURE & CULTURE 27
Italian
studies 28 4%
(R4) SPANISH LANGUAGE, LITERATURE & CULTURE 39
Spanish
studies 63 62%
(R5) PORTUGUESE LANGUAGE, LITERATURE & CULTURE 5
Portuguese
studies 14 180%
(R8) RUSSIAN LANGUAGES, LITERATURE & CULTURE 21
Russian
& East
European
studies 18 -14%
28
Subject, 1996-97
Number of
institutions
teaching,
1996-97
Subject,
2009-10
Number of
institutions
teaching,
2009-10
Increase-
decrease %
(T3) CHINESE LANGUAGES, LITERATURE & CULTURE 10
Chinese
studies 17 70%
(T4) JAPANESE LANGUAGES, LITERATURE & CULTURE 16
Japanese
studies 16 0%
(T6) MODERN MIDDLE-EASTERN LANGUAGES, LITERATURE &
CULTURE 14
Modern
Middle
Eastern
studies 14 0%
(T7) AFRICAN LANGUAGES, LITERATURE & CULTURE 2
African
studies 3 50%
(V6) ARCHAEOLOGY 31 Archaeology 35 13%
(V7) PHILOSOPHY 55 Philosophy 60 9%
(V8) THEOLOGY AND RELIGIOUS STUDIES 60
Theology
& religious
studies 54 -10%
(W1) FINE ART 70 Fine art 84 20%
(W2) DESIGN STUDIES 75
Design
studies 94 25%
(W3) MUSIC 71 Music 96 35%
(W4) DRAMA 70 Drama 102 46%
(W5) CINEMATICS 37
Cinematics
&
photography 85 130%
(W6) CRAFTS 4 Crafts 17 325%